
Abstract
Objectives
To provide a concept of measuring pressure changes under constant fluid infusion for the diagnosis of sialolithiasis, termed the sialodynamic test, in a porcine head model.
Methods
Using a porcine head model, a constant infusion of water into the submandibular gland of the two groups over 30 s was performed and the outlet pressure was measured. Metal beads were inserted into the salivary duct for obstruction simulation after the normal submandibular gland sialodynamic measurements were completed. Statistical analyses were performed to evaluate the differences between the measured individuals and the experimental group (n = 3).
Results
The results showed no significant difference between individuals in the control group, but intergroup variation was noted in the simulated sialolithiasis group. The volume-dependent linear increase in pressure was exacerbated in the simulated sialolithiasis group compared with the control.
Conclusion
This study indicated that evaluating the relationship between pressure and volume changes can help to determine whether stones are present in the submandibular gland. The sialodynamic test might serve as a potential diagnostic method for salivary diseases.
Introduction
Various methods can be used in the evaluation of the salivary glands. Structurally, the salivary glands are often evaluated with computed tomography, magnetic resonance imaging and ultrasound, in search of diseases such as neoplasms or stones.1–3 Functionally, they are evaluated with the saliva flow rate test, sialoscintigraphy; and sometimes in combination with ultrasound and blood tests.4–7 Typically, a sialendoscopy practitioner reports an endoscopic finding in the gland ductal wall to be ‘sclerotic’, ‘with white wall appearance’, ‘with lack of vascularity’ or ‘with confined/diffused stenosis’ in cases such as chronic sialadenitis, Sjogren Syndrome or in juvenile recurrent parotitis.8–11 Nevertheless, these designations remain descriptive and are fairly subjective.
As subjective measurements are relatively inconsistent, objective measurements with instruments are often required to achieve a more definite diagnosis. Similarly, in urology, it is also common to use descriptive findings under the cystoscope in the diagnosis of various urological diseases. It is not surprising that researchers have already studied the correlation between the above subjective results and more objective measurements, such as urodynamic tests. 12 What about the salivary gland? Is it possible to develop a similar test to more consistently define ‘physical’ or ‘dynamic’ properties?
During a standard sialendoscopy, constant saline irrigation under endoscopy is required during the procedure. While this irrigation is a common component of this procedure, similarities exist between this process and urodynamic testing procedures.
This study aimed to evaluate the feasibility of establishing a sialodynamic test by measuring the change in pressure during constant saline irrigation under the established porcine head model.
Materials and methods
Preparation of the porcine model
The porcine model (L-Y-D pig [hybrid of foreign Landrace, Yorkshire and Duroc pigs], Taiwan) was selected based on the anatomical, developmental, physiological and pathophysiological similarities between the oral-maxillofacial region of pigs and humans. 13 Fresh porcine heads (n = 3) were obtained from a local supplier and prepared as previously described. 14 After removing the upper jaw and buccal mucosa, the tongue was retracted with full exposure of Stensen's and Wharton's duct opening papilla. During pig slaughtering, the parotid gland tail is often partially damaged and thus not suitable for further testing. Therefore, this study used only the submandibular glands for sialodynamic testing.
Preparation of the submandibular gland
All evaluation procedures were performed using the Miniature Straight Forward Telescope with a direct view at 0° (Model 11573A; Karl Storz, Tuttlingen, Germany). After the papilla was identified and dilated, a 16G intravenous catheter was inserted into the duct. A sialendoscope was inserted through the catheter to confirm that the catheter was placed in the salivary duct lumen and that the duct was intact without any obvious lesion or abnormality. Then, a clamp was used to secure the catheter location without disrupting the patency and to prevent fluid leakage from the ductal opening.
Creating the obstructive submandibular gland model
Three metal beads, each with a diameter of 1 mm, were used and inserted into the salivary duct for obstruction simulation after the normal submandibular gland sialodynamic measurements were completed. The metal beads were placed into the duct followed by intravenous catheter insertion and securing as described above. A sialendoscope was then inserted through the catheter to confirm that the inserted metal beads were in the ductal lumen (Figure 1). After correct insertion of the metal beads, the sialodynamic measurements were performed again on the same gland for comparison.

Illustration of the sialodynamic testing setup used in this current study. Sialendoscopy of the ductal lumen showed obstruction in the porcine submandibular duct with metal beads. The colour version of this figure is available at: http://imr.sagepub.com.
Sialodynamic testing protocol
The sialodynamics of the salivary gland were evaluated through the time-dependent pressure changes under constant infusion to the salivary gland. The setting of the measurement is illustrated in Figure 1. After inserting the catheter, a clamp was used to secure the catheter location and the outside end of the catheter was connected to plastic tubing, with a three-way stopcock. The first set of plastic tubing was connected to a peristaltic pump (BT00-100 M; Baoding Longer Precision Pump Co. Ltd., Baoding, China), which was used to make an increasingly constant infusion of water into the gland through the catheter. At the 150-R.P.M. setting for the pump, the flow output was set continuously and identically at 7.5 ml/min. The second set of plastic tubing was connected to a manometer, which measured the pressure changes inside the system. Data were excluded when there was an apparent leak during the infusion processes. In each experimental group, measurements were repeated four times.
Statistical analyses
All statistical analyses were performed using GraphPad Prism software version 6.0 (Graphpad Software Inc., San Diego, CA, USA). Data are presented as mean ± SD. A two-way analysis of variance (ANOVA) was performed on the experimental groups to analyse for factor interaction, followed by Bonferroni's multiple comparisons test in pressure at each specific time within each group and between groups. Pearson correlation coefficient test was used to assess the relationship between measurements. Analysis of covariance in the linear regression model was performed to acquire the difference in slope of change over time. A P-value ≤0.05 was considered statistically significant.
Results
Three porcine heads that met the research criteria were prepared and divided into two experimental groups based on the same gland: the control group (no stone formation) and the simulated sialolithiasis group (stone formation mimicked). The sialodynamics of the submandibular gland were evaluated based on the intraductal change in pressure over 30 s.
The statistics of pressure data obtained in the control group are shown in Figure 2a (n = 4, P ≤ 0.05 for between-individual comparison). Individual porcine heads showed a gradual increase in pressure in the submandibular gland with infusion time, i.e. proportional to the volume of fluid injected into the gland. The pressure reached a value of approximately 25 kPa for all porcine heads at 30 s. There was no significant difference between individuals in the control group at any time-point.

Time-dependent pressure changes among independent heads in (a) the control group and (b) the simulated sialolithiasis group. The data are presented as mean ± SD (n = 4). Statistical evaluation was performed using two-way analysis of variance followed by Bonferroni's multiple comparisons test (ns, not significant, *P ≤ 0.05, **P ≤ 0.01, ***P ≤ 0.001, ****P ≤ 0.0001). The colour version of this figure is available at: http://imr.sagepub.com.
A similar statistical analysis was performed on the simulated sialolithiasis group (Figure 2b, n = 4, P ≤ 0.05 for between-individual comparison). As expected, a gradual increase in pressure over time was also observed in this group and reached values of more than 30 kPa for all porcine heads at 30 s. However, from the intergroup analysis, it was noted that individuals displayed a consistent statistically significant difference starting after 20 s of infusion and the difference gradually increased afterward.
Two-way ANOVA revealed significant effects of time (F15,60 = 450.4, P < 0.0001) and experimental groups (F1, 4 = 20.27, P = 0.0108) on accumulated pressure in the submandibular gland and a significant interaction between these two factors (F15, 60 = 12.05, P < 0.0001) (Figure 3). Furthermore, the pressure tended to be positively correlated with time throughout the infusion period (r = 0.99, P < 0.0001). Analysis of the difference between groups at each time-point revealed significantly higher pressures in the stone-mimicked formation than in the control starting from 10 s (P ≤ 0.05), which gradually increased in variation with decreasing P-value over time. The linear regression analysis revealed that the overall slopes were identical, with over 98% output variable (pressure) explained by the input variables (experimental groups and time of measurement). The differences between slopes were extremely significant (P < 0.0001), suggesting that the time-related linear increase in pressure was exacerbated in the simulated sialolithiasis group.

Sialodynamics of the submandibular glands in the control group and simulated sialolithiasis group based on the intraductal change in pressure. The data are presented as mean ± SD (n = 3). Statistical evaluation was performed using two-way analysis of variance followed by Bonferroni's multiple comparisons test (ns, not significant, *P ≤ 0.05, **P ≤ 0.01, ***P ≤ 0.001, ****P ≤ 0.0001). The colour version of this figure is available at: http://imr.sagepub.com. The difference in slope was determined by analysis of covariance.
Discussion
This current study demonstrated that it is possible to detect an obstructive condition of the salivary gland using the sialodynamic test. The results showed that the pressure–time curve of the obstructed ductal system significantly differed from that of the non-obstructed system, which is most important, but also that the data were consistency good among the different tested porcine heads. Additionally, the high regression coefficient of the curve revealed from the 30 s time-point of the test suggested that during this phase, the elastic properties of the salivary gland ductal system remained in linear form, which implies its potential clinical value as the test is expected to be repeatable and consistent, without the need for individual calibration. This newly suggested method can be used as a potential approach in testing salivary function.
Salivary gland diseases, in which sialolithiasis is one of the major causes of sialadenitis, are increasingly common and account for approximately 50% of major salivary gland diseases.15,16 Traditional diagnostic methods for sialolithiasis can be applied to visualize the stone directly or indirectly through ductal dilatation before the site of obstruction. 17 However, they would not be ideal for detecting small, noncalcified intraductal stones and unable to distinguish salivary stones from other types of calcifications around the submandibular glands, such as calcified lymph nodes or phleboliths. Additionally, if the radiological slice is too thick, the stone can be easily occulted (radiographically opaque).16,17 Acute viral or bacterial infections caused by stones can lead to gland swelling with a hypoechoic texture. 18 In recent times, sialendoscopy has been incorporated to further improve the diagnosis of sialolithiasis through surgically invasive imaging of the intraductal stones. 19 This technique is performed under local anaesthesia combined with continuous irrigation to keep the salivary duct wide open for easy insertion of the sialendoscope. The sialendoscopy procedure requires highly skilled physicians and is time-consuming; consequently, it would be appropriate to develop a new diagnostic method, such as a sialodynamic test, that could minimize the operating conditions.
The sialodynamic test was first designed in this current study for the diagnosis of sialolithiasis, which was inspired by the concept of cystometry test in urodynamic studies. The urodynamic study is a daily clinical practice at urological facilities that comprises parts from two tests: cystometry and a pressure-flow test. 20 Similar to the procedure of cystometry, which includes gradually filling with saline solution and simultaneously measuring the intravesical pressure, 21 the sialodynamic test also utilizes the method of constant infusion of fluid to assess the intraglandular pressure and to further investigate any difference in the real-time pressure change in the simulated sialolithiasis model. Regarding the urodynamic test, the urinary bladder is a highly elastic organ 22 where, under normal conditions, the intravesical pressure remains low during the initial filling phase to accommodate urine at a low-pressure level. 23 In contrast, the submandibular intraglandular pressure increased soon upon initial filling and demonstrated a linear increment with subsequent fluid infusion within 30 s in this current study, suggesting that the pressure generated by the constant flow might reflect different pathophysiologies. While various intrinsic and extrinsic factors may affect the pressure inside the urinary bladder,23,24 the rise in submandibular intraglandular pressure is assumed to be mainly derived from outlet obstruction. The linearity of the pressure–volume curve in sialodynamic studies may be of diagnostic value in cases clinically suspicious of obstructive sialadenitis without physical or imaging evidence. Furthermore, it is also possible that, although not tested in this current study, in cases with interstitial glandular diseases, characteristic pressure–time curves under different settings other than constant flow, such as fixed volume infusion, might also be measured and may be of diagnostic value.
Over 30 s of continuous fluid accumulation in the glands, these current results suggest a volume-dependent linear increase in measured pressure in both healthy and simulated sialolithiasis groups, in which the presence of stones in the gland caused an elevated overall pressure trendline. More specifically, the simulated sialolithiasis group showed significantly higher pressure compared with the group with normal glands, which became noticeable after 10 s and continuously increased in variation with infusion time. This can be understood through Poiseuille's law: F =
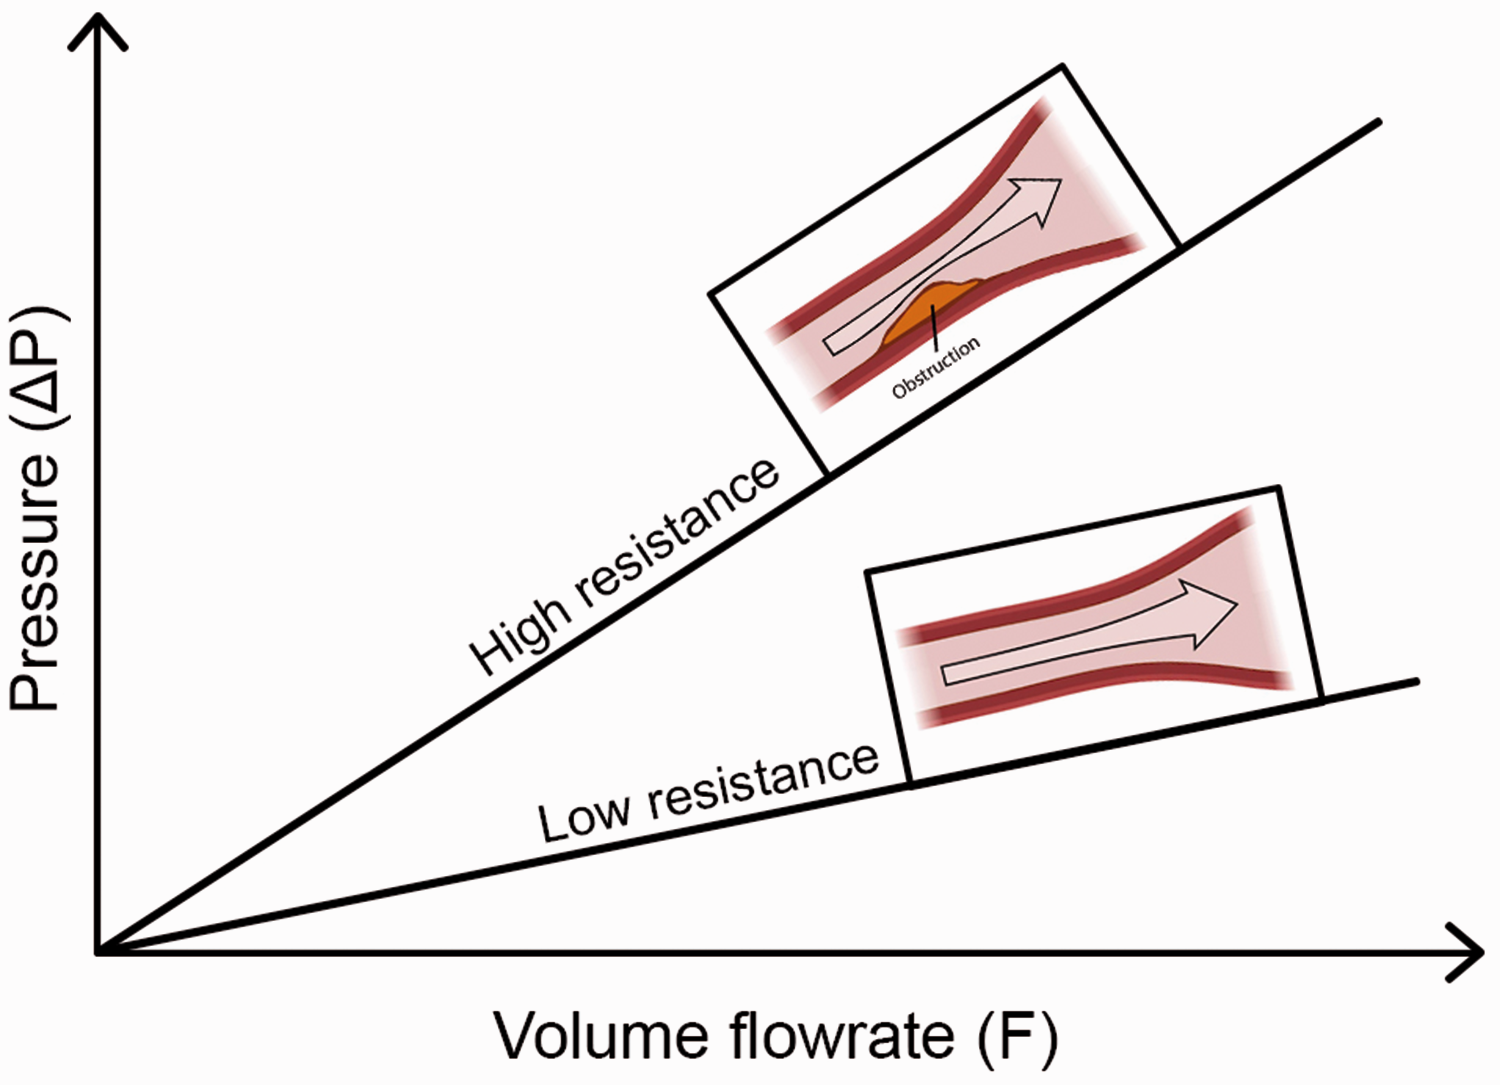
Illustration of the correlation between volume and pressure. In the control group, the pressure corresponds to the normal volume of the submandibular gland. However, in the simulated sialolithiasis group, the resistance to flow was increased due to the presence of stones in the submandibular gland duct (obstruction), causing the measured pressure at the outlet to be higher than that in the control group at the same time point of measurement. The colour version of this figure is available at: http://imr.sagepub.com.
The relationship between pressure and volume has long been studied, mostly for detecting gallstone formation.25–27 In this current study, the same physical theory was applied to detect salivary gland obstruction, termed the ‘sialodynamic test’. Pressure changes inside the gallbladder and its compliance have been reported to be discriminatory in the case of disease. Furthermore, this relationship is usually considered linear, 28 which is consistent with these current results. Special attention should be paid to the following: (i) consistency; and (ii) linear elastic properties as demonstrated in this current study. Good consistency between test individuals is crucial for a proposed diagnostic method to be clinically applicable. In this current study, there was no significant difference between individual heads in the control group, showing that it is possible to obtain a normal reference value for the baseline healthy subjects for comparison of different degrees of obstructive glandular diseases. The intergroup variation was expected in the simulated sialolithiasis group, as this study did not aim to create a consistent degree of ductal obstructions. As shown through the high regression coefficient of the pressure–time curve, the linear elastic properties are even more important if this test is going to be applied clinically in the future. This test curve must be simple and, if possible, kept in linear form. Under these linear characteristics, the curves of the diseased and reference glands will have little chance to intersect each other. This means that at any point during this testing phase, the value measured in the diseased gland will always be higher than that of the healthy reference gland, providing more flexibility in future use as clinicians can measure the whole curve for comparison or simply measure and compare the pressure at a given time-point. The linear feature revealed in this current study also implies that the salivary gland duct has limited expandability between the papilla and the obstructed site (in this current study, the first ductal bifurcation site). While the clinical significance of this property remains unknown, it can be speculated that the pressure–time curve measured through this current protocol mainly reflects the glandular pathology beyond the first ductal bifurcation, which is important if this sialodynamic test is to be applied to interstitial glandular diseases in the future.
This current study had several limitations. First, the relatively limited number of research subjects in this study. Secondly, the study was not performed on living subjects or human models. Further studies are needed, as this sialodynamic study only provided information about the feasibility of applying the pressure–volume relationship in the diagnosis of sialolithiasis. Based on these preliminary data, we recommend combining pressure recording in patients with indications for sialendoscopy before and after salivary stone removal. Incorporating an additional sialodynamic metering option from infusion through the irrigation port of the sialendoscope may offer physiological models for sialolithiasis.
In conclusion, this current study demonstrated that analysing the correlation in pressure–volume changes, referred to as the sialodynamic test, can help distinguish whether stones are present in the submandibular gland. Applying this technique in the diagnosis of salivary diseases could improve diagnostic accuracy as well as save time and costs.