
Abstract
Objective
To investigative whether the odds tumor enhancement ratio (OTER) on cross-sectional imaging is a prognostic factor for hepatocellular carcinoma after transarterial chemoembolization (TACE).
Methods
This study involved 126 patients who underwent TACE from May 2015 to March 2019. The signal intensity/Hounsfield units (HU) was measured by placing regions of interest on the tumor and surrounding liver in unenhanced and arterial-phase contrast-enhanced cross-sectional images. The OTER was calculated as follows: OTER = (HUTUMORart − HUTUMORun)/ (HULIVERart − HULIVERun). Univariate analysis was performed to determine the factors associated with overall survival (OS). Variables with a P value of <0.10 were included in the multivariate Cox regression analysis.
Results
The median OS was 757 days. Tumors with a peripheral location, small size, and low OTER had better OS than those with a central location, large size, and high OTER. OS did not differ according to the extent of tumor involvement or tumor enhancement pattern. The OTER, tumor location, and size were included in the multivariate Cox regression analysis. A low OTER was the predictor of better OS.
Conclusion
A high OTER is a risk factor for poor OS in patients undergoing TACE. This should be taken into consideration before the procedure.
Keywords
Introduction
Patients with hepatocellular carcinoma (HCC) are often diagnosed at an intermediate or advanced stage, and curative treatments in such patients are usually of limited use.1–3 Transarterial chemoembolization (TACE) has been recommended as a standard therapy for patients with HCC who are not eligible for curative treatment.4–6 Various factors, including the tumor size, tumor location, and tumor imaging characteristics, may influence the treatment efficacy of TACE. Among these factors, the tumor enhancement ratio (TER) is a widely studied factor that has been described in several previous reports.7,8 Interestingly, the definition of tumor enhancement in these studies was based on the current major guidelines; that is, tumor enhancement was defined as a signal intensity (SI)/Hounsfield units (HU) of the tumor greater than that of the surrounding liver in the arterial phase.9,10 However, the importance of unenhanced images was not addressed in these studies. Because tumor vascularity is assessed not only by the adjacent liver but also by the tumor itself, the present study was performed to investigate the relationship between overall survival (OS) and the odds TER (OTER) using both unenhanced and arterial-phase images.
Materials and methods
The reporting of this study conforms to the STROBE statement. 11 This retrospective study was approved by the Institutional Ethics Committee of the Guizhou Medical University Affiliated Cancer Hospital (approval number: S202114) and was performed in accordance with the Declaration of Helsinki. The requirement for written informed consent for participation and publication was waived by the Institutional Ethics Committee because of the retrospective nature of the present study.
Study population
The medical records of 343 patients with HCC who underwent initial conventional TACE (cTACE) from May 2015 to March 2019 were retrospectively reviewed. The present study included patients who had preserved liver function (Child–Pugh class A or B), an Eastern Cooperative Oncology Group performance status of 0, and at least one target lesion on cross-sectional imaging for measurement. The present study excluded patients who had a portal venous tumor thrombus (n = 101), were lost to follow-up (n = 36), had received locoregional therapy such as ablation prior to cTACE (n = 34), had undergone no contrast-enhanced cross-sectional imaging within 1 month before cTACE (n = 27), had infiltrative HCC (n = 13), and had distant metastasis (n = 6). Finally, the current study population comprised 126 patients. The following baseline demographic data were collected: age, sex, etiology of cirrhosis, Child–Pugh class, and Barcelona Clinic Liver Cancer (BCLC) stage.
Imaging acquisition
Computed tomography (CT) examinations were performed on a single machine (Aquilion ONE; Toshiba Corporation, Tokyo, Japan). The scanning parameters were as follows: 110 kV (peak), rotation time of 0.25 s (pitch 1.2), reconstruction with slice thickness of 1.00 mm, and single breath-hold helical acquisition time of 3 to 4 s depending on the liver size. All CT examinations were conducted with a dynamic four-phase protocol: unenhanced phase and contrast-enhanced arterial phase (20–30 s after injection of contrast agent), portal venous phase (70–90 s), and delayed phase (180 s). Contrast agent (Iopromide 370; Bayer Schering Pharma AG, Berlin, Germany) was injected at a dose of 1.2 mL/kg and rate of 3.5 to 4.0 mL/s by a bolus-triggered technique using an automatic power injector.
Magnetic resonance (MR) imaging was performed on either of two 3-Tesla systems (Magnetom Skyra; Siemens Healthineers, Erlangen, Germany or Vantage Atlas; Toshiba Corporation) with a combination of body and spine array coil elements (18-channel body matrix coil, 24-channel spine matrix coil). A T1-weighted sequence with fat suppression was acquired using the following protocols: 64 slices, 3-mm section thickness, reconstructed voxel size of 1.3 × 1.3 × 3.0 mm, measured voxel size of 1.7 × 1.3 × 4.5 mm, repetition time of 5.67 ms, echo time of 1.43 ms, and field of view of 268 × 330 mm. All MR examinations were conducted with a dynamic four-phase protocol: unenhanced phase and contrast-enhanced arterial phase (20–30 s after injection of contrast agent), portal venous phase (70–90 s), and delayed phase (180 s). Contrast agent (Gd-DTPA; Bayer Schering Pharma AG) was injected at a dose of 0.1 mmol/kg and rate of 2 mL/s by the bolus-triggered technique using an automatic power injector.
TACE procedure and follow-up
A 5-French sheath was routinely placed into the femoral artery using the Seldinger technique under ultrasound guidance. A 4-French catheter was used to perform right or left hepatic artery angiography for assessment of the tumor vascularization. Contrast agent was injected through the 4-French catheter at a rate of 2 to 3 mL/s to a total volume of 6 to 9 mL. A 2.7-French coaxial microcatheter (Progreat; Terumo Corporation, Tokyo, Japan) was used to catheterize the main tumor feeding arteries, and chemoembolization was performed as superselectively as possible. Up to 15 mL of oil–doxorubicin emulsion was injected through the microcatheter, and gelfoam slurry was used to embolize the proximal tumor feeders following injection of the oil–doxorubicin emulsion. The oil–doxorubicin emulsion was created using the water-in-oil technique by mixing iodized oil (Lipiodol; Guerbet Asia Pacific Ltd., Kowloon, Hong Kong) with a distilled water solution containing a drug cocktail of dissolved doxorubicin at a ratio of 3:1. The doxorubicin dose used varied from 50 to 120 mg. The technical endpoint of TACE was defined as reduction of arterial inflow to the tumor and tumor devascularization. All TACE procedures achieved technical success according to the Society of Interventional Radiology guidelines. 12
Follow-up was performed by telephone interviews or outpatient/inpatient clinic visits with a mean follow-up time of 623 ± 437 days. Follow-up imaging was performed 1 to 2 months after the first TACE session and then at approximately 2-month intervals. Repeat TACE was performed when a viable tumor was present on follow-up images.
Imaging analysis
Two radiologists who had 10 and 13 years of experience in abdominal imaging and were not involved in treatment independently reviewed the CT and MR images.
The SI/HU of the tumor and surrounding liver was measured by placement of the region of interest. The region of interest was circular in shape (area of approximately 100–200 mm2) and excluded visible vasculature, bile ducts, and artifacts. The SI/HU of the tumor was measured at the highest and largest enhancing portion in the arterial phase and corresponding portion of the unenhanced phase, and the SI/HU of the surrounding liver was measured at three hepatic lobes (left, right, and caudate) in both the arterial and unenhanced phases and was averaged (Figure 1). During measurement, the window and width level in each patient were kept consistent between the two reviewers. The OTER was calculated by the following formula:
13


Measurement of signal intensity/Hounsfield units (SI/HU) on (a) unenhanced imaging and (b) arterial-phase imaging. The region of interest was circular in shape (area of approximately 100–200 mm2) and excluded visible vasculature, bile ducts, and artifacts. The SI/HU of the tumor was measured at the highest and largest enhancing portion in the arterial phase and corresponding portion of the unenhanced phase. The SI/HU of the surrounding liver was measured at three hepatic lobes (left, right, and caudate) in both the arterial phase and unenhanced phase and averaged.
HUTUMORart and HUTUMORun represented the HU of the tumor in the arterial phase and unenhanced phase, respectively. HULIVERart and HULIVERun represented the HU of the surrounding liver in the arterial phase and unenhanced phase, respectively. The same formula was used for calculation of the OTER on MR images by measuring the SI. The following tumor characteristics on baseline CT/MR images were also collected: tumor diameter, tumor location (peripheral/central), extent of tumor involvement (single/multiple segment), and tumor enhancement pattern (homogeneous/heterogeneous). Tumors mainly located in segment one or four were defined as centrally located; otherwise, they were defined as peripherally located. 14 A heterogeneous tumor enhancement pattern was defined as the presence of a nonenhanced area in the arterial phase, whereas a homogeneous enhancement pattern was defined as the lack of a nonenhanced area. 15 The average of the diameters and SI/HU measured by the two radiologists was used for analysis.
Assessment of OS
The primary clinical outcome was OS, defined as the interval between the first TACE and death or last follow-up.
Statistical analysis
Continuous variables are presented as mean and standard deviation, median with interquartile range, or frequency. Categorical variables are presented as number and percentage. To analyze the inter-reader agreement of CT/MR imaging between the two radiologists, either the intraclass correlation coefficient (ICC) (for numerical data) was calculated or the Kappa test (for categorical data) was performed. Agreement was classified as poor (ICC or Kappa value of 0.00–0.40), fair to good (ICC or Kappa value of 0.40–0.75), or excellent (ICC or Kappa value of >0.75). Consensus regarding the imaging characteristics was reached by discussion between the two radiologists.
Multivariate Cox regression analysis was performed to evaluate the potential predictors of OS. Variables with a P value of <0.10 in either the univariate Cox analysis (numerical data) or log-rank test (categorical data) were included in the multivariate Cox regression model. All statistical analyses were performed with commercially available software (IBM SPSS Statistics for Windows, Version 25.0; IBM Corp., Armonk, NY, USA), and a P-value of <0.05 was considered statistically significant.
Results
Patient characteristics
Table 1 summarizes the baseline clinical and imaging characteristics of the entire study population. The current study included 117 men and 9 women with a mean age of 55.4 ± 11.2 years, ranging from 28 to 83 years. Chronic hepatitis B infection was present in 101 patients, chronic hepatitis C infection in 7, and alcoholic hepatitis in 2. The diagnosis of HCC was based on either pathology (biopsy, n = 14) or typical imaging features (American Association for the Study of Liver practice guidelines, n = 112). Early-stage HCC (BCLC-A) was present in 75 patients and intermediate-stage HCC (BCLC-B) in 51.
Demographics and clinical findings of the entire study population.
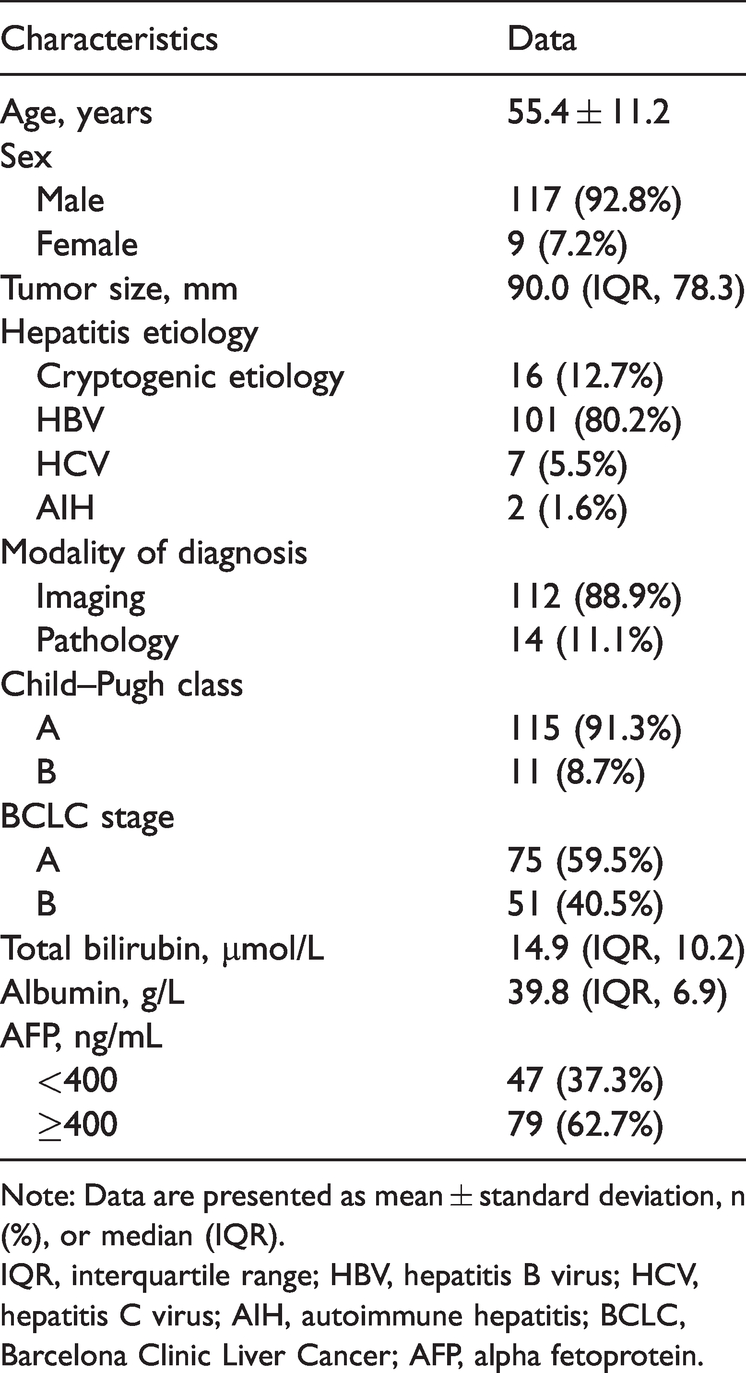
Note: Data are presented as mean ± standard deviation, n (%), or median (IQR).
IQR, interquartile range; HBV, hepatitis B virus; HCV, hepatitis C virus; AIH, autoimmune hepatitis; BCLC, Barcelona Clinic Liver Cancer; AFP, alpha fetoprotein.
Inter-reader agreement
There was excellent reproducibility in the review of CT/MR imaging characteristics between the two radiologists: diameter measurement, ICC of 0.916; HUTUMORart, ICC of 0.811; HUTUMORun, ICC of 0.796; HULIVERart, ICC of 0.825; HULIVERun, ICC of 0.838; tumor location, Kappa of 0.817; extent of tumor involvement, Kappa of 0.894; and tumor enhancement pattern, Kappa of 0.947.
Imaging characteristics
The median tumor diameter before TACE was 90.0 mm (interquartile range, 78.3 mm). The largest target lesion in each patient was at a peripheral location in 52 (41.3%) patients and at a central location in 74 (58.7%). Thirty-two (25.4%) lesions involved a single segment and 94 (74.6%) involved multiple segments. Forty-four (34.9%) lesions showed a homogeneous enhancement pattern and 82 (65.1%) showed a heterogeneous enhancement pattern.
Cutoff of OTER for determination of prognosis
The mean OTER in the entire study population was 7.53 ± 6.17. A receiver operating characteristics curve was created to determine the cutoff of the OTER. Based on the Youden index, the cutoff of the OTER for determination of the prognosis was 6.47. Therefore, an OTER of >6.47 was defined as a high OTER, and an OTER of ≤6.47 was defined as a low OTER.
Potential predictive factors of OS
The median OS was 757 days, and the survival curve is shown in Figure 2. Tumors with a peripheral location (P = 0.002), small size (P = 0.004), and low OTER (P = 0.004) were associated with better OS than those with a central location, large size, and high OTER. The OS did not differ according to the extent of tumor involvement or tumor enhancement pattern. The OTER, tumor location, and size were included in the multivariate Cox regression analysis. The results showed that a low OTER (P = 0.047, hazard ratio = 1.401, 95% confidence interval = 1.004–1.955) was the predictor of better OS. The detailed data are shown in Table 2.
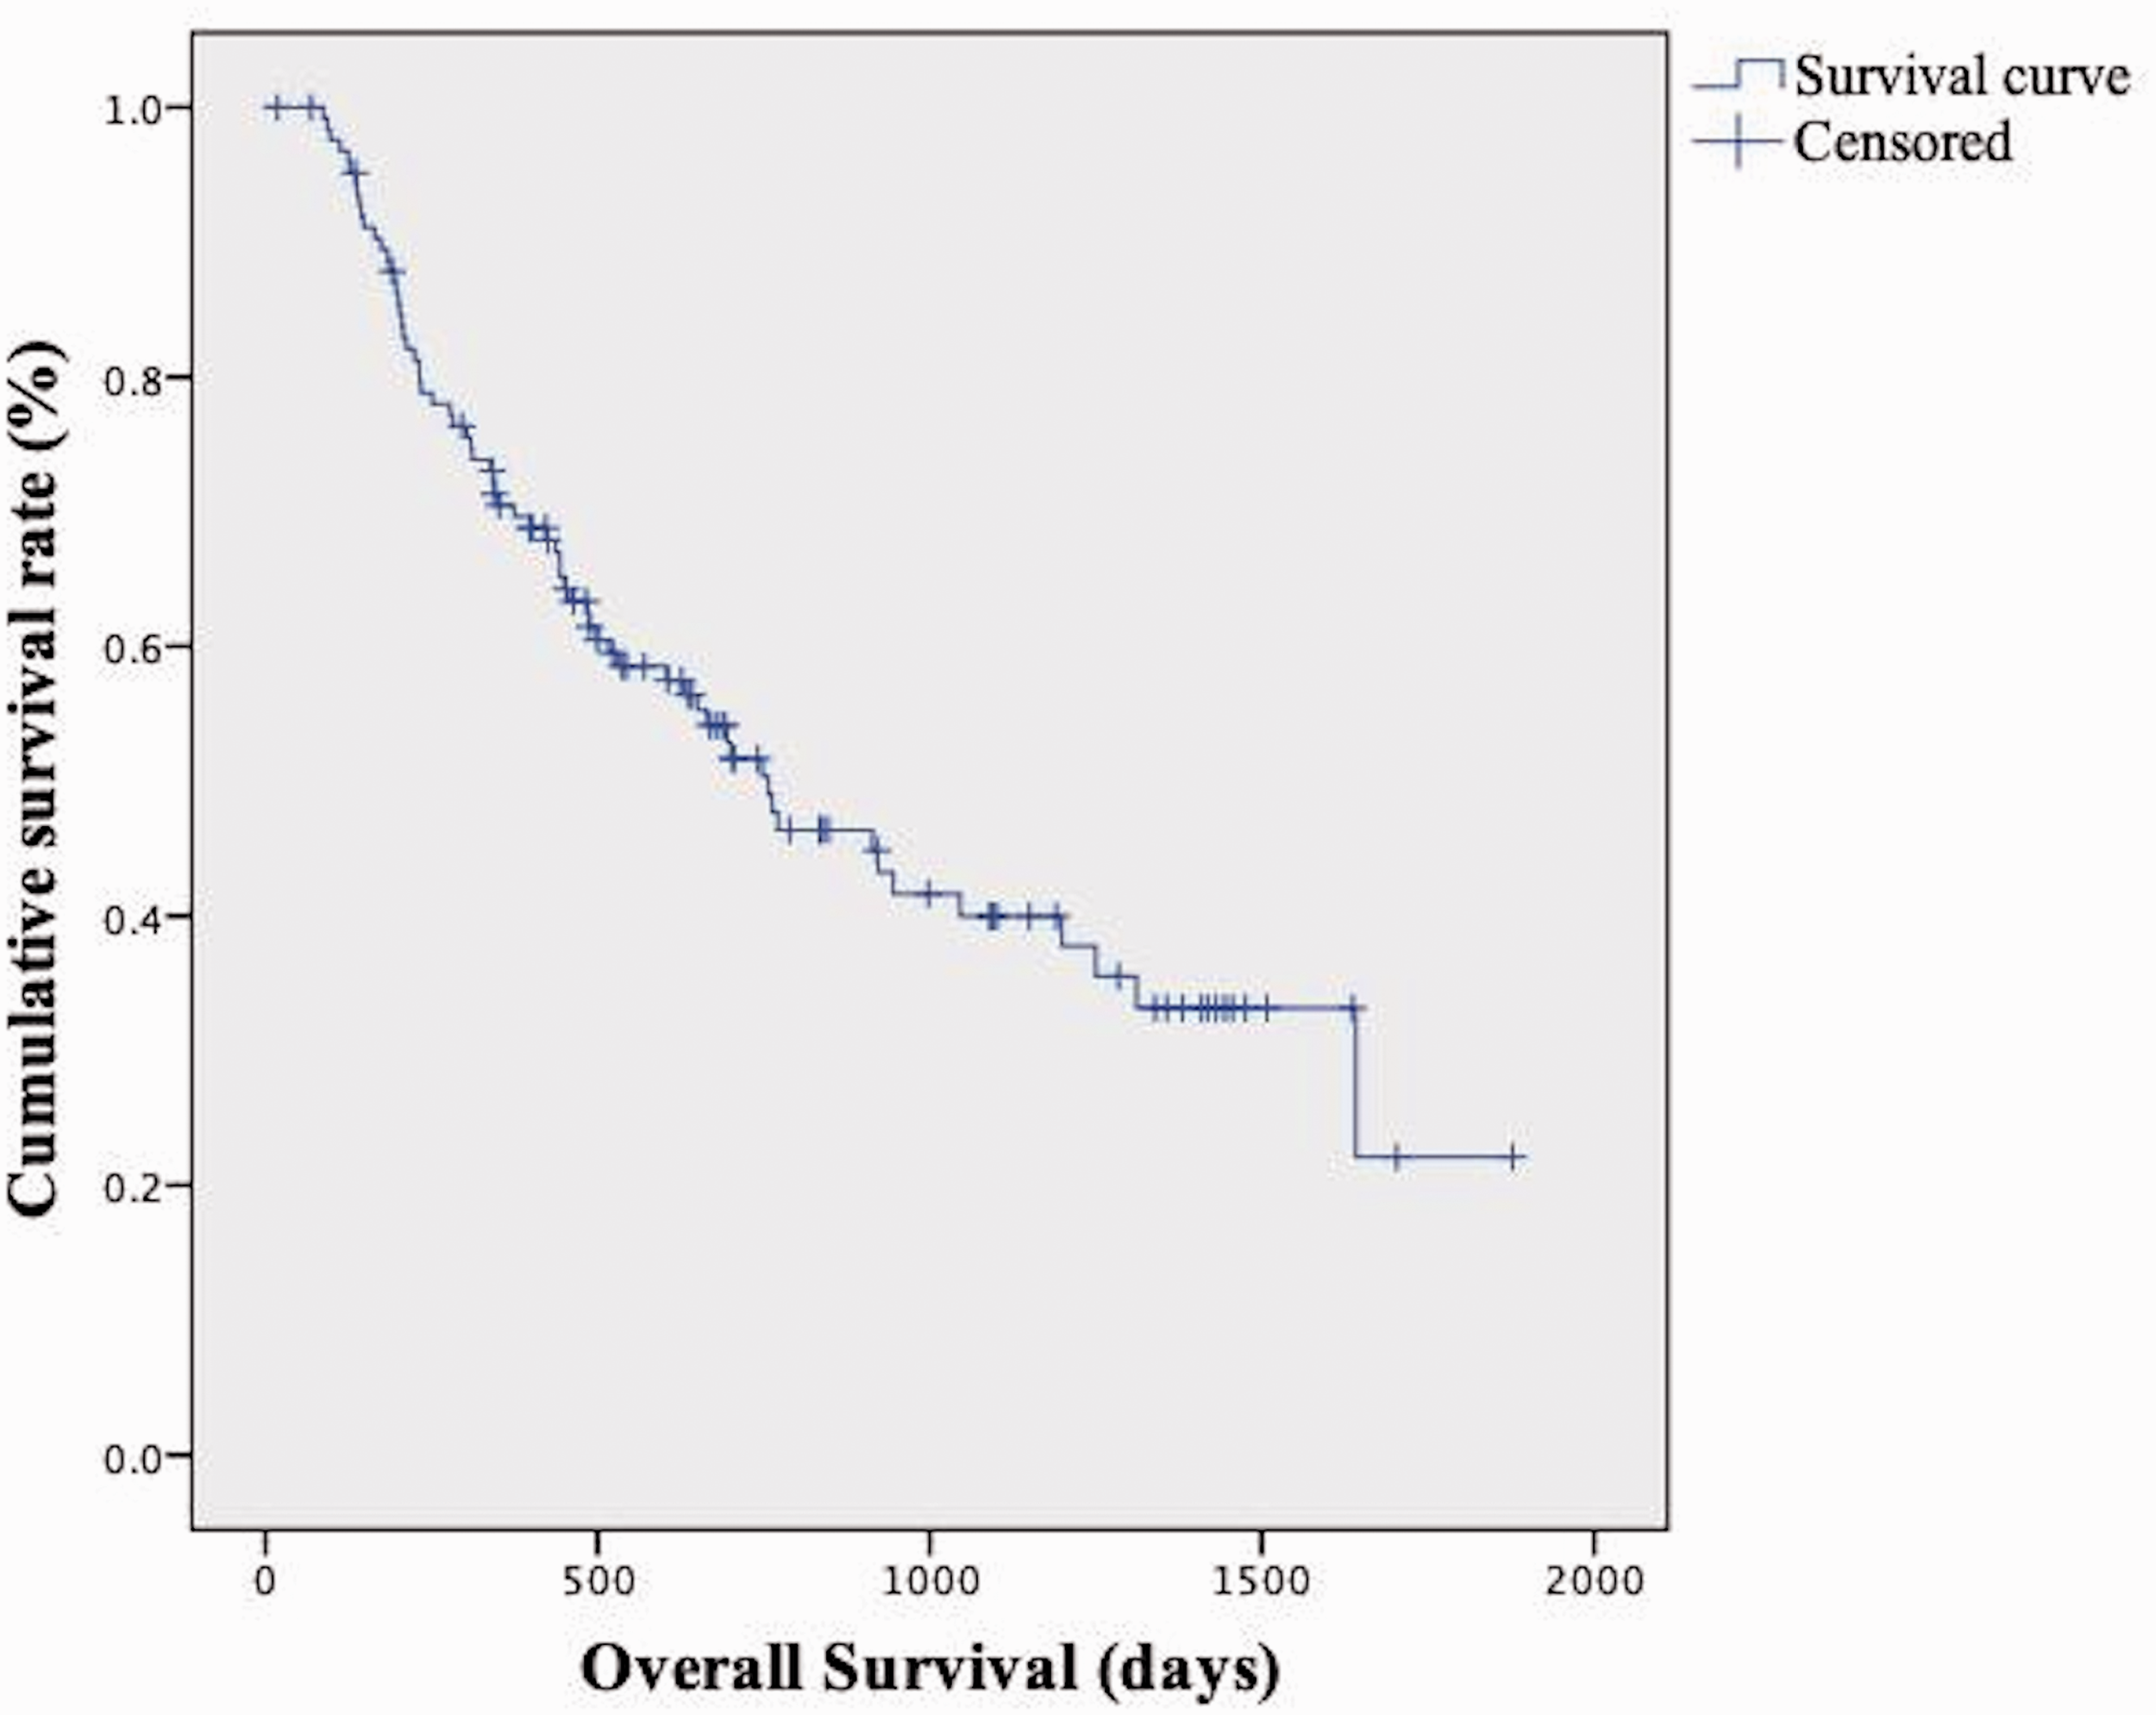
Survival curve of the overall study population.
Multivariate analysis of overall survival after transarterial chemoembolization.
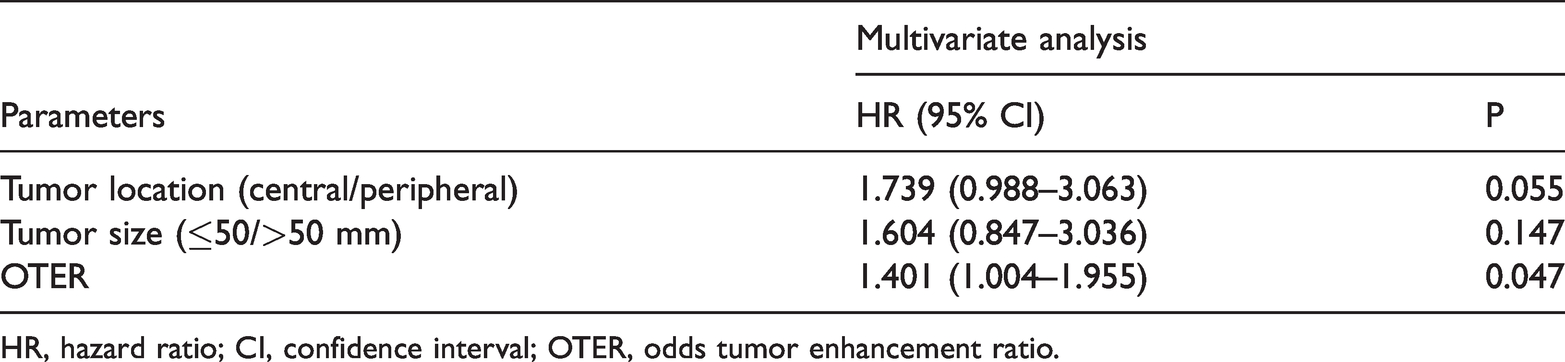
HR, hazard ratio; CI, confidence interval; OTER, odds tumor enhancement ratio.
Discussion
The present study showed that a low OTER is a potential predictive factor of better OS in patients with HCC treated with cTACE.
Arterial-phase hyperenhancement (APHE) is a common imaging feature of HCC and is defined as an SI/HU of the tumor that is unequivocally greater than the SI/HU of the surrounding liver. According to the current guidelines, APHE remains one of the most crucial imaging features for the diagnosis of HCC. Given the importance of APHE, several studies have demonstrated a significant correlation between APHE and treatment response to TACE. 16 However, several studies showed that unenhanced phase-based tumor enhancement (defined as the SI/HU of the tumor in the arterial phase relative to the SI/HU of the tumor in the unenhanced phase) was also significantly associated with the treatment response.17,18 Undoubtedly, both calculation methods for tumor enhancement are unreasonable and inadequate. In the former method, the importance of the SI/HU of the surrounding liver is addressed while the SI/HU of the tumor itself in the unenhanced phase is neglected. Because the target vessel for embolization is the tumor feeding artery, which is the main blood supply of the tumor, it is improper to evaluate the tumor enhancement while neglecting the unenhanced image of the tumor itself. In the latter method, the importance of the SI/HU of the tumor in the unenhanced phase is addressed while the SI/HU of the surrounding liver is neglected. The blood supply of the tumor is mainly from the hepatic artery, and the situation of hepatic arterial flow is correlated with the severity of liver cirrhosis. 19 Because most patients with HCC have liver cirrhosis as a comorbidity, it is improper to evaluate the tumor enhancement while neglecting the surrounding liver.
Kim et al. 13 introduced a calculation formula containing the SI/HU of the tumor and that of the surrounding liver in both unenhanced-phase and arterial-phase images. The authors initially applied this formula to the quantitative diagnosis of HCC. However, the present study showed that the formula could also be used to predict the therapeutic outcome of cTACE for HCC lesions.
The present study also showed that the tumor location is a potential prognostic factor for OS. This result is because the feeding arteries for the central portion of the liver are usually small, which may end in incomplete embolization of the tumor.20–22
This study has several limitations. First, this was a retrospective study. Future prospective studies and randomized controlled trials are warranted to validate our results and reduce probable bias. Second, the study sample size was relatively small, which may have resulted in statistical error. Third, enhancement measurements were performed on single axial slices rather than examining the entire tumor volume. However, the inter-reader agreement was excellent for both the tumor and surrounding liver parenchyma; thus, the reproducibility of our findings is excellent.
In conclusion, a low OTER was the predictor of improved OS. Therefore, these factors should be taken into consideration when performing cTACE. This study provides new information that may be useful for defining the best treatment strategies in clinical practice.
Footnotes
Availability of data and material
The datasets used and/or analyzed during the current study are available from the corresponding author on reasonable request.
Authors’ contributions
XY Yang and JB Deng analyzed and interpreted the patients’ data and reviewed the patients’ images. S Zhou and TZ An collected the data. JB Deng revised the manuscript. XY Yang and JB Deng were the major contributors to the writing of the manuscript. JX Li provided the study concept and was a major contributor to the editing of the manuscript. All authors read and approved the final manuscript.
Declaration of conflicting interest
The authors declare that there is no conflict of interest.
Funding
This research received no specific grant from any funding agency in the public, commercial, or not-for-profit sectors.