
Abstract
Objective
To characterise the relationship between fasting blood glucose (FBG) and the incidence of subsequent vascular events (SVE) during the 6 months following a mild ischaemic stroke (MIS) in Chinese patients.
Methods
Data from patients with MIS were retrospectively analysed. The primary endpoint was an SVE during the 6-month follow-up period. The participants were allocated to three groups (tertiles), according to their FBG concentration.
Results
Of the 260 participants, 51 (19.6%) reported an SVE during the follow-up period. The incidence of SVE significantly differed among the tertiles of FBG. The odds ratio (OR) was 2.361 (95% confidence interval [CI]: 1.551–3.594) for FBG as a continuous variable and that for FBG categorised according to tertile was 13.30 (95% CI: 3.519–50.322) in the fully adjusted model. Curve fitting showed that the incidence of SVE gradually increased with increasing FBG, with the highest tertile showing the highest mean incidence (46.7%; 95% CI: 16.2%–79.9%). In addition, participants with or without diabetes mellitus, hypertension, headache, dizziness, mild cognitive impairment or anterior circulation artery lesion showed similar associations between FBG and the incidence of SVE.
Conclusion
FBG is an independent predictor of 6-month SVE risk in Chinese patients with MIS.
Introduction
Fasting blood glucose (FBG) concentration is closely related to ischaemic stroke (IS). 1 In particular, a high FBG concentration is a risk factor for intracranial atherosclerotic stenosis, the most common cause of stroke. 2 Furthermore, high FBG is an independent risk factor for a first IS in older individuals with hypertension. 3 In addition, high triglyceride and low-density lipoprotein-cholesterol (LDL-C) concentrations are risk factors for IS. 4
FBG has also been reported to be significantly associated with the prognosis of IS. It is associated with 90-day mortality and a poor functional outcome 3 months after acute ischaemic stroke (AIS) in patients that are treated by mechanical thrombectomy.5,6 Chronic hyperglycaemia prior to AIS is associated with the cerebrovascular response to exercise in the subacute recovery period 7 and FBG predicts the risk of malignant cerebral oedema in patients with IS who are treated by endovascular thrombectomy. 8 Furthermore, FBG is significantly associated with stroke-associated infection, which is a major complication in patients with AIS who undergo endovascular therapy. 9 A significant correlation between FBG and 1-year adverse outcomes (modified Rankin scale [mRS] score 3 to 6) has been identified in Chinese patients with AIS, 1 and an FBG ≥7.0 mmol/L is an independent risk factor for 1-year prognosis (death or mRS ≥3) in patients with AIS. 10 Finally, the results of a retrospective cohort study of 1025 patients with AIS showed that FBG can help predict the 3-month outcome of AIS (mRS >2). 11
Mild ischaemic stroke (MIS) generally refers to stroke that is associated with mild and non-disabling symptoms, and is defined using a National Institutes of Health Stroke Scale (NIHSS) score of ≤3 points.12,13 Although MIS only causes mild symptoms and/or neurologic defects, it is associated with a high risk of subsequent vascular events (SVE). It has been reported that the risk of recurrent stroke within 7 days of an MIS is 8% to 10%. 14 In addition, a prospective study of MIS showed that 15% of the patients develop a disability within 90 days. 15 Even though great progress has been made in recent years, many challenges remain in the diagnosis and treatment of MIS, but a rapid and effective means of determining the prognosis of patients with MIS is critical for the formulation of appropriate treatment strategies.
As described above, significant correlations between FBG concentration and the prognosis of IS have been shown in previous studies. However, whether these findings can be generalised to patients with MIS remains to be established. Therefore, in the present study, we aimed to determine the relationship between FBG concentration and the incidence of SVE in Chinese patients during the 6 months following an MIS.
Materials and Methods
Description of the cohort
We performed a retrospective cohort study of 280 patients who attended the Neurology Clinic of Wuxi No. 5 Hospital between January 2017 and December 2019. The study was conducted in accordance with the principles of the Declaration of Helsinki and was approved by the institutional ethics committee (Approval number: 2020-022-1). To protect privacy, data were collected anonymously and identifying information was removed. Therefore, informed consent was not required.
The inclusion criteria were as follows: (1) Asymptomatic or mild symptoms at the first visit, with or without mild signs of a stroke, and an NIHSS score ≤3; (2) Brain magnetic resonance imaging (MRI) examination performed at the first visit, showing small infarcts; (3) Visit to the hospital within 72 hours of the onset of symptoms; (4) Age >18 years; (5) Complete dataset regarding height, body mass, waist circumference, blood pressure, plasma lipid concentrations, FBG, and medical history; (6) Regular aspirin therapy (100 mg daily) and (7) Complete set of follow-up data. The exclusion criteria were as follows: (1) History of ischaemic stroke, cerebral haemorrhage or other active haemorrhagic disease, brain tumour, traumatic brain injury or other brain injury; (2) Confirmation of intracranial haemorrhage or a non-vascular aetiology for the patient’s symptoms on imaging; (3) Aneurysm or arteriovenous malformation (AVM); (4) Age < 18 years; (5) Dementia or mental illness and (6) Failure to perform an MRI examination.
Assessments made of the participants
The baseline characteristics of the participants (age, height, body mass, waist circumference, systolic blood pressure (SBP), diastolic blood pressure (DBP), FBG, and plasma lipid concentrations), their medical history (in particular of hypertension, diabetes, dyslipidaemia or metabolic syndrome), the duration of their hypertension, their initial NIHSS score, their symptoms (headache, dizziness, and mild cognitive impairment [MCI]), the site of their MIS (anterior circulation artery [ACA] or posterior circulation artery [PCA]), and their MRI results (number of lesions, maximum diameters of the lesions and the sizes of the infarcts) were collected for analysis.
The height, body mass and waist circumference of the participants were measured using standard methods. Body mass index (BMI) was calculated as body mass (kg)/height (m) 2 . The FBG and plasma lipid concentrations were measured in the hospital laboratory. Hypertension was defined as an SBP ≥130 mmHg, a DBP ≥90 mmHg or a clear diagnosis in the participant’s medical records. Diabetes was defined as an FBG ≥7.0 mmol/L, a random blood glucose concentration ≥11.1 mmol/L or a clear diagnosis in the participant’s medical records. Dyslipidaemia was defined as a total plasma cholesterol concentration ≥5.2 mmol/L, an LDL-C ≥3.4 mmol/L, a triglyceride concentration ≥1.7 mmol/L or a high-density lipoprotein-cholesterol (HDL-C) <1.03 mmol/L in men or <1.3 mmol/L in women. Metabolic syndrome was diagnosed in the presence of three or more of the following: (1) waist circumference ≥90 cm for men or ≥80 cm for women; (2) triglyceride concentration >1.7 mmol/L; (3) HDL-C <1.03 mmol/L for men or <1.3 mmol/L for women; (4) an SBP ≥130 mmHg or a DBP ≥80 mmHg and (5) an FBG ≥5.6 mmol/L.
The participants were followed up 6 months after their diagnosis of MIS to assess the incidence of SVE. Information was collected by a neurologist over the phone. SVE was defined as a transient ischaemic attack, transient non-focal cerebrovascular symptoms, the worsening of cerebrovascular symptoms or recurrent infarction, and an mRS ≥2 during the follow-up period.16,17
Statistical analyses
The participants were allocated to three groups according to their FBG concentration (tertiles). Categorical data are expressed as frequencies and proportions and continuous data as means ± SDs. The chi-square test (categorical data), one-way ANOVA (normally distributed continuous data) and the Kruskal–Wallis test (skewed continuous data) were used to compare the groups, as appropriate.
Single-factor logistic regression was used to analyse the relationships between baseline characteristics of the participants and the 6-month incidence of SVE. Generalised linear models with a logit link were used to identify independent and comprehensive effects of FBG tertile on the incidence of SVE, using the lowest tertile as the reference. Unadjusted and adjusted estimates were calculated using exact and asymptotic methods, respectively. Potential confounders were included as covariates in the final models if they changed the estimate of the effect of FBG on SVE by >10% or were associated with SVE with P<0.10. We also calculated odds ratios (ORs) and 95% confidence intervals (CIs).
The generalised additive model (GAM) is a non-parametric regression method that is suitable for the analysis of various distributions and non-linear relationships, and it can therefore be used for curve fitting and the establishment of a model.18,19 In the present study, GAM was used to evaluate the relationship between FBG concentration and the 6-month incidence of SVE and to generate a line graph. Hierarchical analyses were performed using stratified binary logistic regression models. All the data were analysed using R software version 3.4.3 (http://www.r-project.org) and a two-tailed P-value of < 0.05 was taken to indicate statistical significance.
Results
A total of 260 patients with MIS were included in the study (Figure 1). Of these, 133 were men and 127 were women, and they were 59.7 ± 11.6 years old (range 37–85 years). SVE occurred in 51 participants (19.6%) during the 6-month follow-up period.

Flowchart of patient selection
Baseline characteristics of the participants
Seventy-nine participants had an FBG concentration in Tertile 1 (3.50 to 4.99 mmol/L), 80 in Tertile 2 (5.00 to 5.59 mmol/L), and 101 in Tertile 3 (5.60 to 19.50 mmol/L). No significant differences in age, sex distribution, SBP, DBP, previous history of hypertension, duration of hypertension, initial NIHSS score, symptoms (headache, dizziness or MCI), the site of the MIS (ACA or PCA) or MRI results (number of lesions, maximum diameter of lesions or infarct size) were identified among the three groups. However, the proportions of participants with diabetes, dyslipidaemia or metabolic syndrome all significantly differed (all P < 0.05). The incidences of SVE in the three groups were 2.5%, 11.2% and 39.6% for tertiles 1 to 3, respectively, and these significantly differed (P < 0.001) (Table 1).
Baseline characteristics of the patients who experienced MIS

Data are mean ± SD, median (Q1–Q3) or N (%) and were analysed using one-way ANOVA, the Kruskal–Wallis test or the chi-square test, respectively.
MIS, minor ischaemic stroke; FBG, fasting blood glucose; BMI, body mass index; SBP, systolic blood pressure; DBP, diastolic blood pressure; NIHSS, National Institutes of Health Stroke Scale; MCI, mild cognitive impairment; ACA, anterior circulation artery; PCA, posterior cerebral artery; MRI, magnetic resonance imaging; SVE, subsequent vascular events.
Crude relationships between the baseline characteristics of the participants and their risk of SVE
Univariate analyses of the relationships between the clinical characteristics of the participants and their risk of SVE, after adjustment for age and sex, showed that diabetes, dyslipidaemia, metabolic syndrome and FBG were all possible risk factors for SVE, with ORs of 9.752, 2.352, 10.151 and 2.786, respectively (all P < 0.05) (Table 2). The results shown in Tables 1 and 2 indicated that diabetes, dyslipidaemia and metabolic syndrome were confounding factors that affect the relationship between FBG and SVE.
Relationships between the baseline characteristics of the patients and their risk of SVE

Data are mean ± SD, median (Q1–Q3) or N (%). The analyses were adjusted for age and sex.
SVE, subsequent vascular events; BMI, body mass index; SBP, systolic blood pressure; DBP, diastolic blood pressure; NIHSS, National Institutes of Health Stroke Scale; MCI, mild cognitive impairment; MIS, minor ischaemic stroke; ACA, anterior circulation artery; PCA, posterior cerebral artery; MRI, magnetic resonance imaging; FBG, fasting blood glucose.
Multivariate regression analysis of the effect of FBG on the risk of SVE
Table 3 shows the results of the single factor and multivariate logistic regression analysis of the effect of FBG concentration, as a continuous variable and as a categorical variable, on the risk of SVE. The output of the non-adjusted model is equivalent to single-factor logistic regression analysis. The covariates that were initially adjusted for (Adjusted I) were age and sex, and the fully adjusted model (Adjusted II) included age, sex, dyslipidaemia, metabolic syndrome and NIHSS score as covariates. When FBG was considered as a continuous variable, it significantly increased the risk of SVE in the Non-adjusted, Adjusted I and Adjusted II regression equations, with ORs of 2.596, 2.786 and 2.361, respectively (all P < 0.001).
Results of the multivariate regression analysis of the effect of FBG on the incidence of SVE
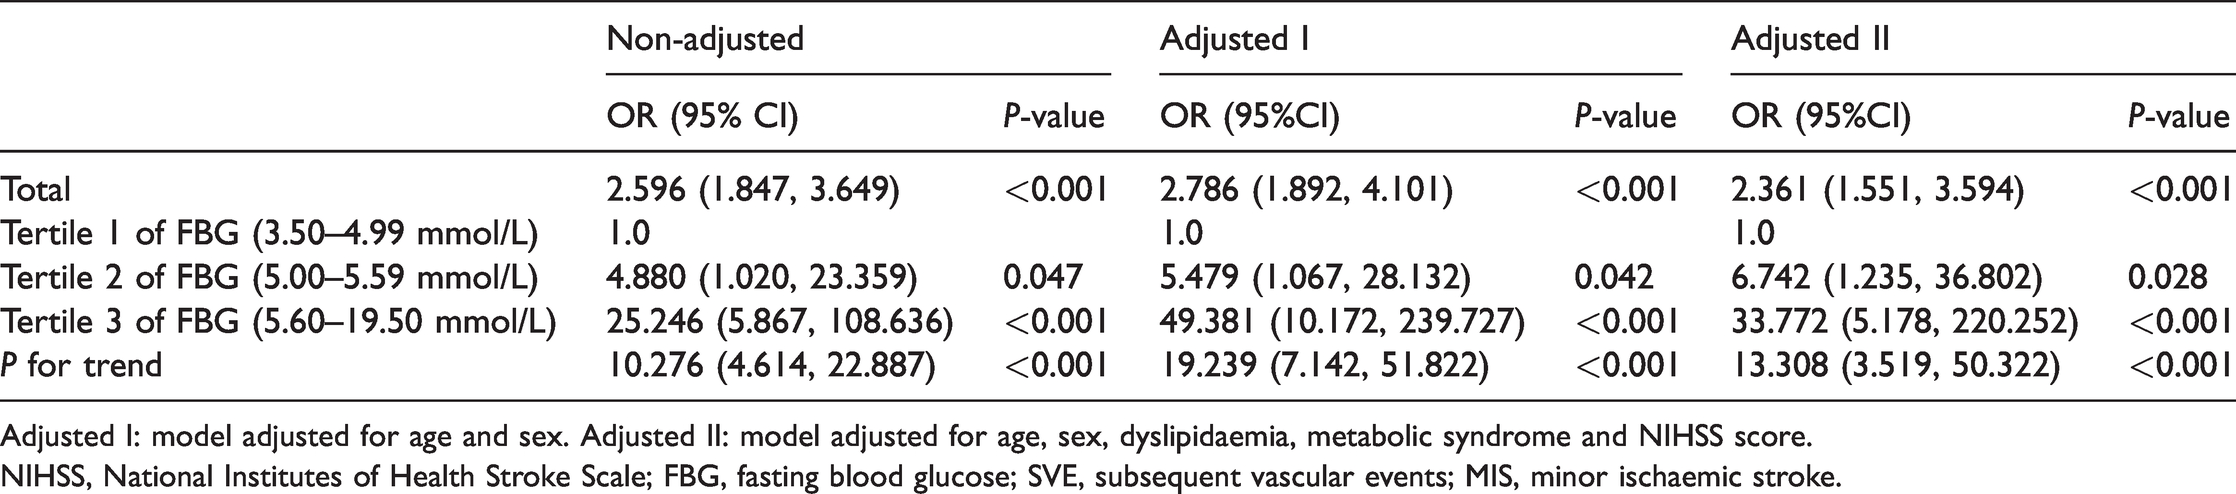
Adjusted I: model adjusted for age and sex. Adjusted II: model adjusted for age, sex, dyslipidaemia, metabolic syndrome and NIHSS score.
NIHSS, National Institutes of Health Stroke Scale; FBG, fasting blood glucose; SVE, subsequent vascular events; MIS, minor ischaemic stroke.
In the Non-adjusted, Adjusted I and Adjusted II regression equations, the trend in FBG across the tertiles significantly correlated with the risk of SVE, with ORs of 10.276, 19.239, and 13.308, respectively (all P < 0.001). The differences in risk were especially marked between Tertile 3 and Tertile 1, with ORs of 25.246, 49.381 and 33.772, respectively (P < 0.001) (Table 3).
Curve fitting
GAM was also used to evaluate the relationship between FBG (tertiles 1 to 3) and SVE. After adjustment for age, sex, dyslipidaemia, metabolic syndrome and NIHSS score, increasing FBG was associated with a gradual increase in the mean incidence of SVE. The mean incidences were 2.5% for Tertile 1 (95% CI: 0.5%–12.3%), 14.9% for Tertile 2 (95% CI: 5.4%–35.2%) and 46.7% for Tertile 3 (95% CI: 16.2%–79.9%). Thus, Tertile 3 showed the highest mean incidence of SVE (Figure 2).

Relationship between FBG concentration (tertiles 1–3) and the incidence of SVE, after adjustment for age, sex, dyslipidaemia, metabolic syndrome and NIHSS score. The black dotted line was fitted using a general additive model and the red error bars represent the 95% confidence intervals (CI)
Analysis of interactions
Hierarchical analysis was used to further evaluate the relationship between FBG and the incidence of SVE in subgroups of the participants. None of the variables considered (diabetes mellitus, hypertension, headache, dizziness, MCI and ACA) significantly altered the identified association between FBG and SVE (P = 0.111–1.000) (Table 4).
Hierarchical analysis of interactions

The data were adjusted for age, sex, dyslipidaemia, metabolic syndrome and NIHSS score. Posterior cerebral artery was excluded as a variable because there were <20 observations made in each category.
SVE, subsequent vascular events; MIS, minor ischaemic stroke; MCI, mild cognitive impairment; ACA, anterior circulation artery; Inf, infinite; NIHSS, National Institutes of Health Stroke Scale.
Discussion
In the present study, we have shown that FBG concentration is an independent predictor of the 6-month risk of SVE in Chinese patients with MIS. Moreover, the results were validated by comprehensively adjusting for a series of important confounding factors.
Previous studies have shown that diabetes, dyslipidaemia and metabolic syndrome all affect the prognosis of MIS. However, these risk factors do not form an aetiological link between FBG and SVE.17,20,21 The results of the present study show that both previous medical history (diabetes, dyslipidaemia and metabolic syndrome) and FBG are risk factors for SVE, and that previous medical history might confound the relationship between FBG and SVE. Therefore, we used multivariable risk adjustment to establish three logistic regression models and calculate ORs. 22 After adjustment for the confounding factors, the results demonstrated that FBG is significantly associated with the risk of SVE during the following 6 months.
The findings of this study are consistent with those of previous studies of the relationship between FBG and IS. Previous cohort studies showed that high FBG is associated with poor prognoses 3 months and 1 year after AIS in Chinese patients,1,10,11 and one showed that the association was stronger when FBG is ≥7.0 mmol/L. 10 Here, we have shown that patients with FBG in the highest tertile (5.6 to 19.5 mmol/L) have the highest mean incidence of SVE. However, our study and these previous studies differ somewhat in the findings. First, the previous studies did not involve a separate analysis of the patients with MIS. Therefore, the results may not be generalisable to such patients. Second, the previous findings suggested that FBG would be useful as one of a number of factors in the evaluation of the prognosis of patients with AIS, whereas the present findings imply that FBG is an independent predictor of the 6-month incidence of SVE in patients who experience MIS.
Several possible mechanisms may explain the association between high FBG and the greater risk of SVE. First, a high glucose concentration may cause penumbra-infarction transition and reperfusion injury. 23 Second, the combination of ischaemia, hyperglycaemia and nerve stimulation increases the calcium concentration in brain cells, which may cause further neuronal damage and related adverse events. 24 Finally, the association may also be related to greater damage to the blood–brain barrier and a higher risk of haemorrhage. 25 However, the true mechanisms await confirmation through future detailed investigations.
To the best of our knowledge, this was the first study to show that FBG is an independent predictor of the 6-month incidence of SVE in patients who experience MIS. The symptoms of MIS are mild and easily ignored, but the risk of SVE is high.14,15 Therefore, it is important to identify biomarkers that could be used to rapidly and accurately determine the prognosis of patients with MIS. The NIHSS score is recognised to be an appropriate tool for the assessment of the severity of stroke, but it has disadvantages for use in patients with MIS. It may not capture some important defects that affect functional outcomes, such as reductions in hand strength or agility, abnormal gait, and subtle abnormalities in non-dominant hemisphere and cognitive executive functions. Moreover, the defects in patients with MIS are usually subtle and may go undetected.13,26 A plasma glucose concentration >8 mmol/L following AIS has been considered to be an independent predictor of poor prognosis for >20 years, 27 and more than one-third of patients who experience AIS have high plasma glucose concentrations during hospitalisation,28,29 but many such patients do not require hospitalisation. Moreover, the incidence of post-stroke hyperglycaemia in patients who experience MIS is low. 13 Therefore, it would be impractical to investigate the relationship between plasma glucose concentration during hospitalisation and the prognosis of patients with MIS. Instead, the relationship between high FBG and a poor prognosis for patients with MIS is of more practical significance. Overall, the present findings support the use of FBG as a marker of prognosis of the following 6 months for patients who experience MIS.
The present study had several limitations. First, it was a retrospective cohort study in which only the 6-month incidence of SVE was analysed in patients with MIS. Because of the relatively short follow-up period, the results should be interpreted with caution. Second, the minimum age of the participants was 37 years old. Therefore, the findings may not be applicable to younger patients with MIS. Third, we did not measure the FBG concentration during the follow-up period. Therefore, we cannot comment on the effect of glycaemic variability on the prognosis of patients with MIS. Fourth, we only analysed SVE as an outcome, rather than analysing each associated event. We intend to study these in the future. Finally, only Chinese patients were recruited; therefore, the results may not be generalisable to other locations or ethnicities.
Conclusion
High FBG concentration is associated with a high 6-month incidence of SVE in Chinese patients who experience MIS. Therefore, it may be suitable for use as an independent predictor of poor medium-term prognosis in such patients.