
Abstract
Objective
Prostate cancer (PCa) is a malignant neoplasm of the urinary system. This study aimed to use bioinformatics to screen for core genes and biological pathways related to PCa.
Methods
The GSE5957 gene expression profiles were obtained from the Gene Expression Omnibus (GEO) database to identify differentially expressed genes (DEGs). Gene ontology (GO) and Kyoto Encyclopedia of Genes and Genomes (KEGG) pathway enrichment analyses of the DEGs were constructed by R language. Furthermore, protein–protein interaction (PPI) networks were generated to predict core genes. The expression levels of core genes were examined in the Tumor Immune Estimation Resource (TIMER) and Oncomine databases. The cBioPortal tool was used to study the co-expression and prognostic factors of the core genes. Finally, the core genes of signaling pathways were determined using gene set enrichment analysis (GSEA).
Results
Overall, 874 DEGs were identified. Hierarchical clustering analysis revealed that these 24 core genes have significant association with carcinogenesis and development. LONRF1, CDK1, RPS18, GNB2L1 (RACK1), RPL30, and SEC61A1 directly related to the recurrence and prognosis of PCa.
Conclusions
This study identified the core genes and pathways in PCa and provides candidate targets for diagnosis, prognosis, and treatment.
Keywords
Introduction
Prostate cancer (PCa) is currently a major cause of cancer morbidity and mortality. 1 In China, the rates of incidence and mortality of PCa have increased in all age groups from 1990 to 2017, and timely intervention should be done for individuals less than 40 years old. 2 Although prostate-specific antigen (PSA) levels have been widely used to detect PCa, overdiagnosis and overtreatment of PCa are still limitations of such screening methods. 3 Now, numerous dependable and efficient biomarkers have been identified and proved to be prognostic. Therefore, exploring core genes in PCa has important clinical significance.
Because of high-throughput sequencing technology and bioinformatics methods, it is easier to screen for differentially expressed genes (DEGs) to discover inner signaling networks and relationships between genes. 4 Fibroblast growth factor 2 (FGF2), 5 cyclin kinase subunit 2 (CKS2), 6 RING finger protein 7 (RNF7), 7 cyclin-dependent kinase 1 (CDK1), 8 and other core genes were screened out based on their significant effects on the development and progression of PCa. However, several studies have indicated that there are clear differences among them. Consequently, potential genes still need to be explored and verified.
Until now, the gene profile GSE5957 had not been reported or previously screened. This dataset contains 25 experiments that were performed for PCa tissues and three for normal prostate (NP) tissues. All samples and common cases were labeled with Cy5-dUTP. In the present study, a total of 874 DEGs were detected between PCa and NP tissues. To predict the core genes and molecular mechanisms, protein–protein interaction (PPI) networks and Cytoscape software were applied, respectively. The Tumor Immune Estimation Resource (TIMER) database, multiple databases from cBioPortal, and the Oncomine public database were used to examine the expression and prognostic value between cancer and normal tissues.
Materials and methods
Microarray data
The GSE5957 dataset, which contains 25 PCa tissue samples and three matched NP tissue samples, were obtained from the Gene Expression Omnibus (GEO) database (https://www.ncbi.nlm.nih.gov/geo/). GPL4381 (UGI Human 14112 V1.0) was converted to official gene symbols based on Database for Annotation Visualization and Integrated Discovery (DAVID; https://david.ncifcrf.gov/), which contains 14,112 probes. The construction of the microarrays used in this study was carried out following Brown’s method (available at http://cmgm.stanford.edu/pbrown/protocols/index.html). A “genome-wide” cDNA microarray consisting of 14,061 sequences was generated. These included full-length and partial cDNAs representing novel, known, and control genes provided by United Gene Holdings Group Co., Ltd. The genes represented in the arrays were identified based on high similarity to the sequences in the Unigene database of NCBI by performing Blast (http://www.ncbi.nlm.nih.gov/).
Data processing and screening of DEGs
The affy package of the R programing language (Ver. 4.0.2; R Core Team, 2014) was used to read the GSE5957 dataset. Robust Multi-array Average method was preconditioned. The DEGs were screened based on P-value < 0.05 and |log2FC| (fold change) ≥1. 9
Gene ontology (GO) and pathway enrichment analysis
Gene ontology (GO) annotation and Kyoto Encyclopedia of Genes and Genomes (KEGG) pathway enrichment information of DEGs were adopted in DAVID previously. The standards of screening were P < 0.05 with count number ≥1.5. The visualization of results was generated by R programing language.
PPI network construction and module analyses
The Search Tool for the Retrieval of Interacting Genes (STRING) database online tool (http://string-db.org/) 10 was used to construct the PPI network mapping, which served as a unique resource for further experimentation and analysis leading to the identification of disease-modifier genes and new drug targets. 11 Criteria of degree cutoff ≥2, node score cutoff ≥2, K-core ≥2, and max depth = 100, as well as the MCODE and Centiscape 2.2 App of Cytoscape (Ver. 3.7.2) based on all DEGs,12,13 were used for network visualization and identification of core genes.
Core gene selection and prognosis analysis
Based on the degrees ≥ 12, the most significant model was established as the PPI network. cBioPortal (http://www.cbioportal.org) (Table 1) was used to present the co-expression network. Afterwards, to qualify the individual prognostic value for PCa, log2 mRNA expression data (The Cancer Genome Atlas Prostate Adenocarcinoma (TCGA PRAD)) were submitted to TIMER (https://cistrome.shinyapps.io/timer/). 14 We analyzed the Kaplan–Meier (KM) curves of the candidate core genes, which are presented with cBioPortal. A P-value < 0.05 was the criterion for statistical significance. Five databases15–19 are included in cBioPortal, which verified the effects on patient overall survival (OS) in large samples.
Detailed results of Module 1 and Module 2.

External dataset evaluation and verification
Based on Oncomine (http://www.oncomine.com), 20 the interactions between the core genes and metastasis state were validated. To map all human proteins in cells, tissues, and organs and the pathology of core genes on transcriptional and translational levels, the Human Protein Atlas (HPA) (http://www.proteinatlas.org/) was applied to evaluate the core genes. With the clinical data from Oncomine and TCGA, we investigated the mutual relationships between core gene expression levels and clinical stage. Based on the UALCAN (http://ualcan.path.uab.edu/index.html) online tool, 21 we examined the relevance between the core genes and Gleason scores.
Gene set enrichment analysis (GSEA)
GSEA (http://software.broadinstitute.org/gsea/index.jsp) 22 is a productive tool to predict the functional effect of the core genes. The most significant pathways were screened by P-values < 0.05. “ggplot2” packages were applied to visualize the result in R programing language (Ver. 4.0.2).
Results
Screening of DEGs and data processing
Information regarding mRNA expression is included in dataset GSE5957. A total of 6901 official gene symbols were identified and the expression of each gene was established. Limma R package was applied to filter the DEGs (criteria: P < 0.05 and |log 2 fold change| ≥ 1). A total of 874 DEGs were discerned between PCa and NP samples, including 226 upregulated genes and 648 downregulated genes. A cluster heatmap of the 874 DEGs and a volcano plot are presented in Figure 1.

Volcano plot and cluster heatmap of the differentially expressed genes (DEGs). (a) Volcano plot: Significantly upregulated DEGs, significantly downregulated DEGs, and insignificantly changed genes are represented as blue, purple, and gray dots, respectively, in prostate cancer (PCa) and normal prostate (NP) tissues. The top 24 candidate DEGs are noted. (b) Cluster heatmap of the DEGs.
KEGG and GO enrichment of DEGs
The functional classifications of the 874 DEGs were generated using DAVID. Regulation of cell cycle process, regulation of cellular protein localization, and cellular component disassembly of biological procession were the most significantly enriched groups by GO analysis. For molecular function, DEGs were significantly enriched for actin, ubiqutin-like protein ligase, 3'-5' exonuclease activity, and transcription factor binding. For the cellular component group of genes, mitochondrial envelope, focal adhesion, and dendrite were extremely enriched. KEGG pathway analysis indicated that cell cycle, N-Glycan biosynthesis, and Hippo signaling pathway were largely enriched. (Figure 2).

The Gene Ontology (GO)/Kyoto Encyclopedia of Genes and Genomes (KEGG) enrichment analyses of the differentially expressed genes (DEGs). (a) GO terms of biological process in DEGs. (b) GO terms of molecular function in DEGs. (c) GO terms of cell component in DEGs. (d) KEGG pathway terms in DEGs.
PPI and module analysis
Cytoscape software and the online database STRING (available online: https://string-db.org/) were used to identify core genes, which consisted of 862 nodes interacting with each other via 3124 edges. Based on the APP of Centiscape and MCODE, the most statistically significant module 14 core genes that were screened are shown in Figure 3 with degreeMCODE scores ≤13 (including LONFR1 and all genes in Module 2 (C)) in MCODE (Table 1) and the top 10-degree genes in Centiscape (Table 2). The GO and KEGG enrichment analyses of this module were generated using DAVID. The most significant module 14 core genes were mainly enriched for ribosomal subunit, translational elongation, ubiquitin-dependent protein catabolic process, ribosome, and cell cycle. (Table 3).
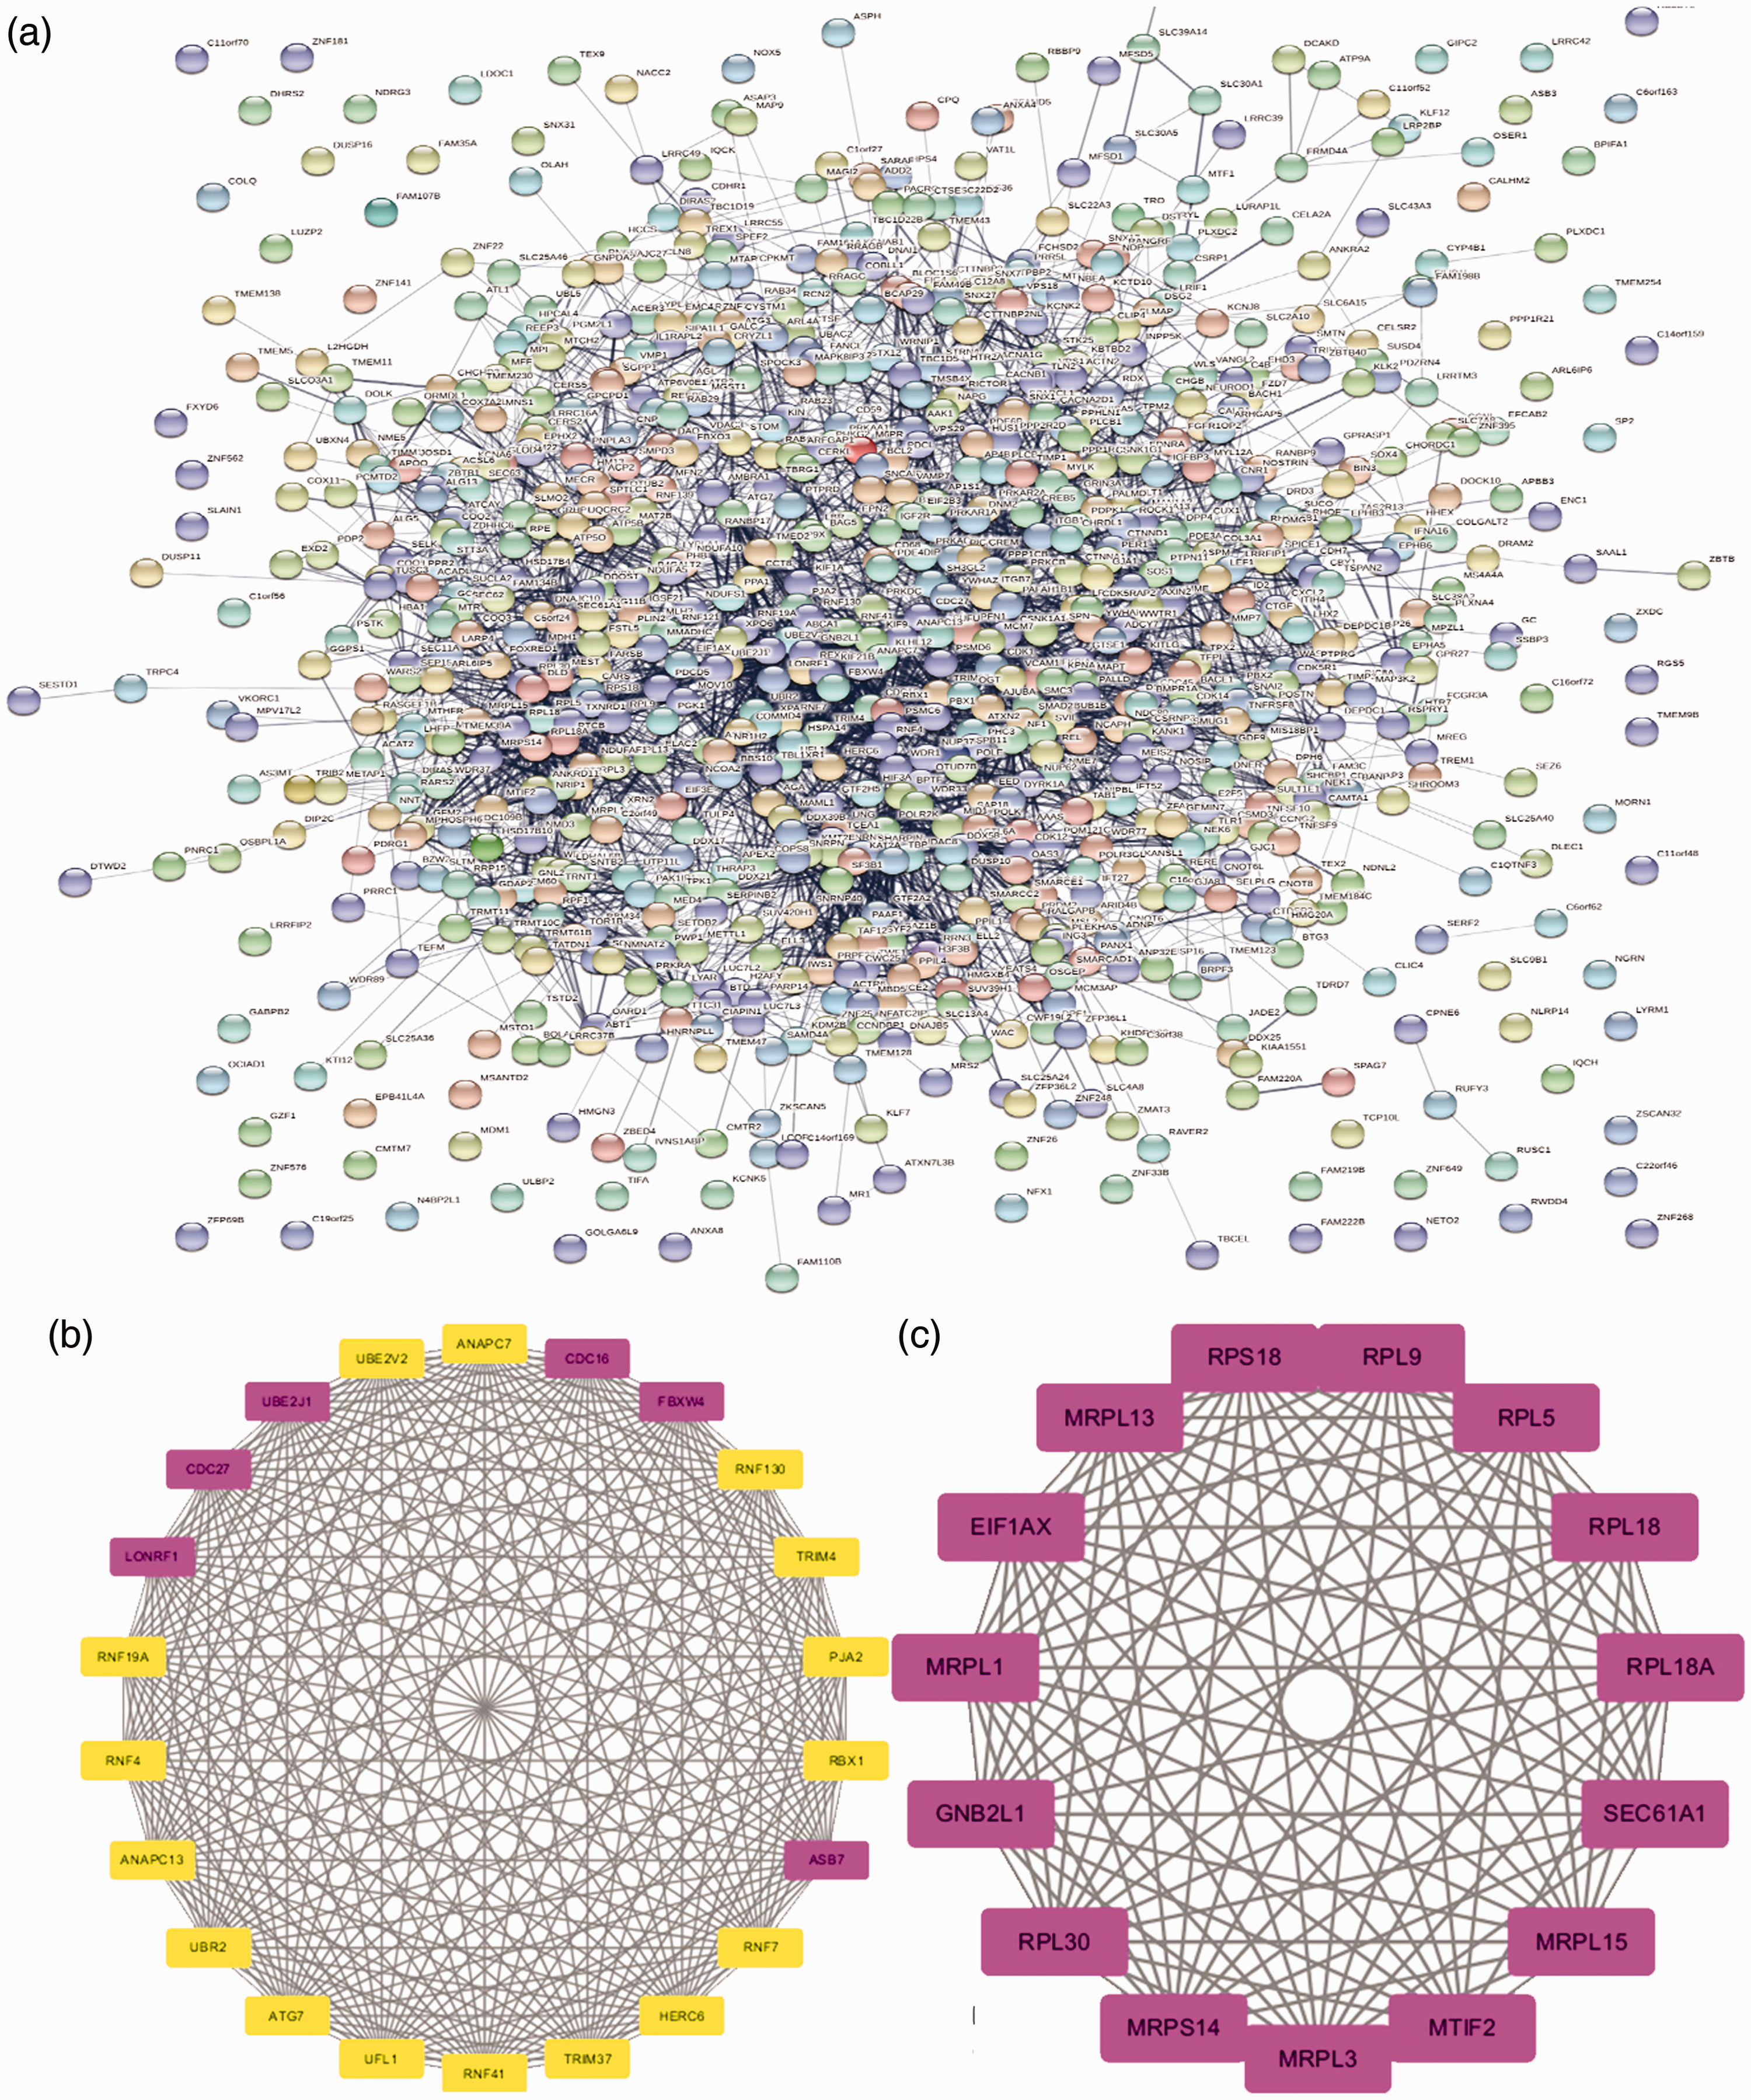
(a) Protein-protein interaction (PPI) network for differentially expressed genes (DEGs). (b) Module 1 of DEGs. (C) Module 2 of DEGs.
Detailed results of the Centiscape app.

Gene ontology (GO) and Kyoto Encyclopedia of Genes and Genomes (KEGG) pathway enrichment analysis of differentially expressed genes (DEGs) in the most significant module 14 core genes.
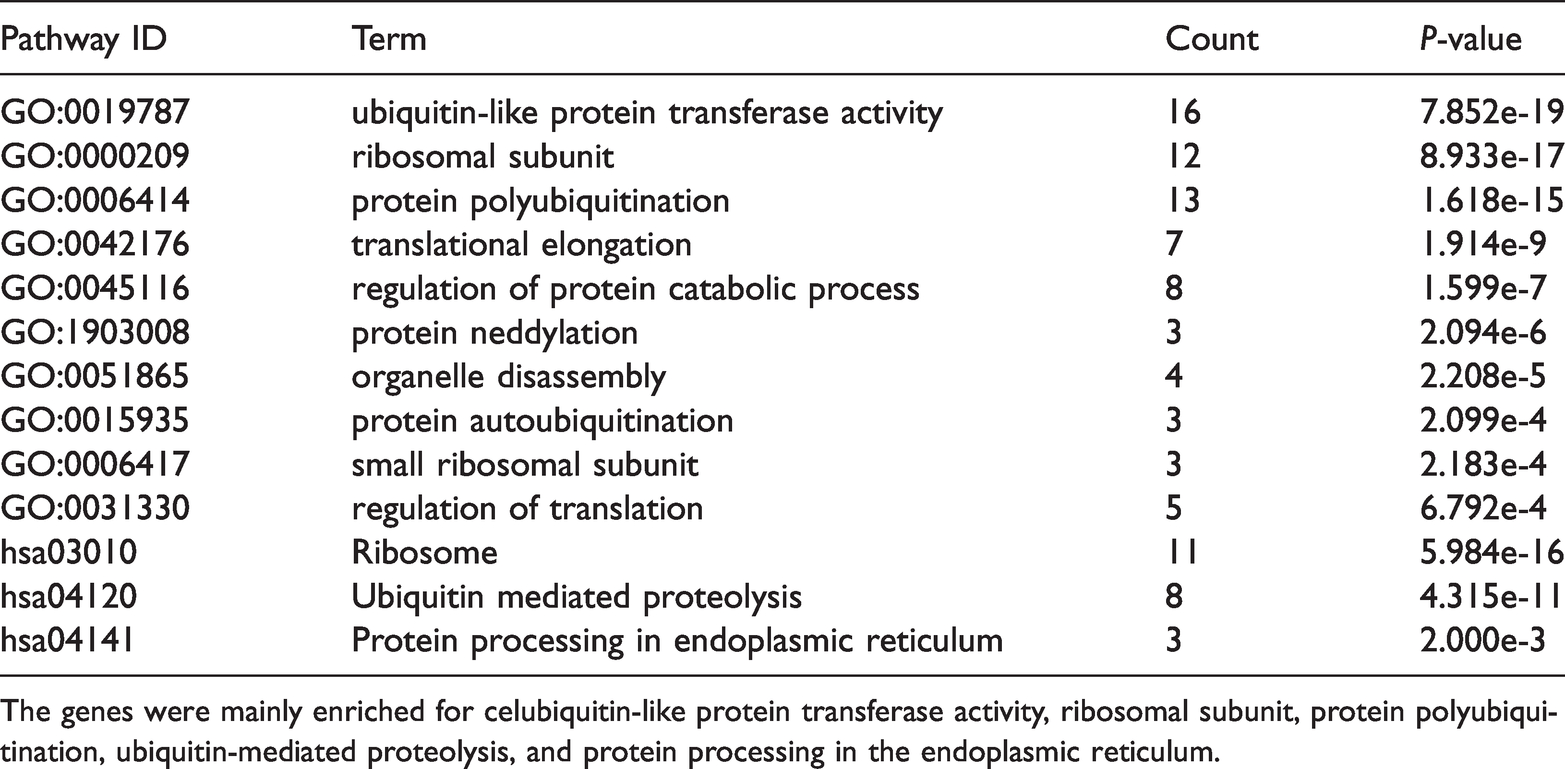
The genes were mainly enriched for celubiquitin-like protein transferase activity, ribosomal subunit, protein polyubiquitination, ubiquitin-mediated proteolysis, and protein processing in the endoplasmic reticulum.
Candidate gene selection and survival analysis
Candidate core genes (24 core genes) were obtained from the results of MCODE and Centiscape above. The co-expression network was generated using cBioPortal (Table 4). Data from TCGA were analyzed with the platform TIMER, which was applied to indicate the expression differences of core genes between PCa and NP tissues. As suggested in Figure 4, the mRNA levels of LON Peptidase N-Terminal Domain And Ring Finger 1 (LONRF1), CDK1, Ring Finger Protein 130 (RNF130), Ribosomal Protein L18A (RPL18A), Mitochondrial ribosomal protein L3 (MRPL3), MRPL13, RPL5, RPL18, RPL9, RPL18A MRPL15, guanine nucleotide-binding protein subunit beta-2-like 1 (GNB2L1/RACK1), RPL18, RPL30, and Protein transport protein Sec61 subunit alpha isoform 1 (SEC61A1) had statistically significant values (P < 0.001). The prognostic values of the core genes based on multiple databases were evaluated with the cBioPortal online tool. As shown in Figure 5, six of the abovementioned 15 candidate core genes with the lowest P-values for both expression and OS results of the above 15 candidate genes demonstrated great prognostic value for PCa patients. Furthermore, we used the Oncomine database to create an overview of core genes in PCa tissues compared with NP tissues (Figure 6).
Interaction network between the hub genes and their co-expression genes using cBioPortal.

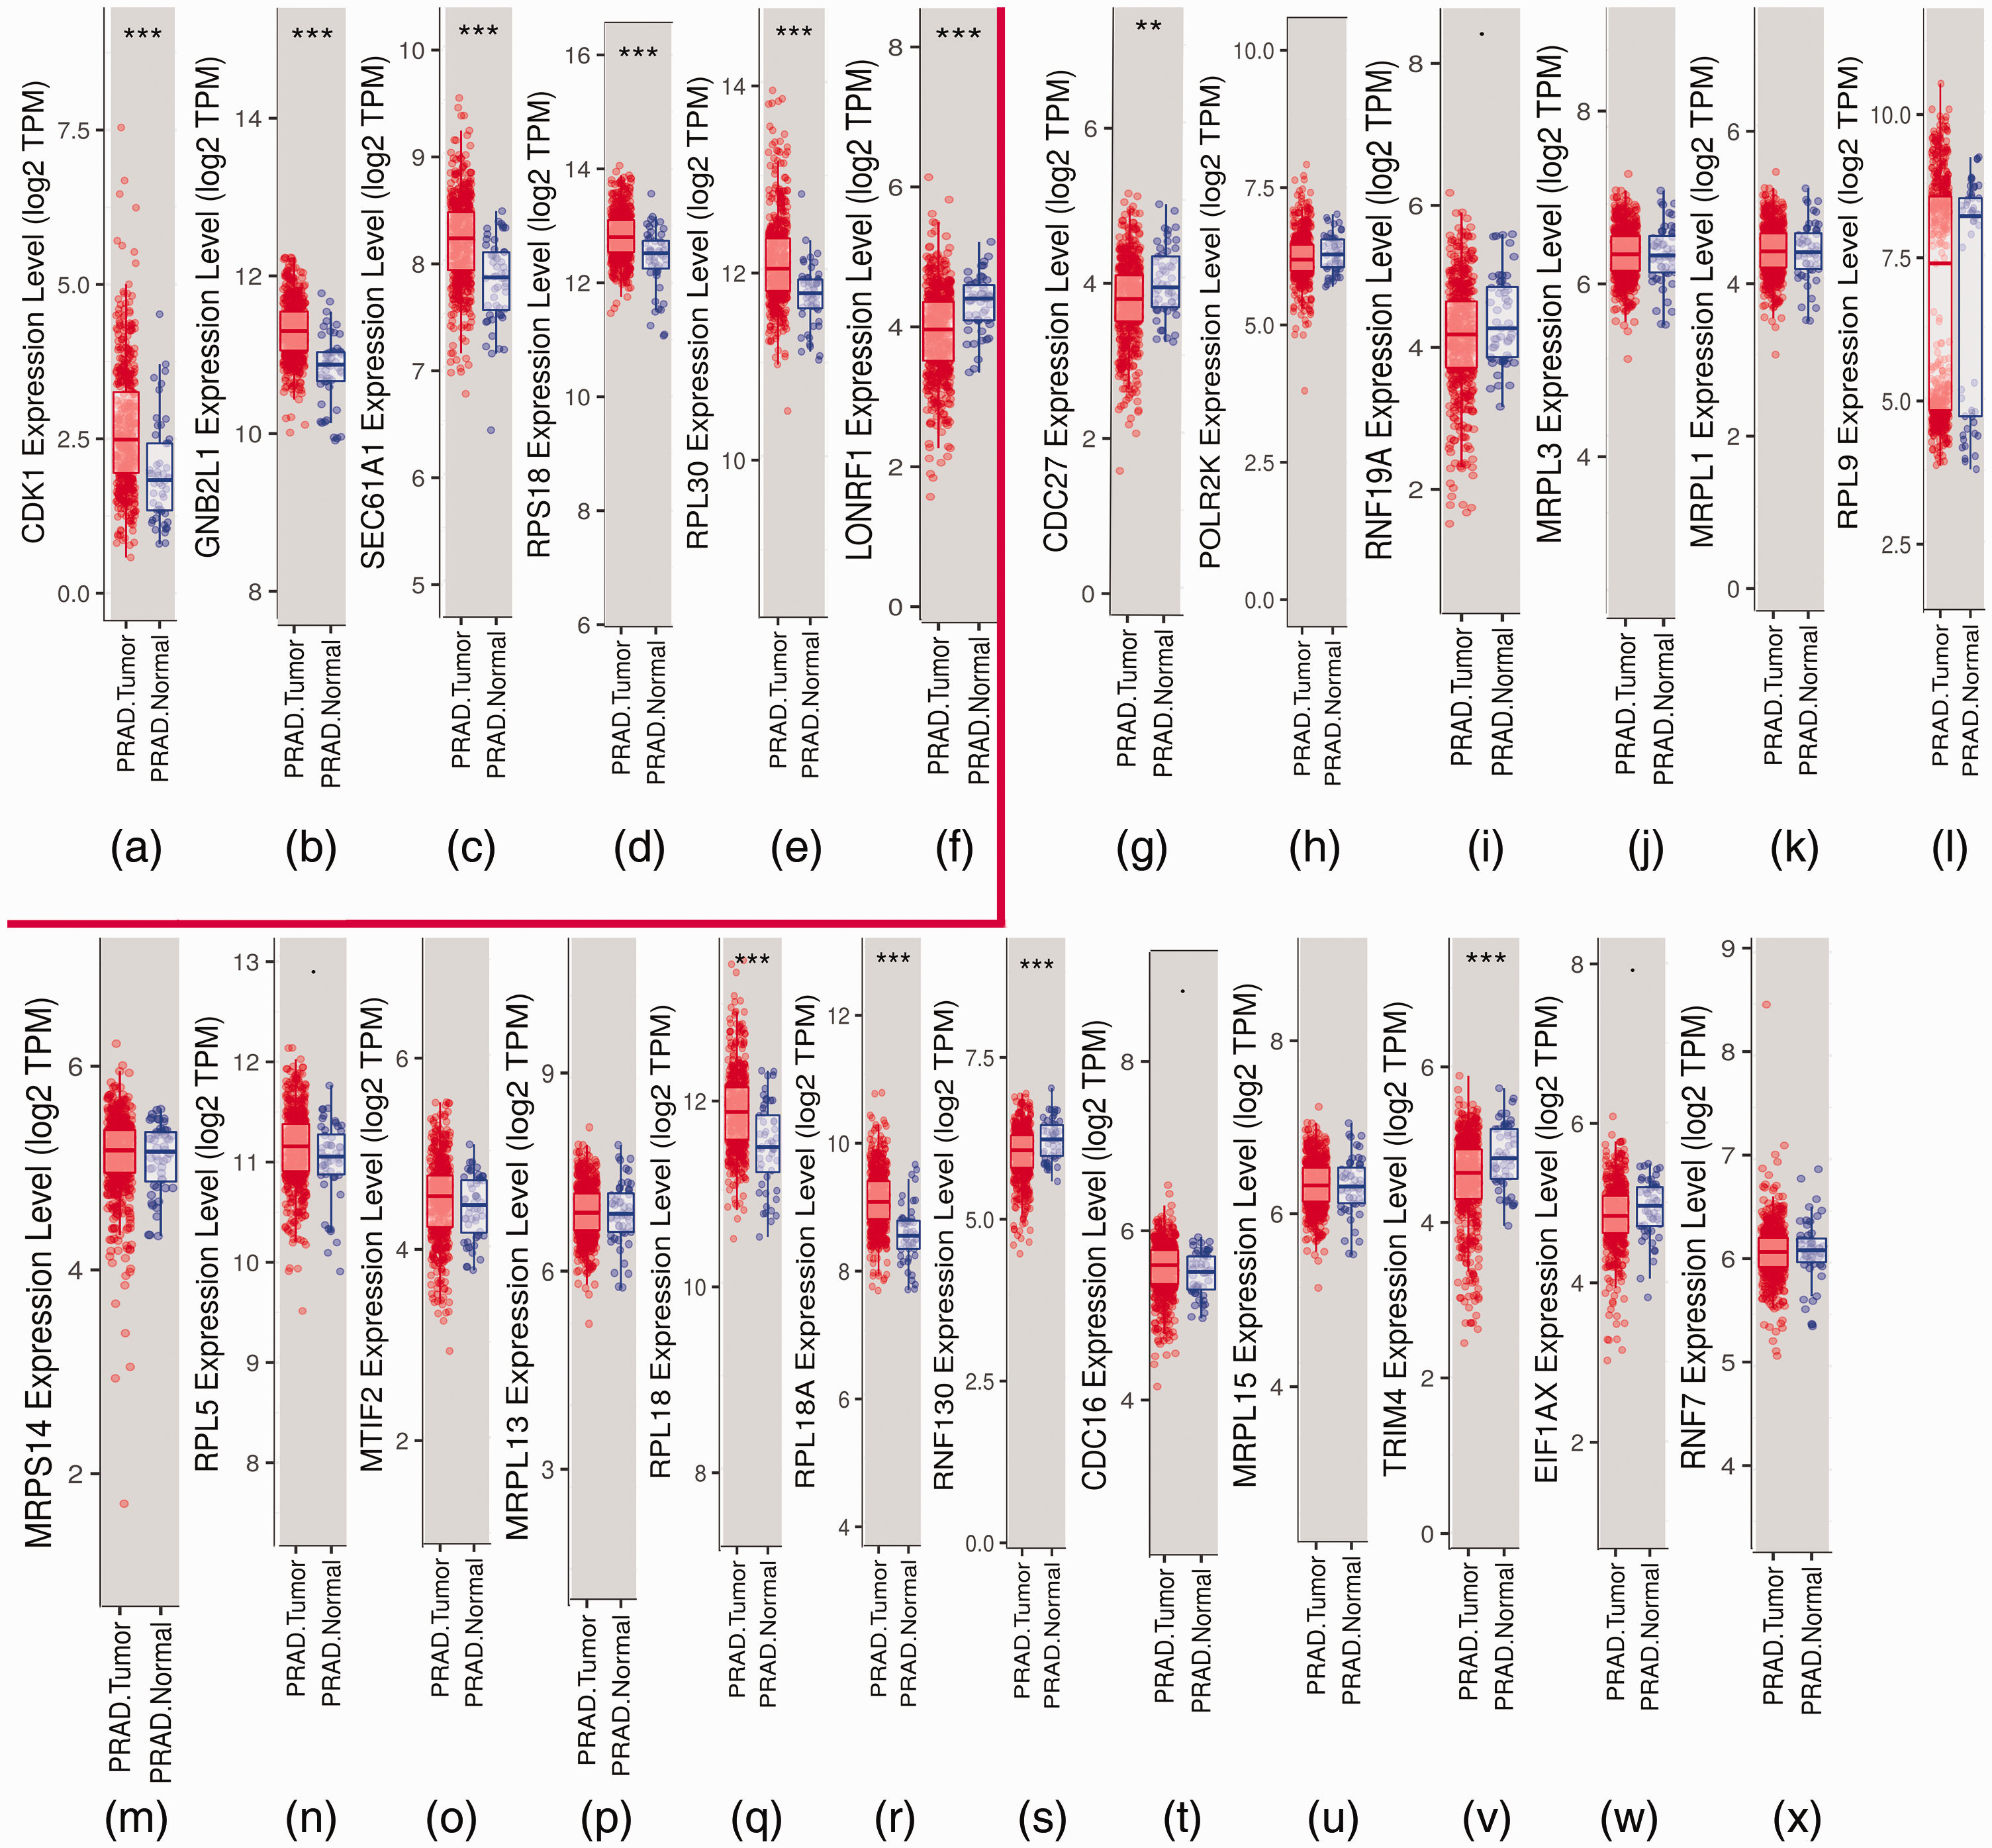
Differential analysis of expression between prostate cancer (PCa) and normal prostate (NP) tissues by Tumor Immune Estimation Resource (TIMER). (a–f) Box plots of core genes (LON Peptidase N-Terminal Domain And Ring Finger 1 (LONRF1), Cyclin Dependent Kinase 1 (CDK1), Ribosomal Protein S18 (RPS18), guanine nucleotide-binding protein subunit beta-2-like 1 (GNB2L1), Ribosomal Protein L30 (RPL30), and Protein transport protein Sec61 subunit alpha isoform 1 (SEC61A1)) presented by TIMER. The six core genes were found to be risk factors in The Cancer Genome Atlas (TCGA) database. (G–X) Box plots of the other 18 candidate genes.

Overall survival analyses of prostate cancer (PCa) patients based on high or low expression of six core genes from multiple databases. Survival curves for (a) Cyclin Dependent Kinase 1 (CDK1), (b) guanine nucleotide-binding protein subunit beta-2-like 1 (GNB2L1), (c) Protein transport protein Sec61 subunit alpha isoform 1 (SEC61A1), (D) Ribosomal Protein S18 (RPS18), (e) Ribosomal Protein L30 (RPL30), and (f) LON Peptidase N-Terminal Domain And Ring Finger 1 (LONRF1), are shown. Log-rank P-values < 0.05 were considered to be statistically significant.

Based on Oncomine data, overviews of mRNA levels of core genes in various types of cancer were constructed. Genes include (a) Cyclin Dependent Kinase 1 (CDK1), (b) guanine nucleotide-binding protein subunit beta-2-like 1 (GNB2L1), (c) Ribosomal Protein L30 (RPL30), (d) Ribosomal Protein S18 (RPS18), (e) Protein transport protein Sec61 subunit alpha isoform 1 (SEC61A1), and (f) LON Peptidase N-Terminal Domain And Ring Finger 1 (LONRF1). Statistically significant mRNA overexpression or low expression of genes are presented in red and blue, respectively. Grid color was determined by the best gene rank percentile for analysis within the grids. The threshold settings: gene rank percentile = top 10%, P = 0.05, and fold change (FC) = All.
Collection of true core genes
Six genes were predicted to be the core factors affecting PCa based on the above analyses. To clarify our predictions on transcriptional and translational levels, HPA databases provided the cases of immunohistochemistry (IHC) 23 , which were applied to verify the differential protein expression of key factors. As suggested in Figure 7, the PCa group showed stronger staining than the NP group for upregulated genes. The reverse was true for the downregulated genes. Furthermore, the Oncomine database was used to identify the mRNA expression differences of core genes between local lesions and metastatic patients. The results indicated that the core genes played a significant role in the carcinogenesis of PCa.
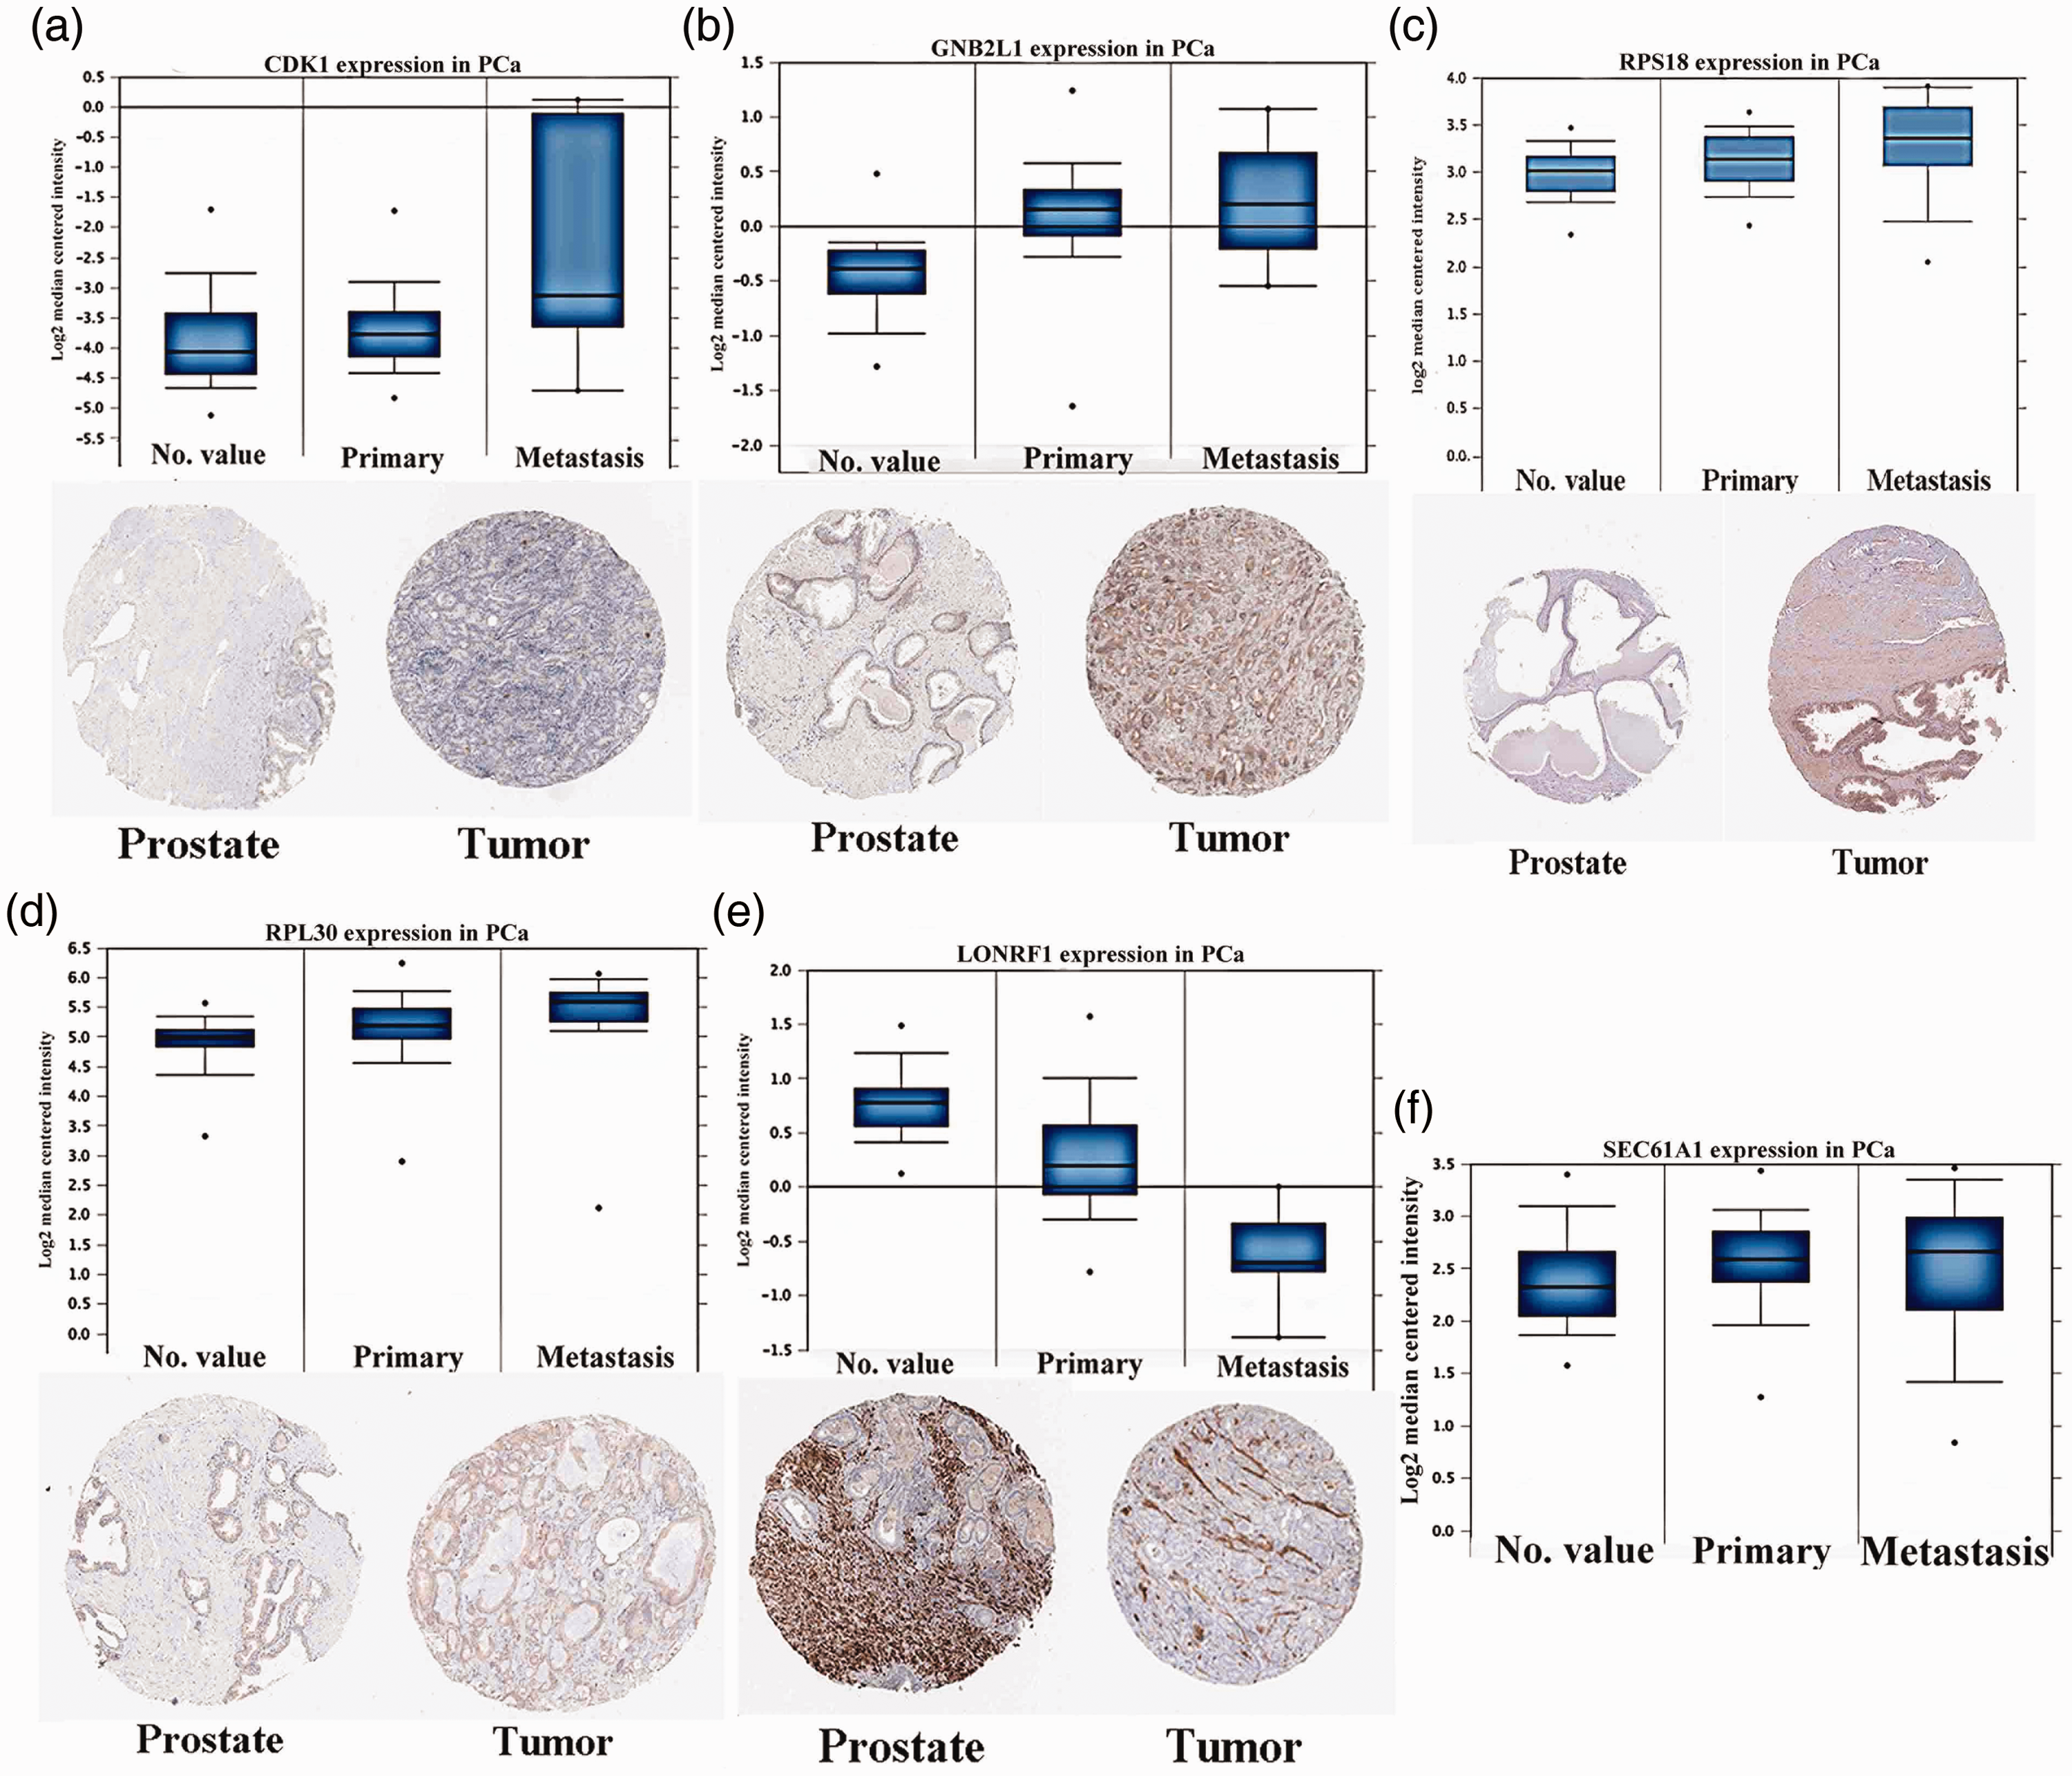
Gene expression of core genes on transcriptional and translational levels. Verification of the expression of core genes on transcriptional and translational level was done with the Oncomine database and the Human Protein Atlas database (immunohistochemistry (IHC)), respectively. Transcriptional data are shown for normal prostate (NP) tissues, primary prostate cancer (PCa) tumors, and metastatic PCa tumors. IHC data are shown for NP tissues and PCa tumors. Genes include (a) Cyclin Dependent Kinase 1 (CDK1), (b) guanine nucleotide-binding protein subunit beta-2-like 1 (GNB2L1), (c) Ribosomal Protein S18 (RPS18), (d) Ribosomal Protein L30 (RPL30), (e) LON Peptidase N-Terminal Domain And Ring Finger 1 (LONRF1), and (f) Protein transport protein Sec61 subunit alpha isoform 1 (SEC61A1).
GSEA, clinical correlation
Using the UALCAN online tool, LONRF1, CDK1, RPL18, GNB2L1 (RACK1), RPL30, and SEC61A1 were determined to have close relationships with patients’ Gleason scores (Figure 8). Generally, as the Gleason score elevated, the expression levels of the core factors also increased. We then observed that ribosome, oxidative phosphorylation, Parkinson’s disease, spliceosome, and Alzheimer’s disease were highly enriched with high expression levels of the six core genes, except for CDK1 (Figure 9). The P-values of the different core genes are shown in Table 5.

Gene expression of core genes represented by different Gleason scores. The gene expression of (a) Cyclin Dependent Kinase 1 (CDK1), (b) guanine nucleotide-binding protein subunit beta-2-like 1 (GNB2L1), (c) Ribosomal Protein L30 (RPL30), (d) Ribosomal Protein S18 (RPS18), (e) Protein transport protein Sec61 subunit alpha isoform 1 (SEC61A1), (f) LON Peptidase N-Terminal Domain And Ring Finger 1 (LONRF1) represented by different Gleason scores. The results were evaluated by variance analysis.

Gene set enrichment analysis (GSEA) of various pathways for core genes. GSEA pathway enrichment analysis of high expression groups of (a) Ribosomal Protein S18 (RPS18), (b) guanine nucleotide-binding protein subunit beta-2-like 1 (GNB2L1), (c) Ribosomal Protein L30 (RPL30), (d) Protein transport protein Sec61 subunit alpha isoform 1 (SEC61A1), (e) LON Peptidase N-Terminal Domain And Ring Finger 1 (LONRF1), and (f) Cyclin Dependent Kinase 1 (CDK1). Pathways with nominal (NOM) P < 0.05 and false discovery rate (FDR) q < 0.06 were considered to be statistically significant.
Gene set enrichment analysis (GSEA) results for core genes in The Cancer Genome Atlas Prostate Adenocarcinoma (TCGA PRAD).

The P-values of the ribosome, oxidative phosphorylation, and Parkinson’s disease for the five core genes are listed.
Discussion
Although several studies on the molecular processes and progression of PCa have been performed, PCa remains a common malignant tumor of the genitourinary system in elderly men. 24 A full understanding of the pathogenesis of PCa remains indeterminate. Thus, it is crucial to explore the underlying biomarkers for clinical treatment of PCa to improve patient outcomes. 25
In this study, 874 (226 upregulated 648 downregulated) DEGs were sorted from the GEO dataset GSE5957. GO/KEGG pathway analyses suggested that the DEGs were enriched for cell cycle, cellular component, and protein localization. The cell cycle progression score (CCP) has been well demonstrated to be better than existing assessments for elucidating the potential aggressiveness of PCa in an individual. 26 Multiple studies have reported that some genes can inhibit cell cycle progression from G0/G1 to S phase, as well as be regulated by certain microRNAs in PCa.27–29 In androgen receptor (AR) signaling, which plays a crucial role in the development and progression of PCa, some RNAs can activate or inactivate AR signaling to inhibit the cell cycle of PCa cells.30,31 Different proteins with various cell localizations can affect PCa tumorigenesis, such as Reticulon 4 (RTN4), 32 which is a reticulon family protein localized in the endoplasmic reticulum. In addition, the overexpression of N-Glycan in PCa is a possible biomarker for diagnosis. 33 Additionally, the hippo pathway, which was found to be enriched by KEGG analysis, has a strong association with regulating PCa development. 34 Furthermore, identification of unknown immune editing components helps prostate tumor cells escape from immune surveillance. 35 Overall, these biological functions and pathways have close correlations with the development and progression of PCa.
A PPI network was constructed with DEGs and a total of 24 candidates with degree ≥ 20 are listed in Table 5. We identified LONRF1, CDK1, RPL18, GNB2L1 (RACK1), RPL30, and SEC61A1 as real core genes by five databases (included TCGA). These genes have significant prognostic value. It is reported that in the absence of interphase CDKs, CDK1 executes all the events that are required to drive cell division, 36 which may lead to the proliferation of cancer cells. Xie et al. 37 indicated that CDK1 controlled mitochondrial metabolism, which plays key roles in the flexible bioenergetics required for tumor cell survival. Furthermore, the overexpression of CDK1 correlates with poor prognosis and metastasis in various adenocarcinomas, such as pancreatic cancer and breast cancer.38,39 Several inhibitors targeting CDK1 have been tested in clinical trials (NCT00141297, NCT00147485, and NCT00292864) for certain human neoplasias. 40 CDK1 is essential for cell migration and accumulating evidence now demonstrates multiple roles for RACK1 (GNB2L1) in regulating migration and invasion of tumor cells. 41 RACK1 has been recognized as an independent biomarker for poor clinical outcome in pancreatic and breast cancers.42,43 In PCa cells, high expression of RACK1 promotes cell growth and metastasis in vivo.41,44 Transient Receptor Potential Cation Channel Subfamily M Member 8 (TRPM8) promotes hypoxic growth of PCa cells via RACK1-mediated stabilization of Hypoxia-inducible factor (HIF)-1α. 45 High expression of RACK1 also leads to PCa cell growth. RPS18 is a type of ribosomal protein that recently has been determined to promote breast cancer metastasis. 46 This protein was first discovered with the structure of RNA in 1991, but there are few studies regarding its molecular functions in cells. Upregulation of RPS18 in PCa has great statistical importance, as indicated by TIMER. However, in the Oncomine database, high expression (Grasso Prostate) and low expression (Tomlins Prostate) of RPS18 both have significant P-values in PCa. Furthermore, we suggest that RPS18 overexpression increases ribosomal content and global translation in PCa cells compared with RPL15. RPL30 maintains cell growth and survival, and it has been associated with outcomes in medulloblastoma. 47 Moreover, methylation of RPL30 downregulated the dysfunction of anti-apoptosis that is involved in non-alcoholic fatty liver disease (NAFLD) and non-alcoholic steatohepatitis (NASH) pathways, which could lead to hepatocarcinogenesis. 48 In head and neck squamous cell carcinoma, RPL30 and other genes 49 were determined as the internal core genes with stable expression. SEC61A1, as a hallmark DNA repair gene, was identified as a potential independent indicator of prognosis in hepatocellular carcinoma in a gene-wide association study. 50 Beyond carcinoma, mutations and loss-of-function of SEC61A1 can cause multiple myeloma and kidney disease.51,52 For LONRF1, the only downregulated gene, there are no existing reports on any correlations with cancer. However, according to the Oncomine data and OS analysis, the significantly high expression of this gene in normal tissue samples has great prognostic value. Consequently, there is much potential for research on whether four genes (RPS18, RPL30, SEC61A1, and LONRF1) play a key role in the pathogenesis of PCa. As for CDK1, one study based on the GEO single database indicated that CDK1 levels were significantly higher in PCa tissues compared with normal tissues. 53
CDC27, POLR2K, RNF19A, and RNF7 were several of the 20 candidate genes that were demonstrated to be risk factors of PCa. For CDC27, reports found that the novel CDC27-OAT gene fusion was present in PCa patients. 54 CDC27 has not previously been reported to be significantly mutated in PCa. Such a mutation landscape suggests that investigating the biological functions of these cancer cells is quite important. 55 Additionally, POLR2K and APT6V1A were screened out between PCa tissues and normal tissues as novel DEGs. They both play important roles in supporting other pathways that facilitate tumor growth. 56 In our study, we also found that POLR2K and EIF1AX had significant prognostic value for OS (Supplementary Figure) of PCa. RNF19A was identified as an RNA transcript that is present at significantly higher levels in the blood of PCa patients compared with healthy controls and is a potential clinically relevant biomarker for PCa early detection. 57 RNF7 was originally identified as a redox-inducible antioxidant protein. 58 One study demonstrated that RNF7 knockdown inhibited PCa cell proliferation and tumorigenesis, suggesting that RNF7 may be a promising target for PCa treatment. 7
In our present study, we identified LONRF1, CDK1, RPL18, GNB2L1 (RACK1), RPL30, and SEC61A1 as crucial components in the diagnosis and treatment of PCa. Research into the associations between molecules in ribosome, oxidative phosphorylation, Parkinson’s disease, spliceosome, and Alzheimer’s disease could reveal the underlying causes of cancer and provide novel ideas for identifying target drugs.
Conclusion
Through bioinformatic analyses including GO/KEGG enrichment, PPI networks, core gene identification and validation, module analysis, and GSEA, the present study qualified LONRF1, CDK1, RPS18, GNB2L1 (RACK1), RPL30, and SEC61A1 as sufficient and reliable molecular biomarkers for the diagnosis of PCa. More experimental studies are needed, however, to verify the mechanisms of these genes in PCa.
Supplemental Material
sj-pdf-1-imr-10.1177_03000605211016624 - Supplemental material for Identification of crucial genes and pathways associated with prostate cancer in multiple databases
Supplemental material, sj-pdf-1-imr-10.1177_03000605211016624 for Identification of crucial genes and pathways associated with prostate cancer in multiple databases by Hanxu Guo, Zhichao Zhang, Yuhang Wang and Sheng Xue in Journal of International Medical Research
Footnotes
Declaration of conflicting interest
The authors declare that there is no conflict of interest.
Funding
The authors disclosed receipt of the following financial support for the research, authorship, and/or publication of this article: This study was funded by Major Online Teaching Reform Program of Bengbu Medical College (No. 2020zdxsjg006) and National University Student Innovation Experimental Project (No. 202010367035).
Supplemental material
Supplementary material for this article is available online.
References
Supplementary Material
Please find the following supplemental material available below.
For Open Access articles published under a Creative Commons License, all supplemental material carries the same license as the article it is associated with.
For non-Open Access articles published, all supplemental material carries a non-exclusive license, and permission requests for re-use of supplemental material or any part of supplemental material shall be sent directly to the copyright owner as specified in the copyright notice associated with the article.