
Abstract
Objective
Clinicians cannot precisely determine the time for withdrawal of ventilation. We aimed to evaluate the performance of driving pressure (DP)×respiratory rate (RR) to predict the outcome of weaning.
Methods
Plateau pressure (Pplat) and total positive end-expiratory pressure (PEEPtot) were measured during mechanical ventilation with brief deep sedation and on volume-controlled mechanical ventilation with a tidal volume of 6 mL/kg and a PEEP of 0 cmH2O. Pplat and PEEPtot were measured by patients holding their breath for 2 s after inhalation and exhalation, respectively. DP was determined as Pplat minus PEEPtot. The rapid shallow breathing index was measured from the ventilator. The highest RR was recorded within 3 minutes during a spontaneous breathing trial. Patients who tolerated a spontaneous breathing trial for 1 hour were extubated.
Results
Among the 105 patients studied, 44 failed weaning. During ventilation withdrawal, DP×RR was 136.7±35.2 cmH2O breaths/minute in the success group and 230.2±52.2 cmH2O breaths/minute in the failure group. A DP×RR index >170.8 cmH2O breaths/minute had a sensitivity of 93.2% and specificity of 88.5% to predict failure of weaning.
Conclusions
Measurement of DP×RR during withdrawal of ventilation may help predict the weaning outcome. A high DP×RR increases the likelihood of weaning failure.
Keywords
Introduction
Weaning from mechanical ventilation (MV) should be initiated as soon as the factors that cause respiratory failure are removed. However, even with the spontaneous breathing trial (SBT) being used worldwide, more than 10% of extubations fail. 1 There are many weaning parameters, such as tracheal airway occlusion pressure at 0.1 s (P 0.1), 2 the rapid shallow breathing index (RSBI), 3 respiratory compliance, respiratory rate (RR), oxygenation, and maximum inspiratory pressure index. 4 Most importantly, the RSBI appears to be the most substantial single parameter for predicting weaning success with a positive predictive value, negative predictive value, sensitivity, and specificity of 0.86, 0.82, 0.87±0.14, and 0.52±0.26, respectively. 3 Nonetheless, this index has low specificity. At present, clinicians have difficulty in choosing accurate timing for withdrawal of MV.
Airway driving pressure (DP) represents the cyclic strain that is related to a change in volume. Usually, this is a physiological means of adjusting tidal volume (Vt) to the residual lung size (respiratory system compliance). There is a linear relationship between a decrease in compliance and a decrease in functional residual capacity. A high DP impairs diaphragmatic function 5 and increases mortality.6,7 Pressure applied to increase a change in volume reflects respiratory workload, while affecting the outcome of weaning. 8 Therefore, DP and work are associated with weaning outcome. Various observational studies have shown an association between lung injury or mortality and mechanical power.9,10 The following formula can be calculated for power: pressure×volume/time= power. 11 DP and work are important elements of mechanical power. Combined with unit time, power can reflect the respiratory load and endurance of better breathing. In this study, we aimed to identify a new parameter to improve the accuracy and precision of weaning. We postulated that DP×RR could be a predictor of weaning in patients with respiratory failure. To assess the predictive value, we performed an observational trial to investigate the utility of this index during weaning from MV to predict weaning outcomes.
Methods
Patients
This study was performed between March 2017 and February 2020 in the Affiliated Changshu Hospital of Xuzhou Medical University. All of the patients were recruited from the medical intensive care unit. Participants were enrolled into the study when they were ready for weaning from MV. Before the study, ethical approval for this study was obtained from the ethics committee of the Affiliated Changshu Hospital of Xuzhou Medical University (ID number: 0056-2017). All of the patients or their relatives gave written informed consent before the investigation.
Selection of patients
Inclusion criteria included age ≥18 years and MV for longer than 24 hours. The readiness of the patients for weaning was largely dependent on their ability to meet all of the following criteria: arterial oxygen pressure/fraction of inspired oxygen >200 mmHg, using a positive end-expiratory pressure (PEEP) ≤5 cmH2O and fraction of inspired oxygen ≤0.4, stable hemodynamics (heart rate ≤140 beats/minute, absence or low-dose vasopressors required [i.e., dopamine or dobutamine < 5–10 ug/kg/minute]), conscious state (Glasgow coma scale score ≥13), stable metabolism (i.e., acceptable electrolyte levels), effectiveness of cough strength (positive white card test result), and in the recovery stage of disease.
Exclusion criteria
Exclusion criteria included age < 18 years, MV for shorter than 24 hours, pregnancy, end-stage tumor, neuromuscular disease, presence of pneumothorax, flail chest, large pleural effusion, presence of severe deformity, obesity (body mass index >30 kg/m2), organ failure before weaning, and lack of informed consent.
Study design
Patients who met the inclusion criteria were injected intravenously with remifentanil 0.2 mg for brief deep sedation. Next, when patients were awakened, they were placed on triggering assisted breaths on MV with a Vt of 6 mL/kg of ideal body weight and a PEEP of 0 cmH2O. Respiratory mechanical parameters (Pplat and total PEEP [PEEPtot]) were recorded. Pplat and PEEPtot were measured by holding the breath for 2 s after inhalation and exhalation, respectively. DP was measured as Pplat minus PEEPtot. The treating physician evaluated each case individually. When the study participants were determined as ready for an SBT with the intent of weaning, respiratory frequency divided by Vt (RSBI) was measured from a digital ventilator (pressure support: 5 cmH2O; PEEP: 0 cmH2O) during MV. Each participant was then disconnected from the ventilator to perform the SBT for 1 hour using a T piece with oxygen supplementation (fraction of inspired oxygen: 0.25–0.5) to achieve a pulse oxygen saturation >90%. Attending physicians who were not involved in this study obtained the maximal RR by an electrocardiographic monitor (PHILIPS IntelliVue MP30; Philips Medizin Systeme Boeblingen GmbH, Boeblingen, Germany) during the 3-minute SBT and recorded it in progress note. DP×RR was then calculated by an investigator. Notably, patients who passed the 1-hour SBT were extubated, while other patients were reconnected to the ventilator using the previous ventilatory parameters if they failed the SBT. The decision to continue with the SBT, and use of noninvasive ventilation or reintubation after extubation was left to the discretion of attending physicians who were not allowed to know the research indicators.
Signs of intolerance for the SBT were as follows: (1) RR >35 or < 8 breaths/minute; (2) heart rate >140 beats/minute or a 20% increase or decrease from baseline; (3) systolic blood pressure >160 mmHg or < 90 mmHg; (4) arterial blood oxygen saturation < 90%; and (5) sweating, agitation, and a decreased level of consciousness.
Definition of weaning failure
Patients who failed the SBT, or required reintubation or noninvasive ventilation within 48 hours of discontinuation of MV were considered as having failed to wean. 12
Statistical analysis
Normally distributed continuous variables are expressed as mean with standard deviation. Variables were compared with the Student’s t test for independent samples. Non-normally distributed continuous variables were compared using the Mann–Whitney U test, 13 while categorical variables were compared with the chi-square test or correction of continuity. Receiver operating characteristic (ROC) curve analysis was performed to assess the capability of DP×RR, DP, and the RSBI to predict patients who may succeed or fail at weaning. Statistical analysis was performed with Statistical Package for Social Sciences (SPSS) 17.0 software (SPSS, Chicago, IL, USA). A P value < 0.05 was chosen to indicate the statistical significance.
Results
During the study period, 105 patients were recruited and 44 of them failed to be weaned (failure group). Twenty-eight of 44 of the patients failed to be weaned after 1 hour of the SBT. Five patients in the failure group were reintubated within 48 hours of extubation. The remaining 11 patients were initiated on noninvasive ventilation within 48 hours of extubation either preemptively or as rescue therapy. Importantly, 61 patients were successfully weaned (success group) (Figure 1). The mean (standard deviation) age of the study cohort was 67.5±13.6 years and 77 (73.3%) were men. The characteristics of the patients are summarized in Table 1. Age, sex, and the Acute Physiology and Chronic Health Evaluation II score were not significantly different between the two groups. The duration of ventilation and length of stay in the intensive care unit were significantly longer in the failure group than in the success group (both P < 0.0001) (Table 1).
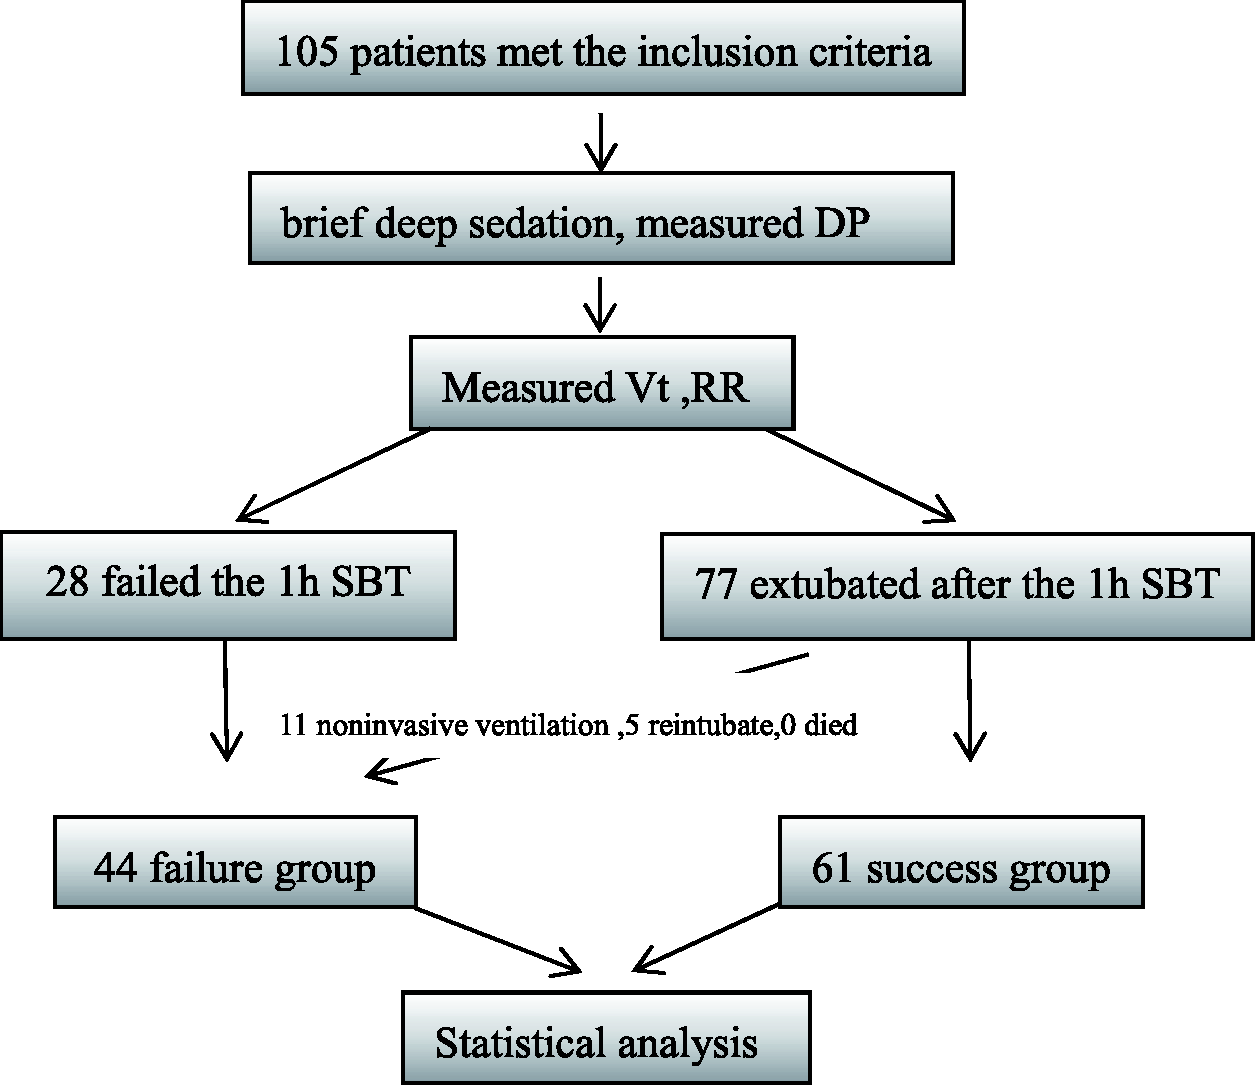
Flowchart of the study.
Patients’ characteristics.
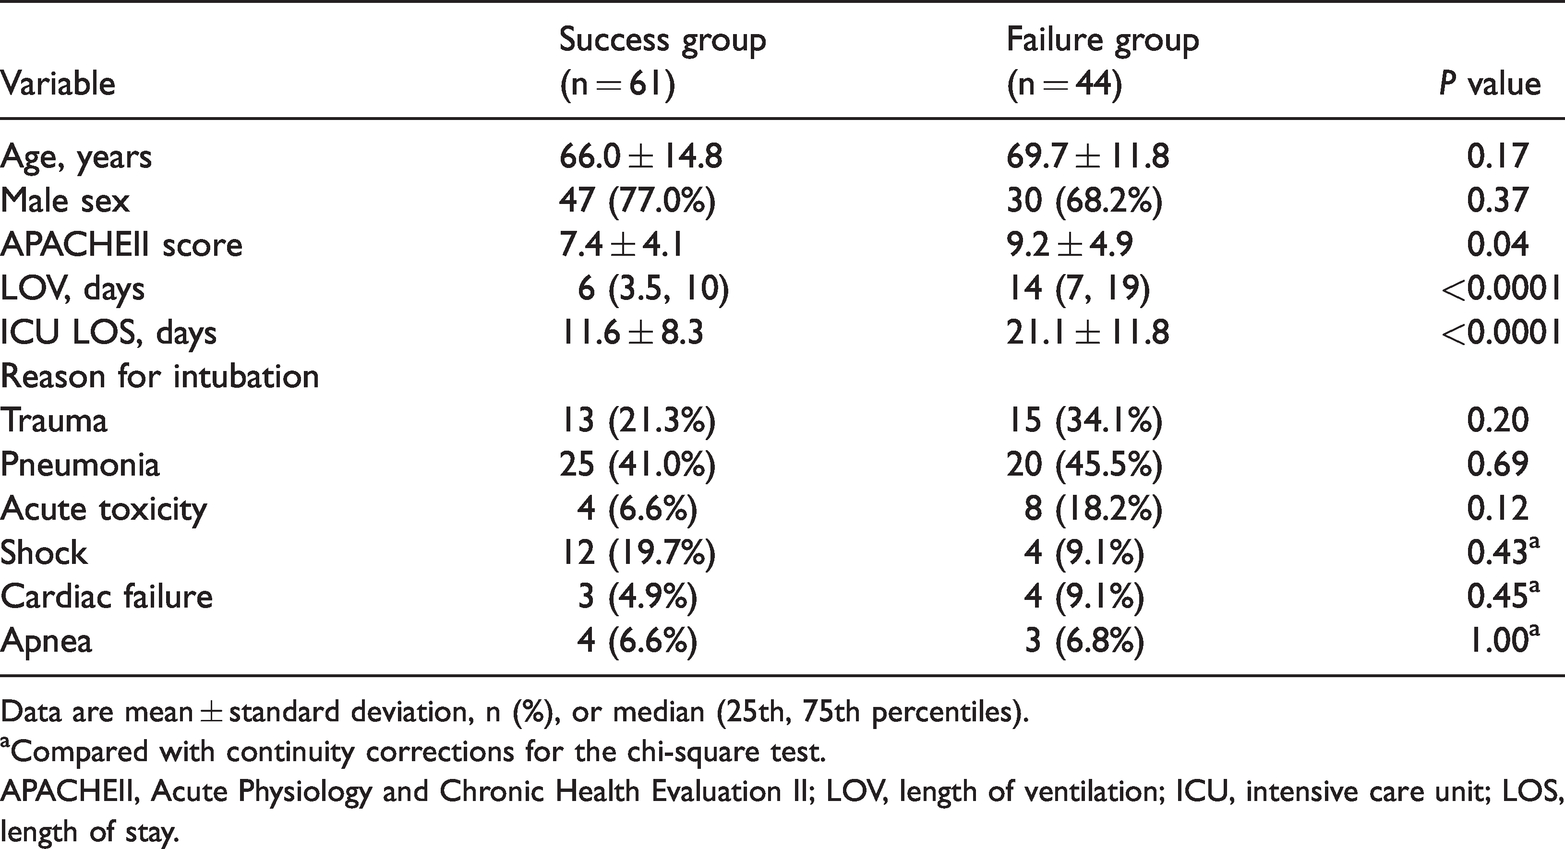
Data are mean ± standard deviation, n (%), or median (25th, 75th percentiles).
aCompared with continuity corrections for the chi-square test.
APACHEII, Acute Physiology and Chronic Health Evaluation II; LOV, length of ventilation; ICU, intensive care unit; LOS, length of stay.
Patients in the failure group had a significantly higher DP×RR (P < 0.0001) and DP (P < 0.0001) compared with the success group (Table 2). The RSBI was significantly higher in the failure group than in the success group (P < 0.0001).
Comparison of mean DP×RR, DP, and the RSBI between the two groups.

Data are mean ± standard deviation.
DP, driving pressure; RR, respiratory rate; RSBI, rapid shallow breathing index.
A DP×RR index >170.8 cmH2O breaths/minute had a sensitivity of 93.2% and a specificity of 88.5% for determining failure of weaning (area under the curve [AUC], 0.948). A DP index >8.2 cmH2O showed a sensitivity of 81.8% and specificity of 60.7% (AUC, 0.731). An RSBI index >92.5 breaths/minute/liter showed a sensitivity of 84.1% and a specificity of 75.4% (AUC, 0.842) (Table 3, Figure 2).
Prediction of weaning failure.

PPV, positive predictive value; NPV, negative predictive value; DP, driving pressure; RR, respiratory rate; RSBI, rapid shallow breathing index.

Receiver operating characteristic curve for the DP×RR index, DP, and the RSBI. The AUC for DP×RR was 0.948 (95% CI 0.91–0.99, P<0.0001). The AUC for DP was 0.731 (95% CI 0.63–0.83, P<0.0001). The AUC for the RSBI was 0.842 (95% CI 0.77–0.92, P<0.0001).
Discussion
In our study, the DP×RR index was greater in patients who failed weaning compared with those who were successfully extubated from MV. The DP×RR index showed higher sensitivity and specificity than the RSBI index. The RSBI has limitations, including a mean RSBI value < 105 in patients who fail to be weaned. 14
DP is defined as the amount of cyclic parenchymal deformation imposed on ventilated and preserved lung units. 6 DP is able to be measured at the bedside and may serve as a marker of cyclic lung strain. 15 Mathematically, Vt/system compliance is DP (i.e., applied pressure above PEEP to deliver Vt). 16 Patients who fail to be withdrawn from a ventilator machine are more likely to have persistent lung opacities and cardiac insufficiency, characterized by high DP and poor lung compliance.
In our study, the DP×RR index, DP, and RSBI were significantly greater in the failure group compared with the success group. Imbalance between respiratory energy load and muscle function contribute to failure of weaning from ventilation. Several mechanisms may be involved in this process, such as alterations in airway resistance, respiratory system compliance, intrinsic PEEP, and increased additional work (mechanism or intubation), which are associated with excessive respiratory load. The alternative contribution of each factor affects the energy load. Notably, most of the patients in our study who were ready to withdraw after meeting the standard had their high airway resistance relieved. Therefore, respiratory system compliance mainly affected the respiratory load. In the case of poor thoracic or pulmonary compliance, when a patient changed from MV to the SBT, the elastic load and DP of the patient increased and weaning failed. Additionally, when the patient’s primary disease did not improve, the respiratory load was high and the patient’s respiratory frequency increased during the SBT. This finding indicated that respiratory endurance was insufficient to balance the patient’s respiratory load. 17 As a result, the patient could not maintain a stable breath, while the final result was also failure to withdraw from the ventilator.
We found that the DP×RR index had higher sensitivity and specificity than DP and the RSBI for predicting weaning failure. Weaning is a complex process involving transition from ventilatory support to spontaneous breathing. Any single parameter cannot adequately guide weaning A more global perspective that combines DP and RR not only reflects respiratory system compliance, but also the capacity to perform work (energy) and the intensity of energy application (power). Actually, pressure, Vt, and RR are considered as the patient’s respiratory power, which is affected by excessive respiratory load. Under similar conditions of flow and volume, a change in transpulmonary pressure is similar between controlled MV and pressure support ventilation. 18 There is a close association between DP and transpulmonary pressure during MV. During the brief pre-SBT period of controlled MV, all patients in our study received the same Vt. Therefore, DP×RR could be referred to as respiratory power of patients while being affected by excessive respiratory load. When the required pressure to produce a fixed volume is high, the work rate is increased. When the RR is increased, work per unit time is high coupled with high power, indicating that the patient is more likely to fail to withdraw from MV.
This study has some limitations. Different etiologies were studied together, which increased the heterogeneity of the study. Despite this limitation, the DP×RR index was significantly greater in the failure group compared with the success group. Another limitation is a lack of generalizability of this study because we did not include patients with obesity (a growing part of the population) and patients with organ failure (many intensive care unit patients). This was also a single-center study. Additionally, failure of the SBT was included in the definition of withdrawal failure from a ventilator. Therefore, our results were greatly affected by the RR in the SBT. Observation of weaning outcomes does not mean that an intervention targeted at achieving that profile will accurately determine the timing of weaning. Therefore, the DP×RR index needs to be validated in further clinical trials.
Conclusion
The DP×RR index may serve as a novel method to predict the outcome of weaning. A greater DP×RR index is predictive of failed weaning. This index could be helpful for how physicians assess weaning readiness in critically ill patients. Because of the complexity of factors that determine the outcome of weaning, the DP×RR index serves as a good predictor, but it may be imperfect. Therefore, further evidence on this index is required to validate our findings.
Supplemental Material
sj-xlsx-1-imr-10.1177_03000605211010045 - Supplemental material for Product of driving pressure and respiratory rate for predicting weaning outcomes
Supplemental material, sj-xlsx-1-imr-10.1177_03000605211010045 for Product of driving pressure and respiratory rate for predicting weaning outcomes by Ju Gong, Bibo Zhang, Xiaowen Huang, Bin Li and Jian Huang in Journal of International Medical Research
Footnotes
Acknowledgements
We thank all critical care fellows and nurses for their clinical assistance. We also thank the experts at International Medical Research for reviewing our manuscript.
Availability of data and materials
The datasets used and/or analyzed during the current study are available from the corresponding author on reasonable request.
Declaration of conflicting interest
The authors declare that there is no conflict of interest.
Funding
The authors disclosed receipt of the following financial support for the research, authorship, and/or publication of this article: This work was supported by the Science and Education and Science and Technology Project of Suzhou City (KJXW2017064).
Supplementary information
Datasets containing original data of DP, the RR, the RSBI, and patients’ information are presented in a spreadsheet file, which is attached to this article as supplementary material.
References
Supplementary Material
Please find the following supplemental material available below.
For Open Access articles published under a Creative Commons License, all supplemental material carries the same license as the article it is associated with.
For non-Open Access articles published, all supplemental material carries a non-exclusive license, and permission requests for re-use of supplemental material or any part of supplemental material shall be sent directly to the copyright owner as specified in the copyright notice associated with the article.