
Abstract
Objective
To evaluate temporal lung changes in coronavirus disease 2019 (COVID-19) in high-resolution computed tomography (HRCT) and to determine the appropriate computed tomographic (CT) follow-up time.
Methods
Eighty-six patients with two or more HRCT scans who were diagnosed with COVID-19 were included. The CT score and major CT findings were evaluated.
Results
Eighty-two (95.3%) patients had lesions on the initial HRCT scans. Most scans showed bilateral, multifocal lung lesions, with multiple lobes involved and diffuse distribution. For fifty-seven patients with type I (progress compared with the initial CT score), the CT score reached a peak at 12 days and the nadir at 36 days. For twenty-nine patients with type II (no progress compared with the initial CT score), the lowest CT score was reached at 23 days. On the final HRCT scans (>21 days), patients with a reticular pattern were older than those without a reticular pattern.
Conclusion
The appropriate follow-up time of CT scans is during the second week (approximately 12 days) and the fourth to fifth weeks (approximately 23–36 days) from the onset of illness. These times could help reduce the CT radiation dose and show timely changes in the course of the disease by CT.
Introduction
Beginning in December 2019 in Wuhan City, Hubei Province, China reported a series of unexplained cases of pneumonia, which were initially related to exposure of the Wuhan South China Seafood Wholesale Market. 1 This pneumonia was then found to be a new acute viral respiratory disease (coronavirus disease 2019 [COVID-19]), which was caused by a new coronavirus (severe acute respiratory syndrome coronavirus-2 [SARS-CoV-2]). 2 Similar to other coronaviral pneumonias, such as severe acute respiratory syndrome caused by coronavirus and Middle East respiratory syndrome coronavirus, COVID-19 can also lead to acute respiratory distress syndrome.1,3,4 On the basis of the current epidemic, COVID-19 was more infectious than SARS-CoV. 2 By 19:42 on 17 March 2020, 81,135 confirmed cases of COVID-19 and 3231 deaths had been reported in China. Except for China, 104,089 confirmed cases of COVID-19 and 4184 deaths had been reported in 157 countries and regions. With the gradual recognition of COVID-19 pneumonia, professional consensus, guidelines, and criteria have steadily been established for the purpose of preventing transmission and facilitating diagnosis and treatment. 4 In this process, computed tomography (CT) had become the main screening and reviewing method for COVID-19 pneumonia because of its high specificity and sensitivity. 5 However, owing to the radiation effect of CT, the increased number of screening and reexamination times, and the greater radiation dose to the human body, this might cause different degrees of sequelae, such as cancer. 6
The present study aimed to examine the changes in chest CT manifestations of this pneumonia from the onset of initial symptoms to various time points in outpatients with COVID-19 pneumonia in Wuhan, China. We also aimed to examine the relationship between the time from the onset of initial symptoms and changes in the CT score, and then to determine the appropriate CT follow-up time.
Patients and methods
Patients
This study was approved by the Institutional Review Board (IRB) of Tongji Hospital, Tongji Medical College, Huazhong University of Science and Technology (IRB ID: TJ-C0200108). The study was performed in accordance with the 1964 Helsinki Declaration and its later amendments or comparable ethical standards. Written informed consent was obtained from all patients in this retrospective study. Anonymous data were collected and analyzed to facilitate better clinical decisions and treatment.
Patients with COVID-19 pneumonia in the outpatient clinic were enrolled retrospectively from 14 January to 16 March 2020 in this single-center study. A flow chart of the selection criteria is shown in Figure 1.
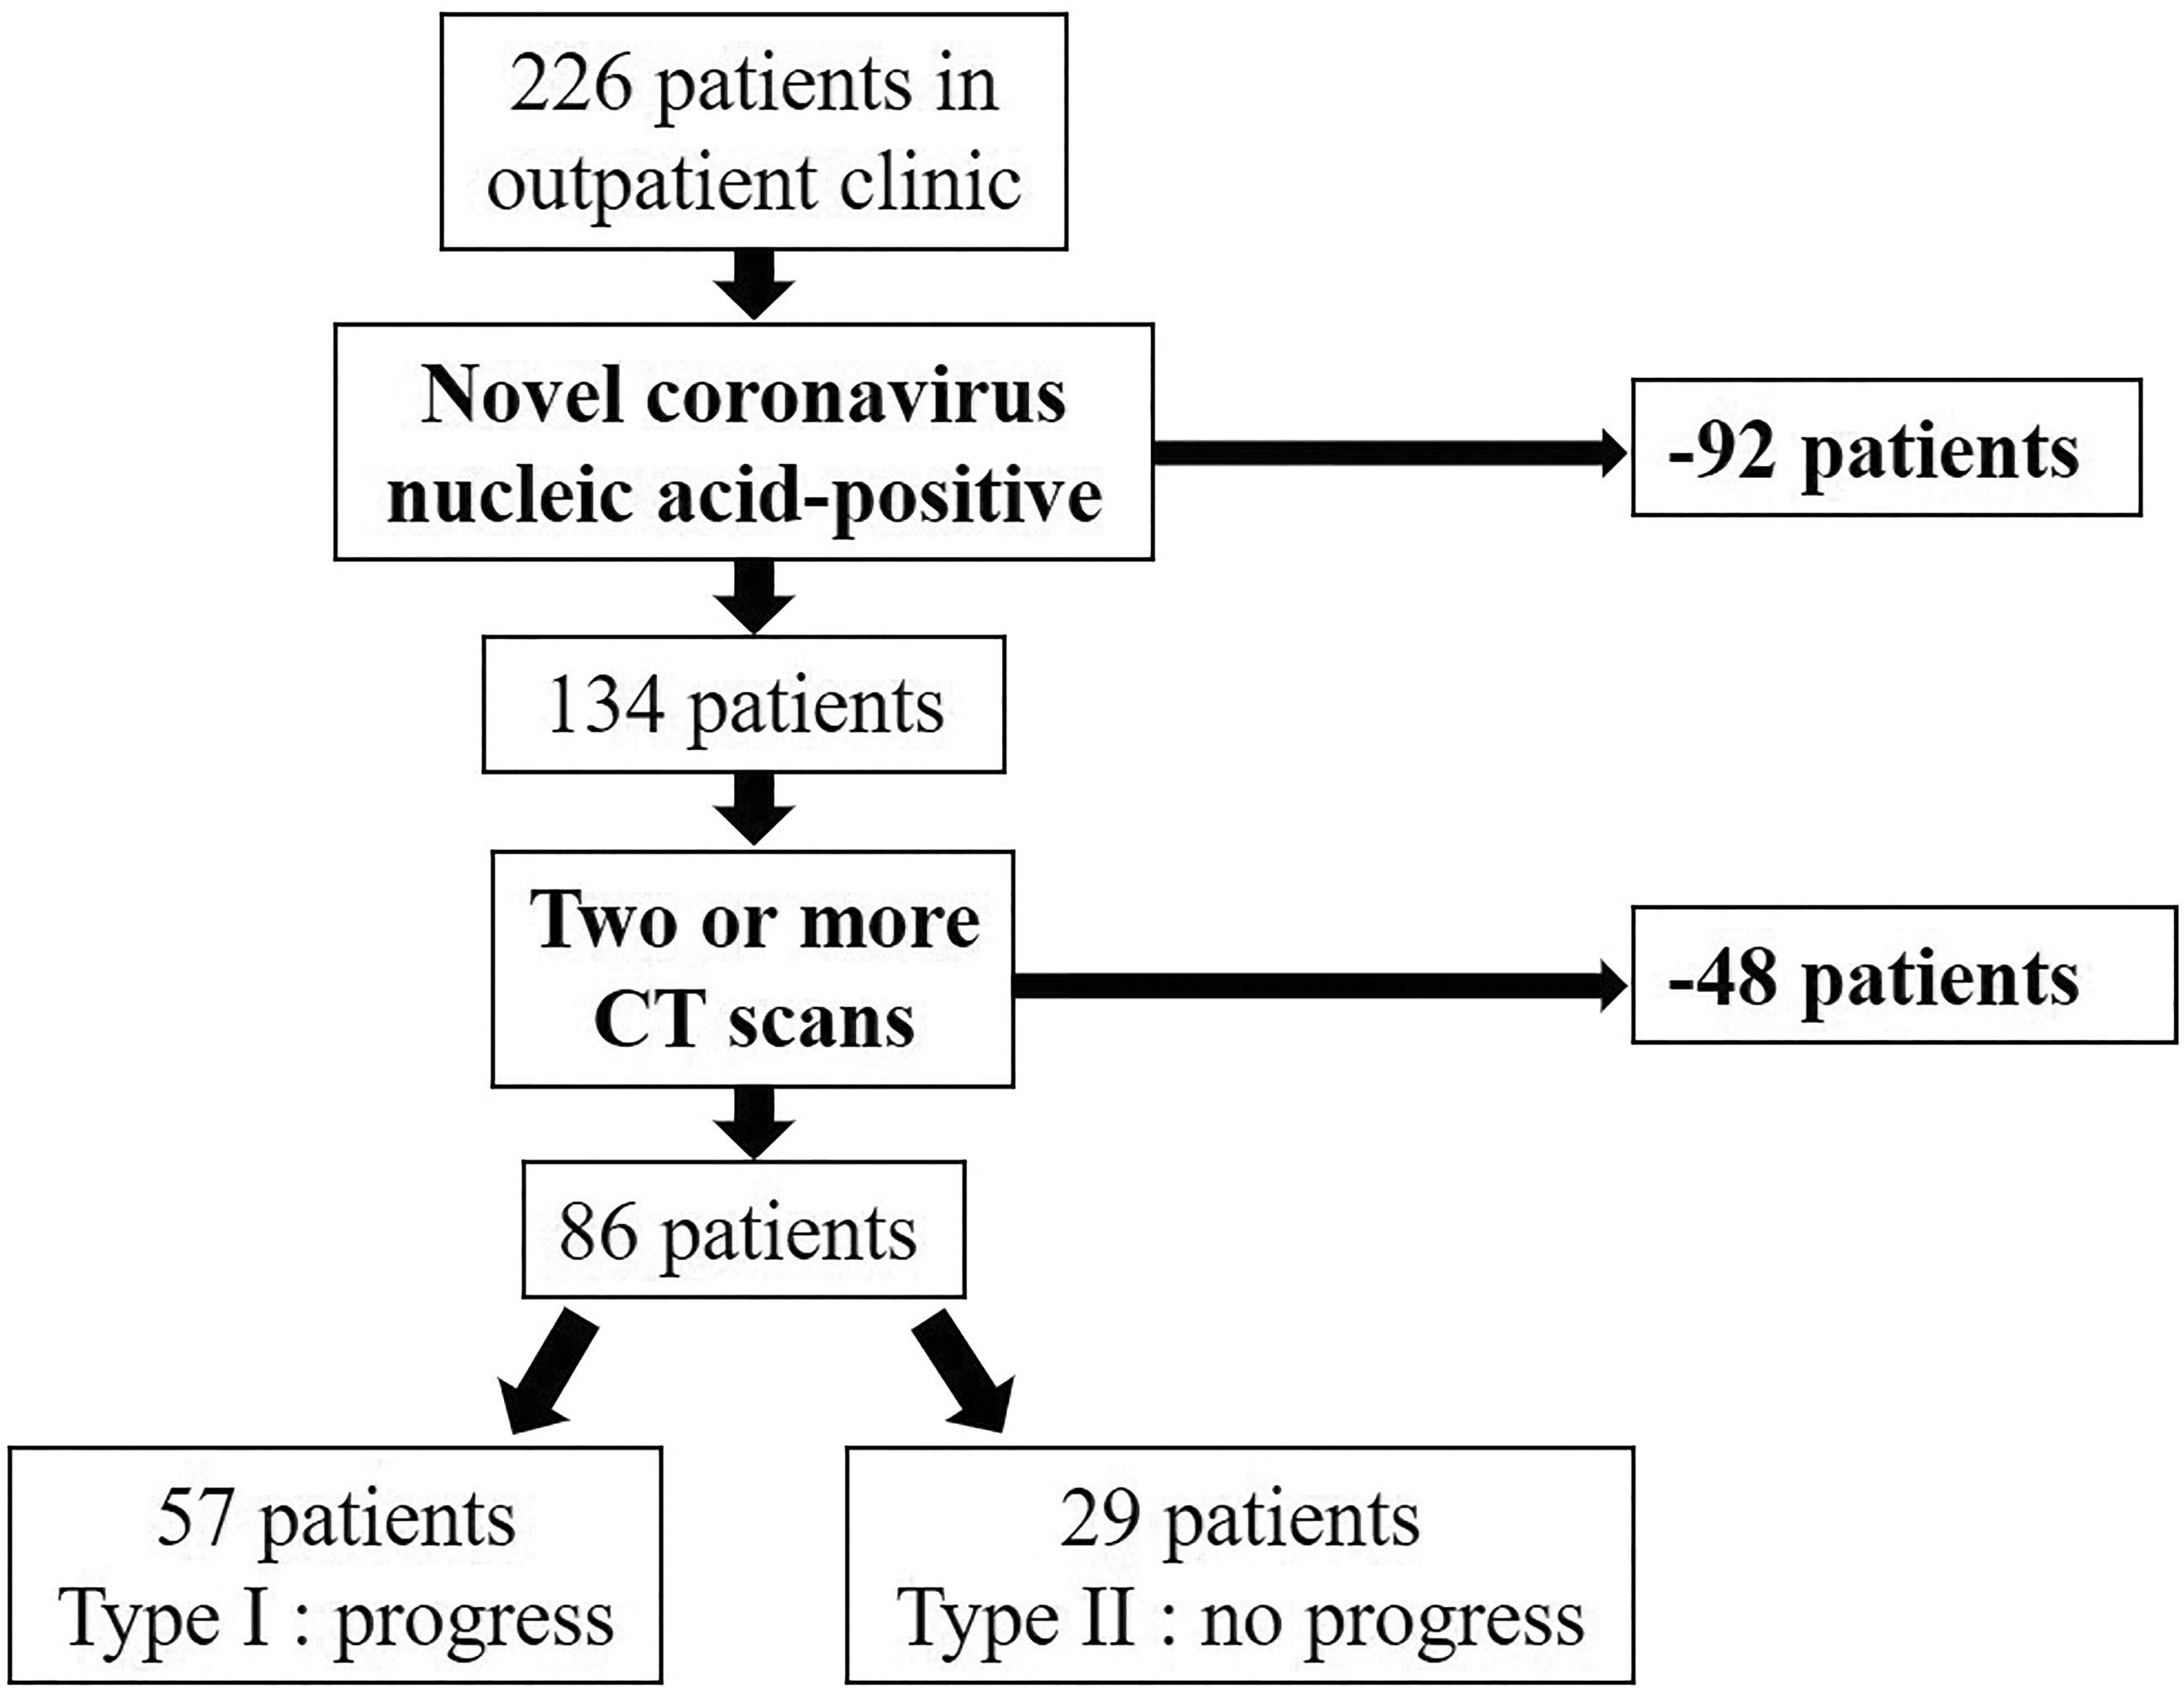
Flow chart of the selection criteria of patients with coronavirus disease 2019 pneumonia.
High-resolution CT scans
All high-resolution computed tomographic (HRCT) scans of the thorax were performed with CT scanners (GE Healthcare, Philips, or Toshiba Medical Systems, Wuhan City, Hubei Province, China) under the appropriate control conditions. These conditions were as follows: 80 to 120 kVp, automated tube current modulation of 60 to 300 mA, rotation time of 0.5 s, pitch of 0.984:1, and a slice thickness of 1.25 mm, with selected differences according to machine types. Patients were in the supine position during end-inspiration.
Interpretation of images
Two experienced radiologists reviewed the HRCT images on a picture archiving and communication system workstation (Synapses; Fujifilm, Wuhan City, Hubei Province, China) with multiplanar reconstruction tools and reached a decision in consensus. These two radiologists had 4 and 10 years of experience in thoracic radiology. The images were viewed in lung window settings (width, 1000–1500 HU; level, 700 to −550 HU) and mediastinal window settings (width, 300–350 HU; level, 30–40 HU). Using the terms defined by the Fleischner Society and peer-reviewed literature on viral pneumonia,4,7 the observers categorized the predominant patterns of abnormality on CT scans as pure ground-glass opacity (GGO) (hazy areas of increased attenuation without obscuration of the underlying vessels, pure GGO), predominant GGO, GGO with superimposed linear opacities (crazy-paving pattern), pure consolidation (homogeneous opacity of the parenchyma with obscuration of the underlying vessels), predominant consolidation, microvascular dilation, a stripe pattern, and a reticular pattern. On the scans, the presence of mediastinal lymphadenopathy (defined as a lymph node ≥1 cm in the short-axis diameter), pneumothorax, pleural effusion, and pericardial effusion was also noted. The distribution of opacity was also defined as being pure subpleural (involving only the peripheral one third of the lungs), pure central (involving only the central two thirds of the lungs), and diffuse (without predilection for being subpleural in the center regions).
The extent of disease on HRCT was also evaluated. Each lung was divided into the following three lung zones: upper (above the carina), middle (below the carina up to the inferior pulmonary vein), and lower (below the inferior pulmonary vein) zones. Each lung zone (total of six lung zones) was assigned a score that was based on the following: score of 0, 0% involvement; score of 1, <25% involvement; score of 2, 25% to <50% involvement; score of 3, 50% to <75% involvement; and score of 4, ≥75% involvement. Summation of the scores provided overall lung involvement (maximal CT score for both lungs was 24). 8
At review of the follow-up CT score, we were able to identify two patterns of CT scores on the basis of changes from the initial scan to the first reexamination as follows: type I, progress compared with the initial CT score; and type II, no progress compared with the initial CT score. We also examined the relationship between the follow-up time and the change in CT score of patients. Additionally, we counted the proportion of patients who showed progress each week to determine the appropriate CT follow-up time. For all patients, we also recorded imaging characteristics of the last HRCT scan and determined if there was any lesion that was completely absorbed during the follow-up period.
Statistical analysis
The median values of the CT score and temporal changes in the main CT patterns were analyzed. Quantitative data are presented as mean ± standard deviation and median (minimum–maximum). Count data are presented as the percentage of the total unless otherwise specified. The change in CT score of the lungs as a function of time was quantitatively assessed using the R curve estimation module. Data were evaluated by the t test, Mann–Whitney U test, χ2 test, or Fisher’s exact test, as appropriate. A P value of <0.05 was defined as statistically significant. Statistical analyses were performed using R software (version 3.6.1, the R Foundation for Statistical Computing, Vienna, Austria).
Results
Baseline characteristics of the patients
The patients included 32 men and 54 women, aged 15 to 78 years, with a mean ( ± standard deviation) age of 50 ± 15 years. Of these patients, 25 (29.1%) were aged >60 years, with a mean age of 68 ± 5 years. The most common clinical manifestation was fever, followed by cough, fatigue, muscle pain, headache, and chest pain (Table 1).
Characteristics of the patient cohort.

Quantitative data are presented as mean ± standard deviation (minimum–maximum) and count data are presented as number (%). CT, computed tomography.
Imaging characteristics of initial HRCT
Of the eighty-six patients with COVID-19 included in this study, 82 (95.3%) showed abnormalities in the first pulmonary HRCT scan (Table 2). Most patients showed multiple lobes involved, and in patients aged >60 years, most (25/25, 100%) of them showed multiple lobes involved. More than half of the patients presented with bilateral, multifocal lung lesions, with diffuse distribution. Among patients aged >60 years, 17 (17/25, 68.0%) showed this distribution.
Imaging characteristics of initial high-resolution computed tomography.

Various patterns of GGO were found in the patients, with coexistence of two or more forms in 29 (33.7%) patients. Microvascular dilation, mediastinal lymphadenopathy, and pericardial effusion were observed. Of the patients aged >60 years, 11 (11/25, 44.0%) showed the coexistence of two or more forms of GGO and 10 (10/25, 40.0%) presented with mediastinal lymphadenopathy.
Temporal changes in CT scores
Fifty-seven patients (57/86, 66.3%, mean age: 50 ± 15 years, range: 15–75 years) showed type I and 29 (29/86, 33.7%, mean age: 49 ± 15 years, range: 26–78 years) showed type II patterns of the CT score.
Type I: progress compared with the initial CT score
A total of 199 CT scans were performed, of which the mean time from onset of illness to the initial scan was 4 ± 1 days. There was a marked increase in the median CT score after onset of symptoms (Figure 2a). The median CT score peaked during the second week (8–14 days) of illness, with a median value of 7 (range: 1–24). After this time, the median CT score slightly dropped to 6 (range: 0–18) during the third week (15–21 days) of illness, and remained at this level until the fifth to eighth weeks (29–55 days) of illness before falling further slowly. The median CT score dropped to close to 0 after 8 weeks (>56 days) of illness. Changes in the CT score for every patient with type I are shown in Figure 2b. With regard to the change in CT score (follow-up CT score − the initial CT score), the mean peak value (Figure 2c) was reached at 12 ± 3 days of illness. Among the fifty-seven patients with type I, temporal changes in the CT score after reaching a peak (follow-up CT score − peak CT score) are shown in Figure 2d. The mean nadir was reached at 36 ± 25 days of illness.

Temporal changes in the CT score in patients with a type I pattern. (a) Median change in the CT score. (b) Change in the CT score for every patient. (c) Changes in the CT score before the CT score reached a peak (d) and after this peak. Curve fitting equation: (c), y=0.0001×x3–0.016×x2 + 0.508×x1 − 1.141, in which x=time from onset of the initial symptoms, y=change in the CT score (reexamination CT score − initial CT score), R2=0.32, P<0.001; (d), y=0.00005×x3 − 0.006×x2 + 0.061×x−0.969, in which x=time from onset of the initial symptoms, y=change in the CT score (reexamination CT score − peak CT score), R2=0.49, P<0.001. CT, computed tomography; d, days.
Eight (8/57, 14.0%) patients showed progress during the first week (≤7 days) of illness, 50 (50/57, 87.7%) showed progress during the second week of illness, and three patients showed progress during the third week of illness compared with the initial CT score. Among them, four patients had more severe progression and CT showed “white lung” sign (Figure 3). No patient showed progress during the fourth and fifth to eighth weeks, and after 8 weeks of illness.

(a, b) High-resolution computed tomography of a 57-year-old woman at the first computed tomographic scan. There is scattered predominant round-glass opacity in the peripheral zone of both lungs. (c, d) High-resolution computed tomography at the first reexamination after 8 days. Diffuse crazy-paving pattern with partial consolidation in both lungs can be seen, showing white lung changes.
Type II: no progress compared with the initial CT score
Ninety-four CT scans were performed, of which the mean time from onset of illness to the initial scan was 6 ± 2 days. The median CT score remained stable during the first and second weeks of illness, with a median value of 6 (range: 0–20) (Figure 4a). After this time, the median values slightly dropped. The change in CT score for every patient with the type II CT score pattern is shown in Figure 4b. With regard to the change in CT score (Figure 4c), the mean nadir was reached at 23 ± 13 days.

Temporal changes in the CT score in patients with a type II pattern. (a) Median change in the CT score. (b) Changes in the CT score for every patient. (c) Scatterplot showing changes between the reexamination CT score and the initial CT score. (c). Curve fitting equation: y=−0.00003×x3 + 0.005×x2 − 0.229×x1 + 1.164, in which x=time from onset of the initial symptoms, y=change in the CT score (reexamination CT score − initial CT score), R2=0.51, P<0.001. CT, computed tomography; d, days.
Temporal changes in main CT patterns
The temporal changes in main CT patterns for patients with type I (fifty-seven patients with 199 CT scans) and type II (twenty-nine patients with 94 CT scans) are shown in Figure 5. The predominant pattern of abnormality for both types was the crazy-paving pattern during the first week of illness and predominant consolidation during the second week of illness. After this time, the crazy-paving pattern and predominant consolidation were partially or totally absorbed and the percentage of GGO and a normal pattern increased.

Temporal changes in the main computed tomographic patterns. Stacked bar graphs show the distribution of the main patterns of lung abnormalities in patients with types I (a) and II (b) computed tomographic score patterns at various time points from the onset of symptoms. GGO, ground-glass opacity, d, days.
Imaging characteristics of the final HRCT scan during follow-up
The mean interval between the onset of initial symptoms and the final CT scan was 27 ± 23 days (range: 7–96 days). During this period, there was a 28-year-old female patient (1.2%) without any lesion during the 50 days of follow-up (Figure 6). The lesion was completely absorbed in 12 (12/86, 14.0%) patients who had a mean age of 43 ± 15 years and the mean time from onset of illness was 65 ± 32 days. The lesion was partially absorbed in 73 (73/86, 84.8%) patients in whom the mean age was 51 ± 14 years (P=0.042 vs patients with completely absorbed lesions) and the mean time from onset of illness was 20 ± 14 days (P<0.001 vs patients with completely absorbed lesions). On the last HRCT scans (>21 days), pure GGO was found in 7 (7/37, 18.9%) patients, predominant GGO in 13 (13/37, 35.1%), predominant consolidation in 4 (4/37, 10.8%), and a normal pattern in 13 (13/37, 35.1%). Fifteen (15/37, 40.5%) patients showed a reticular pattern (Figure 7) in whom the mean age was 63 ± 10 years, which was older than that of those without a reticular pattern (mean age: 42 ± 13 years, P<0.001).

(a, b) High-resolution computed tomography of a 28-year-old woman at the first diagnosis. No lesion can be seen in both lungs. (c) High-resolution computed tomographic findings of the first reexamination after 50 days. There is still no lesion in the lungs.

(a–c) High-resolution computed tomographic findings of a 73-year-old male patient during outpatient follow-up. A multiple reticular pattern can be seen around the right lower lobe stripe pattern.
Discussion
COVID-19 disease is a new, highly infectious, viral pneumonia that is caused by a novel coronavirus (SARS-CoV-2) of unknown origin. In this study, we observed eighty-six outpatients who were diagnosed with COVID-19 pneumonia. Among them, the predominant clinical manifestations were fever (74.4%), cough (45.3%), and fatigue (20.9%). More than half of the patients showed bilateral, multifocal lung lesions, with multiple lobes involved and diffuse distribution. Fourteen patients presented with unilateral lesions, of these patients, thirteen patients had unilateral lesions which occurred in the right lung. This finding might be because of the innate anatomical features of the right lung bronchus. 2 On CT images, COVID-19 pneumonia had a mixed pattern involving lung parenchyma and lung interstitium. 9 The virus first invaded the pulmonary interstitium, which was characterized by edema and thickening of the interlobular septum, interlobular interstitium, subpleural interstitium, interlobular central interstitium, and peribronchovascular interstitium. This manifested as GGO and a crazy-paving pattern. Consolidation might represent further infiltration of the parenchyma. Microvascular dilation sign might indicate increased blood supply to the inflammatory area of the lungs. 2 Patients older than 60 years often presented with multifocal lung lesions, multiple patterns of abnormality, diffuse distribution involving multiple lobes, and mediastinal lymphadenopathy. This finding might be related to the fact that older people have more basic diseases.
CT has become the main screening and reviewing method for COVID-19 pneumonia because of its high specificity and sensitivity. Each patient needed to have multiple CT examinations during the course of this disease in our study. Therefore, physicians should pay attention to the radiation effects of CT examinations. Although a chest X-ray delivers a radiation dosage of approximately 0.05 mSv, a standard chest CT might deliver approximately 4 to 7 mSv. One CT scan might be associated with an oncogenic risk of 0.05% to 0.7%. For patients who have multiple CT scans, the risk could be as high as >2.7%. Moreover, a CT scan incurs procedure-induced viral transmission.6,10 Therefore, we should reduce the number of examinations or change to X-rays with a lower radiation dose while ensuring the effectiveness of CT examinations to reduce the effect of radiation. Therefore, in the current study, we examined the changes in CT follow-up at different times to determine the appropriate follow-up interval.
After completing the first CT scan, we found that patients should undergo CT reexamination when the change in CT score (follow-up CT-score − initial CT score) reached its peak (or low) value to reduce the CT radiation dose. For fifty-seven patients with the type I CT score pattern, the CT score and the change in CT score reached a peak at a mean of 12 days from onset of illness, and the proportion of patients who showed progress reached the peak value during the second week of illness. This finding is consistent with the results of other studies.4,11 Furthermore, the change in CT score after it reached a peak (follow-up CT score − peak CT score) was determined, with low values at approximately 36 days from the onset of illness. Therefore, for most patients with type I (conditions continued to progress), a CT reexamination at approximately 12 days from onset of illness is recommended. After this time when the disease course is in remission, a CT reexamination at approximately 36 days from the onset of illness is recommended. For twenty-nine patients with a type II CT score pattern, the nadir of a change in CT score was reached at a mean time of 23 days from the onset of illness. Therefore, a CT reexamination is recommended at this time. All recommendations were made to reduce the CT radiation dose of patients and to show timely changes in CT in the course of the disease.
In our study, we observed the imaging characteristics of the final HRCT scan during follow-up. The mean age and the follow-up of patients with completely absorbed lesions were younger and longer, respectively, than those in patients with partially absorbed lesions. This finding suggested that younger patients and a longer follow-up are associated with easier absorption of lesions. We also found that older patients were more likely to have a reticular pattern (a sign of pulmonary fibrosis) than younger patients.
The present study has three limitations. First, the sample size for this experiment was relatively insufficient. Therefore, a larger sample size is required in future studies. Second, because we enrolled outpatients, detailed clinical data and laboratory findings of patients were relatively lacking. Third, because no suitable software was found, we did not use AI software for segmentation of lesion volume. This should be our next research direction.
In conclusion, for patients with a type I pattern (progress compared with the initial CT score), the appropriate follow-up time of CT scans is during the second week (approximately 12 days) and the fifth week (approximately 36 days) from the onset of illness. In the former time, patients are in progression of the disease and a CT reexamination aims to help determine the extent of the disease, while in the latter time, patients are in recovery and a reexamination aims to determine absorption of the lesions. For patients with a type II CT score pattern who might be in recovery, the appropriate follow-up time of CT scans is during the fourth week (approximately 23 days) from the onset of illness. All recommendations aim to reduce the CT radiation dose of patients and to provide timely changes in the course of the disease using CT.
Footnotes
Author contributions
Study design: Q.H.; literature search: C.C., Q.C., and D.N.; experimental studies: C.C. and J.D.; data acquisition: C.C., X.W., and F.Y.; data analysis/interpretation: C.C. and X.W.; statistical analysis: C.C. and J.D.; preparation and editing of the manuscript: C.C.; revision/review of the manuscript: Q.H., W.C., and F.Y.; final approval of the manuscript: Q.H. and W.C.
Declaration of conflicting interest
The authors declare that there is no conflict of interest.
Funding
This research received no specific grant from any funding agency in the public, commercial, or not-for-profit sectors.