
Abstract
Objective
To investigate the accuracy of derecruitment volume (VDER) assessed by pressure–impedance (P-I) curves derived from electrical impedance tomography (EIT).
Methods
Six pigs with acute lung injury received decremental positive end-expiratory pressure (PEEP) from 15 to 0 in steps of 5 cmH2O. At the end of each PEEP level, the pressure–volume (P-V) curves were plotted using the low constant flow method and release maneuvers to calculate the VDER between the PEEP of setting levels and 0 cmH2O (VDER-PV). The VDER derived from P-I curves that were recorded simultaneously using EIT was the difference in impedance at the same pressure multiplied by the ratio of tidal volume and corresponding tidal impedance (VDER-PI). The regional P-I curves obtained by EIT were used to estimate VDER in the dependent and nondependent lung.
Results
The global lung VDER-PV and VDER-PI showed close correlations (r = 0.948, P<0.001); the mean difference was 48 mL with limits of agreement of −133 to 229 mL. Lung derecruitment extended into the whole process of decremental PEEP levels but was unevenly distributed in different lung regions.
Conclusions
P-I curves derived from EIT can assess VDER and provide a promising method to estimate regional lung derecruitment at the bedside.
Keywords
Introduction
The positive end-expiratory pressure (PEEP) plays an important role in supporting patients with acute respiratory distress syndrome (ARDS) who are on mechanical ventilation because it contributes to the recruitment of atelectatic alveoli and improves oxygenation. 1 However, several large randomized controlled trials failed to demonstrate that patients could benefit from high PEEP levels.2–4 Not identifying the patients’ response to PEEP possibly led to these contradictory results. 5 The optimal PEEP level should induce lung recruitment to decrease lung stress and strain. 6 However, if PEEP levels only act on aerated lung areas, it may mainly result in overdistension and increase the risk of ventilator-induced lung injury. 7 Therefore, it is of paramount importance to assess lung recruitment continuously at the bedside to determine the optimal PEEP levels for different individuals.
Pressure–volume (P-V) curves provide a quantitative method to assess recruitment or derecruitment volumes at the bedside.8–10 However, the change in end expiratory lung volume (ΔEELV) induced by PEEP is required to plot multiple P-V curves, which can only be measured by a specific ventilator or the release maneuver at the bedsides.9,10 Moreover, only the global lung information is provided. Electrical impedance tomography (EIT) is a radiation-free and real-time tool to monitor the change in global and regional impedance in the lungs at the bedside. 11 Previous studies have shown that changes in lung volume are closely correlated with changes in impedance as measured by EIT.12–18 Previous studies found a correlation between recruitment volumes that were measured by EIT and the reference method, but they were both based on a simplified method, which was the difference between the actual and minimal predicted lung volume change induced by PEEP.19,20 Although the simplified method is convenient for clinical application, recruitment volume that is assessed by the simplified method was significantly lower than that assessed by multiple P-V curves. 21
In this study, a lung injury model was induced in the pig by the bronchoalveolar instillation of hydrochloride. Low constant flow inflations were performed at decremental PEEP levels. Lung derecruitment volume (VDER) was measured using pressure–impedance (P-I) curves that were derived from EIT (expressed as VDER-PI), and they were then compared with that measured using the P-V curve method (expressed as VDER-PV). We hypothesized that EIT could assess global lung VDER accurately and that this would have great value in regional VDER assessments at the bedside.
Materials and methods
This animal study was approved by the Ethics Committee for Experimental Studies at Beijing Neurosurgical Institute, Beijing, China (No. 201803002). All animal procedures were conducted in accordance with the recommendations of the Guide for the Care and Use of Laboratory Animals from the National Institutes of Health.
Animal preparation
The study was performed on six healthy female Bama pigs (weight, 42 [range, 40 to 44] kg; age, 12 [range, 11 to 14] months; in the diestrous cycle). The animals were anesthetized with intramuscular ketamine (10 mg/kg) and xylazine (1 mg/kg) injections, and they were placed in the supine position on a thermocontrolled operation table. Rectal temperature was maintained at approximately 37°C. Femoral venous catheterization was performed for fluid and drug administration, and femoral arterial catheterization was used for invasive blood pressure monitoring and blood gas analysis sampling. A tube with an 8-mm inner diameter (Smiths Medical International Ltd., Kent, UK) was placed by tracheostomy. Mechanical ventilation was set at a tidal volume of 6 to 8 mL/kg of body weight, a respiratory rate (RR) of 16 to 20 breaths/minute was used to keep the arterial partial pressure of carbon dioxide (PaCO2) within 35 to 45 mmHg, and a PEEP of 5 cmH2O and an inspired oxygen fraction (FiO2) of 0.5 (Evita Infinity V500™, Dräger, Germany) were used. The pulse oxygen saturation and partial pressure of end-tidal carbon dioxide (PETCO2) were monitored continuously (BeneView T5, Mindray, Shenzhen, China). An additional heated pneumotachograph (Vitalograph. Inc., Lenexa, KS, USA) was positioned between the Y piece and the tracheostomy tube to monitor the gas flow. During the study, propofol (1 to 2 mg/kg/hour), fentanyl (5 μg/kg/hour), and rocuronium bromide (0.25 to 0.5 mg/kg/hour) were infused continuously to minimize suffering and abolish inspiratory effort.
Study protocol
After the initial preparation, the acute lung injury model was induced by instillation of hydrochloric acid (4 mL/kg) into the tracheostomy tube. The successful criteria were an arterial partial pressure of oxygen (PaO2) of less than 100 mmHg at FiO2 0.5 and a PEEP of 5 cmH2O after 30 minutes. 22 The study protocol is shown in Figure 1.

Illustration of the protocol with the example of positive end-expiratory pressure (PEEP) decreasing from 15 cmH2O to 10 cmH2O. The upper panel represents the flow waveform and the lower panel represents the airway pressure waveform over time. The recruitment maneuver was performed with pressure control ventilation to standardize the lung volume before changing the PEEP, which was set as an inspiratory pressure of 25 cmH2O above PEEP. PEEP was set at 25 cmH2O, RR at 10 breaths/minute, and the inspiratory-to-expiratory ratio was set at 1:1 for 2 minutes. Then the pigs were ventilated using volume-control ventilation for 10 minutes, and a low constant flow pressure–volume (P-V) curve was performed automatically by the P-V loop tool that was integrated into the ventilator. The pressure was increased from the corresponding PEEP level until the airway pressure was up to 35 cmH2O (above PEEP) at a constant flow of 6 L/minute. Then mechanical ventilation resumed the previous settings for 10 minutes, and end inspiratory and expiratory occlusion (EIO and EEO) for 5 s were performed consecutively, following a release maneuver by disconnecting the animals from the ventilator during expiratory occlusion. When the flow returned to zero, the animal was reconnected to the ventilator and the recruitment maneuver was performed again. The PEEP was then decreased at a step of 5 cmH2O.
During the study, PEEP was set from 15 to 0, at decremental steps of 5 cmH2O, and the other ventilator settings remained unchanged. The recruitment maneuver was performed with pressure control ventilation before setting each PEEP level to standardize the lung volume, using a PEEP of 25 cmH2O, a peak pressure of 50 cmH2O, an RR of 10 breaths/minute, and an inspiratory to expiratory ratio of 1:1 for 2 minutes. At each PEEP level, the ventilation was stabilized for 10 minutes, after which a low constant flow inflation (6 L/minute) was performed automatically using the P-V loop tool that was integrated in the ventilator. The inflation was stopped when the airway pressure exceeded 35 cmH2O over the corresponding PEEP. After completing the P-V curve maneuver, mechanical ventilation was restored to the previous settings for 10 minutes, and then blood gases (PaO2 and PaCO2), PETCO2, alveolar dead space fraction, and hemodynamics (heart rate and mean arterial pressure) were collected. 22 End-inspiratory and end-expiratory occlusion were performed for 5 s to obtain the values that were used to calculate the compliance of the respiratory system (Crs). Then, the release maneuver was performed by disconnecting the animals from the ventilator during end-expiratory occlusion to obtain the PEEP volume resulting from PEEP withdrawal by the pneumotachograph monitor. Finally, PEEP was adjusted to the lower level, and the procedure was repeated as described above (Figure 1).
EIT measurements and analysis
EIT monitoring (PulmoVista 500; Dräger Medical GmbH, Lübeck, Germany) was performed throughout the procedure by placing a dedicated belt with 16 electrodes just below the axilla and one reference electrocardiogram electrode at the right lower extremity. EIT was connected to the ventilator (Evita Infinity V500™, Dräger, Germany) to collect serial flow, volume, airway pressure, and impedance measurements synchronously. The data were continuously recorded at 40 Hz and were downloaded and analyzed off-line using dedicated software (Dräger EIT Data Analysis Tool 6.3, Lübeck, Germany). The lung images were divided horizontally into two equal sizes from ventral to dorsal, as the nondependent lung region and the dependent lung region.
23
The last 1 minute of stable breaths during zero PEEP (ZEEP) was used as the baseline, and changes in lung impedance were reconstructed.
24
At the end of each PEEP level, the average values of the following data over 1 minute were calculated, as follows:
The regional distribution of the tidal ventilation in the nondependent lung region and dependent lung region were calculated as the change of region impedance divided by the change of total tidal impedance, expressed as Vt%Non-dep and Vt%Dep.
19
The regional Crs for the nondependent lung region and the dependent lung region were calculated as the global Crs multiplied by the percentage of tidal volume in each region, expressed as CrsNon-dep and CrsDep.
19
The global and regional ΔEELV induced by PEEP were calculated as the change of end-expiratory impedance between the selected PEEP level and ZEEP, multiplied by the ratio of VT (in mL) and the change of global tidal impedance (in absolute units) at the baseline.
22
The global ΔEELV induced by PEEP minus the product of Crs measured at ZEEP and the change of PEEP (ΔPEEP) was defined as VDER based on the previously reported simplified method, based on the minimal predicted lung volume (expressed as VDER-MPV) in the following equation: VDER-MPV =ΔEELV − ΔPEEP × Crs.
19
VDER measured by P-V curves at a low constant flow inflation
The expired gas volume during the release maneuver was defined as the PEEP volume, which was measured by integrating the monitored flow wave using the pneumotachograph. During low constant flow at each PEEP level, the corresponding PEEP volume was added to each volume as the vertical axis, and airway pressure was represented on the horizontal axis. The four P-V curves at different PEEP levels and ZEEP were placed on the same Figure, in accordance with the pervious method. 8 VDER-PV between the selected PEEP level and ZEEP was the difference in lung volume at the same airway pressure of 20 cmH2O, which was expressed as VDER-PV in 5 to 0, 10 to 0, and 15 to 0 cmH2O (Figure 2). 25

The derecruitment volume (VDER) measured by pressure–volume (P-V) curves and pressure–impedance (P-I) curves. (a) Shows the example of VDER that was assessed with P-V curves (VDER-PV). The P-V curves at different positive end-expiratory pressure (PEEP) levels (0, 5, 10, or 15 cmH2O) were plotted on the same Figure. The VDER-PV between given PEEP level and ZEEP was the difference in lung volume at the same airway pressure of 20 cmH2O. (b) Shows the VDER assessed with P-I curves (VDER-PI) in the same animal. When the last 1 minute of stable breaths for ZEEP was selected as the reference (c), the change of impedance against reference values by EIT was obtained directly. P-I curves at different PEEP levels were plotted directly on the same graph (b). The difference of impedance between the given PEEP levels and ZEEP at the same airway pressure of 20 cmH2O was defined as derecruitment impedance, which can be converted to VDER-PI by multiplying the ratio of tidal volume and tidal impedance variation at ZEEP (c).
VDER measured by P-I curves derived from EIT during low constant flow inflation
When we selected the last 1 minute of stable breaths at ZEEP as the reference, the impedance obtained directly by EIT at other PEEP levels represented the change in values compared with the reference values. We plotted the impedance of the total lung region against the airway pressure data at different PEEP levels as P-I curves. The difference in impedance between the set PEEP level and ZEEP at the same airway pressure of 20 cmH2O was defined as derecruitment impedance, and it was converted to VDER-PI by multiplying the ratio of tidal impedance variation and tidal volume within the reference period (Figure 2). 24 Additionally, the regional P-I curves in the nondependent and dependent lung region were also plotted to measure regional VDER-PI using the same method, and we further calculated the difference in VDER-PI between two adjacent PEEP levels as the ΔVDER-PI between PEEP 15 to 10 cmH2O, 10 to 5 cmH2O, and 5 to 0 cmH2O. 25
Statistical analysis
The sample size was calculated using the sampling correlation coefficient test in MedCalc (MedCalc Software, Ostend, Belgium). We considered the correlation coefficient between changes in impedance and volume on the P-V curve to be 0.97 with a type I error rate of 0.01 and type II error rate of 0.20 based on a previous study. 14 Thus, the minimum required sample size was 6.
Categorical variables are reported as numbers and percentages. Continuous data are reported as the median and interquartile range (IQR). Agreement between VDER-PV and VDER-PI, the PEEP volume measured by the release maneuver, and the ΔEELV measured by EIT were tested using the Bland and Altman analysis. 26 Bias and standard deviation of the mean bias were calculated. Upper and lower limits of agreement were defined as bias ± 1.96 standard deviation (SD) of the mean bias. The correlations were analyzed using the Spearman coefficient (r). The differences in variables across different PEEP were assessed using Friedman’s nonparametric test. Post hoc pairwise comparisons were performed using the Wilcoxon test. Analyses were conducted using SPSS version 20.0 (IBM Corp., Armonk, NY, USA). P < 0.05 was considered to be statistically significant.
Results
The main characteristics of the animals are shown in the Table 1. The acute lung injury modeling successfully induced oxygenation (PaO2/FiO2) less than 200 (151 [IQR, 137–159]).
Baseline characteristics of pigs after ALI.

The data shown as the median (IQR).
ALI, acute lung injury; PaO2, partial pressure of oxygen in arterial blood; FiO2, inspired oxygen fraction; PaCO2, partial pressure of carbon dioxide in arterial blood; PETCO2, partial pressure of end-tidal carbon dioxide; Crs, compliance of respiratory system; HR, heart rate; MAP, mean arterial pressure; IQR, interquartile range.
Agreement of VDER assessed by P-I and P-V curves
The calculated VDER-PI had a close correlation with VDER-PV (r = 0.948, P < 0.001); the bias (the lower and upper limits of agreement) was 48 (−133 to 229) mL (Figure 3a and 3b). ΔEELV that was measured by the EIT and the PEEP volume (the integral of flow during the release maneuver) also showed a significant correlation (r = 0.986, P < 0.001); the bias was 87 (−65 to 241) mL (Figure 3c and 3d). During low constant flow inflation, the increase in impedance was closely correlated with the increase in volume, and the correlation coefficient of regression increased from 0.973 to > 0.999.

(a, b) Show the VDER-PI that was correlated significantly with VDER-PV (r = 0.948, P < 0.001, a), and the bias (lower and upper limits of agreement) was 48 (−133 to 229) mL (b). (c, d) Shows that ΔEELV measured by EIT had a close correlation with PEEP volume (r = 0.986, P < 0.001, c), and the bias between ΔEELV and PEEP volume was 87 (−65 to 241) mL (d).
The bias (lower and upper limits of agreement) between VDER-MPV and VDER-PV was −65 (−275 to 145) mL, and the correlation coefficient was 0.928 (P < 0.001).
Difference of ΔVDER-PI in different lung regions
Figure 4 shows the change in global and regional
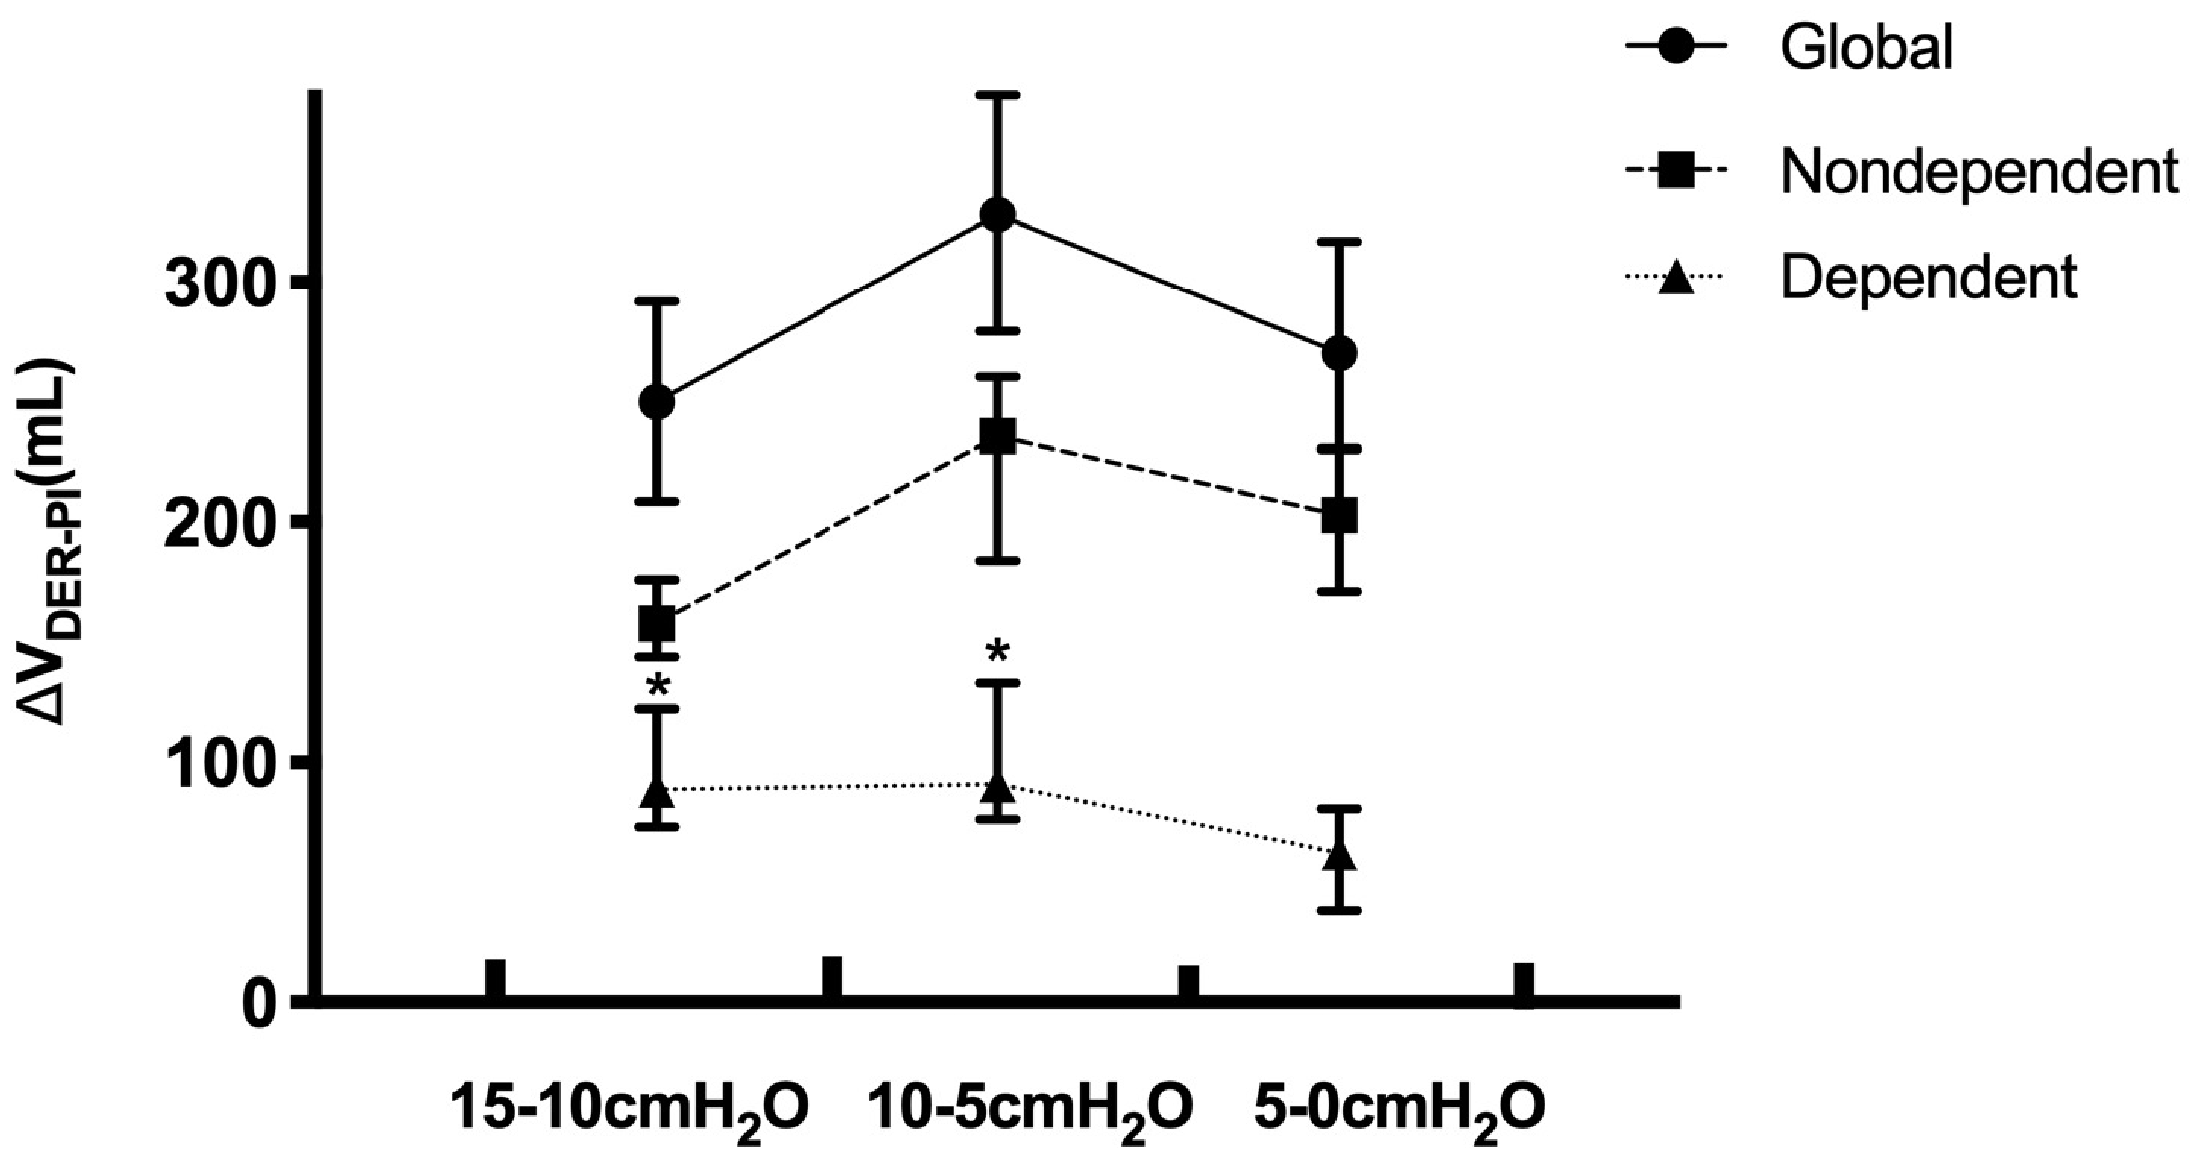
Regional derecruitment volume (ΔVDRE-PI) between the two adjacent PEEP levels in different lung regions. In the dependent region (triangles), ΔVDRE-PI between PEEP 15 to 10 cmH2O and PEEP 10 to 5 cmH2O was higher than that within PEEP 5 to 0 cmH2O (P = 0.028). However, in the global and non-dependent lung region (circle and square), ΔVDRE-PI between PEEP 15 to 10 cmH2O showed a decreasing tendency compared with PEEP 10 to 5 cmH2O and 5 to 0 cmH2O. The ΔVDRE-PI across different PEEPs were analyzed using Friedman’s nonparametric test. Post hoc pairwise comparisons were performed using the Wilcoxon test. P < 0.05 was considered to be statistically significant. The * represents P < 0.05 vs. ΔVDRE-PI between PEEP 5 to 0 cmH2O.
The increased PEEP contributed to improved oxygenation (P = 0.001) and decreased dead space (P = 0.001). There was no obvious fluctuation of heart rate or mean arterial pressure while changing PEEP levels (Table 2).
Gas exchange, hemodynamics, and ventilation data.

Data are shown as median (IQR).
The data were analyzed using a repeated-measures ANOVA and p < 0.05 represented a statistically significant difference.
*, **, *** represent p < 0.05 vs. the PEEP of 0, 5, and 10, respectively.
PEEP, positive end-expiratory pressure; PaO2, partial pressure of oxygen in arterial blood; FiO2, inspired oxygen fraction; Vt%Non-dep, the distribution of tidal ventilation in the non-dependent lung region; Vt%Dep, the distribution of tidal ventilation in the non-dependent lung region; CrsGlobal, compliance of the entire (global) respiratory system; CrsNon-dep, compliance of non-dependent lung region; CrsDep, compliance of dependent lung region; HR, heart rate; MAP, mean arterial pressure; IQR, interquartile range; ANOVA, analysis of variance; N.S., not significant.
Discussion
In this study, we compared the VDER-PI that was derived from EIT with VDER-PV in a lung-injured animal model. The main finding was that VDER-PI was well-correlated with VDER-PV. Thus, it is a reliable method to assess regional VDER with EIT at the bedside.
For ARDS patients, PEEP is helpful to re-inflate nonaerated alveoli and keep them open, but PEEP can also result in hyperinflation of aerated alveoli. Defining the best method by which to set optimal PEEP levels remains challenging in routine clinical practice. Optimal PEEP levels were expected to induce recruitment of collapsed alveoli to decrease lung stress and strain and improve the ventilation-to-perfusion ratio. Therefore, measurement of lung recruitment volume that was induced by PEEP is important to guide the PEEP settings. Computed tomography is the gold standard for the assessing the global and regional PEEP-induced alveolar recruitment,8,27 but it exposes patients to radiation and cannot be performed routinely or repeated easily. Multiple P-V curves have shown that they can be used to assess recruitment or derecruitment volumes quantitatively at the bedside. 8 However, plotting P-V curves requires further measurement of ΔEELV that is induced by PEEP with the help of specific ventilators or the release maneuver.8,9 Therefore, it is still rather complex and can even be harmful for patients when the ventilator is disconnected. Additionally, only global information about the lung is available using the P-V curves method.
EIT has been used in respiratory measurement based on how the degree of impedance varies with volume.12–18 In the present study, we performed low constant flow inflations at different PEEP levels under EIT monitoring and introduced a new method to estimate VDER using multiple P-I curves that were derived from EIT. We found that the VDER-PI were closely correlated with VDER-PV, although they were slightly overestimated. Additionally, ΔEELV that was assessed by EIT also showed a close correlation with PEEP volume as measured by pneumotachograph during PEEP release; this result showed an overestimation in the same manner. The presence of airway closure was excluded by closely observing the shape of P-V curves, to rule out cases of incomplete expiration. 28 However, the derecruitment process over time (10 minutes) during ventilation at ZEEP was ignored because the pneumotachograph measured expired volume at exactly the moment of PEEP withdrawal, which might explain why ΔEELV derived from EIT was higher than the PEEP volume that was measured by the pneumotachograph. In the previous study, researchers also found that the PEEP volume that was measured using a pneumotachograph was lower than that calculated by CT because of additional time-dependent derecruitment, which further caused VDER-PV to be lower than measurements that were derived from CT. 8 Consistent with these results, the slightly higher estimations of VDER-PI compared with VDER-PV means that VDER-PI more closely approaches the “true” values. Additionally, the change in impedance as measured by EIT was closely correlated with the change in volume; this was validated in our study and is consistent with the results of previous studies.12–18 This supports the concept that the P-I curves are a promising method of accurately measuring VDER at the bedside.
EIT makes it possible to visualize regional ventilation. 10 It is feasible to evaluate regional derecruitment with the regional P-I curves, as described in previous studies.12,13,18,29–32 In this study, we calculated ΔVDER-PI that was induced by adjacent PEEP in nondependent and dependent lung regions by the regional P-I curves. The results have shown that the different lung regions have different responses to PEEP. For the nondependent lung region, the ΔVDER-PI is prominent when PEEP is set at 5 to 0 cmH2O and 10 to 5 cmH2O and has a decreasing tendency as PEEP decreases from 15 to 10 cmH2O, which probably suggests that the number of collapsed lung units in the nondependent lung region have decreased when PEEP levels are at 15 cmH2O; further increasing PEEP might induce regional overdistension and worsen respiratory mechanics. Conversely, high PEEP levels could drive more air into the dependent lung region and thereby improve gas distribution and respiratory mechanics. Decreasing PEEP from 15 to 10 and 5 cmH2O leads to significant decruitment. The previous studies also showed that reginal P-I curves in the dependent lung region were different from global and non-dependent lung region P-I curves, which had higher values of a lower inflection point indicating that higher pressure was needed to open atelectatic alveoli.12,13,18,29–32 In our study, considering the optimization of ΔVDER-PI distribution between the two distinct regions, 10 cmH2O may represent the optimal PEEP level to maximize open alveoli and minimize alveoli overdistension. Although the regional P-I curves could provide more detailed information, the best way to determine the optimal PEEP levels based on regional recruitment volume was to balance overdistention and collapse, but this requires further investigation.
EIT has several advantages over the other two methods (CT scan and P-V curves) for exact VDER measurements. EIT, unlike CT, is free from radiation and could be performed routinely and repeated easily at the bedside. 11 In contrast to P-V curves, P-I curves derived from EIT inherently include the information about ΔEELV. EIT could also acquire regional information about lung derecruitment. Although two previous studies have introduced a method by which to assess recruitment volumes quantitatively using EIT based on the theory of the minimal predicted lung volume (i.e., calculating the difference between the ΔEELV as measured by EIT and the product of Crs and ΔPEEP), the reference methods also selected the simplified minimal predicted lung volume method, and ΔEELV was measured using the helium dilution technique or the integral of flow waveform during release maneuvers.19,20 The weakness of the simplified minimal predicted lung method is that it is based on the assumption that lung compliance will remain constant regardless of PEEP adjustment, but many studies, including our own, have shown that PEEP had an obvious effect on lung compliance. 21 The previous study also found that recruitment volume that is assessed using this simplified method was correlated but significantly lower than the recruitment volume that was assessed by P-V curves. 21 Similarly, in our study, we also obtained VDER that was assessed by EIT based on the simplified minimal predicted lung method, as VDER-MPV, and we found that VDER-MPV underestimated the recruitment volume compared with VDER-PV with a relatively large difference; the bias (the lower and upper limits of agreement) was −65 (−275 to 145) mL. Although the MPV method is simpler to use in clinical practice, the VDER assessed by the P-I curves was relatively more accurate.
There are several limitations in our study. First, we set up an experimental acute lung injury model using hydrochloric acid. This allowed for a relatively steady model, but we did not observe any examples of lung injury that resulted from different etiologies (such as saline surfactant wash-out or oleic acid injection). Second, we measured the VDER with the P-V curves as the reference instead of performing the “gold standard,” (i.e., CT method), but a previous study showed that there was a good correlation between values that were measured by CT and P-V curves. 9 Third, EIT imaging is related to the EIT belt position, and only approximately 50% of the lung area is covered.
Conclusions
P-I curves that are derived from EIT can be used to assess global and regional lung VDER during low constant flow at the bedside. Further studies are required to explore the potential to balance the regional VDER distribution with personalized PEEP settings.
Footnotes
Declaration of conflicting interest
The authors declare that there is no conflict of interest.
Funding
Funding was received from the National Natural Science Foundation of China (No: 81871582). The sponsor had no role in the study design, data collection, data analysis, data interpretation, or writing of the report.