
Abstract
Objective
Circulating miR-146a is aberrantly expressed in patients with type 2 diabetes (T2D), probably resulting from gene polymorphisms. However, the role of polymorphism rs2910164 in T2D pathogenesis remains controversial. Thus, we designed a meta-analysis to investigate the association between rs2910164 and T2D.
Methods
PubMed and Embase were searched for eligible papers in English published through September 2, 2019. Random or fixed effect models were used to determine risk estimates according to heterogeneities.
Results
Four studies, involving 2,069 patients and 1,950 controls, were included. Odds ratios (ORs) and 95% confidence intervals (95% CIs) were used to pool the effect size. The pooled ORs and 95% CIs were 1.501 (0.887–2.541), 1.102 (0.931–1.304), 1.276 (0.900–1.811), 1.204 (0.878–1.652), 1.238 (0.880–1.740), and 1.350 (0.904–2.016) under the homozygote, heterozygote (CG vs. GG and CC vs. CG), dominant, allele, and recessive models, respectively. Heterogeneity was detected in most genetic models, with subgroup analyses performed by ethnicity, genotyping method, and disease duration. The co-dominant model was determined to be the most appropriate genetic model.
Conclusions
Our findings suggested that polymorphism rs2910164 is not correlated with T2D susceptibility. However, the results should be interpreted with caution because of confounding factors.
Keywords
Introduction
Diabetes is a chronic disease with a worldwide prevalence, and it leads to considerable social and economic burden. Type 2 diabetes mellitus (T2D) is the principal form. 1 However, the mechanism underlying T2D remains incompletely understood. MicroRNAs (miRNAs), consisting of 20 to 25 nucleotides, are noncoding, single-stranded RNAs that play crucial roles as transcriptional regulators of cellular signaling and metabolism. Previous studies have demonstrated that miRNAs participate in a variety of biological processes, including apoptosis and pathogenesis in diabetes.2–5 Recently, the association between single nucleotide polymorphism (SNP) rs2910164 of miR-146a and T2D has been investigated; however, studies to date have produced conflicting results, perhaps because of different ethnicities, small sample sizes, and other confounding factors.6–13 Therefore, through a meta-analysis, we aimed to determine the possible effect of miR-146a variant rs2910164 on T2D pathogenesis, which, to the best of our knowledge, has not been previously investigated.
Methods
Search strategy
In conducting this meta-analysis, we followed the PRISMA 2009 checklist. A literature search was carried out on September 2, 2019, in the PubMed and Embase databases for English papers published on or before this date. Two searching strategies were used: (1) keywords for microRNA-146a: “microRNA-146a” or “miRNA-146a” or “miR-146a”; and (2) keywords for the disease “diabetes.” To obtain more qualified studies, we also manually searched the documents cited in review papers and other relevant studies. Because the study used only publicly available data, ethical approval was deemed unnecessary.
Eligibility criteria
All studies were carefully evaluated by two individuals (ZDM and ZM). A third author (CLQ) assisted in checking when discrepant results were found. The inclusion criteria were as follows: (1) evaluation of miR-146a rs2910164 polymorphism and T2D risks, including prospective studies and case-control studies; (2) qualified and sufficient data to calculate odds ratios (ORs) and 95% confidence intervals (CIs); (3) limited to human studies. Non-original papers and duplicate studies were excluded.
Data extraction and quality assessment
Two reviewers (ZDM and ZM) independently extracted the following data from the enrolled studies: (1) study characteristics (first author, country, publication year, country of origin, ethnicity); (2) characteristics of genotype information (genotypes, alleles, Hardy–Weinberg equilibrium (HWE) of control, frequency of C allele in control); (3) study quality assessment. Depending on the source of the control, we defined controls as population-based or hospital-based.
The quality assessment of each included study was implemented by two authors (ZDM and ZM) by using the modified Newcastle–Ottawa scale (NOS) as described before. 14 , 15 Quality scores ranged from 0 (worst) to 11 (best). Studies with a score ≥8 were classified as high quality.
Statistical analysis
A P-value of HWE >0.05 in the control group calculated by χ2 test was regarded as fulfilling HWE. 16 ORs with 95% CIs was used to measure the strength of association between miR-146a rs2910164 and T2D susceptibility. Three pooled ORs with corresponding 95% CIs of rs2910164, homozygote model (OR1, CC vs. GG), heterozygote model (OR2, CG vs. GG, and OR3, CC vs. CG) were estimated to screen for the most appropriate genetic model, as described previously 17 , 18 (recessive model GG vs. CC +GC: OR1 =OR3 ≠ 1 and OR2 = 1; dominant model GG + GC vs. CC: OR1 = OR2 ≠ 1 and OR3 = 1; co-dominant model, OR1 and OR2: OR1 > OR2 > 1 and OR1 >OR3 > 1, or OR1 < OR2 < 1 and OR1 < OR3 < 1). In addition to the selected genetic model, several other genetic comparison models were also conducted: allele model (C vs. G), dominant model (CC + CG vs. GG), recessive model (CC vs. CG+ GG), and over-dominant model (GG+CC vs. GC).
The heterogeneity assumption among eligible studies was evaluated by I2 test and Q test. A P-value of < 0.05 for the Q test or I2 ≥ 50% was considered to indicate significant heterogeneity, meaning that the random-effects model should be used to perform the meta-analysis; otherwise, the fixed-effects model should be used. Subgroup analysis was carried out according to ethnicity (Asian and Caucasian). To examine potential publication bias, Egger’s test was applied. 19 A sensitivity analysis was conducted to test the stability of the results by removing each study one by one. All statistical analyses were performed using Stata 12.0 Software (Stata Corp., College Station, TX, USA). A two-sided P-value < 0.05 was considered statistically significant.
Results
Study selection and characteristics
Ninety-seven relevant articles were identified by extensive searching, two of which were removed as duplicates. After preliminary screening of titles and abstracts, we excluded 89 articles for various reasons (irrelevant papers, non-human studies, and studies not focusing on the association between rs2910164 of miR-146a and T2D). Therefore, we pursued seven full-text articles,6–12 and added one publication 13 by manually searching the references of the full-text papers. Finally, four publications met our inclusion criteria and were chosen for pooled evaluations, 9 , 10 , 12 , 13 including 2,069 cases and 1,950 controls. The PRISMA flow chart is provided in Figure 1.

PRISMA flow chart showing identification of studies for inclusion in the meta-analysis.
Characteristics of studies included in this meta-analysis of the association between miR-146a rs2910164 polymorphism and T2D are summarized in Table 1. The publication time ranged from 2013 to 2016. Two studies were conducted in China, one in Italy, and one in Iran. Genotyping methods included direct sequencing, mini-sequencing, PCR-restriction fragment length polymorphism (RFLP), and PCR-TaqMan assay. Quality scores were all ≥8. Genotype distribution in controls was consistent with HWE.
Characteristics of included studies.

Overall meta-analysis
OR1,OR2, and OR3 were calculated as previously described, and demonstrated that OR1 > OR2 > 1 and OR1 > OR3 > 1; thus, the co-dominant model (including homozygote model CC vs. GG and heterozygote model CG vs. GG) was regarded as the most appropriate genetic model. Heterogeneity was present in the homozygote model (OR1, CC vs. GG: P = 0.001, I2 = 81.7%) and absent in the heterozygote model (OR2, CG vs. GG: P = 0.191, I2 = 36.9%). Therefore, a random-effects model was selected for OR1 (CC vs. GG) and a fixed-effects model was selected for OR2 (CG vs. GG). No significant association was identified with pooled ORs from all eligible studies in the overall population in the co-dominant genetic model (OR = 1.501, 95% CI = 0.887–2.541 for CC vs. GG; OR = 1.105, 95% CI =0.883–1.383 for CG vs. GG; Figure 2 and Table 2). We performed several other comparisons using the dominant model (CC + CG vs. GG: OR = 1.204, 95% CI =0.878–1.652), the heterozygote model (CC vs. CG: OR = 1.276, 95% CI = 0.900–1.811), the allele model (C vs. G: OR =1.238, 95% CI = 0.880–1.740), the recessive model (CC vs. CG+CC: OR = 1.350, 95% CI = 0.904–2.016), and the over-dominant model (GG+CC vs. CG: OR = 1.044, 95% CI = 0.921–1.184), respectively, to assess the association between rs13266634 variants and susceptibility to T2D; none of the pooled results were significant (Table 2 and Figures 3 to 5).

Forest plot of pooled ORs from all eligible studies in the overall population in the co-dominant model. (a) Homozygote model (OR1, CC vs. GG) and (b) heterozygote model (OR2, CG vs. GG). OR, odds ratio.
Meta-analysis results under different genetic models by population.

*Under fixed model.
OR, odds ratio; 95% CI, 95% confidence interval. P column refers to the significance of OR(95%CI) at the same row as well as P(Q) to the heterogeneity test.

Forest plot of pooled ORs from all eligible studies in the overall population in the heterozygote model (OR3, CC vs. CG). OR, odds ratio; CI, confidence interval.

Forest plot of pooled ORs from all eligible studies in the overall population in the allelic model (C vs. G). OR, odds ratio; CI, confidence interval.

Forest plot of pooled ORs from all eligible studies in the overall population in the recessive model (CC vs. CG+ GG). OR, odds ratio; CI, confidence interval.
Subgroup and sensitivity analyses
The results from four studies including 2,069 T2D patients and 1,950 healthy individuals were pooled. Because significant heterogeneity was present in some overall analyses, stratified analyses were performed according to ethnic groups, genotyping methods, and disease duration. In the chosen genetic model (co-dominant model, including homozygote model, CC vs. GG, and heterozygote model, CG vs. GG), we found no evidence of a significant association between miR-146a rs2910164 and T2D in Asians or Caucasians (CC vs. GG: OR = 1.371, 95% CI = 0.629–2.991 for Asians, and OR = 1.749, 95% CI = 0.914–3.348 for Caucasians; CG vs. GG: OR = 1.194, 95% CI = 0.835–1.708 for Asians, and OR = 0.983, 95% CI = 0.700–1.381 for Caucasians). Similarly, no significant association was observed when the cases and controls were stratified according to ethnicity under other genetic models except under the heterozygote model (OR3, CC vs. CG: OR = 1.773, 95% CI = 1.029–3.054, P =0.039) and the recessive model (CC vs. CG+CC: OR = 1.179, 95% CI = 1.061–2.983, P = 0.029) for Caucasians (Table 2). Interestingly, we observed a significant difference in the PCR-genotyped subgroup (including PCR-TaqMan assay and PCR-RFLP) under all genetic models (CC +CG vs. GG: OR = 1.597, 95% CI = 1.244–2.050, P < 0.0001; CC vs. CG: OR = 2.112, 95% CI = 1.562–2.855, P < 0.0001; CG vs. GG: OR = 1.344, 95% CI = 1.028–1.757 P =0.030; CC vs. CG: OR = 1.457, 95% CI = 1.168–1.817, P = 0.001; C vs. G: OR =1.639, 95% CI = 1.418–1.893, P < 0.0001, CC vs. CG+CC: OR = 1.612, 95% CI = 1.276–2.037, P < 0.0001) except in the over-dominant model (CC+GG vs. CG: OR = 1.145, 95% CI = 0.943-1.389), but no significance in the sequencing-genotyped population (direct sequencing and mini-sequencing) under all genetic models (Table 3). When cases were subdivided by disease duration, we found a positive statistical association under the homozygote model (OR1, CC vs. GG: OR = 1.972, 95% CI =1.487–2.615, P < 0.0001), the heterozygote model (OR3, CC vs. CG: OR = 1.458, 95% CI = 1.177–1.805, P = 0.001), the allelic model (C vs. G: OR = 1.382, 95% CI = 1.104–1.884, P = 0.041), and the recessive model (CC vs. CG+CC: OR = 1.578, 95% CI = 1.292–1.927, P < 0.0001) in the mixed-duration studies (Table 4).
Subgroup analysis according to genotyping method.
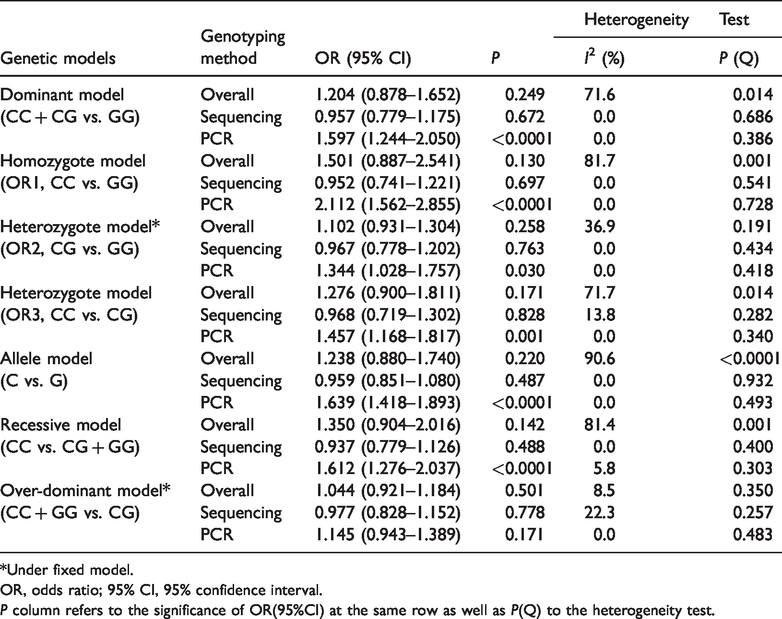
*Under fixed model.
OR, odds ratio; 95% CI, 95% confidence interval.P column refers to the significance of OR(95%CI) at the same row as well as P(Q) to the heterogeneity test.
Subgroup analysis according to disease duration.

*Under fixed model.
OR, odds ratio; 95% CI, 95% confidence interval.P column refers to the significance of OR(95%CI) at the same row as well as P(Q) to the heterogeneity test.
To evaluate the effect of individual study on the pooled results, we undertook a sensitivity analysis by sequentially deleting one study each time. The sensitivity analysis revealed that the pooled OR lay within the overall range of 95% CIs after omitting any single study, indicating that the results were stable (Figure 6).

Sensitivity analysis indicating stable results: the pooled ORs lay within the overall range of 95% CIs after removing each individual study one by one. ORs, odds ratios; CIs, confidence intervals.
Publication bias
Egger’s test was conducted to analyze publication bias (Figure 7). Although the P-value obtained from Egger’s test was >0.05 (P = 0.771), the interpretation regarding publication bias should be made with caution owing to the limited number of included studies.

The visually symmetrical funnel plot and Egger’s test (P = 0.771) showed no potential publication bias.
Discussion
Considering the global prevalence of diabetes resulting in high all-cause mortality and healthcare costs, 20 substantial research efforts have been made to understand its pathogenesis. Multiple studies have found that circulating small, noncoding RNAs (miRNAs) can modulate mRNA expression post-transcriptionally and further participate in pathogenesis of diseases. 21 The miRNAs identified and associated with diabetes mostly affect pancreatic islet β-cell biological processes, including cell development and maintenance of function.22–24 Growing evidence suggests that miR-146a plays a significant role in the pathogenesis of diabetes by participating in beta-cell metabolism, proliferation, and death. It is detected in serum, T cells, and α- and β-cells of patients with diabetes, suggesting that miR-146a is a potential biomarker and therapeutic target.25–27 Previous studies have indicated that miR-146a plays a role in innate immunity and negatively regulates the inflammatory response by controlling regulatory T (Treg) cell-mediated regulation of helper T (Th)1 responses and decreasing nuclear factor-κB activity.28–30 These findings may explain why miR-146a is negatively related in patients newly diagnosed with type 1 diabetes (T1D) and negatively related to high autoantibody titers, 31 and consistent with the finding of lower levels of miR-146a in Han Chinese patients with T2D compared with the control group. 32 In contrast, miR-146a was found to be elevated in islets of non-obese diabetic mice with insulitis, and its blockade benefited cytokine-stimulated MIN6 cells. 25 Alipoor et al. 6 revealed that polymorphism rs2910164 of miR-146a resulted in an unstable structure of pre-miR-146a. Several studies have explored the function of circulating miR-146a and distribution of its SNPs in the pathogenesis of diabetes and associated complications,6–11, 13 but inconsistent results have been reported. However, a meta-analysis of the potential role of miR-146a variant rs2910164 in T2D has not been conducted to date. To better quantify the association between rs2910164 variant and T2D and generate a more robust result, we performed this meta-analysis.
In contrast to reports that miR-146a rs2910164 variant was associated with protection for T1D, 7 the results of our meta-analysis indicated no significant association between miR-146a SNP rs2910164 and T2D in the overall population under multiple genetic models (all overall P-values > 0.05). In our analysis, we included four studies, two of which reported that the frequency of the CC genotype variant of miR-146a rs2910164 was significantly higher in diabetic patients than in controls in Iranian 9 and Chinese 12 populations, distinct from the other two studies (Italian and Chinese populations). 10 , 13 Among the four studies, the results of one of the Chinese studies 10 were considered the most convincing because of the large sample size, unique population (Chinese Han), and relatively specialized disease duration (newly diagnosed), and were in line with our pooled results. Heterogeneity was found in most genetic models among the studies, so we performed stratified analyses by ethnicity, genotyping method, and disease duration to determine the potential source. Heterogeneity was not detected within the Caucasian population in most genetic models but was found in the dominant and allelic models, and a significant association was found in the Caucasian population under the heterozygote (CC vs. CG) and recessive (CC vs. CG+CC) models but not in the Asian population under any genetic model (Table 2). Interestingly, when we stratified studies by genotyping method, heterogeneity was not detected within PCR or sequencing group under any genetic models, and a significant association was found in the PCR group under all genetic models except the over-dominant model (CC + GG vs. CG). For disease duration, the mixed duration group compared with newly diagnosed group 10 showed no heterogeneity under several genetic models (CC vs. GG, CG vs. GG, CC vs. CG, CC vs. CG+ GG, and CC + GG vs. CG) and a significant association under some genetic models (CC vs. GG, CC vs. CG, C vs. G and CC vs. CG+ GG) (Table 3). Hence, we propose that the heterogeneity might result mainly from diverse ethnicity, sequencing methods, and disease duration. Additionally, factors such as clinical diversity and methodological diversity (including criteria of patients and controls, therapies of T2D, sample sizes, female/male ratio, publication bias) may affect the summary results.
We considered that the co-dominant model (CC vs. GG and CG vs. GG) might be the most appropriate genetic model for rs2910164 according to previously described methods. 17 , 18 Under this genetic model, pooled results showed no evidence of a significant association between rs2910164 of miR-146a and T2D in overall population, Asians, or Caucasians.
Notably, several limitations exist in our meta-analysis. First, few studies on miR-146a SNP as a novel biomarker for T2D have been performed. Despite the having included all eligible papers published and Egger’s test showing the absence of publication bias, the reliability of the summary results may be affected by publication bias because they originate from a small number of authors. Small sample size, different genotyping methods and disease duration, mixed ethnicities, and publication bias may have confounded the pooled results, as mentioned above. Large-scale and multi-center studies are needed to validate our findings, especially studies focusing on unique ethnicities, patients with similar disease durations, and multiple genotyping methods. Second, the SNP rs2910164 was previously shown to be associated with other diseases, including T1D, 7 which indicates that this SNP not a specific biomarker for T2D and may be involved in some common pathways. Third, cross-sectional studies have a limitation of temporality because such studies may mistake future “patients” as present-day “healthy controls.” Finally, therapies and complications should be taken into consideration.
Overall, our study is the first meta-analysis to assess the potential role of miR-146a SNP rs2910164 in in T2D. The results showed that rs2910164 had no significant effect on T2D pathogenesis and progression, indicating that rs2910164 may not be a valuable biomarker to distinguish T2D patients from the healthy population. Nevertheless, given the limited number of studies included in the analysis, future large-scale and multi-center studies are needed to verify our findings and confirm the role, if any, of variant rs2910164 in T2D.