
Abstract
Objectives
We aimed to evaluate the association of nutritional status and health-related quality of life (HRQOL) among elderly Iranian residents.
Methods
We used the 36-item Short Form Health Survey (SF-36) to assess HRQOL among participants with normal nutrition status, at risk of malnutrition, and malnourished.
Results
Mean group scores for the Physical Component Summary (PCS) of the SF-36 were 44, 36.5, and 29.0 for normal, at-risk, and malnourished groups, respectively; for the Mental Component Summary (MCS), these were 47.1, 40.7, and 34.8, respectively. The PCS and MCS displayed significant positive correlation with malnutrition in three models: crude (I); age- and sex-adjusted (II); and adjusted for age, sex, education, occupation, marital status, and residence. Standardized beta coefficients of PCS in Models I–III were 1.35, 1.27, and 1.14, respectively; for MCS, these were 1.11 in all three models; all results were statistically significant. Estimated results of logistic regression were −6.023 for malnourished versus well-nourished and −2.652 for malnourished versus at risk of malnutrition.
Conclusion
Our analyses revealed the crucial impact of nutritional status on both mental and physical components of HRQOL.
Keywords
Introduction
Malnutrition or poor dietary habits are harmful for everyone, but elderly people are particularly susceptible to the negative consequences of being poorly nourished. Malnutrition is defined as insufficient, excessive, or imbalanced consumption of nutrients; it is a persistent problem worldwide that is more widespread among elderly people than in other adults. 1 It is important to consume a wide range of nutrients in appropriate quantities to maintain good health.2,3 Poor eating habits can alter health, mood, actions, and emotions. 4 Some diseases, like infections and cardiovascular diseases, are mainly caused by malnutrition in developed nations.5–7 Over the past few decades, health-related quality of life (HRQOL) has received growing attention as a tool for measuring health outcomes. At present, to evaluate nutrition status, a combination of nutritional assessment instruments can be used, such as the Mini Nutritional Assessment (MNA). 8 The MNA was established in 1994 as a noninvasive and consistent standard tool designed to evaluate nutritional status in elderly people.8–10
The number of elderly people has grown in many countries as a consequence of advances in medical technology and health care systems.11,12 According to the World Health Organization definition, people in developing countries aged over 60 years are referred to as elderly adults. 13 Factors including sensory losses, anorexia, digestive problems, chronic and acute diseases, and polypharmacy may lead to poor dietary intake in elderly people and a high risk of malnutrition.14–16 A candidate scoring system that has been well-documented is the 36-item Short Form Health Survey (SF-36).17–19 As a population, older adults are predisposed to age-related diseases, functional deficiency, and lower physical activity levels, which could interfere with maintaining an ideal nutritional status. The notion that nutritional status is a critical element in healthy aging among community-dwelling elderly people has been proposed in several studies.17,20,21 Previous studies have indicated that nutrition status is related to depression, malnutrition, and HRQOL, such as among elderly Nepali and Iranian patients.22,23
In this study, we aimed to evaluate the association of malnutrition with HRQOL, disability, and limitation among elderly people in Iran. Therefore, we assessed factors of HRQOL and nutritional status in elderly people using the SF-36 and Mini Nutritional Assessment (MNA), to determine the associations between HRQOL and malnutrition in elderly Iranian participants.
Materials and methods
Participants and data collection
To assess HRQOL in older Iranian adults, a nationwide cross-sectional study was conducted in Iran from January 2012 to January 2013, including male and female individuals over 60 years of age. Participants were randomly selected in three phases from the most populated cities in Iran (Hormozgan, Alborz, West Azerbaijan, North Khorasan, and Sistan-Baluchestan) using a stratified sampling method. A total 109 health care centers (about 22 centers in each city) were carefully chosen by means of cluster sampling. Signed informed consent forms were obtained from all participants. Valid and reliable data were then collected from participants using a questionnaire. In the first part of data collection, demographic characteristics including sex, age, current employment, marital status, education, place of residence, and ethnicity were obtained by means of a suitable survey. Family information included both demographics and health status of the family as well as nutritional habits. Inclusion criteria were age over 60 years, no serious diseases like cancer, heart diseases, or stroke over the previous 2 years. Exclusion criteria were age less than 60, being vegetarian, having serious diseases, stroke, or myocardial infarction in the previous 2 years. The second part of the questionnaire comprised items regarding socioeconomic variables. Data were collected by health care practitioners in health centers attended by elderly participants. In cases where a participant could not attend a health center, data collection was completed by health care practitioners in the patient’s home.
SF-36 and scoring
The SF-36 is used to assess HRQOL across eight domains of both physical and emotional health.17,24 The SF-36 scoring system involves 36 questions, 35 of which are categorized within eight scales: (1) physical functioning (PF) includes 10 questions related to the physical requirements of daily life; (2) role-physical (RP) is a four-item scale that assesses the level of limitation in physical capabilities and activity; (3) bodily pain (BP) is a two-item scale to estimate the level of pain in the last 4 weeks and the degree of interference with regular occupational activities; (4) general health (GH) includes five items to assess the individual’s perception of their overall health; (5) vitality (VT) addresses feelings of energy and fatigue using four questions; (6) social functioning (SF) is a two-item measure assessing the range and quantity of time spent with family, friends and other social interactions during the previous 4 weeks, as related to difficulties with physical or emotional health; (7) role-emotional (RE) evaluates the extent of emotional issues restricting occupational activities, and (8) mental health (MH) is a five-item scale that mainly assesses mental states of anxiety and depression.24,25 The scales of the SF-36 are further condensed into two dimensions, with four included in the Physical Component Summary (PCS) dimension and the other four in the Mental Component Summary (MCS) dimension (Figure 1). The total scores for the SF-36 provide an accurate numerical measure of the scale components.

Initial model for scores of the 36-item Short Form Health Survey (SF-36). Oval shapes include SF-36 physical and mental health-related elements; rectangle-shaped boxes represent contain the eight scales of the SF-36. 19
Mini Nutritional Assessment (MNA) and scoring
We used the MNA to assess nutritional status among our participants. The MNA is a rapid nutritional assessment tool for elderly people aimed at determining those at the risk of malnutrition. The MNA includes two sections: screening and evaluation. 26 The MNA covers 18 items, with a total score of 30 points. Scores ≥24 points are considered to indicate normal or good nutritional status, 16 to 23.5 indicate risk of malnutrition, and scores <16 indicate malnourishment.26,27
Statistical analysis
Outcomes of the current study were analyzed using SPSS software version 16 (SPSS, Chicago, IL, USA) and Stata 8 (StataCorp LLC, College Station, TX, USA). Mean and standard deviation (SD) and frequency and percentage were reported in descriptive statistics. The chi-squared test, Fisher exact test, independent t-test, and analysis of variance were used in the analyses. Pearson correlation was used to examine the relationship between subgroup scores of the MNA and SF-36. We used a multivariable linear regression model to evaluate the relationship between sociodemographic variables and each SF-36 subgroup; ordinal regression was used to evaluate the association between physical and emotional aspects of HRQOL and the MNA. P-values <0.05 were considered significant. For linear regression, we used three models: model I (crude model), model II (adjusted for age and sex), and model III (adjusted for age, sex, education level, occupation, marital status and urban or rural residence).
Ethics approval and consent to participate
All procedures performed in studies involving human participants were in accordance with the ethical standards of the institutional and national research committees and with the 1964 Helsinki declaration and its later amendments, or comparable ethical standards. The Endocrine and Metabolism Research Center of Tehran University of Medical Sciences allocated the ethics approval code 1395.00133 to the current research. All authors participated sufficiently in the work to take public responsibility for the appropriate portions of the content.
Results
Of the 1350 included participants, 642 (47.6%) were men and 708 (52.4%) were women. Participants’ mean age was 69.1 years; 688 (51%) participants were living in urban areas. A total 952 (70.5%) were married and 363 (26.9%) were single. Of the total, 97.2% of participants had children and 2.7% had no children. A total 856 (64.1%) of participants did not receive any pension benefits. Residence, marital status, education, and occupation showed significant differences among the three groups according to nutritional status (normal, risk of malnutrition, and malnutrition), shown in Table 1.
Sociodemographic characteristics of the study population, distributed by nutritional status.
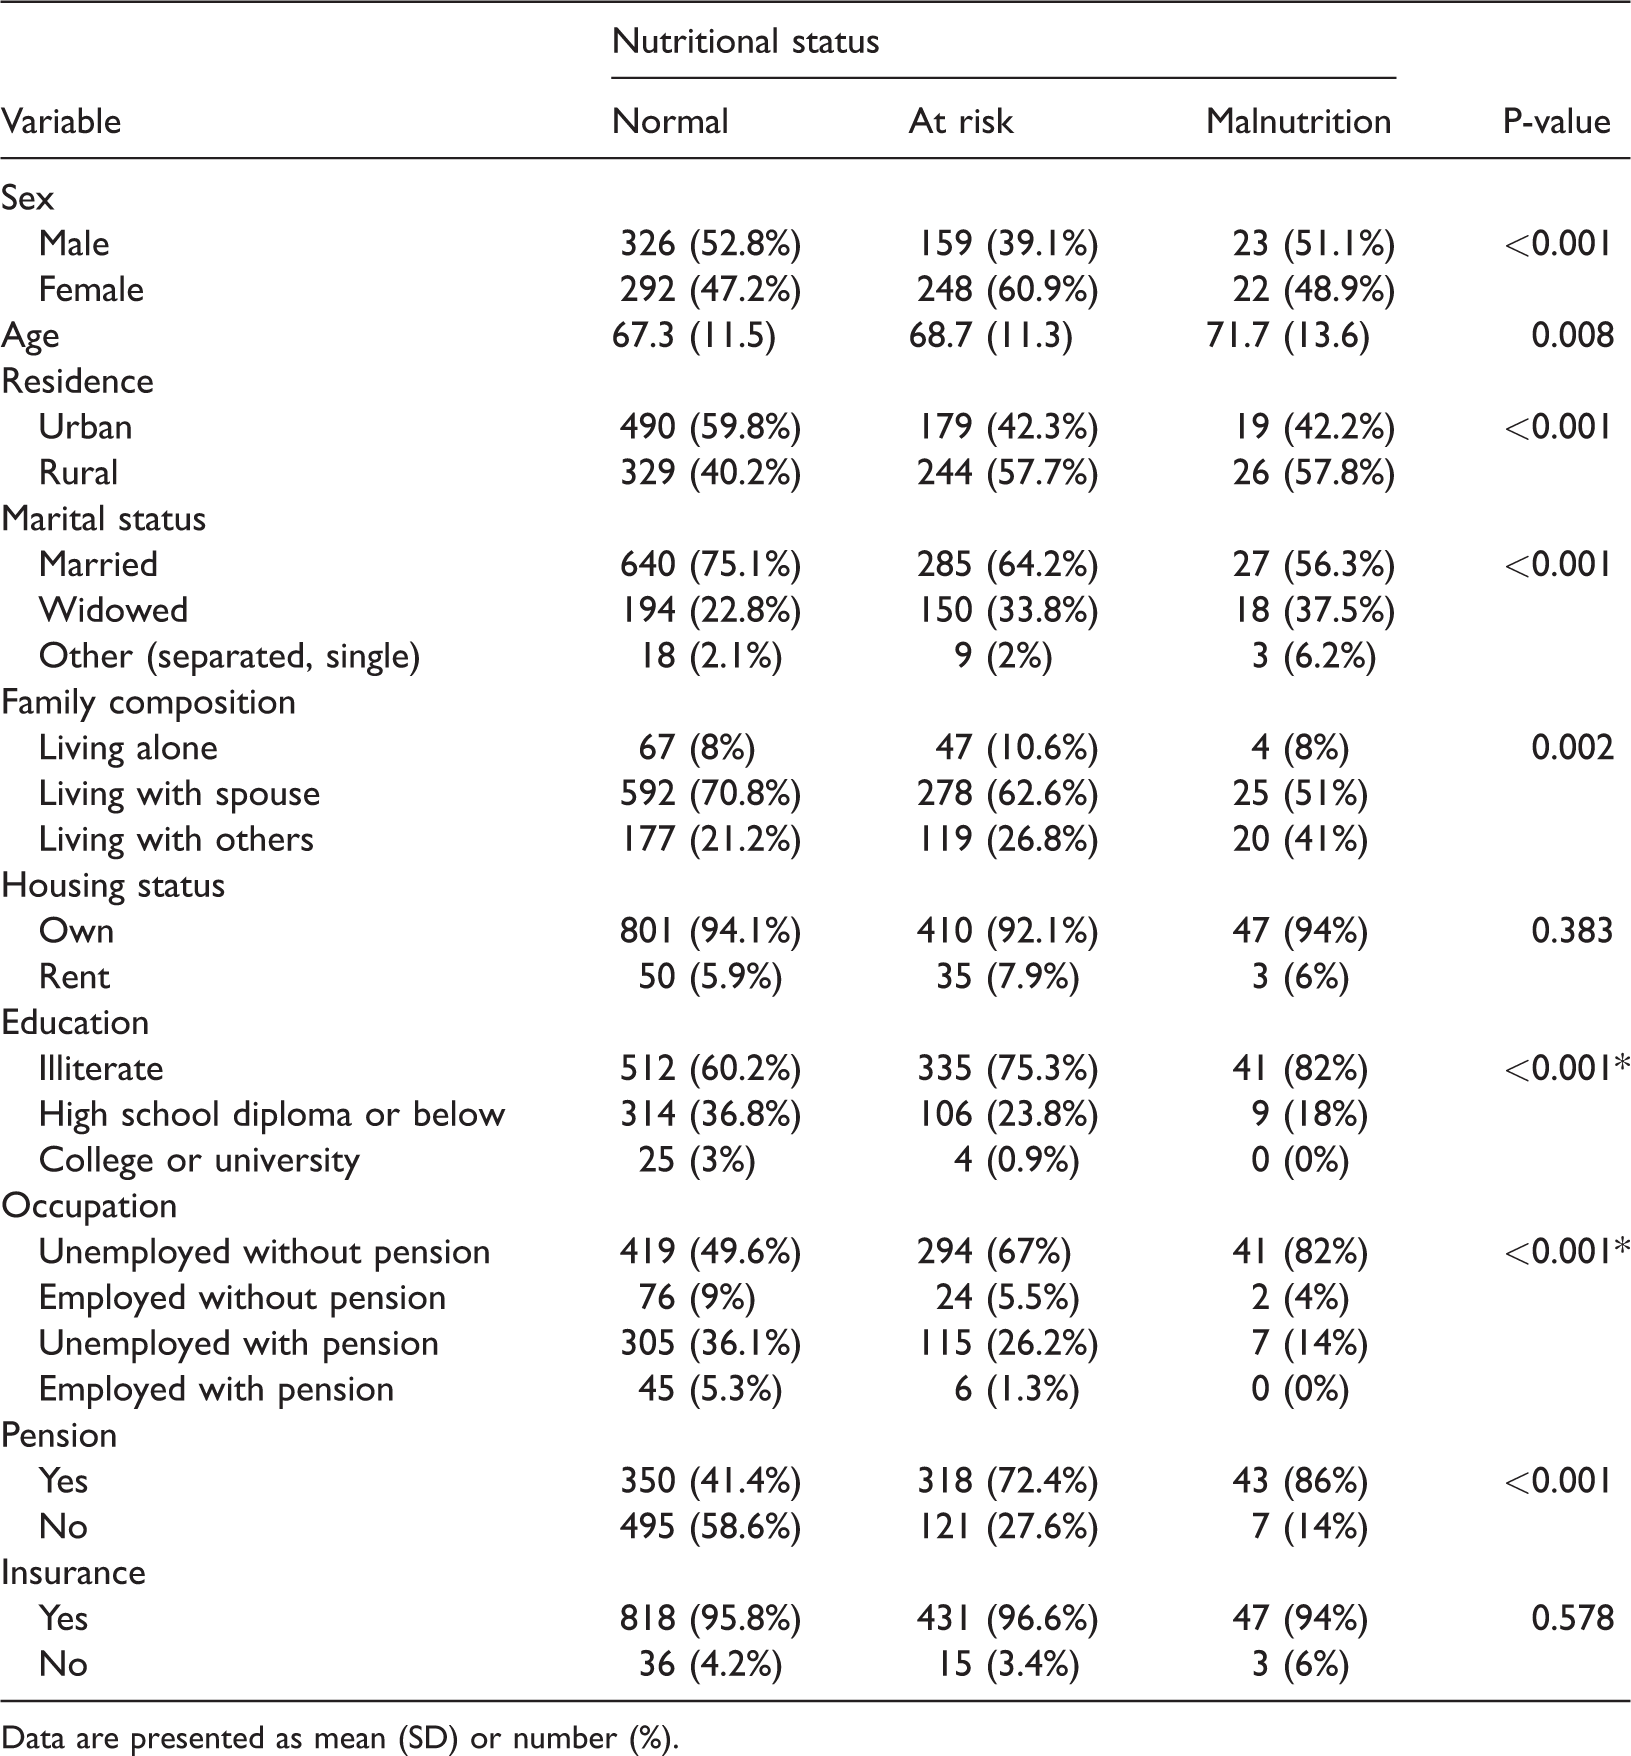
Data are presented as mean (SD) or number (%).
Mean scores for the eight scales of the SF-36 are shown in Table 2. The mean SF-36 component scores were significantly different among the three groups, according to MNA score. For the PCS, mean scores (SD) were 44.1 (9.7), 36.5 (9.3), and 29.0 (7.7) for the normal, at-risk, and malnourished groups, respectively (P ≤ 0.001); for the MCS, these were 47.1 (9.4), 40.7 (10.1), and 34.8 (10.3), respectively (P ≤ 0.001). If the other SF-36 scales were taken into the account, considerable dissimilarity was detected among elderly participants who were well nourished, those at risk of malnutrition, and those who were malnourished (Table 2).
Mean scores for Short Form-36 (SF-36) Health Survey scales according to nutritional status.
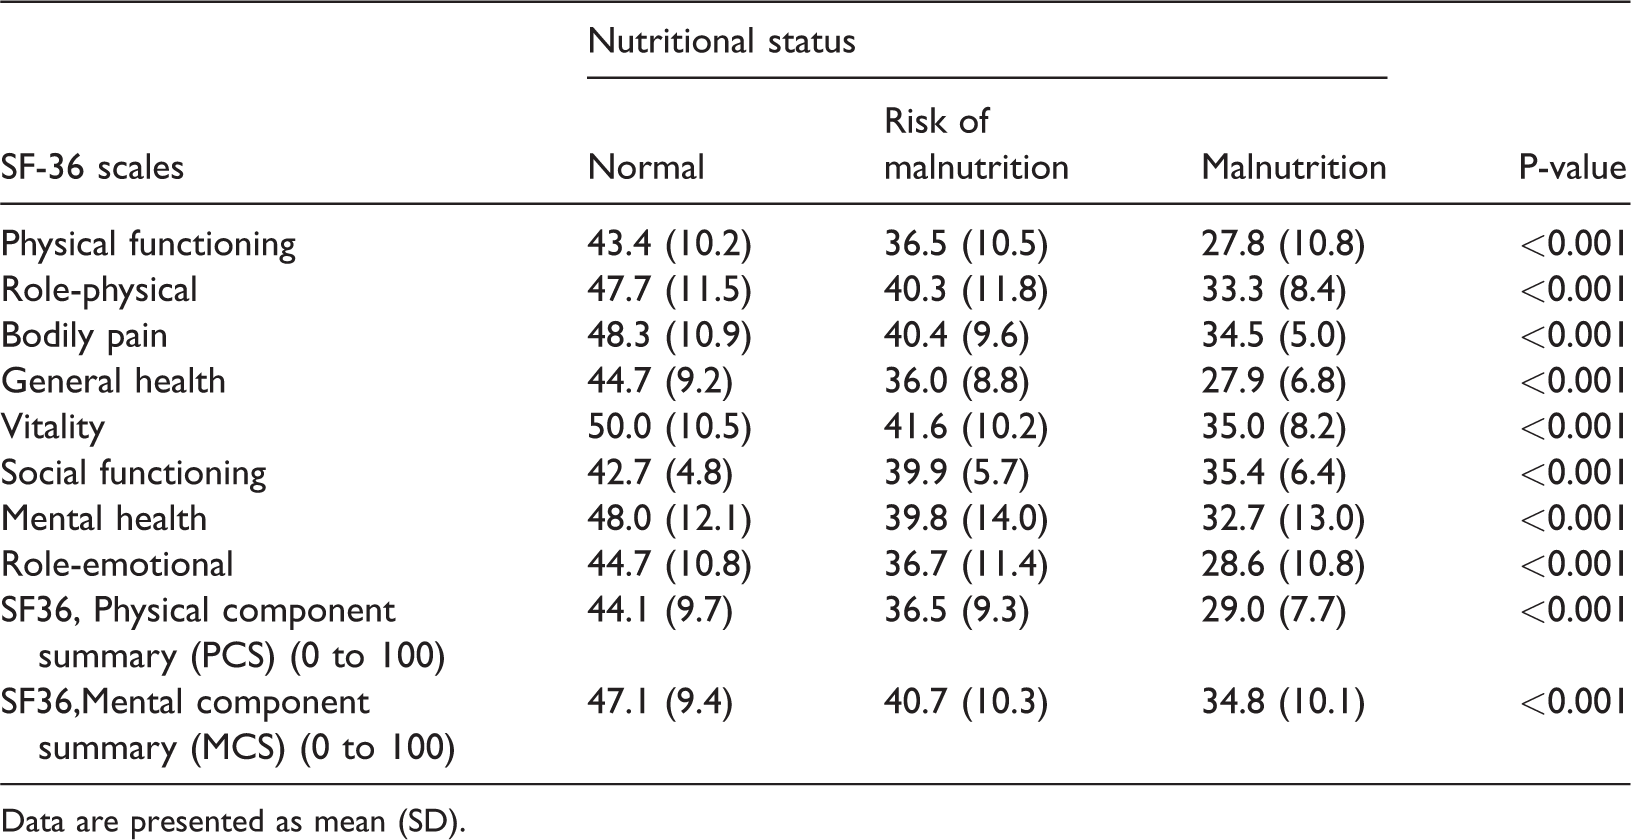
Data are presented as mean (SD).
The estimated correlations between factors of HRQOL on the SF-36 and MNA total scores are shown in Table 3. Although correlation coefficients were slightly lower for the SF and MH scales, MNA total scores were well correlated with all SF-36 scales (Table 3).
Correlation between scales of the 36-item Short Form Health Survey (SF-36) and scores of the Mini Nutritional Assessment (MNA).

Correlation coefficient: <0.3, weak; 0.3–0.7, moderate; >0.7 strong.
Results of linear regression analyses in the three models to identify associations among the different subscales of HRQOL on the SF-36 are presented in Table 4. In summary, the outcome indicated that after adjusting for other variables, the effect of malnutrition still remained (Table 4). It can be seen that there was a negative association of malnutrition with HRQOL in all participants. The SF-36 scales PF, RP, GH, MH, SF, RE, and VT and total scores for PCS and MCS showed significant positive correlation with malnutrition in the three models. The standardized beta coefficients of PCS were as follows: Model I = 1.35, Model II = 1.27, and Model III = 1.14; for MCS, these were 1.11 in all three models. P-values and correlation coefficients are given in Table 4.
Association of health-related quality of life and nutritional status among older people in linear regression models.
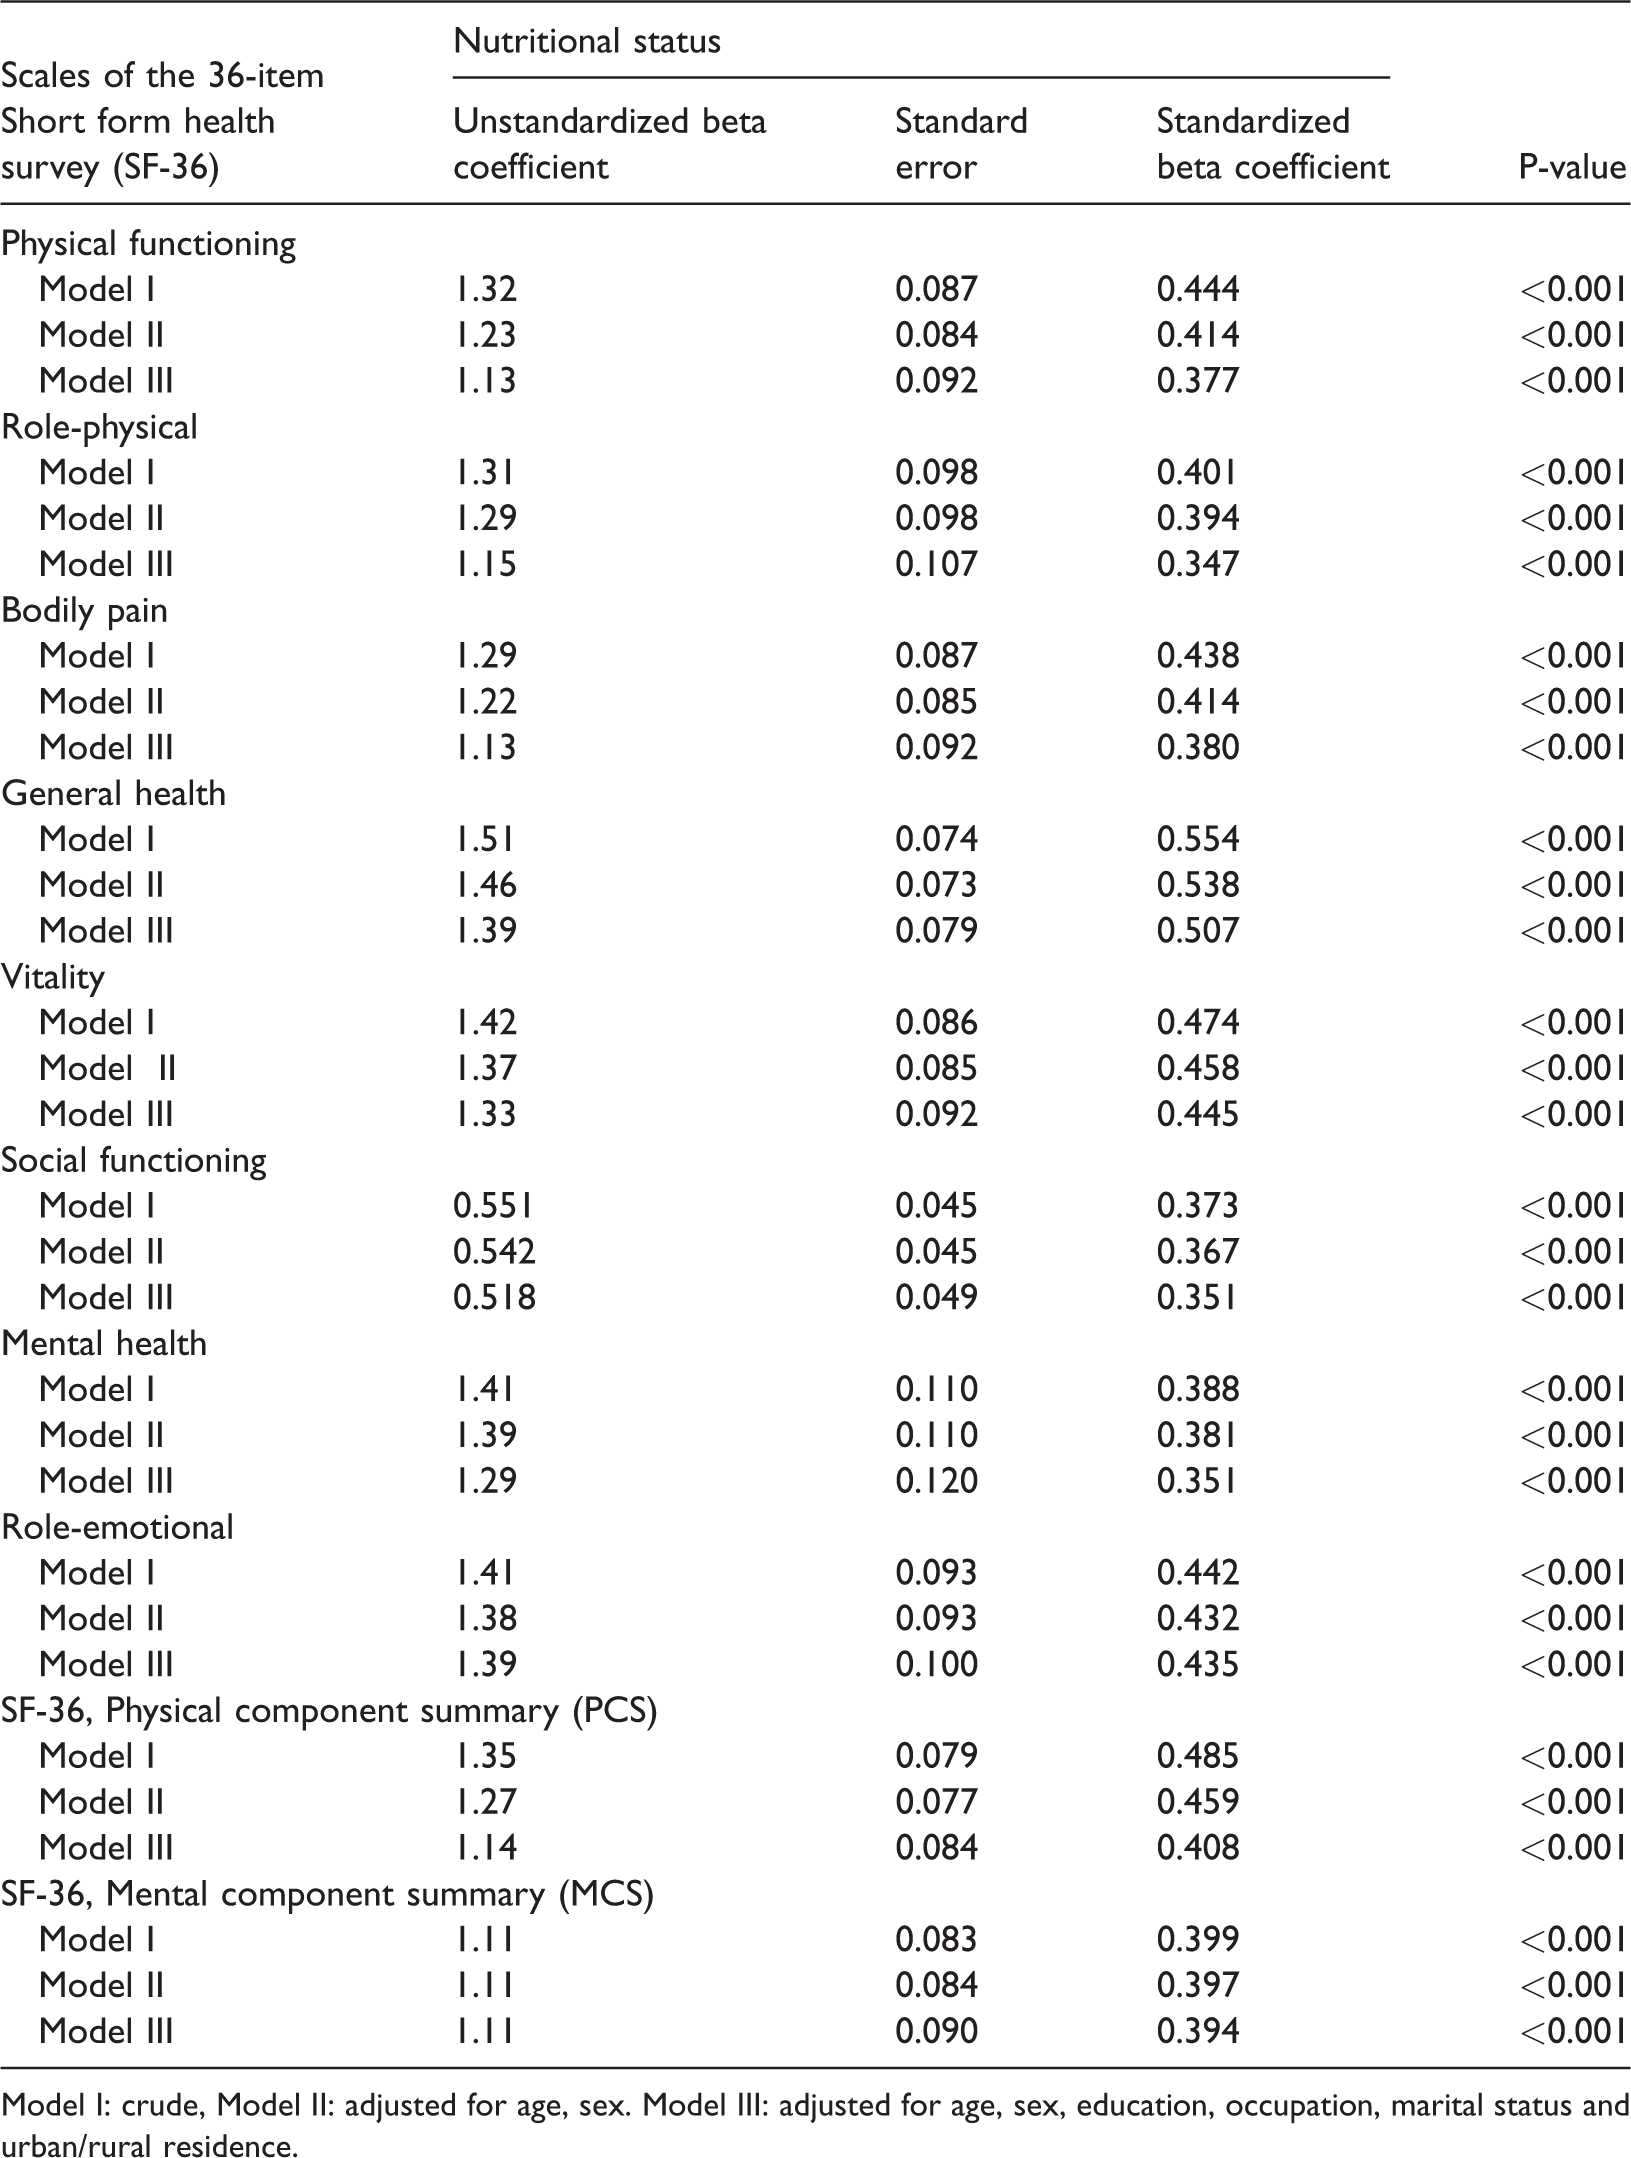
Model I: crude, Model II: adjusted for age, sex. Model III: adjusted for age, sex, education, occupation, marital status and urban/rural residence.
Results of ordinal regression confirmed the effect of poorer nutritional status leading to poorer HRQOL (Table 5). It can be concluded that malnourished elderly people have significantly worse mental and physical aspects of HRQOL in comparison with their well-nourished and at-risk counterparts. Malnutrition negatively affected both the mental and physical components of the SF-36, as compared with participants at risk of malnutrition and those with good nutritional status.
Association of health-related quality of life and nutritional status among older people in ordinal regression.

Dependent variable: nutritional status according to Mini Nutritional Assessment (MNA) groups. Factors: mental and physical components of the 36-item Short Form Health Survey (SF-36).
Discussion
Quality of life has received increasing attention owing to its effects on health.28–30 In the current study, we assessed HRQOL among 1350 elderly Iranian adults in relation to nutritional status estimated using the MNA. To our knowledge, there are no similar studies on the association between HRQOL and risk of malnutrition in Iranian elderly populations. HRQOL was evaluated with the SF-36 questionnaire, an extensively used general health status measurement tool. 31 Results from other smaller studies32–34 have demonstrated an association between the risk for malnutrition and lower HRQOL. One study reported no clear association between malnutrition and HRQOL in hospitalized elderly adults. 35 Our study revealed that malnutrition was extremely prevalent in our geriatric population. The proportion of individuals found to be at risk of malnutrition or who were malnourished was in accordance with other published works.36–39 We found statistically significant differences among the three categories of nutritional status according to MNA score for residence, marital status, education level, and occupation, similar to other studies.40–42 In contrast to well-nourished participants, those who were malnourished or at risk of malnutrition had considerably poorer HRQOL scores, mainly in the PF and RP scales. These findings regarding HRQOL confirm that these subscales are the most greatly influenced by malnutrition.22,34,43–45
It has been shown that rural or urban residence could have an impact on nutritional status.46,47 Some related research results have indicated that people living in very remote areas are substantially more susceptible to being malnourished.48,49 Moreover, reports have indicated that place of residence could have an impact on malnutrition via body mass index (BMI)50–53 or deficient protein–energy consumption, such as is common in rural elderly residents of southern India. 54 This is contrary to results demonstrating that poor nutritional status is commonly observed among elderly people living at home in both rural and urban areas. 55 The relationship between BMI and HRQOL has been examined among elderly men and women, showing poorer HRQOL in both overweight and malnourished individuals.56,57 HRQOL in obese individuals could be adversely affected in association with comorbid conditions, particularly pain; 58 however, possible explanations for low HRQOL amongst participants with low BMI are principally related to their increased risk of malnutrition.
Our findings revealed that HRQOL was considerably reduced in elderly people with poor nutritional status. As predicted, participants who were at risk of malnutrition or malnourished presented worse HRQOL, according to PCS and MCS scale scores. Similarly reports have identified a connection between HRQOL and dietary status in older hospitalized individuals. 39 The outcomes of linear regression analyses in the three models in our study generally supported these results. As shown in Table 4, global scores of nutritional status are certainly important for estimation of HRQOL. Using several regression models to examine the independent scales that make up the PCS and MCS will be helpful in correlating nutritional status with HRQOL. Dietary intake and mobility are critical for health, as shown by Perry and Donini.59,60 MNA scores showed substantial similarity with those of the SF-36, suggesting that nutritional status may be an important influencing factor on HRQOL. Patients who were categorized as malnourished or at risk of being malnourished according to MNA and SF-36 scores had considerably inferior HRQOL in comparison with well-nourished individuals, from both physical and mental perspectives.
In summary, our study made clear the relationship between malnutrition and HRQOL in our elderly Iranian participants. Factors that affect HRQOL, such as age, residence, marital status, family composition, housing status, education, occupation, receiving a pension, and having insurance appear to be important elements in determining HRQOL. 61 These factors could possibly play a role in nutritional status with respect to BMI and muscle strength.
Conclusions
In the current study, we found that malnutrition is clearly related to poorer HRQOL in older people. Statistical analyses revealed the highest impact on HRQOL was related to functional and nutritional status. Our findings strengthen the evidence regarding the role of diet as being crucial to improving HRQOL. Greater interventions are needed, to attain the goal of further enhancing HRQOL among elderly adults.
Footnotes
Authors' contributions
FK drafted the manuscript. GS, FS, and KK performed statistical analysis and created the tables. ME, MA, and ZA had a primary role in data collection and providing necessary data. PT and RH participated in the study design and RH participated in the study design and coordination of the research. All authors read and approved the final manuscript.
Acknowledgements
We are grateful to the Safety Promotion and Injury Prevention Research Centre of Shahid Beheshti University of Medical Sciences for advice and guidance.
Availability of data and material
All data will be provided with no limitations if required.
Declaration of conflicting interest
The authors declare that there is no conflict of interest.
Funding
This research received no specific grant from any funding agency in the public, commercial, or not-for-profit sectors.