
Abstract
Objective
This retrospective study attempted to identify serum biomarkers that could help to indicate treatment response in advanced nonsmall-cell lung cancer (NSCLC) patients receiving epidermal growth factor receptor-tyrosine kinase inhibitor (EGFR-TKI) treatment.
Methods
Two-dimensional fluorescence difference gel electrophoresis and matrix-assisted laser desorption/ionization time-of-flight mass spectrometry were used to identify proteins expressed in serum samples from NSCLC patients with long (>6-month) progression-free survival (PFS) periods, following EGFR-TKI treatment.
Results
Serum amyloid P component (APCS), α1-antitrypsin (AAT), fibrinogen-α (FGA), keratin type I cytoskeletal 10 (KRT10) and serotransferrin (TF) expression differed between samples taken from 18 patients before treatment (baseline) and when progressive disease (PD) was observed, during treatment. Changes in AAT, KRT10 and APCS levels were validated by Western blot analysis in the sample pool; findings were further validated by Western blot analysis in a random sample of four patients. These proteins were also present in serum samples obtained from the same patients at the partial response (PR) timepoint during EGFR-TKI treatment. AAT was upregulated at PD compared with baseline, but downregulated during the PR phase.
Conclusion
These observations suggest that AAT could be used as a serological biomarker for predicting the utility of EGFR-TKI treatment for advanced NSCLC.
Introduction
Globally, lung cancer is the most common cause of cancer-related death. 1 Nonsmall-cell lung cancer (NSCLC) accounts for ∼80% of all lung cancers and the 5-year survival rate for patients with advanced NSCLC is poor, at ∼16%. 2 Although multidisciplinary diagnosis and treatment strategies have long been used in lung cancer, there have not been qualitative improvements in outcomes.1,2 Epidermal growth factor receptor-tyrosine kinase inhibitors (EGFR-TKIs), such as gefitinib (Iressa®, marketed by AstraZeneca and Teva) and erlotinib (Tarceva®, marketed by Genzyme) are promising therapies for patients with NSCLC. Research undertaken in the Western world, mainly involving patients with advanced NSCLC (stages IIIB or IV, according to NSCLC criteria 3 ), found that those with EGFR gene mutations who received EGFR-TKIs had a 67% response rate and an overall survival time of ∼24 months. 4 Use of the polymerase chain reaction or the amplification refractory mutation system (ARMS) to detect EGFR mutations in tissue samples is a reliable guide for assessing EGFR-TKI use.5,6 For most patients, however, it is impossible to obtain tissue samples at each stage of treatment, to predict or evaluate the efficacy of EGFR-TKIs. Blood testing is a relatively easy method for tracking treatment progress, and is conducive to dynamic observation. Unfortunately, however, the sensitivity of detecting EGFR mutations in blood is very low, and the search for specific serological markers to guide the use of EGFR-TKI therapy is consequently an important approach for improving rates of therapeutic response and survival, in patients with lung cancer.
Proteins are executors of physiological function and their expression patterns directly reflect various life phenomena. In order to perform physiological functions, proteins exhibit varied and dynamic patterns of expression that contrast with the fixed nature of the genome. In the mid-1990s, the study of protein expression levels and activities became the focus of the (then-new) discipline of proteomics.7,8
Using two-dimensional fluorescence difference gel electrophoresis (2D-DIGE), the present study retrospectively compared serum proteome expression at the following disease stages, in patients with advanced lung adenocarcinoma: baseline (i.e., before therapeutic intervention with EGFR-TKIs); complete response (CR); partial response (PR); progressive disease (PD). These disease stages were defined according to the RECIST guidelines (version 1.1). 9 The analyses were undertaken in order to identify differentially expressed proteins, which had the potential for use as serological biomarkers to predict the efficacy of EGFR-TKI in the treatment of advanced NSCLC.
Patients and methods
Patients diagnosed with advanced stage lung adenocarcinoma by tissue pathology at the Respiratory Institute, People’s Liberation Army General Hospital, Beijing, China, were identified between January 1 and December 31, 2007. Patients were included in the study if they satisfied the following criteria: (i) diagnosis of advanced stage (IIIB or IV 3 ) lung adenocarcinoma by tissue examination; (ii) treatment with 150 mg erlotinib or 250 mg gefitinib per day, orally, for ≥14 days; (iii) NSCLC demonstrated a favourable response to EGFR-TKIs ≤3 months after commencing treatment; (iv) survival period was ≥3 months after taking EGFR-TKIs; (v) measureable lesions were identified in lungs; (vi) no previous or concomitant diagnosis of malignant disease. Measureable lesions were identified by chest computed tomography scans, which were undertaken every 4 weeks during EGFR-TKI treatment. The point when measureable lesions were identified in lungs was classified as PD. 9
Peripheral venous blood was sampled, as described below, from all patients before they began taking EGFR-TKIs; testing was repeated every 4 weeks during EGFR-TKI treatment. Patient response over the course of therapy was defined as CR, PR and PD, 9 depending on the findings of the examinations undertaken at each 4-week timepoint during therapy.
Of the patients sampled, those with a progression-free survival (PFS) period >6 months were then selected for proteome analysis. Samples for proteome analysis in these patients were the blood specimens collected before EGFR-TKI treatment (designated long PFS, baseline; Lb) and those taken at the time when the patient was shown to have PD (designated long PFS, after treatment, La). Clinicopathological information (age, sex, pathology, smoking history and tumour, node, metastasis [TNM] stage 3 ) was available for all participants.
This study was approved by the Ethics Committee of the People’s Liberation Army General Hospital. Patients provided verbal informed consent for blood sample collection, and for inclusion of their data in the study.
Blood sample collection
Samples of 5 ml of peripheral venous whole blood were taken using BD Vacutainer® K2EDTA tubes (Becton, Dickinson and Co., Franklin Lakes, NJ, USA) . The tubes were labelled with the patient’s name and blood sampling time, and were kept upright for 15 min at 4℃. Whole blood was then centrifuged at 3000
Protein sample preparation
High-abundance proteins were removed from all of the serum samples using a liquid chromatographic column (GE Healthcare Bio-Sciences, Uppsala, Sweden) and were further concentrated. Protein concentrations (µg/μl) were determined in duplicate by the Bradford method (Bio-Rad, Hercules, CA, USA) and confirmed by sodium dodecyl sulphate–polyacrylamide gel electrophoresis (SDS–PAGE).
2D-DIGE procedures
For the 2D-DIGE procedures, equal amounts of protein from those patients showing long PFS periods (i.e., one La and one Lb sample for each patient) were pooled as the internal standard, and were labelled with the cyanine dyes Cy3 and Cy5 respectively; these samples were designated La1, La2, Lb1 and Lb2, respectively. Internal standards were labelled with Cy2 and were designated La3 and Lb3, respectively. Samples labelled with Cy3 and Cy5 (50 µg each) from each patient were combined before mixing with 50 µg of Cy2-labelled internal standard. Equal volumes of 2 × sample buffer (7 M urea, 2 M thiourea, 4% 3-[(3-cholamidopropyl)-dimethylammonio]-1-propane sulphonate [CHAPS], 1% Bio-Lyte® [Bio-Rad], pH 3–10, 0.01 g dithiothreitol [DTT]) were added to the sample, and the total volume was made up to 350 μl with rehydration buffer (pH 3–10, 7 M urea, 2 M thiourea, 4% CHAPS, 0.2% Bio-Lyte®, 0.02 g DTT).
Isoelectric focusing (IEF) was performed with a Protean® IEF Cell (Bio-Rad) using 18-cm immobilized pH gradient (IPG) strips, pH range 3–10 (Bio-Rad), at 20℃ for 10 min. IEF was performed for a total of 80 kVh (ramped to 50 V in 12 h, held at 100 V for 1 h, 300 V for 1 h, 600 V for 1 h, 1000 V for 1 h, ramped to 3000 V in 2 h, ramped to 10 000 V in 2 h, held at 10 000 V for 80 kV for 1 h). The IPG strips were equilibrated in equilibration buffer (6 M urea, 2% SDS, 50 mM Tris–HCl, pH 8.8, 30% glycerol) supplemented with 0.5% DTT for 15 min at room temperature, followed by 4.5% iodoacetamide in equilibration buffer for another 15 min of incubation at room temperature.
The IPG strips were placed on the top of 10% homogeneous polyacrylamide gels that had been precast with low-fluorescence glass plates using an Ettan™ DAL Ttwelve gel caster (GE Healthcare Biosciences). The second-dimension SDS–PAGE was performed with the Protean® Plus system (Bio-Rad).
After 2D-DIGE, gels were scanned with a Typhoon 9410 scanner (GE Healthcare Biosciences) with Ettan™ DALT gel-alignment guides using excitation/emission wavelengths specific for Cy2 (488/520 nm), Cy3 (532/580 nm) and Cy5 (633/670 nm). The intensity was adjusted to ensure that the maximum volume (total pixel intensity) of each image was within the range 60 000–90 000 pixels.
The 2D-DIGE data were analysed using DeCyder™ 5.02 software (GE Healthcare Biosystems) according to the manufacturer’s recommendations. Briefly, the DeCyder™ biological variation analysis module was used to detect spots (the estimated number of spots was 1600) on the gels. All matches were confirmed manually. The paired t-test with false-discovery rate correction was used for statistical analysis of the data. Fifteen protein spots that were differentially expressed in Lb and La samples (ratio ≤−1.5 or ≥1.5; P ≤ 0.05) were selected.
In-gel digestion
Spot picking was carried out with preparative gels. Two-dimensional electrophoresis was performed as described above, except that IPG strips were loaded with 1000 µg of protein and gels were stained with Coomassie Brilliant Blue. Protein spots of interest were excised and destained with 25 mM ammonium bicarbonate and 50% acetonitrile. Gel slices were then dried completely by centrifugal lyophilization. In-gel digestion was performed with 0.01 µg/μl trypsin (Promega, Madison, WI, USA) in 25 mM ammonium bicarbonate for 15 h at 37℃. Supernatants were collected, and the tryptic peptides were extracted from the gel sequentially with 5% trifluoroacetic acid (TFA) at 40℃ for 1 h and with 2.5% TFA and 50% acetonitrile at 30℃ for 0.5 h. Extracts were pooled and dried completely by centrifugal lyophilization.
Protein identification by MS
Peptide mixtures were dissolved in 5 μl of 0.5% TFA, and 1.5 μl of peptide solution was mixed with 1.5 μl of matrix (4-hydroxy-α-cyanocinnamic acid in 50% acetonitrile and 0.1% TFA) before spotting on the target plate. Matrix-assisted laser desorption ionization–time of flight (MALDI–TOF) mass spectrometry (MS) and tandem TOF/TOF MS were carried out on a 4700 Proteomics Analyzer (Applied Biosystems, Foster City, CA, USA). Peptide mass maps were acquired in positive reflection mode, averaging 1500 laser shots per MALDI–TOF spectrum and 3000 shots per TOF/TOF spectrum (resolution, 20 000 pixels). The 4700 Proteomics Analyzer calibration mixtures (Applied Biosystems) were used to calibrate the spectrum to a mass tolerance within 0.1 Da. Parent mass peaks (mass range, 600–4000 Da; minimum signal-to-noise ratio, 1.5) were selected for tandem TOF/TOF analysis. Combined mass and mass/mass spectra were used to interrogate human sequences in the International Protein Index human database, version 3.6, 10 using MASCOT version 3.6 (Matrix Science, London, UK) database search algorithms. Searches were performed to allow for carbamidomethylation, oxidation and a maximum of one missed trypsin cleavage. Peptide tolerance and MS/MS tolerance were both 0.2 Da. All automatic data analyses and database searches were performed using GPS Explorer™ software, version 3.56 (Applied Biosystems). Proteins with a statistically significant (P ≤ 0.05) protein score were considered to be identified with confidence (based on combined mass and mass/mass spectra). Redundancy of proteins that appeared in the database under different names and accession numbers was eliminated.
Western blotting
Proteins were extracted from Lb and La samples, separated by SDS–PAGE and transferred to nitrocellulose membranes (Millipore, Billerica, MA, USA). Blots were incubated for 1 h at room temperature in Tris-buffered saline–Tween 20 (TBST) containing 5% skimmed milk. Primary antibodies used were polyclonal antibody against α1-antitrypsin (AAT) (1 : 130 dilution; , Santa Cruz, CA, USA Cruz Biotechnology), anticytokeratin 10 monoclonal antibody (KRT10) (1 : 200 dilution; Abcam, Cambridge, MA, USA), antifibrinogen α (anti-FGA) monoclonal antibody (1 : 200 dilution; Santa Cruz Biotechnology), anti-TF monoclonal antibody (1 : 200 dilution; Santa Cruz Biotechnology) and antiamyloid P component, serum (APCS) monoclonal antibody (1 : 200 dilution; Abcam). Blots were labelled with peroxidase-conjugated secondary antibody to rabbit or mouse immunoglobulin G (IgG; KPL, Gaithersburg, MD, USA) and visualized using electrochemiluminescence (ECL) reagents (Millipore).
Four patients were chosen randomly from the pool of patients with long PFS periods using Random extractor software version 4.9.1 (available from http://download.pchome.net/industry/education/detail-14953.html) for further validation. Twenty microlitres of the serum sample obtained from each patient before EGFR-TKI therapy commenced and 20 μl of the serum sample obtained at the CR or PR timepoints 9 were extracted, separated by SDS–PAGE and transferred to nitrocellulose membranes (Millipore). These blots were blocked for 1 h at room temperature in (TBST 20 containing 5% skimmed milk. The primary antibodies used were anti-AAT polyclonal antibody (1 : 130 dilution, Abcam), anti-KRT10 monoclonal antibody (1 : 200 dilution, Abcam), and anti-APCS monoclonal antibody (1:200 dilution; Abcam). The blots were labelled with peroxidase-conjugated secondary antibody to rabbit or mouse IgG (KPL) and visualized with ECL reagents (Millipore).
Results
Patients
Clinical characteristics of 36 patients with nonsmall cell lung cancer who received epidermal growth factor receptor tyrosine kinase inhibitor (EGFR-TKI) treatment, and who had long (>6 months) or short (≤6-months) progression-free survival (PFS) periods.

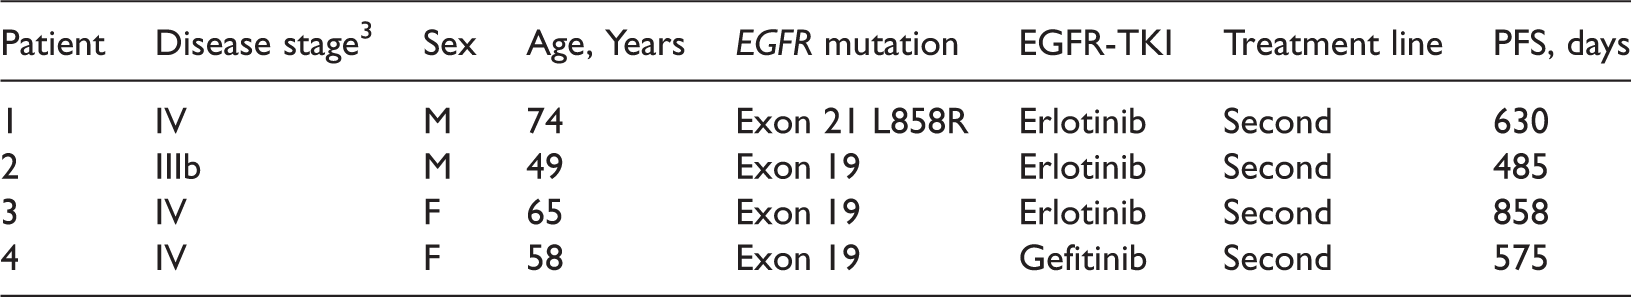
Clinical information on a random sample of four nonsmall cell lung cancer patients with long progression-free survival (PFS) periods (>6 months), receiving epidermal growth factor receptor tyrosine kinase inhibitor (EGFR-TKI) therapy.
Protein sample preparation
Protein concentrations determined by the Bradford method were: Lb1, 26.71; Lb2, 20.24; Lb3, 36.13; La1, 6.83; La2, 9.33; La3, 20.70.
Differentially expressed proteins in long PFS patients
The 2D-DIGE procedures revealed that, among 1600 matched protein spots, 15 were expressed differentially (Lb/La ratio ≥1.5, P ≤ 0.05, or Lb/La ratio ≤−1.5, P ≤ 0.05; paired t-test with FDR correction).
Identification of differentially expressed proteins
Fifteen differentially expressed protein spots (Figure 1) showing sufficient intensity, clear separation from surrounding spots and consistent spot shape and size were excised and in-gel digested with trypsin, then analysed by MALDI-TOF/TOF. The following five proteins were identified among the 15 protein spots: AAT; KRT10; APCS; FGA; TF. Details of these proteins are listed in Table 3.
Representative two-dimensional gel image of the Cy2-labelled proteins that comprised the internal standard. The 15 identified protein spots are marked with master numbers. IP, isoelectric point. Details of proteins expressed differently between baseline (Lb) and after treatment (La) with epidermal growth factor receptor tyrosine kinase inhibitor (EGFR-TKI) therapy, in patients with advanced nonsmall-cell lung cancer. Ratio of expression in progressive disease/baseline. IP, isoelectric point; IPI, International Protein Index. Statistical analysis performed using the paired t-test.

Validating AAT analysis as a potential prognostic biomarker for advanced NSCLC treated with EGFR-TKI
The 2D-DIGE analysis showed that, among the five proteins identified, AAT and TF were upregulated in PD compared with baseline by average ratios of 1.68 (P = 0.0017) and 1.71 (P = 0.0024), respectively. KRT10, APCS and FGA were downregulated in PD compared with baseline, with average ratios of −1.54 (P = 0.0079), −1.73 (P = 0.0014) and −1.82 (P = 0.041) respectively; all ratios were significant.
Western blotting confirmed the 2D-DIGE analysis: expression of AAT was significantly higher in PD compared with baseline (P = 0.0017) (Figure 2A) and expression levels of KRT10 (P = 0.0079) (Figure 2B) and APCS (P = 0.0014) (Figure 2C) were significantly lower in PD compared with baseline.
Western blotting. (A) α1-antitrypsin (AAT) expression was significantly higher in progressive nonsmall-cell lung cancer (NSCLC) (La), compared with baseline (i.e., before treatment with epidermal growth factor receptor-tyrosine kinase inhibitor therapy; Lb). (B) Keratin type I cytoskeletal 10 (KRT10) expression was significantly lower in progressive NSCLC (La) compared with baseline (Lb). (C) Serum amyloid P component (APCS) expression was significantly lower in progressive NSCLC (La) compared with baseline (Lb).
Further validation of these results was provided by the finding that expression of AAT in Western blot analysis was significantly lower in PR compared with baseline, in the four randomly selected patients from the long PFS period group (Figure 3). In three of these four patients, KRT10 expression was higher in PR compared with baseline; in the remaining patient only, APCS expression was higher in PR compared with baseline.
α1-antitrypsin (AAT) expression in Western blotting was significantly lower in partial response (PR) compared with baseline (i.e., before treatment; Lb), in four randomly selected patients with nonsmall-cell lung cancer who survived for >6 months following introduction of epidermal growth factor receptor-tyrosine kinase inhibitor therapy. Pt, patient number.
Discussion
In the present study, the classic proteomics research route was followed: 2D-DIGE and MS were combined to assess the relative expression of proteins in patients with NSCLC. Serum expression levels of proteins were screened and identified at key timepoints (baseline, CR, PR and PD) in patients with advanced NSCLC treated with EGFR-TKIs. AAT was upregulated in PD compared with baseline, with an average ratio of 1.68 (P = 0.0017), and Western blot analysis showed that AAT was downregulated in PR. We suggest that AAT could be used as a serological biomarker to guide the use of EGFR-TKI in the treatment of advanced NSCLC.
Multiple modalities for the diagnosis and treatment of NSCLC have been studied at the gene level. 11 Two TKIs – gefitinib (Iressa®) and erlotinib (Tarceva®) – which block the EGFR signalling pathway, are approved in many countries for the treatment of NSCLC. Assessing tissue samples for EGFR mutations is standard practice for predicting the utility of EGFR-TKIs for NSCLC. EGFR mutations are an important means of selecting EGFR-TKI therapies and for predicting effectiveness or resistance to such treatments. 12 Protein expression is much more complex and variable than gene sequencing. In the last two decades, proteomic technology has been introduced in the study of lung cancer and several clinical trials have used such technology to find markers to aid early diagnosis.13–20 Tan et al. 20 used proteomic analysis to identify isocitrate dehydrogenase 1 as a potential diagnostic and prognostic biomarker for NSCLC. Proteomics has also been used to study lung cancer target therapy. Okano et al. 21 analysed tissue samples by 2D-DIGE and identified nine proteins as potential predictors of response to gefitinib in patients with NSCLC. Taguchi et al. 22 reported a multicentre clinical trial using 2D-DIGE and MALDI-TOF MS, and found eight proteins that were related to responsiveness to EGFR-TKIs. Marko-Varga et al. 23 implemented a similar research programme using proteomics technology, and screened proteins for the prediction of pulmonary interstitial fibrosis related to EGFR-TKIs.
The protein AAT, which is a member of the serine proteinase inhibitor (serpin) superfamily, is the most abundant circulating protease inhibitor. It is produced by the liver and secreted into the circulatory system, where it acts to prevent excessive proteolytic damage in the lungs by the enzyme neutrophil elastase. AAT deficiency was first described in 1963 by Laurell and Eriksson. 24 Subsequently, AAT deficiency has been associated with the development of bronchiectasis, 25 asthma, 26 vasculitis 27 and panniculitis. 28 In 1969, an association between AAT and liver disease was reported by Sharp et al. 29 and more recently there has been interest in the relationship between AAT and primary liver carcinoma. 30 Additional studies have shown that AAT can be used as an auxiliary diagnostic and prognostic serum marker in liver disease.31–33
Research on AAT in lung cancer has shown varied results. Zelvyte et al. 34 reported a positive correlation between the serum concentration of AAT and the risk of lung cancer. However, genetic deficiency in AAT has been reported to be associated with an increased risk of lung cancer development. 35 An immunohistochemical analysis showed that, among patients with adenocarcinoma, strongly AAT-positive cases had a worse prognosis than weak to moderately AAT-positive or AAT-negative cases. 36 The relevance of AAT to the evaluation of lung cancer therapies has rarely been reported. The present analysis showed that upregulation of AAT may be seen as warning of PD, and that downregulation of AAT may indicate that the cancer is at least under control. We speculate that AAT may play a role in promoting the growth of lung cancer, or that it is a product of the progression of lung cancer.
In this study, we have confirmed that AAT may be a potential prognostic serum marker for advanced NSCLC treated with EGFR-TKIs. Further studies are needed to clarify the mechanism and role of AAT expression in lung adenocarcinoma.
Footnotes
Declaration of conflicting interest
The authors declare that there are no conflicts of interest.
Funding
This research received no specific grant from any funding agency in the public, commercial, or not-for-profit sectors.
Acknowledgements
The authors would like to express their gratitude to Sandlin Seguin for reviewing the English language of this article.