
Abstract
Background
Low-dose thoracic protocols were developed massively during the COVID-19 outbreak.
Purpose
To study the impact on image quality (IQ) and the diagnosis reliability of COVID-19 low-dose chest computed tomography (CT) protocols.
Material and Methods
COVID-19 low-dose protocols were implemented on third- and second-generation CT scanners considering two body mass index (BMI) subgroups (<25 kg/m2 and >25 kg/m2). Contrast-to-noise ratios (CNR) were compared with a Catphan phantom. Next, two radiologists retrospectively assessed IQ for 243 CT patients using a 5-point Linkert scale for general IQ and diagnostic criteria. Kappa score and Wilcoxon rank sum tests were used to compare IQ score and CTDIvol between radiologists, protocols, and scanner models.
Results
In vitro analysis of Catphan inserts showed in majority significantly decreased CNR for the low dose versus standard acquisition protocols on both CT scanners. However, in vivo, there was no impact on the diagnosis: sensitivity and specificity were ≥0.8 for all protocols and CT scanners. The third-generation scanner involved a significantly lower dose compared to the second-generation scanner (CTDIvol of 1.8 vs. 2.6 mGy for BMI <25 kg/m2 and 3.3 vs. 4.6 mGy for BMI >25 kg/m2). Still, the third-generation scanner showed a significantly higher IQ with the low-dose protocol compared to the second-generation scanner (30.9 vs. 28.1 for BMI <25 kg/m2 and 29.9 vs. 27.8 for BMI >25 kg/m2). Finally, the two radiologists had good global inter-reader agreement (kappa ≥0.6) for general IQ.
Conclusion
Low-dose protocols provided sufficient IQ independently of BMI subgroups and CT models without any impact on diagnosis reliability.
Introduction
Computed tomography (CT) imaging plays a major role in the diagnosis of pulmonary disease. During the COVID-19 outbreak, chest CT imaging has played a major role in the diagnostic strategy. In fact, CT scans allow the diagnosis of patients with COVID-19 with chest involvement but can also show the evolution of the disease in patients with COVID-19 and give insights on the prognosis (1–6). During the early stage of the pandemic, Fang et al. found a sensitivity of 98% with a chest CT diagnosis of COVID-19 while the actual gold standard reverse transcription polymerase chain reaction (RT-PCR) has been reported to have a sensitivity of 71% (7). Patients with COVID-19 may require repeat CT scans that highlight the need to reduce radiation exposure as low as reasonably achievable (4–5,7–14). Dangis et al. have shown that low-dose chest CT can allow a fast, accurate, and reproducible diagnosis of patients with COVID-19 when comparing CT results to swab samples results from RT-PCR with a sensitivity of 86.7% and specificity of 93.6% (5).
In this context, the literature has not discussed, to the best of our knowledge, the effect of body mass index (BMI) nor compared different brands of CT scanners in terms of image quality for low-dose protocols used in the diagnosis of COVID-19. In the present study, we used a retrospective design, matching patients receiving low-dose protocols to those undergoing CT with standard-dose protocols according to age, sex, and BMI on two different scanners from two different brands.
The primary aim of the present study was to compare the image quality between low-dose protocols and standard protocols developed on both Siemens and GE CT scanners for lung evaluation of patients with COVID-19 while taking into account patients’ BMI. The secondary aim was to compare the image quality and dose between the two scanner models.
Material and Methods
Institutional review board approval was obtained from CER Polethis (CER-Paris-Saclay-2021–022-A). The authors declare that the present study does not contain any personal information that could lead to the identification of the patients.
Standard versus low-dose CT protocols
Two scanner models were used interchangeably for the diagnosis of patients with COVID-19. These included a third-generation Somatom Force Dual source CT scanner (Siemens Healthineers [CT scan A], Siemens Healthineers, Erlangen, Germany) with dual tube/detectors systems and additional tin (Sn) filtration as well as a second-generation GE Revolution HD scanner (GE Healthcare [CT scan B] GE Healthcare, Milwaukee, WI, USA). Standard thoracic CT scan acquisitions performed on CT scan A involved the selection of optimal kV from the scout view (Care kV set to Sn100 and Sn140) and mAs modulation set to 350 mAs reference. Meanwhile, the standard acquisition protocol on CT scan B involved a set 120 kV and modulated mA (150–480) to account for different BMIs of patients.
In line with Kalra et al., target volumetric computed tomography dose index (CTDIvol) for low-dose protocols for patients with a BMI <25 kg/m2 was set to 1.8 mGy for CT scan A and 2.6 mGy for CT scan B (8). Meanwhile, for patients with a BMI >25 kg/m2, the target CTDIvol values for the low-dose protocols were set following Liu et al., as the population of pregnant women was close to this BMI with 3.3 mGy for CT scan A and 4.6 mGy for CT scan B (15). To implement such low-dose protocols meeting the target CTDIvol values, a 25% decrease of the average mAs used in the standard acquisition protocol/patient population was operated on CT scan A for both BMI classes; these were namely set to 132 mAs for patients with a BMI <25 kg/m2 and 240 mAs for those with a BMI >25 kg/m2. Meanwhile, a decrease in mAs of 40%–50% was necessary on CT scan B (namely 50 mAs for BMI <25 kg/m2 and 120 mAs for BMI >25 kg/m2) owing to initially higher CTDIvol values for the standard acquisition protocol compared to CT scan A. in addition, the low-dose protocol on CT scan A did not involve kV modulation; instead, the latter was set to Sn140. All acquisitions and reconstruction parameters are summarized in Table 1.
Acquisition and reconstruction parameters for the standard and low-dose protocols per scanner model and patient BMI.
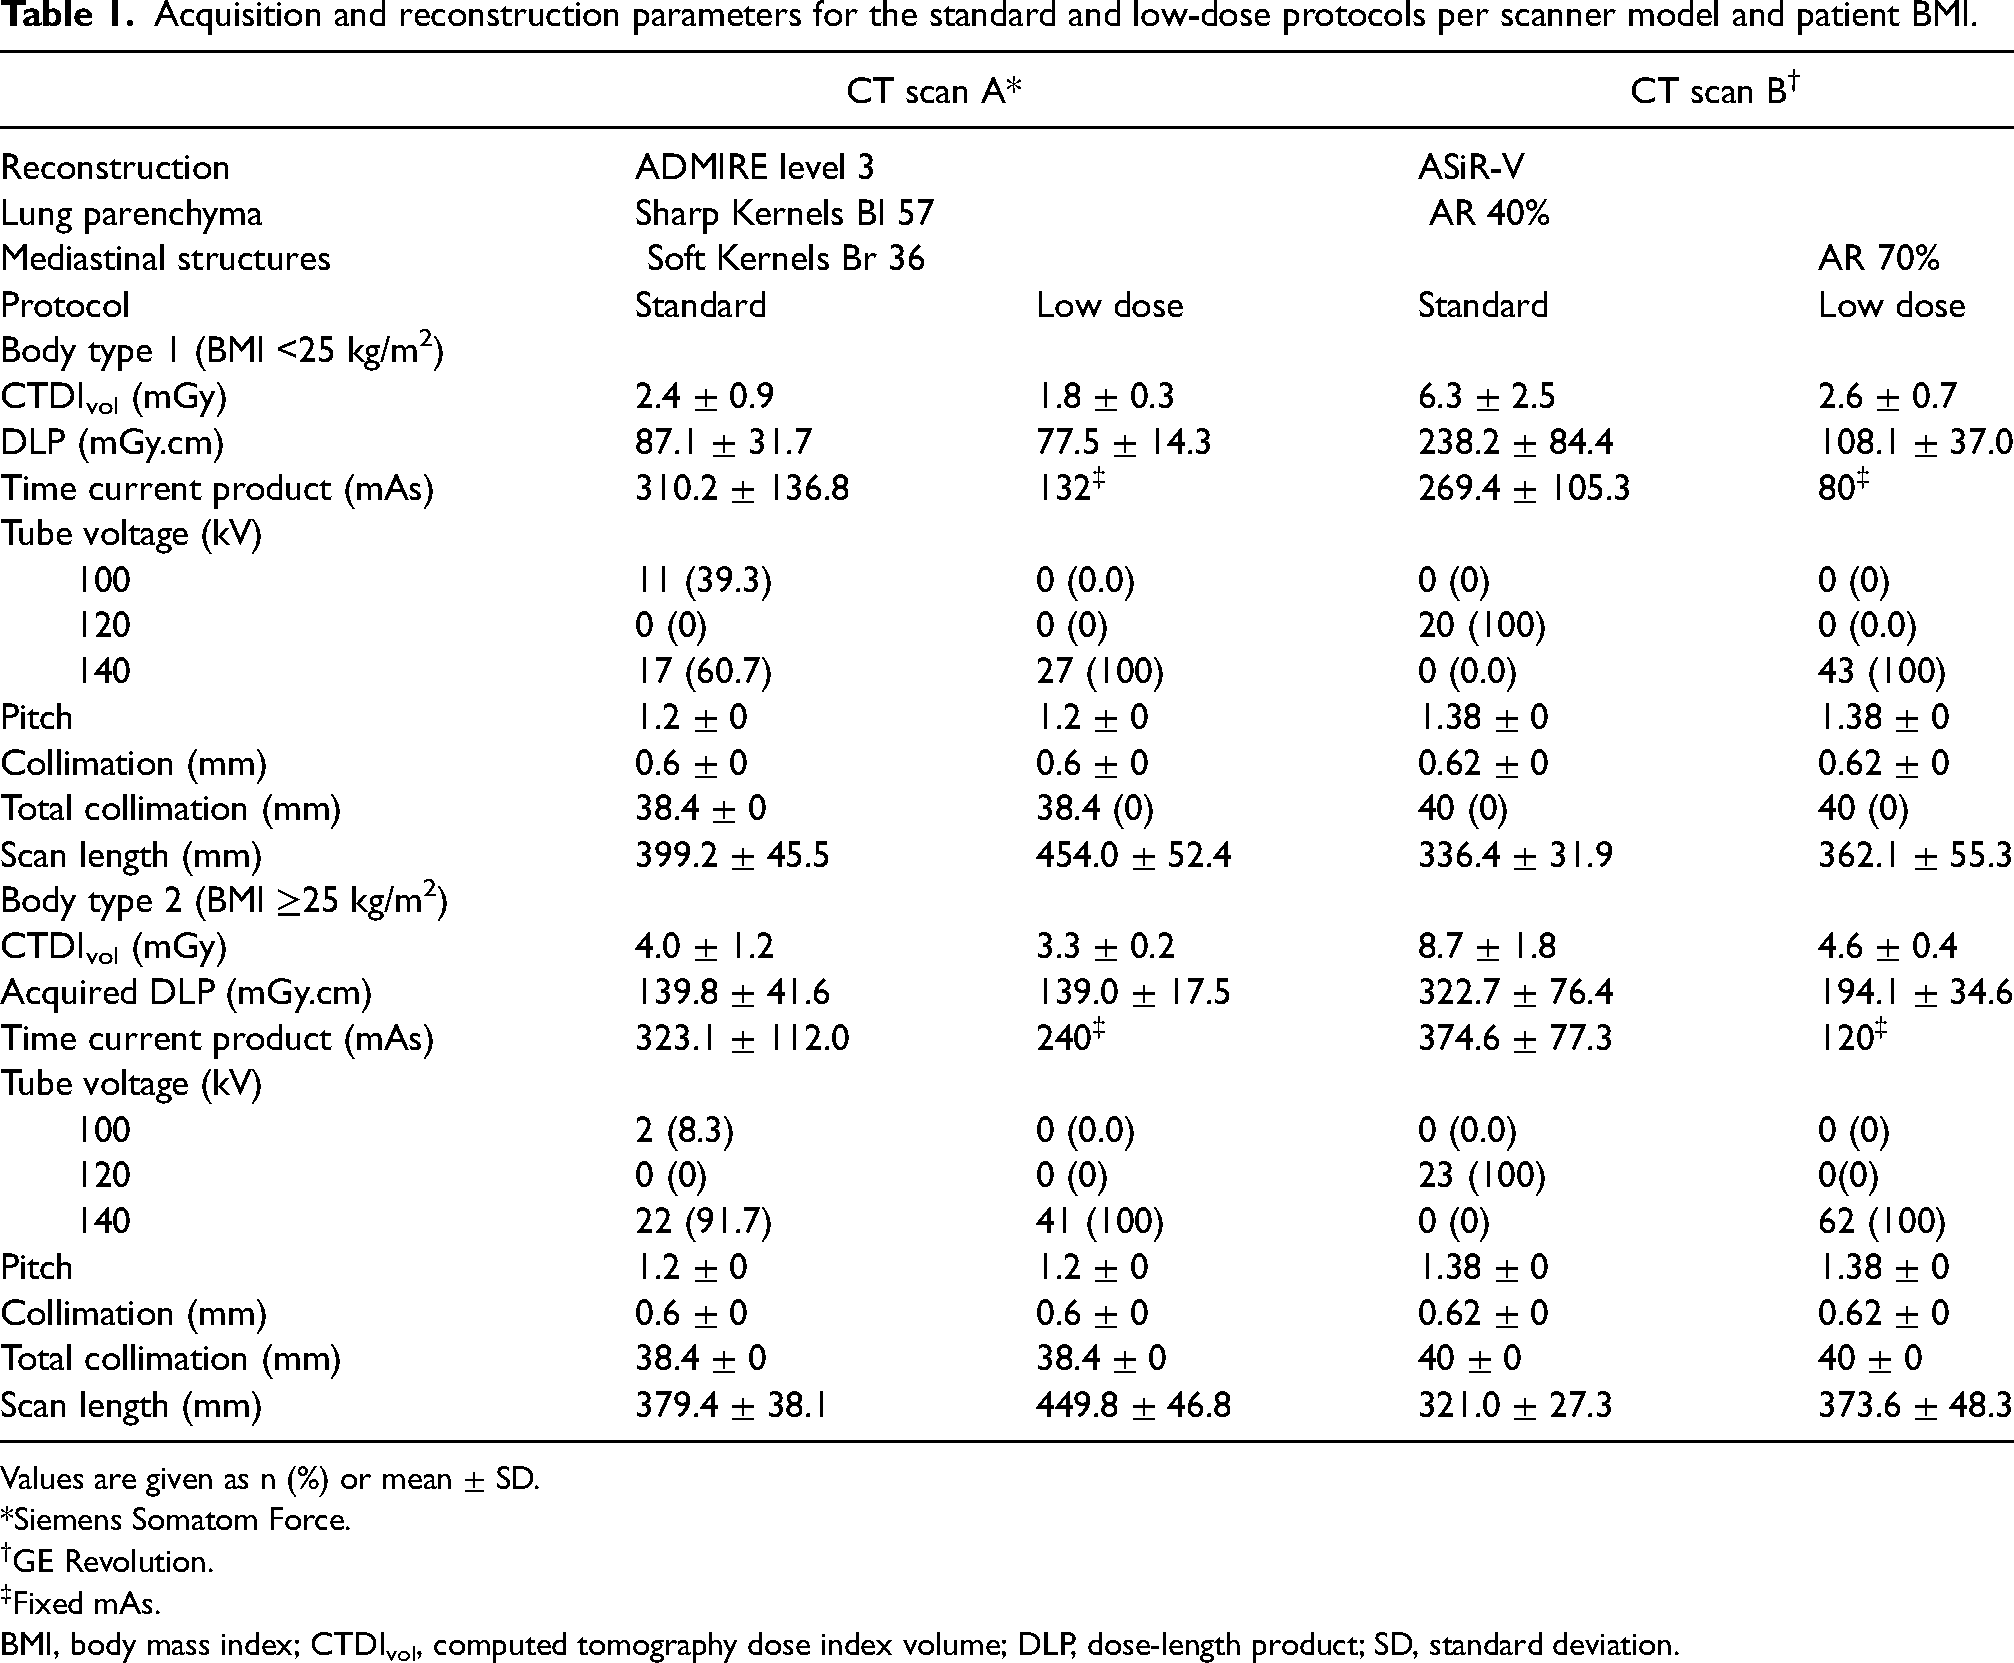
Values are given as n (%) or mean ± SD.
*Siemens Somatom Force.
GE Revolution.
Fixed mAs.
BMI, body mass index; CTDIvol, computed tomography dose index volume; DLP, dose-length product; SD, standard deviation.
Phantom image quality analysis
A Catphan 500 phantom (The Phantom Laboratory) was used to assess the image quality for the different protocols. For each protocol and scanner, all slices of the Catphan phantom were acquired in a single helical acquisition. The phantom was positioned as recommended by the user manual and the explored length was 23 cm. The studied sections of the Catphan phantom were as follows: CTP 401 with inserts of different densities; CTP 486 with a uniform section; and CTP 528 for assessing the transverse spatial resolution (Fig. 1).
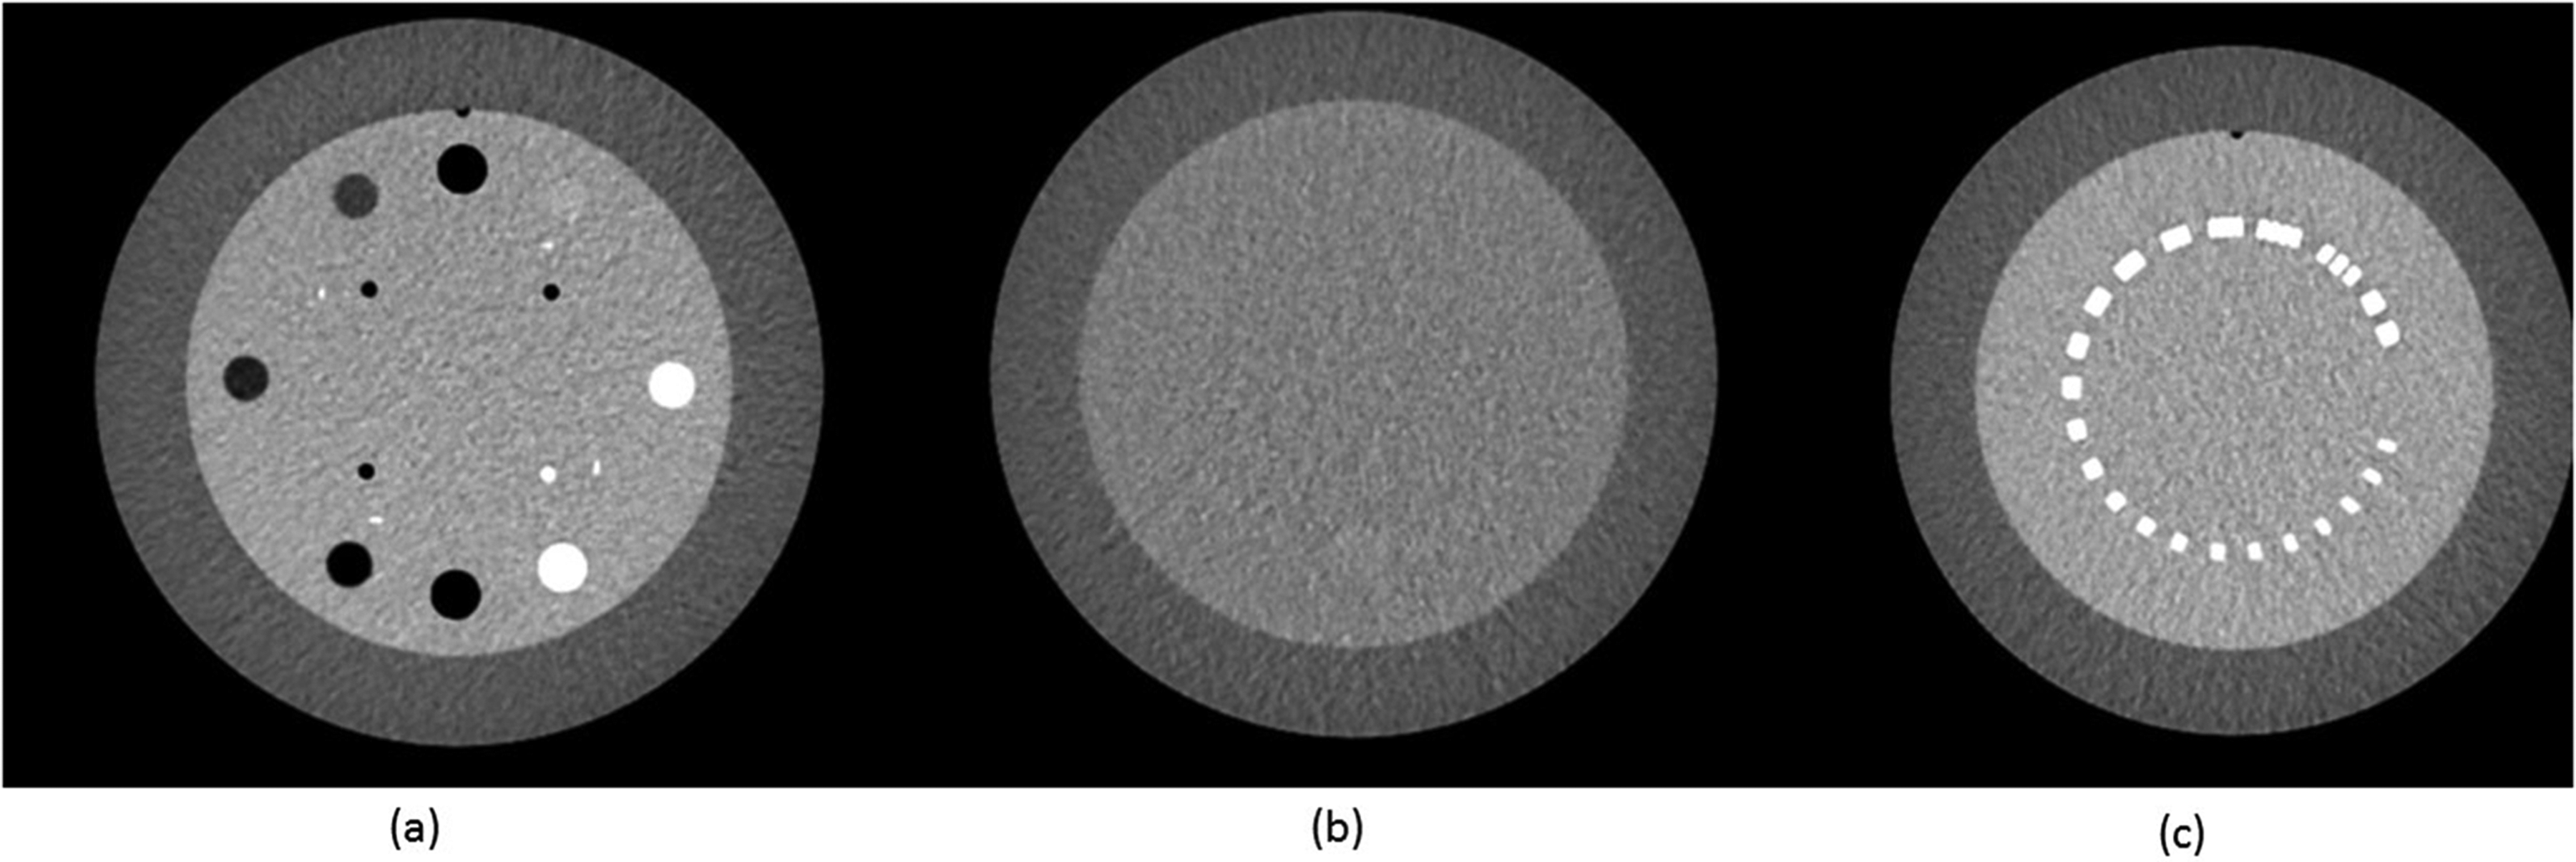
Slice view of the different studied sections of the Catphan phantom (a) CTP 401 (b) CTP 486 and (c) CTP 528.
Mean and standard deviations of Hounsfield Units (HU) in the regions of interest (ROI), HUROI, and бROI, respectively, were calculated with ImageJ in both CTP 401 and CTP486 (16) (Appendix A). In the CTP 401 section, ROIs were placed in the center of four inserts (Air, LDPE, Acrylic, and Teflon) over five consecutive slices. In addition, five ROIs of 1 cm2 were positioned in the background region (center as well as periphery). The contrast-to-noise ratio (CNR) was computed according to the following equation (17):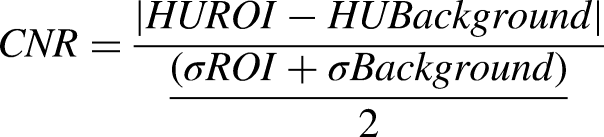
Patient recruitment
This single-institution retrospective study involved the recruitment of 243 adult patients (aged >18 years) undergoing a CT examination between 23 March and 4 May 2020. Consecutive patients suspected of having COVID-19 were included and matched with patients suspected of having other diagnoses according to age, sex, and BMI.
All CT images were anonymized. Codification took place for the following information: scanner type (A/B); BMI; and protocol type. Patients were considered COVID-19 positive based on either a positive RT-PCR test or the conclusion of the clinical report.
CT scans and image analysis
All patients were scanned in a supine position without contrast enhancement. The acquisition was performed with an inspiratory breath-hold. After the scout view, a helical CT scan from the lung apex to the lung base was performed for the standard protocol.
Using a PACS workstation (CARESTREAM), 243 series of chest CT scans were hence scored independently by two radiologists: radiologists X and Y with two and six years of experience, respectively. The lung parenchyma and airways were evaluated on the reconstructed series “Lung” while the mediastinal structures were evaluated on the reconstructed series “Mediastinum.”
The general quality score with a total of 35 points was based on Agostini et al. (10). A 5-point Likert scale was used with the following criteria: visibility of major anatomical structures; visibility of small anatomical structures; sharpness; perceived image noise; presence of motion artifacts; subjective diagnostic reliability; and overall diagnostic image quality. In addition, diagnostic criteria with a total of 30 points were assessed with a 5-point Likert scale: ground-glass opacities; crazy paving; centrolobular nodules; consolidations; lymph nodes; and pleural effusion (1 = finding not detected; 2 = barely detected, unreliable interpretation; 3 = visible finding with marked blurring and uncertain interpretation; 4 = visible finding, blurred, with no influence on diagnosis; 5 = finding clearly visible with good demarcation). The mean score of the two radiologists was taken into account.
Finally, one binary question was added (“Is the diagnosis related to COVID-19?”) to allow the assessment of the sensitivity and specificity of the CT scan diagnosis when compared to COVID+ recorded status. Radiologists were blinded to RT-PCR results and clinical reports.
Statistical analysis
The quantitative variables were expressed as means ± standard deviations, and the qualitative variables as percentages. Quantitative variables were compared using a non-parametric Wilcoxon test. When comparing scores between low-dose and standard protocols, a Wilcoxon test for paired samples was used for the matched patients.
Cohen's Kappa coefficients and their 95% confidence intervals (CIs) were calculated to evaluate the inter-rater reliability between the two readers on their interpretation of both the general image quality score and the diagnostic score for the two protocols, the low-dose protocol only, and for each CT scanner. Weighted Kappa coefficients were calculated as the scores were considered as ordered categorical variables and to avoid any agreement bias linked to the difference of seniority of the two raters.
COVID-19 diagnostic performances were assessed based on the diagnostic criteria highly suggestive of COVID-19 (crazy paving) and on the direct interpretation of the reader. For the direct diagnosis of COVID-19 by the reader, sensitivity, specificity, positive predictive value (PPV), negative predictive value (NPV), positive likelihood ratio (PLR), and negative likelihood ratio (NLR) with their 95% CIs were calculated. For the two diagnostic criteria, receiver operating characteristic (ROC) curves were obtained for each criterion and each CT scanner. The area under the ROC curve (AUC) and their 95% CIs were calculated for each ROC curve. The AUCs of the ROC curves were compared using a Delong's test when needed.
For the statistical tests, a P value < 0.05 was considered to be statistically significant.
The statistical analyses were performed using RStudio v1.2.5001 (RStudio, PBC, Boston, MA, USA) (18).
Patient matching between low-dose and standard acquisition protocol
To compare image quality for the standard and low-dose thorax CT protocols per scanner model, patients were matched based on age, sex, and BMI since such parameters are likely to mostly affect both the image quality and dose. Indeed, older patients tend to have more motion artifacts than younger patients who are capable of standing still and holding their breath throughout the duration of the CT acquisitions . BMI has also a known impact on image quality and dose (19).
A propensity score (20,21), calculated with a logistic regression based on age, sex, and BMI, was used to perform the patient matching and create different groups for the comparison between the two protocols. Patients with a close value of propensity score were matched together. Different matching ratios were used based on the number of patients undergoing the low-dose protocol in the different groups. Each patient who underwent a standard protocol was matched with one, two, or three patients who had a low-dose protocol whenever possible, and this took into account the higher number of low-dose CT scans and to ensure that the maximum number of patients was included in the benchmarking.
Four groups were created with the matching procedure based on a patient's BMI (BMI <25 kg/m2 and BMI ≥25 kg/m2) and the two CT scans (Appendix B).
Results
Catphan image quality comparison
When comparing both CT scans, CT scan B showed significant superiority in CNR for the following inserts: PMP (29.1/23.2), Delrin (24.7/21.6), LDPE (19.3/17.2), and Polystyrene (14.6/11.4) in the standard protocol for BMI <25 kg/m2 (Table 2). This is also the case for the low-dose protocol for BMI <25 kg/m2 with PMP (21.1/14.6), Delrin (19.6/14), LDPE (13.8/11), and Polystyrene (10.5/7.7). For BMI >25 kg/m2, the standard protocol showed significantly higher values of CNR for all inserts in CT scan B but for only two inserts in the low-dose protocol: LDPE (17.6/14.3) and Polystyrene (11.1/9.8).
CNR comparison between CT scanners A and B for all acquisitions.
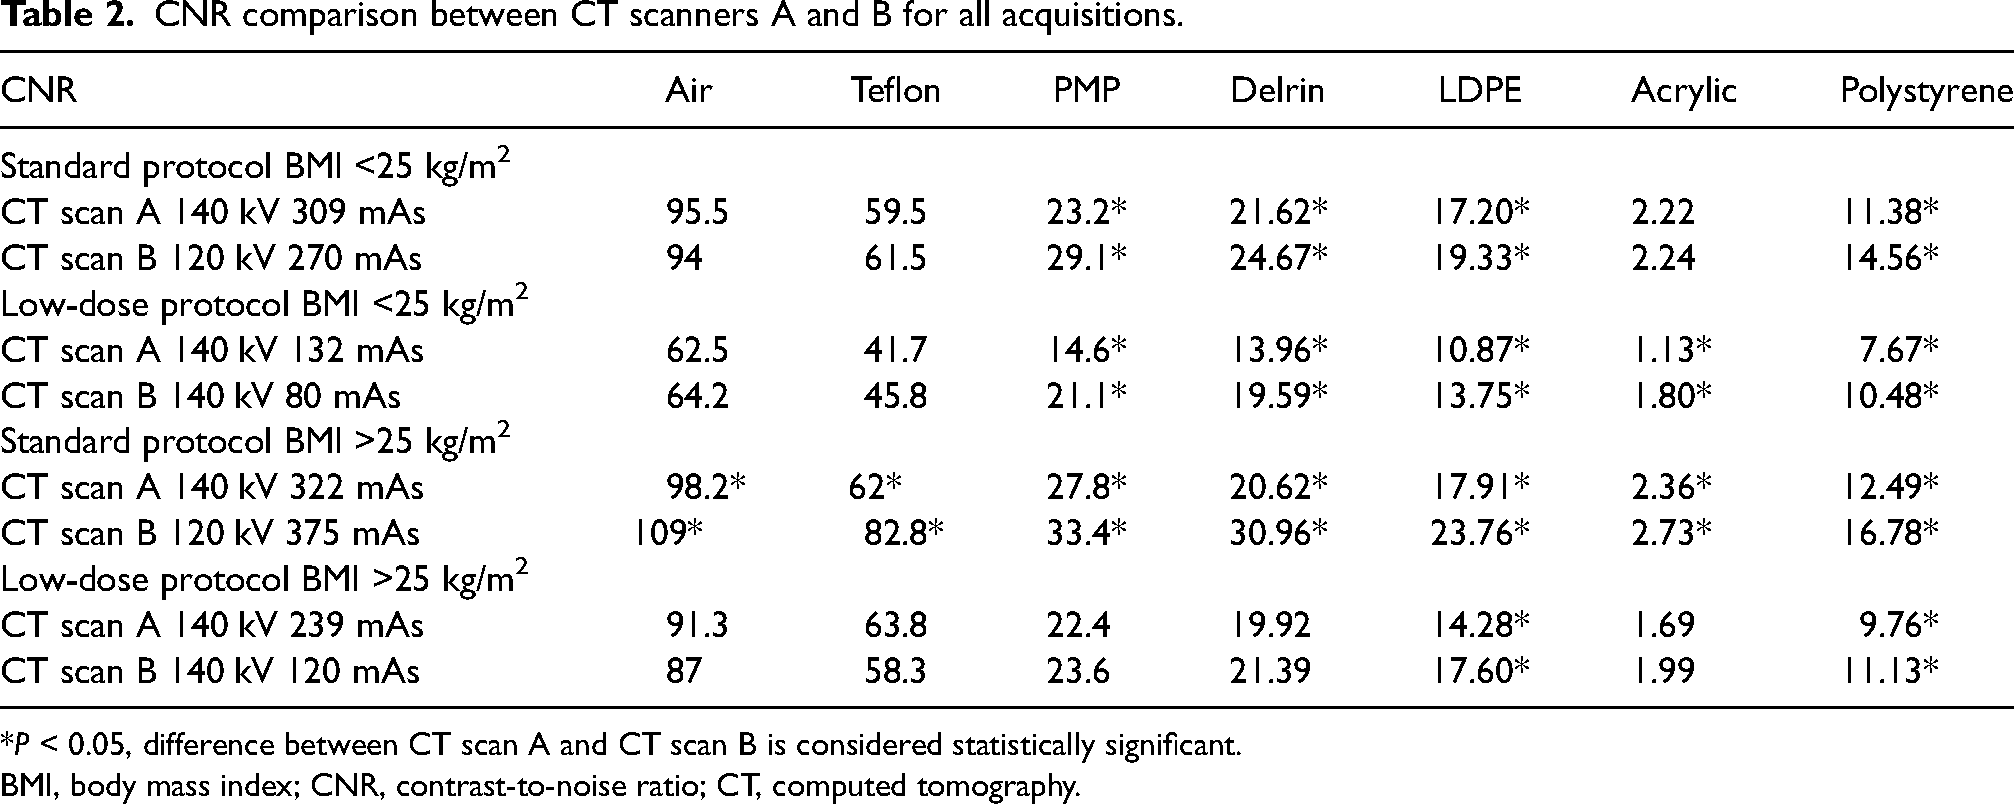
*P < 0.05, difference between CT scan A and CT scan B is considered statistically significant.
BMI, body mass index; CNR, contrast-to-noise ratio; CT, computed tomography.
A significant CNR decrease was observed in all inserts when comparing the low-dose protocol to the standard protocol for patients with a BMI <25 kg/m2 on both CT scanners (CNR = 62.5 for CT scan A in air for low-dose protocol compared to 95.5 in standard protocol) (Table 3). This was also observed for all inserts for patients with a BMI >25 kg/m2 on CT scanner B and most inserts on CT scanner A (PMP, LDPE, Acrylic, and Polysterene)
CNR comparison between standard and low-dose protocols for both CT scanners A and B.
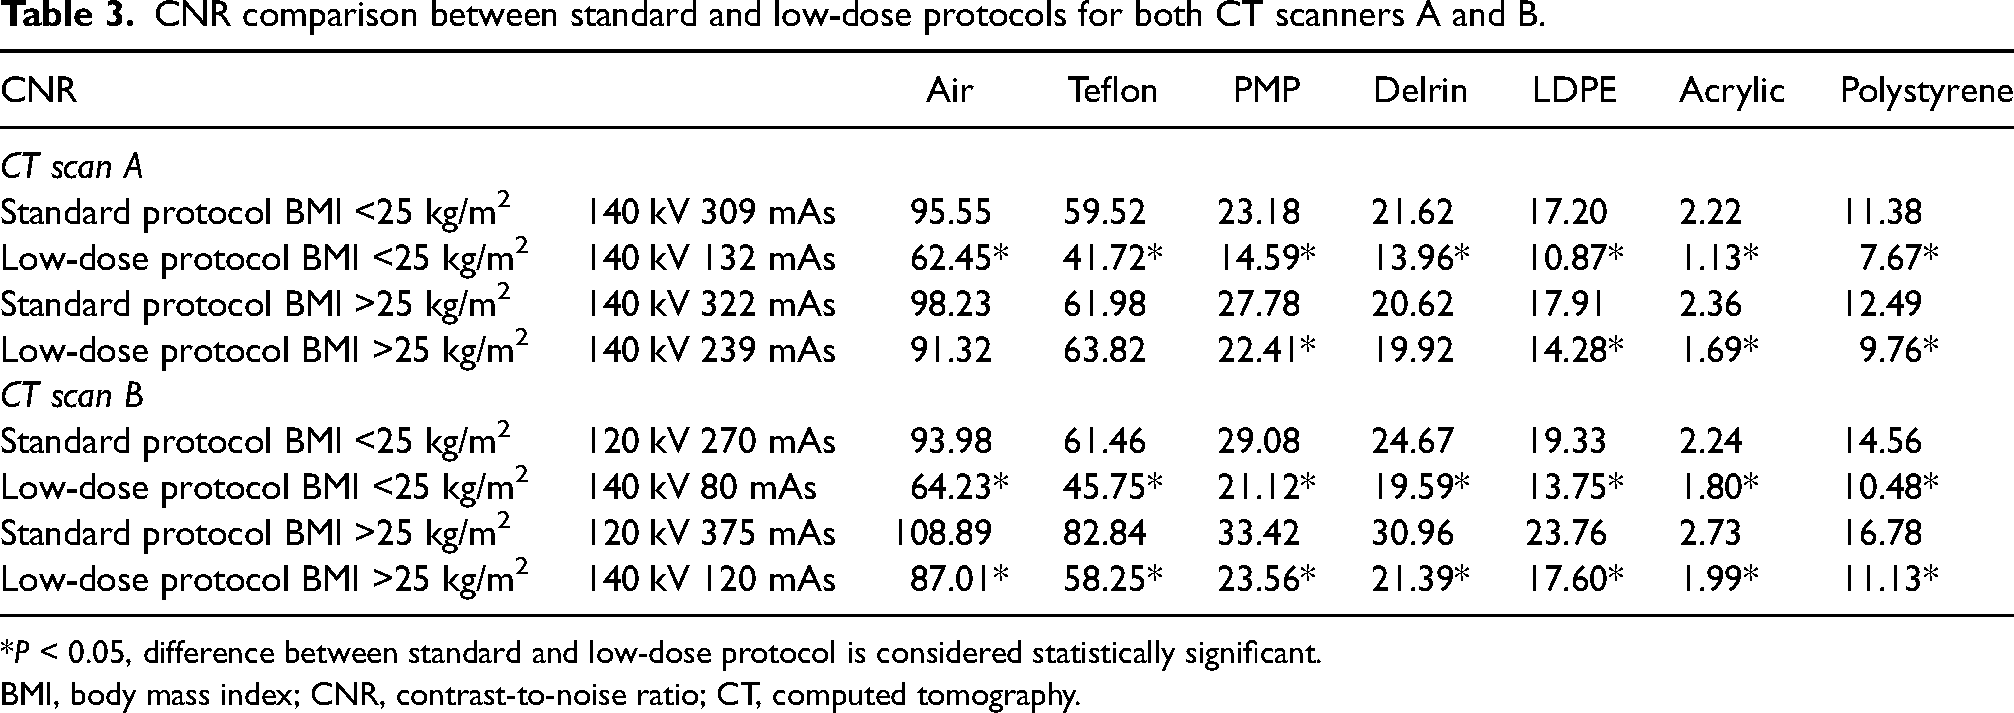
*P < 0.05, difference between standard and low-dose protocol is considered statistically significant.
BMI, body mass index; CNR, contrast-to-noise ratio; CT, computed tomography.
Patient demographics
A total of 243 patients (60% men, 40% women) were included (Table 4) There was an equal number of patients aged >65 years and <65 years. Of the patients, 48% had a BMI <25 kg/m2. Among the 243 patients, 167 had an existent RT-PCR test with 52% showing positive contamination for COVID-19. A control population with standard thorax acquisitions accounted for 40% of the patients while the test population with low-dose thorax CT scans accounted for 60%. In total, 121 patients were recruited to CT scan A and 122 patients to CT scan B. A total of 148 patients suspected of having COVID-19 during this period underwent a low-dose protocol on CT scan A/B while 95 patients underwent a standard protocol (Fig. 2).
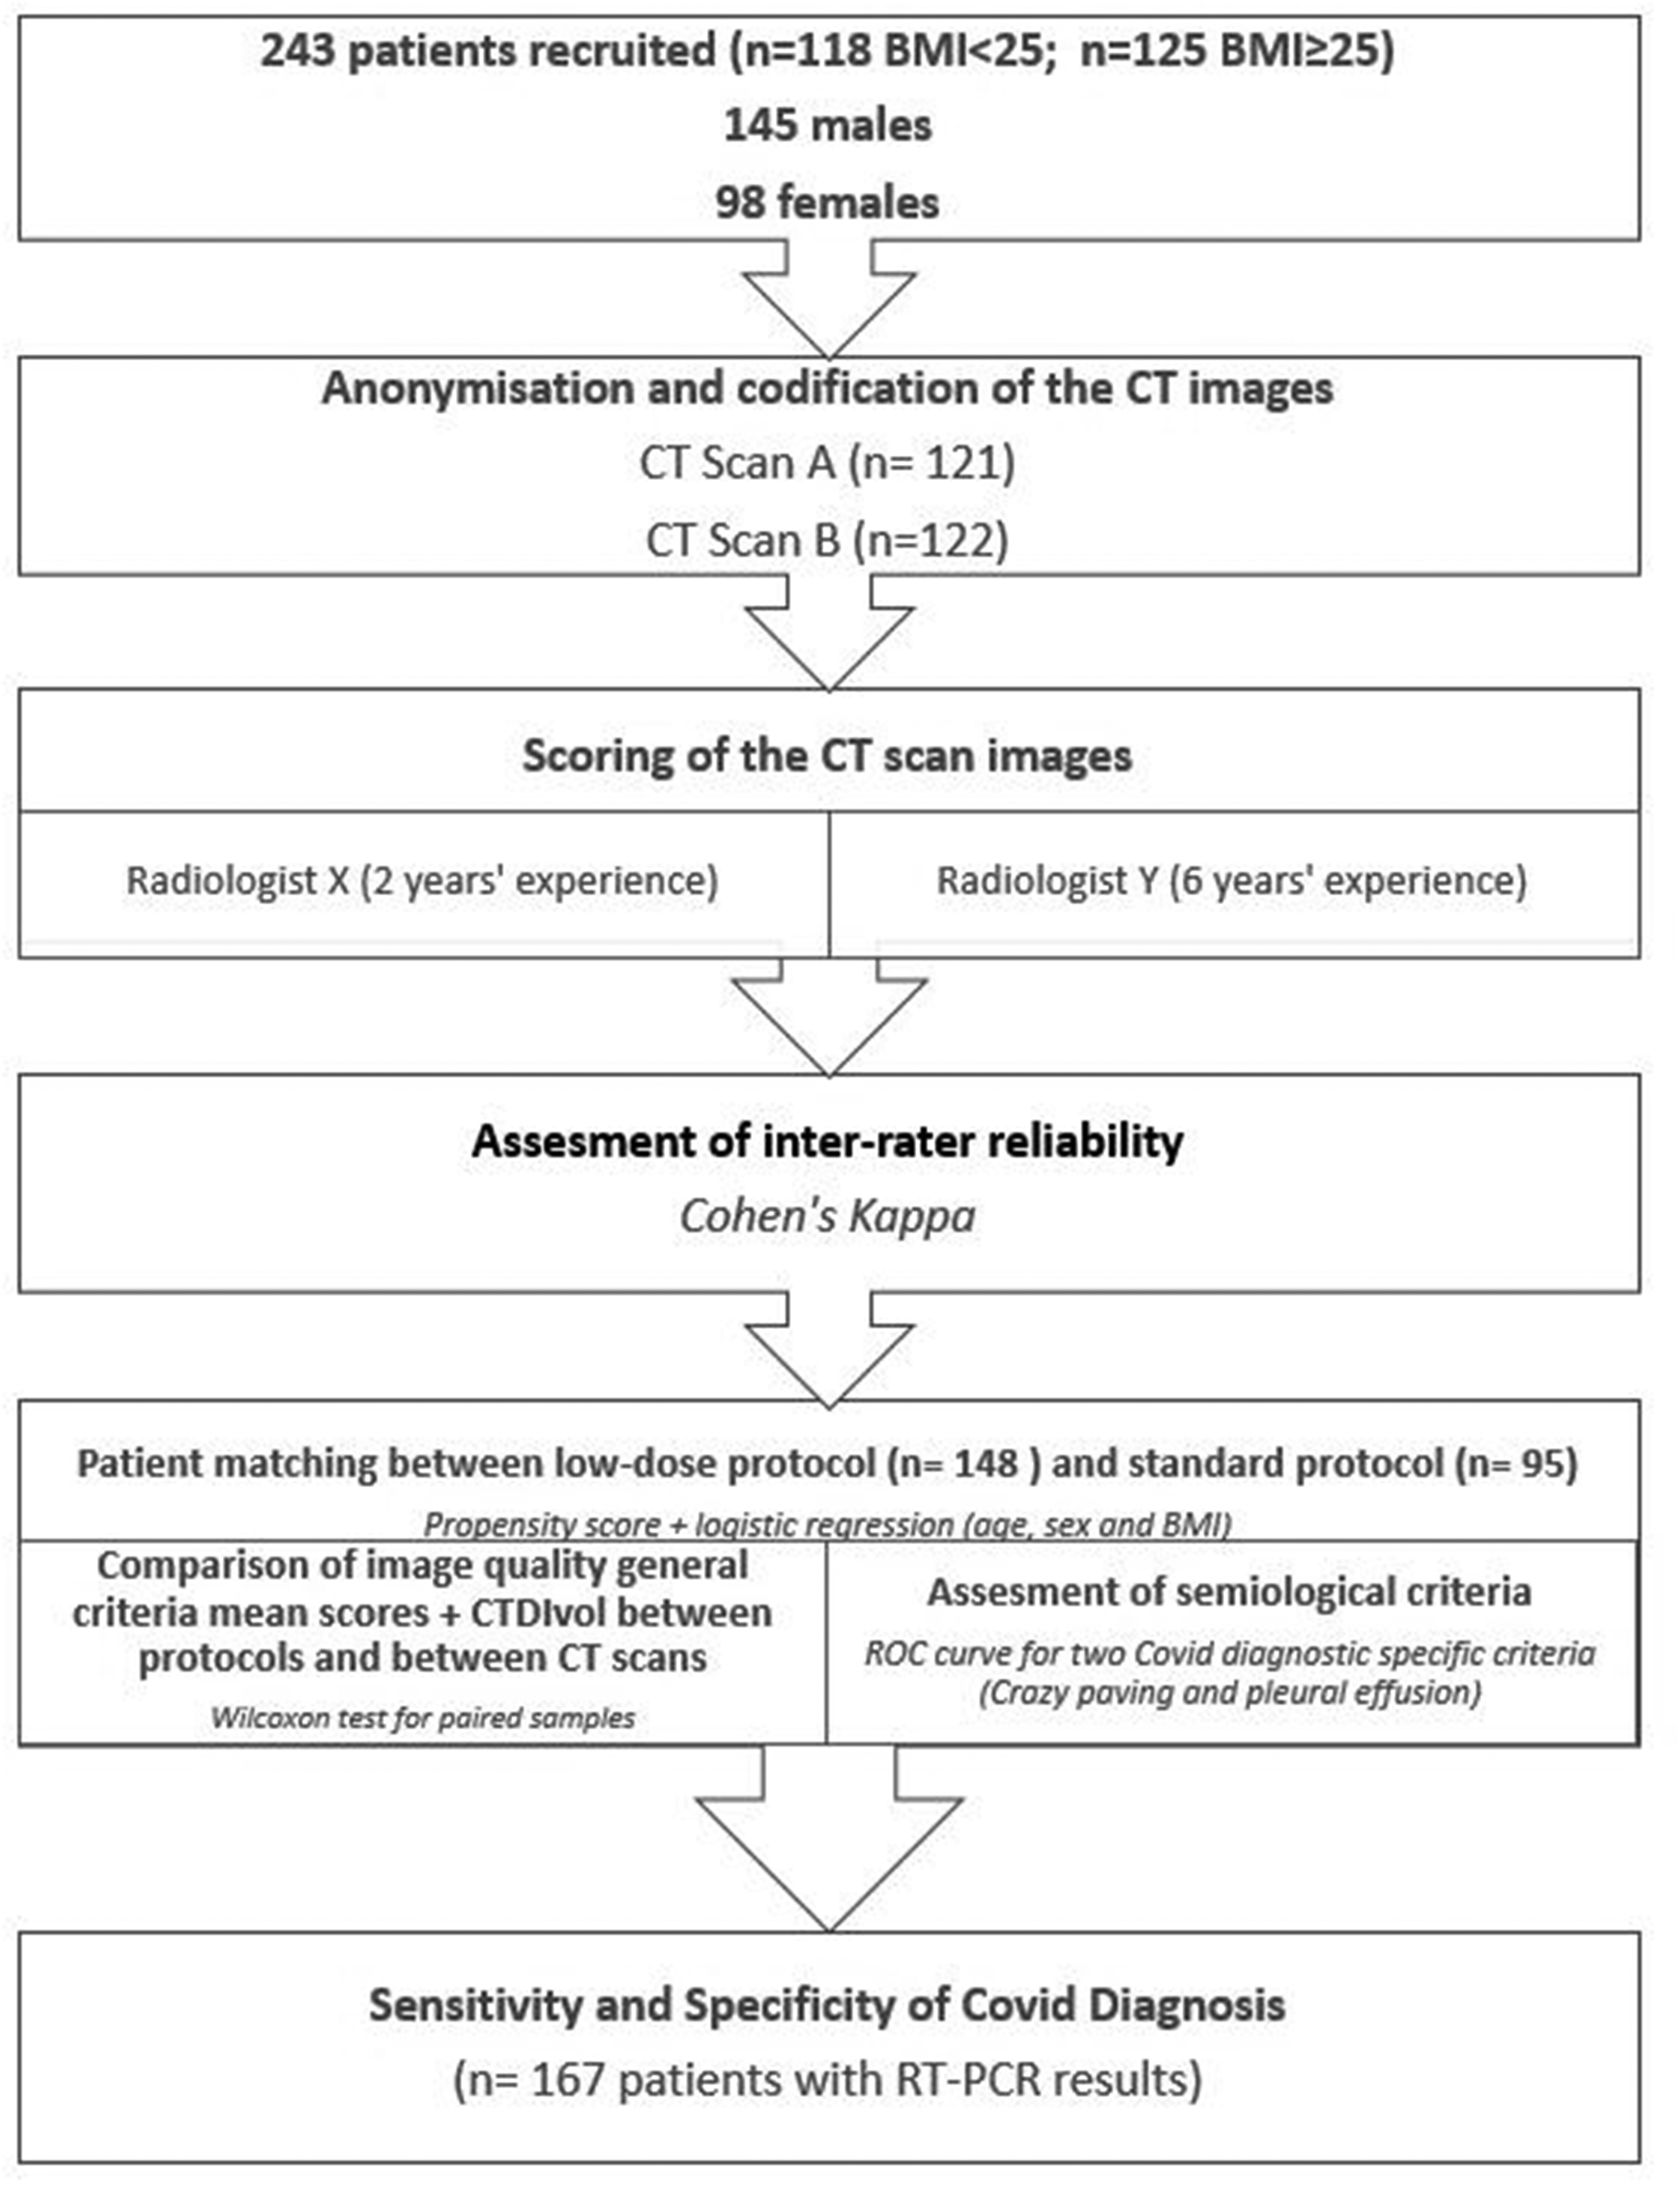
Flow chart for patient selection and different steps of the study.
Study population description by CT scan, RT-PCR result, protocol, sex, and BMI.
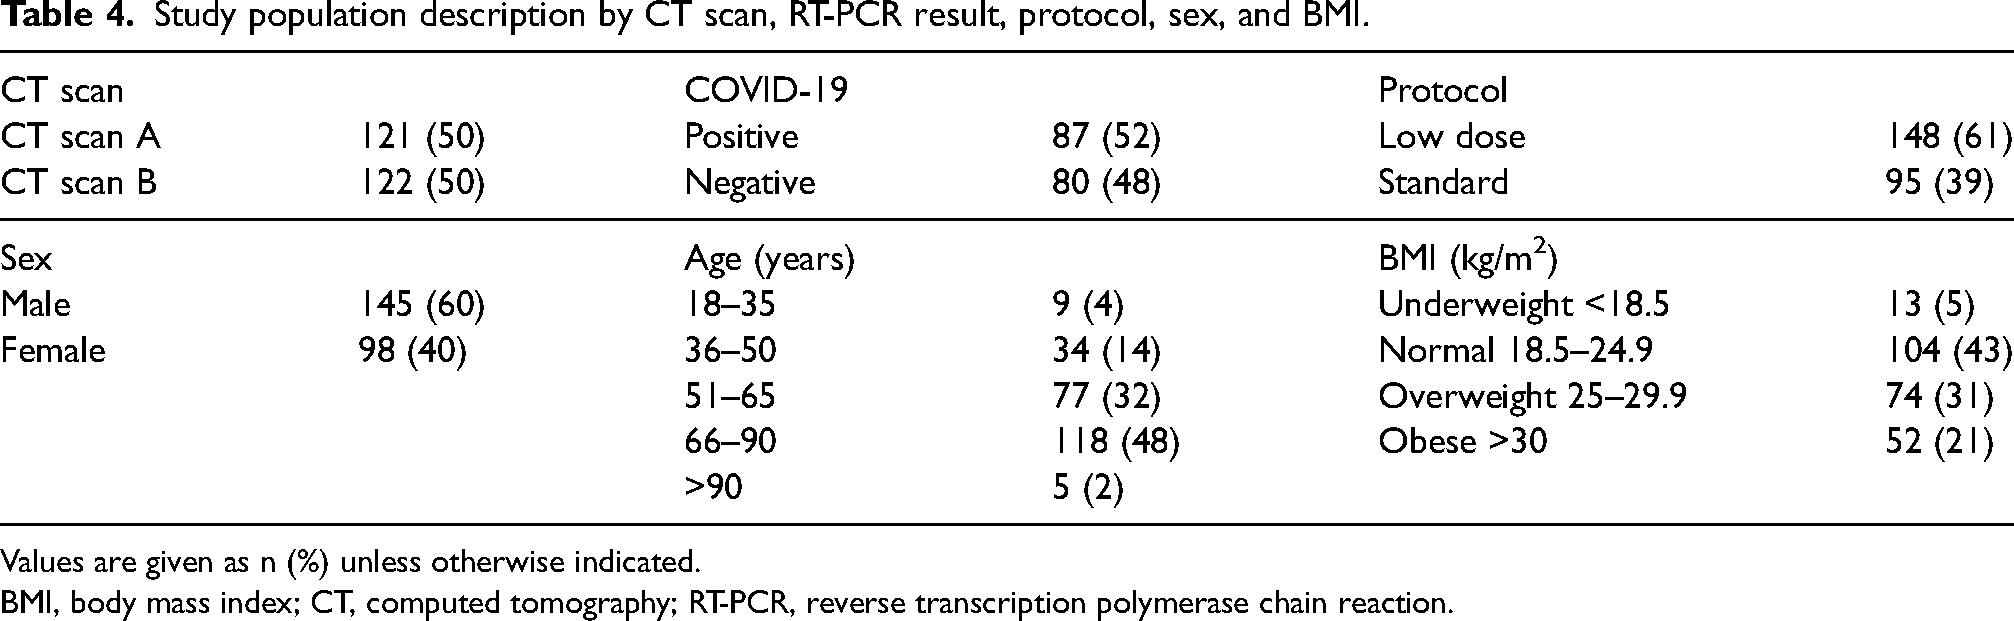
Values are given as n (%) unless otherwise indicated.
BMI, body mass index; CT, computed tomography; RT-PCR, reverse transcription polymerase chain reaction.
Patient image quality comparison between protocols
CTDIvol values with the low-dose protocol were significantly lower on both CT scanners (1.8 mGy for CT scan A and 2.6 mGy for CT scan B) when compared to the standard protocol (2.5 mGy for CT scan A and and 6.3 mGy for CT scan B) (Table 5). The image quality score was significantly higher for standard-dose acquisitions only on CT scan B for both BMI <25 kg/m2 and ≥25 kg/m2 when compared to low dose acquisitions. For instance, the IQ score was 33.3 for the standard protocol compared to 28.1 for the low-dose protocol in the BMI <25 kg/m2 category (Table 5).
Wilcoxon test for paired patients: comparison of mean image quality score and CTDIvol dose level (standard vs. low-dose protocol).
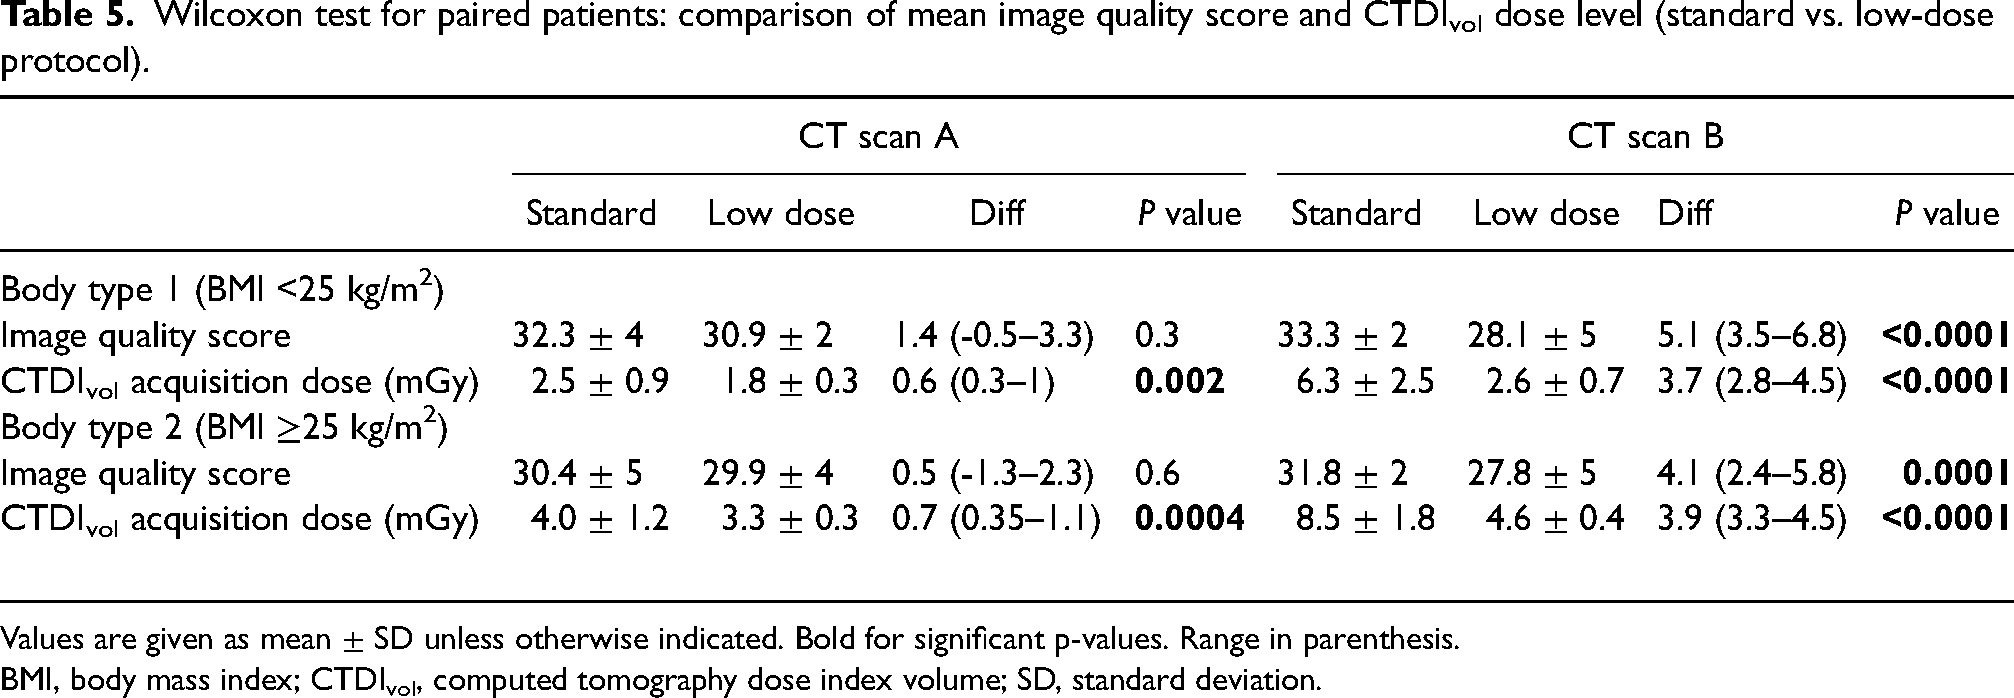
Values are given as mean ± SD unless otherwise indicated. Bold for significant p-values. Range in parenthesis.
BMI, body mass index; CTDIvol, computed tomography dose index volume; SD, standard deviation.
Patient image quality comparison between CT scanners
A comparison between the image quality of the two scanners and the CTDIvol acquisition dose was also performed (Table 6). For BMI <25 kg/m2, CT scan A had an image quality score of 30.9 with a CTDIvol of 1.8 mGy compared to an image quality score of 28.1 CT scan B and a CTDIvol of 2.6 mGy. A significant difference between both the image quality score and the CTDIvol dose was observed between the CT scanners for the low-dose protocol, and the superiority of CT scan A for the low-dose protocol in both BMI categories (≥25 kg/m2 and <25 kg/m2) was demonstrated.
Wilcoxon test for paired patients: comparison of mean image quality score and CTDIvol dose between the two CT scanners (CT scan A vs. CT scan B).
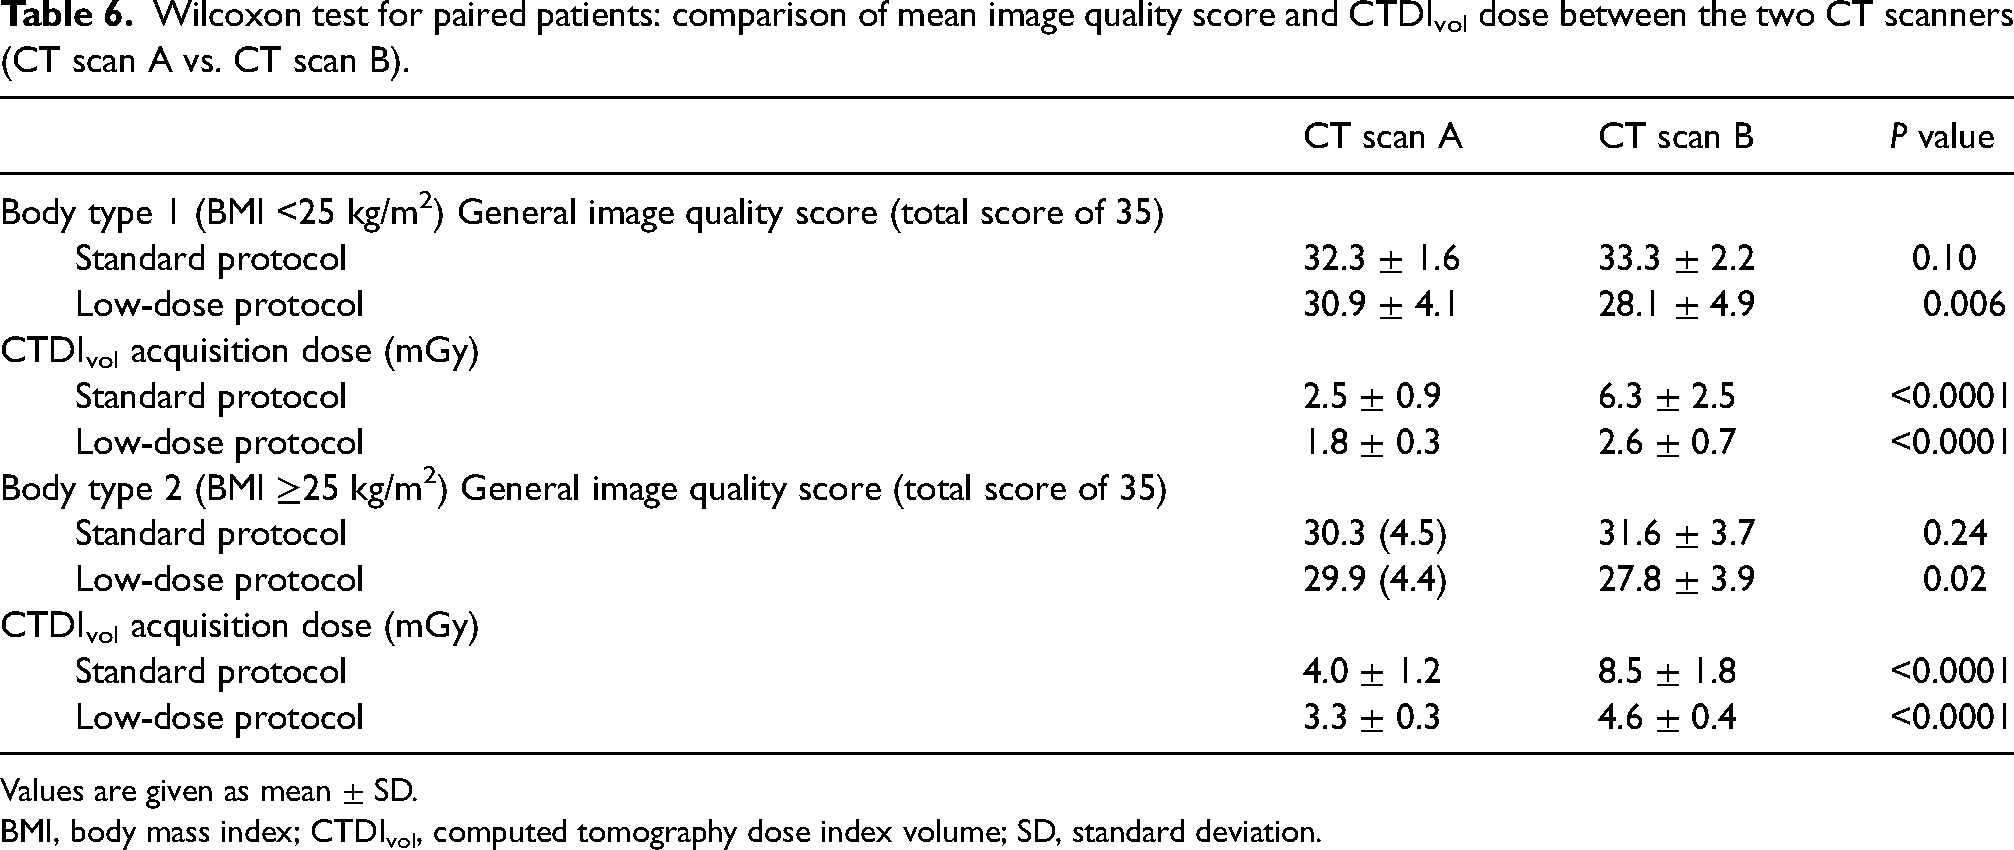
Values are given as mean ± SD.
BMI, body mass index; CTDIvol, computed tomography dose index volume; SD, standard deviation.
Sensitivity and specificity evaluation
Crazy paving was assessed using the ROC curves for each Reader (X/Y) in Fig. 3. The AUC based on crazy paving, which is discriminant, was higher (0.76) for radiologist Y (most experienced) than radiologist X (0.69).
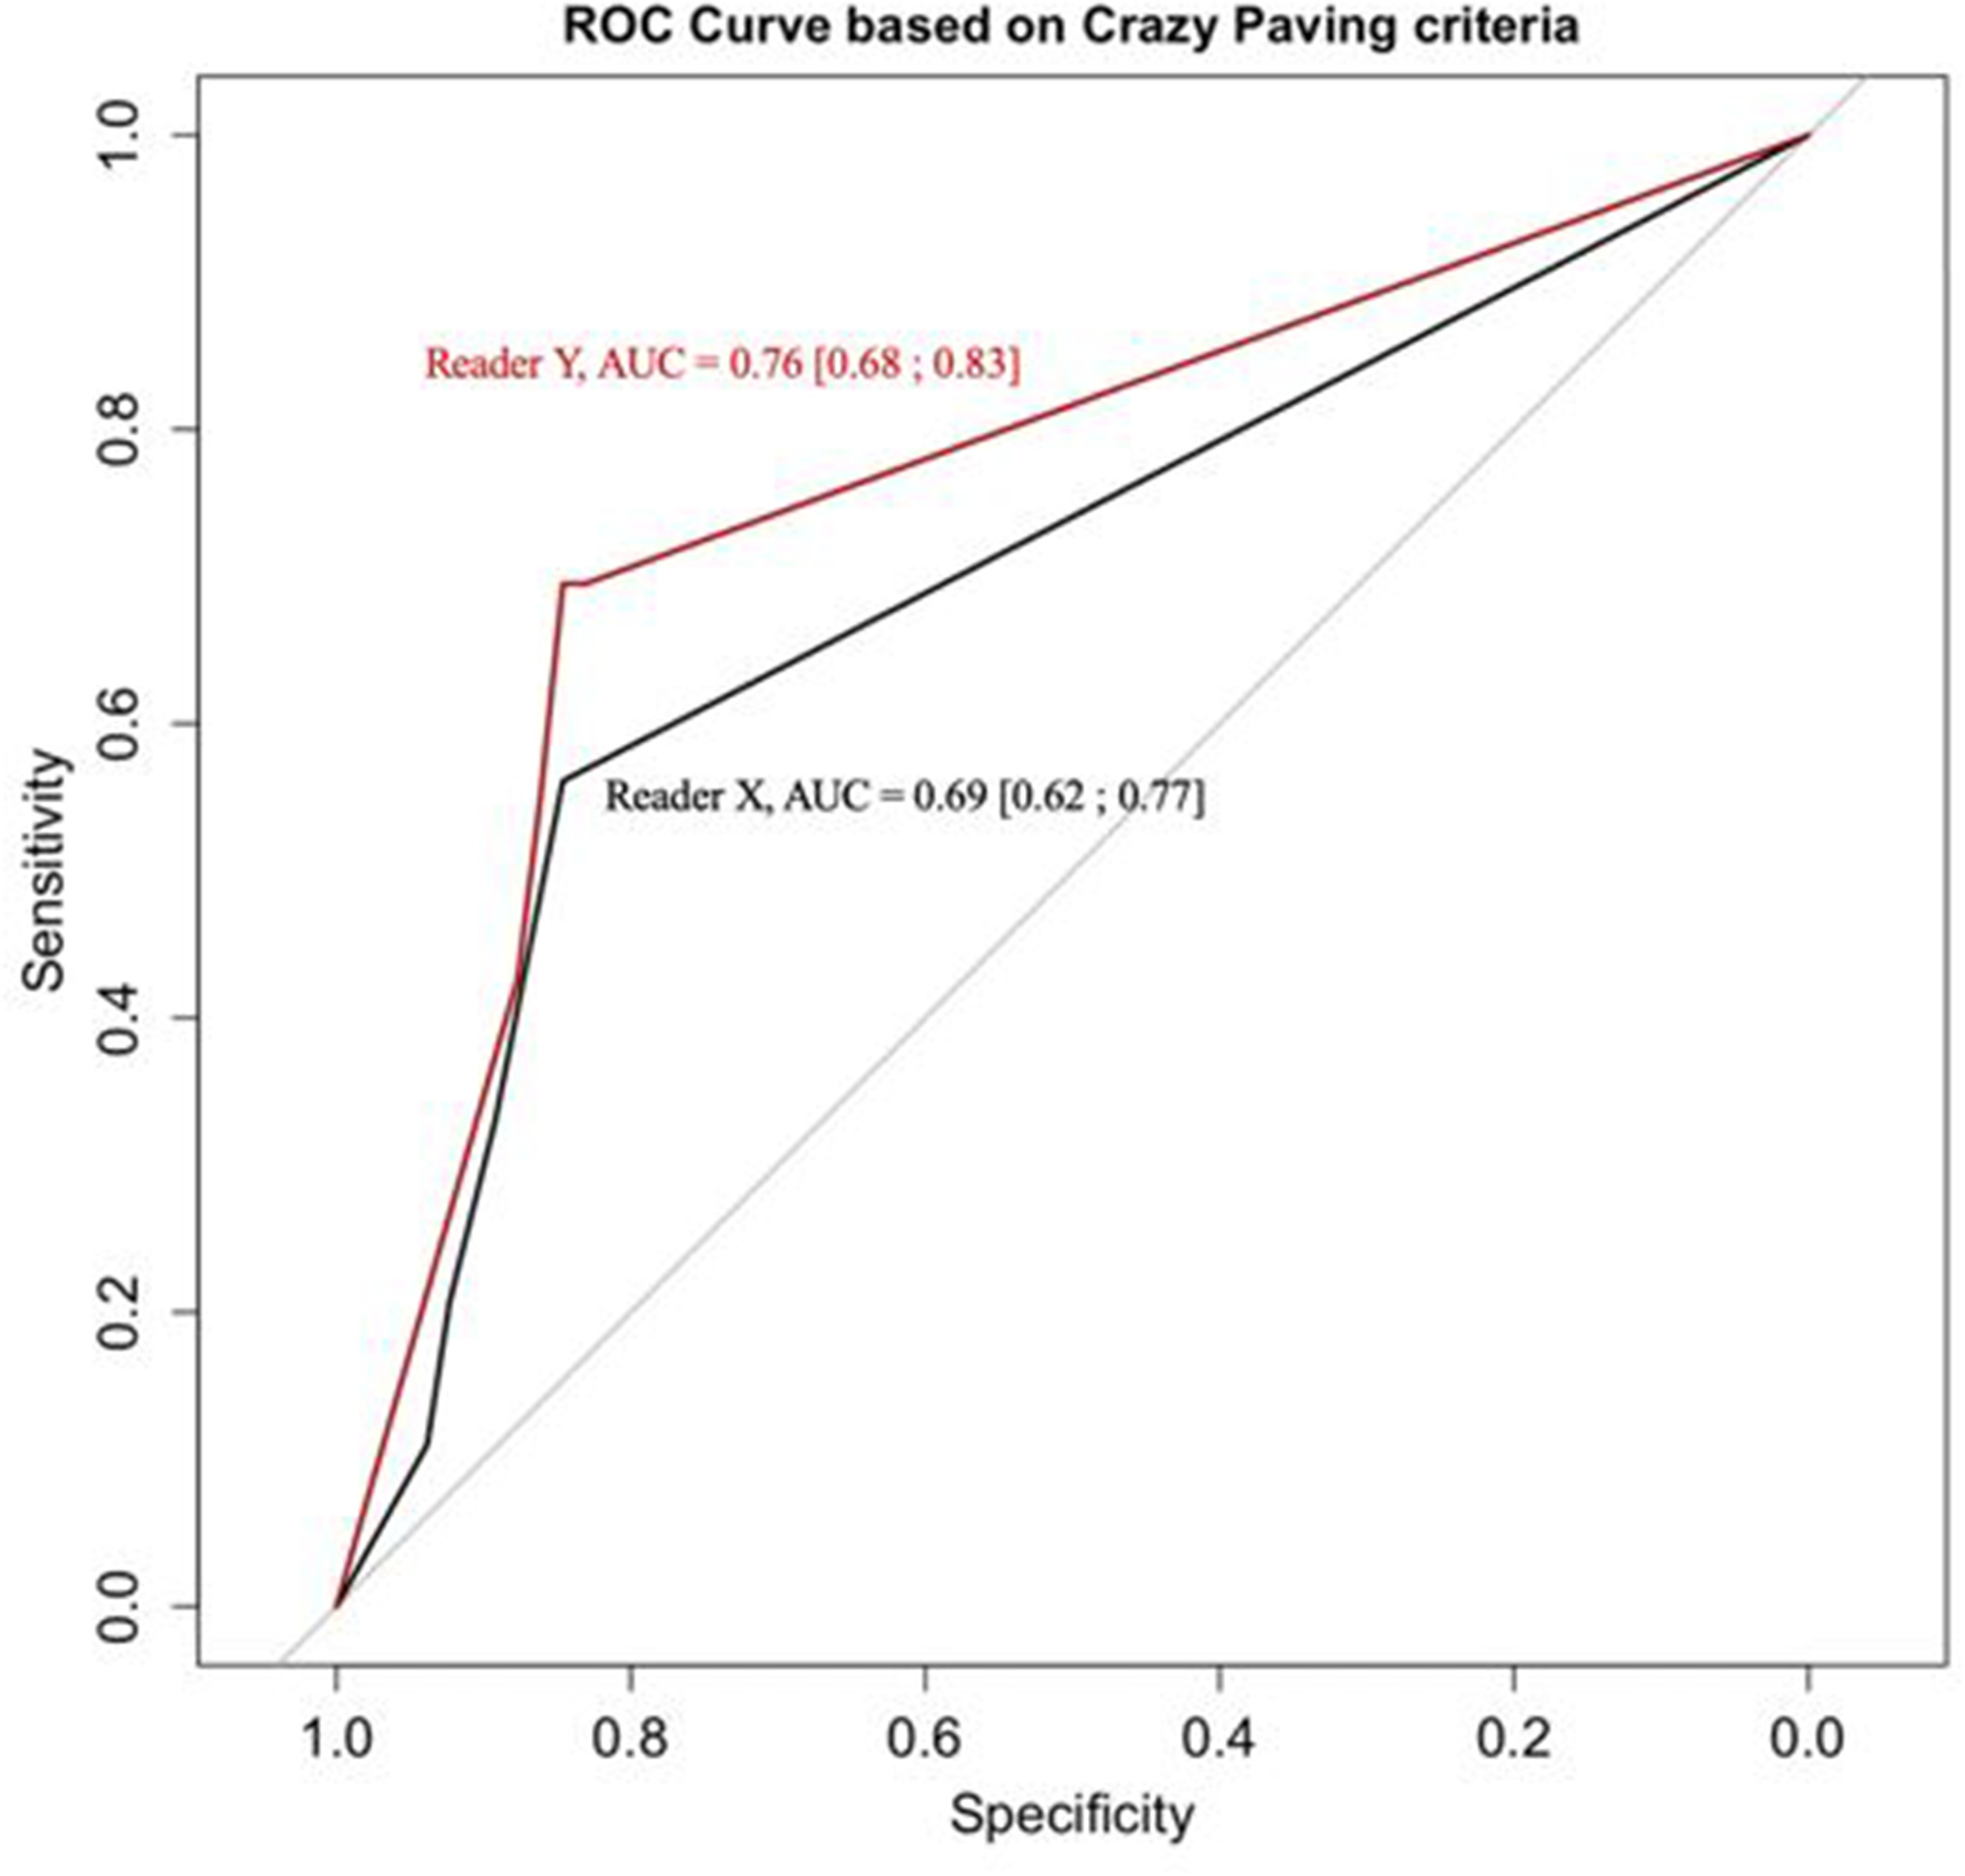
Receiver operating characteristic curve based on crazy paving criteria.
The bilateral question “Is the diagnosis related to COVID” was also assessed per reader and per CT scan for specificity and sensitivity when compared to RT-PCR test results in Table 7. Sensitivity and specificity were high (>0.7) for this binary question for readers and CT scans independently. In fact, sensitivity was 0.82 for reader X and 0.8 for reader Y while specificity was 0.80 for reader X and 0.82 for reader Y. Moreover, sensitivity was 0.82 for CT scan A and CT scan B while specificity was 0.83 for CT scan A and 0.72 for CT scan B. Regardless of experience, both readers presented a similar diagnostic reliability (4.1 for reader X and 4.4 for reader Y).
Low-dose protocol diagnostic performances per reader and for reader X per computed tomography (CT) scan.
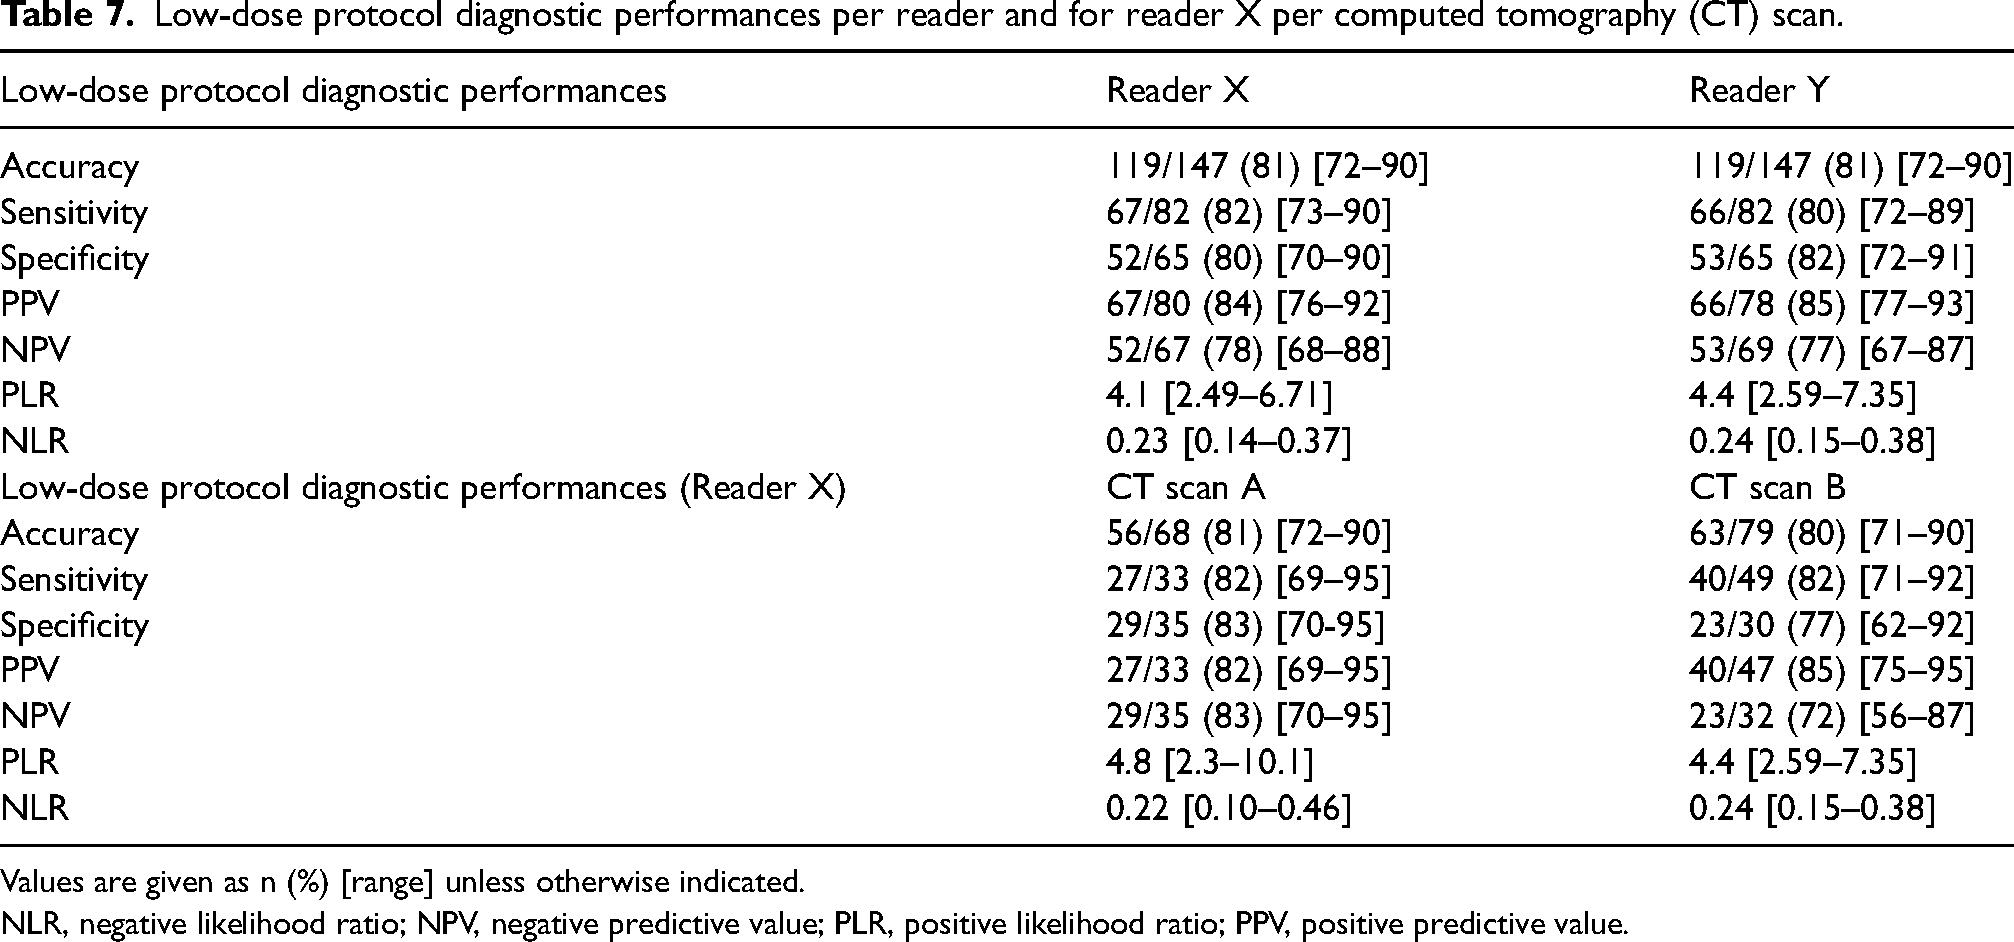
Values are given as n (%) [range] unless otherwise indicated.
NLR, negative likelihood ratio; NPV, negative predictive value; PLR, positive likelihood ratio; PPV, positive predictive value.
Inter-rater agreement
Inter-rater agreement was assessed, and good agreement (Kappa >0.5) was found between both readers for image quality score and diagnostic criteria specific score for all scored images independently of the protocol used or CT scanner (Table 8).
Kappa score analysis for patient images: global, low-dose protocol, CT scan A, and CT scan B.
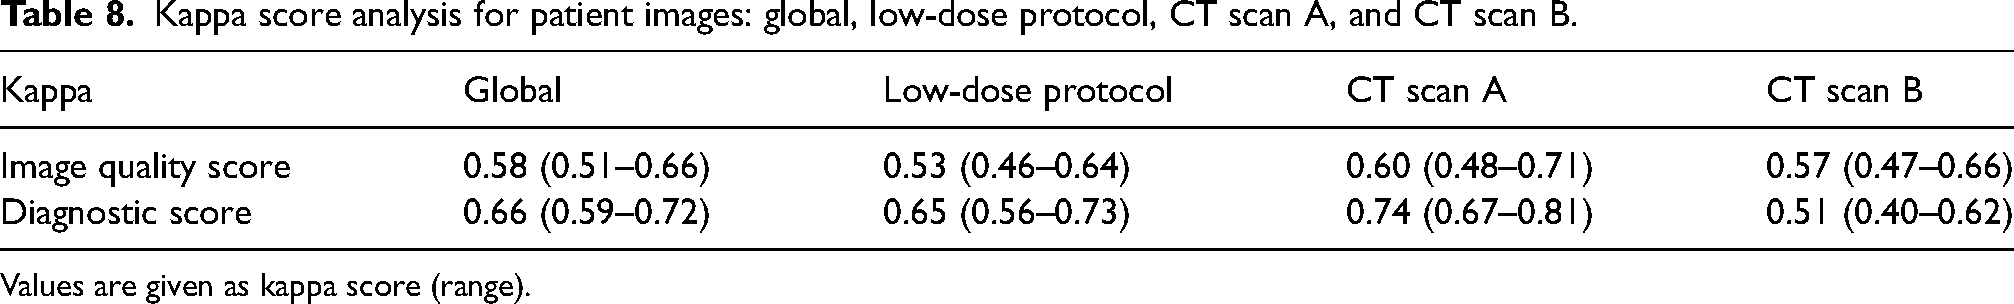
Values are given as kappa score (range).
Discussion
In this study, an in vitro analysis of Catphan inserts showed a significantly decreased CNR for the low-dose versus standard acquisition protocols on both CT scanners for patients with BMI <25 kg/m2 and for most inserts for patients with BMI >25 kg/m2. In vivo, no significant difference in diagnostic reliability was found between COVID-19 dedicated low-dose protocols and standard CT protocols independently of BMI and CT scanner models as illustrated in clinical images provided in Appendix C. When comparing the two scanners on patient data, CT scan A showed a significantly higher image quality compared to CT scan B in low-dose protocol (P < 0.006 for patients with a BMI <25 kg/m2 and P > 0.02 for those with a BMI >25 kg/m2) with a significantly lower dose (P < 0.0001 for both BMI subgroups).
In order to achieve low-dose protocols, the time current product was decreased in this paper. Generally, the two most common methods used to implement a low-dose chest CT protocol are by either decreasing the time current product while keeping the tube voltage fixed (15,22–25) or by decreasing the latter while keeping the former fixed (26). By keeping the tube voltage fixed in the high range (120–140 kV) and lowering the mAs as much as possible, it is possible to limit the noise level variation and to acquire better image quality, as described by Ludes et al. (27). In fact, Zhu et al. also showed that the noise level variation for the low-dose protocol is less visible in the lung window setting (28). This is why this method is used in the paper.
Although the Catphan analysis of CNR showed a significant difference between low-dose protocols and standard acquisitions on both CT scans A and B in the inserts that are closest in HU units to emphysema (Air) or semi-consolidation or consolidation (PMP, LDPE, Polystyrene) as defined by Yousef at al., the clinical relevance of these significant differences was not demonstrated (29). In fact, the Catphan analysis of CNR is a quick and straightforward measurement that has its limitations and may not be as comprehensive to assess image quality in clinical conditions, which could be brought by other additional metrics such as noise power spectrum, task-based transfer function, or detectability index (30). The image quality score for both readers was not significantly different for CT scan A for the low-dose protocol compared to the standard protocol (P = 0.3). For CT scan B, the image quality score was significantly different with a higher value for standard protocol (P < 0.00001), but the use of the low-dose protocol did not alter the sensitivity or specificity of a COVID-19 diagnosis, which was the purpose of the study.
In vivo, from a clinical and dosimetrical point of view, CT scan A allowed an increased dose reduction with optimal image quality. In fact, on CT images for both BMI categories, a superiority of CT scan A was demonstrated with higher image quality score and lower CTDIvol (50% and 30% decrease for CT scan A when comparing standard and low-dose protocols, respectively). This could be explained by the fact that CT scan A is a third-generation scanner and by the impact of tin filtration on dose as suggested by Wisselink et al. (31).
The global kappa score showed a good agreement between patients’ image quality scores for the two radiologists (≥0.6). On some criteria, such as sharpness and subjective diagnostic reliability, a 2-point score difference was observed in a majority of low-dose CT scan B images (17% of all scored images but 60% of the 2-point score difference images). In fact, reader X attributed a 2/5 or a 3/5 score while reader Y attributed a 4/5 or 5/5 score. Furthermore, from the Catphan analysis, noise was more prevalent in CT scan B, which could create some difficulty for a less experienced reader. Nevertheless, the ability to diagnose COVID-19 was not impacted in general, as no statistically significant differences were found between the ROC curves for the two CT scans and the two radiologists. The accuracy of a COVID-19 diagnosis was 81% independent of the radiologist's experience. Similar findings regarding the absence of the impact of experience on a COVID-19 diagnosis have also been demonstrated by Revel et al. (32).
As expected, crazy paving was found to be a specific criterion for COVID-19 and showed increased specificity with little difference between the two readers. The results also showed a high specificity and sensitivity (>0.8 for both readers) for a CT scan diagnosis of COVID-19 when compared to COVID-19 clinical results, in line with Kovács et al. (33).
The present study has some limitations. First, this is a single-center study, but this single institution had both second- and third-generation scanners that are used interchangeably and are widespread models. Second, this is a retrospective study instead of a prospective one. To avoid the ethical problem of repeat scans of patients with two protocols, standard and low-dose, and to allow a larger sample size, patients were matched according to age, sex, and BMI for each scanner separately. Third, only two readers with different levels of expertise evaluated the CT images; however, apart from different image quality appreciation, this had no impact on the diagnostic performance.
In conclusion, low-dose protocols provided sufficient IQ independently of BMI subgroups and CT models without any impact on the reliability of the diagnosis. Third-generation scanners give a superior image quality when compared to second-generation scanners and allow a dose reduction of 30% with low-dose protocols.
Supplemental Material
sj-docx-1-acr-10.1177_02841851231153797 - Supplemental material for Image quality assessment in low-dose COVID-19 chest CT examinations
Supplemental material, sj-docx-1-acr-10.1177_02841851231153797 for Image quality assessment in low-dose COVID-19 chest CT examinations by Joelle A Feghali, Roberta A Russo, Adel Mamou, Axel Lorentz, Alfredo Cantarinha, Marie-France Bellin and Olivier Meyrignac in Acta Radiologica
Footnotes
Acknowledgements
We would like to specifically thank Jean-Marc Ginesta for helping us to handle the anonymized images on the PACS. The authors acknowledge all radiographers in the radiology department.
Declaration of conflicting interests
The author(s) declared no potential conflicts of interest with respect to the research, authorship, and/or publication of this article.
Funding
The author(s) received no financial support for the research, authorship, and/or publication of this article.
Supplemental material
Supplemental material for this article is available online.
References
Supplementary Material
Please find the following supplemental material available below.
For Open Access articles published under a Creative Commons License, all supplemental material carries the same license as the article it is associated with.
For non-Open Access articles published, all supplemental material carries a non-exclusive license, and permission requests for re-use of supplemental material or any part of supplemental material shall be sent directly to the copyright owner as specified in the copyright notice associated with the article.