
Abstract
In this article, we conduct the first comprehensive bibliometric and thematic analysis of academic research involving official statistics and government decision making. By systematically analyzing the volume, trends, and impact of publications, we map the research and policy landscape, identify key research and policy topics, and uncover trends in the use of official statistics. We find that the use of official statistics data is more prevalent and has a greater impact on monetary policy research compared to other areas of policy making. We also observe a gradual transition from policy-related academic research on traditional topics, such as inflation, employment and economic growth, toward sustainability topics, such as renewable energy, carbon neutrality, green finance, and energy poverty. In addition, we provide ample evidence that China is becoming one of the most important sources of policy-related academic research, both domestically and globally. There is a mutual relationship between the official statistics authorities and the policy community, where both groups benefit from and contribute to the data’s relevance and reliability.
Keywords
1. Introduction
The increasing complexity of socioeconomic challenges and the growing emphasis on evidence-based policy making have underscored the critical role of official statistics in government decision-making processes. Governments worldwide rely on these statistics to guide policy development, monitor and evaluate program effectiveness, allocate resources efficiently, and ensure transparency and accountability (Fellegi 2004; Malaguerra and MacDonald 2016). The extent to which government decision makers employ official statistics for informed decision making varies depending on several factors, such as the availability of data, the type of decision being made, and the level of expertise and capacity within the government. The relationship between policy research and policymaking is thus complex, with political considerations often taking precedence over research findings (Coleman 1991).
Despite the recognized importance of official statistics, there is a lack of comprehensive understanding regarding the extent to which these data are effectively utilized in the decision-making process (Radermacher 2019), primarily due to the complexity of the decision-making process, data access and confidentiality, lack of standardization in data use, time lag between data collection and decision making, and unavailability of relevant data. Moreover, the rapidly evolving landscape of data generation, including the emergence of real-time statistics and new data sources, presents both opportunities and challenges for integrating official statistics into government strategies (Allin 2019; MacFeely 2016).
Official statistics were traditionally focused on socioeconomic and demographic data collected through surveys and administrative sources (Abraham 2022). As such, they have played a vital role in economic and social policy making by informing policy development, monitoring, and resource allocation (Holt 2000). Official statistics play a particularly important role in monetary policy research and decision-making, as central banks rely heavily on statistical data for policy formulation, monitoring, and evaluation (D’Alessio et al. 2022; Tissot and De Beer 2020). However, the adoption of unconventional monetary policies has raised questions about the adequacy of existing statistics (Lima and Mota 2017). Socioeconomic and demographic data is also prevalent in official statistics due to its cross-disciplinary relevance and wide-reaching impacts on a country’s well-being (OECD 2005). Nonetheless, the focus of official statistics on traditional socioeconomic and demographic data might change with granular and with big data, which offer opportunities to expand the mission of national statistical offices (Abraham 2022; Israël and Tissot 2021).
Over the past few decades, there has been a discernible shift in policy research from traditional domains, such as economic growth and stable prices, to sustainable policies that integrate environmental and social factors (Kemp and van Lente 2013; Patterson et al. 2015). This transition is driven by an increasing awareness of the urgent need to address global challenges, like climate change, resource depletion, and social inequality. Consequently, sustainable policy research now emphasizes interdisciplinary approaches, incorporating insights from environmental science, economics, and social sciences to develop holistic and adaptive policies (Dieleman et al. 2019; Niles and Lubell 2012). This shift is also reflected in policy agendas and funding priorities, which increasingly support sustainability-focused studies, aligning with global initiatives, such as the United Nations Sustainable Development Goals (Campbell et al. 2020). Despite these advancements, challenges remain in addressing complex sustainability issues, particularly climate change, urban development, and food systems (Armstrong and Kamieniecki 2019).
However, we can also observe another global shift in policy research recently—a geographical one. Namely, even though traditional Western research and academic institutions are still at the forefront, China is rapidly emerging as a key player in global policy research, driven by significant domestic investment in think tanks and research institutions that address a wide array of issues, from socioeconomic issues to technology regulation (Benner et al. 2012; Feng and He 2020). China’s influence is growing internationally through increased collaboration with global think tanks and academia, particularly in critical areas like climate change, global health, and trade. The country’s research output has surpassed that of other nations, with improvements in both quantity and quality (Hyland 2023). The rise in high-quality publications and policy forums originating from China underscores its ambition to lead in shaping both domestic and international policy discourse.
A bibliometric and thematic analysis offers a systematic and quantitative approach to exploring the academic and policy-oriented discourse surrounding the use of official statistics in governance. By analyzing the volume, trends, and impact of publications on this topic, bibliometric studies can provide valuable insights into the intellectual structure, evolution, and research gaps in the field (Župić and Čater 2015). Such an analysis is crucial for identifying the key areas, where official statistics are being discussed, the challenges and opportunities highlighted by scholars and policymakers, and the directions in which future research could be most beneficial.
The only bibliometric and thematic study of research based on official statistics that we are currently aware of is that of Velasco-López et al. (2023), which investigated Scopus publications from 1960 to 2020 that use official statistics as data sources. They concluded that the main themes were closely related to medicine, business and management, and sociology. Other high-performance themes from different areas that have also been found recently are related to psychology, environment, and microbiology. Several timelines have been identified that relate themes over time, generally from the same field, but in some cases intertwining fields of knowledge. The themes related to medicine and sociology persisted as motor and central themes throughout the investigated time period.
This article aims to conduct a comprehensive bibliometric and thematic analysis of the existing academic research involving official statistics and government decision making. We, therefore, do not examine the existing academic research based on official statistics, as Velasco-López et al. (2023) have already done this; instead, we examine the existing academic research based on official statistics for the purposes of government policy making, which is narrower and more specific topic. We have not been aware of the existence of any such survey study until now. We focus on publications that use official statistical data and provide policy conclusions and advice that were used or could be used by public decision makers, such as governments, ministries, and various government agencies and authorities. By systematically analyzing the volume, trends, and impact of publications in the field, we map the policy landscape, identify key policy topics, and uncover trends in the current discourse.
The analysis employs quantitative scientometric methods, interspersed with qualitative findings from the identified literature. Although quantitative methods may seem appealing for analyzing extensive bibliometric datasets, it is essential to complement them with content analysis to identify significant discoveries and their implications. To conduct a comprehensive bibliometric and thematic analysis, we employ the high-quality and reliable Web of Science (WoS) data in order to create a vast bibliometric dataset of more than 20,000 records from the WoS Core Collection database (Clarivate Analytics 2024) for the period 1961 to 2023. We limit our focus to academic publications, which do not cover all government decision making research based on official statistics, but provide quality via the scholarly peer review process.
This article explores three research questions by conducting a thorough literature review synthesizing historical and current research:
What are the primary research areas and policy topics that dominate the academic literature utilizing official statistics in the context of government decision making?
How has the focus of academic research utilizing official statistics evolved over time?
What is the contribution of different organizations and regions to the production of academic research utilizing official statistics for government decision making?
Related to the first research question, it will be valuable to analyze whether the use of official statistics data is more prevalent and has a more significant impact on monetary policy research, fiscal policy research, or some other area of policy making. Related to the second research question, it will be revealing to assess whether there is a transition from research on traditional policy topics to research on more contemporary policies, such as sustainability. Related to the third research question, it will be interesting to observe whether new sources of policy research are emerging geographically, apart from traditional European and American organizations and regions. Ultimately, the findings of this article will deepen our understanding of the role that official statistics play in governance and provide guidance for improving their effectiveness in evidence-based policy making.
The rest of the article is organized as follows. Section 2 presents the methodology and data used to investigate the use of official statistics in government decision making. Sections 3 to 6 contain a thorough bibliometric and thematic analysis, starting with a systematic overview in Section 3 and a thematic analysis in Section 4, and proceeding with identifying the most influential authors, journals and articles related to government decision making based on official statistics in Section 5, and organizations in Section 6. These sections also deliver co-occurrence network analysis, co-citation network analysis, and collaboration network analysis. Content analysis is provided throughout the bibliometric and thematic analysis. Finally, Section 7 concludes the article with some key findings.
2. Methodology and Data
The bibliometric analysis procedure follows several phases, from defining the aims and scope of the study, designing the study, and collecting the data, to performing the analysis and reporting the results (Donthu et al. 2021). Performance analysis and science mapping are the primary objectives of bibliometric methods (Cobo et al. 2011). Performance analysis quantifies the productivity and influence of researchers, institutions, or journals, providing insights into the impact of scientific work over time and offering benchmarks for comparative assessments. We use bibliographic performance analysis based on publication and citation indicators to explore the performance and impact of authors, journals, articles, and organizations. Specifically, we use the number of publications, the number of global citations, and the number of local citations. As opposed to the global (or total) citations, which measure the number of citations a document has received from all documents contained in the WoS database, the local citations measure the number of citations a document has received from documents included in the analyzed collection. This is important, as for many documents a large part of the global citations, which measure the impact of a document in the whole bibliometric database, could be unrelated to government policy making, whereas with local citations this is not so, as they measure the impact of a document in the analyzed collection.
Citation counts are subject to criticism as they do not account for self-citation and negative citation. Self-citation occurs when authors reference their own previous work, potentially inflating citation counts, while negative citation refers to instances where a work is cited in a critical context that questions or disputes its findings rather than endorsing them. Self-citation and negative citation are very difficult to address in a bibliometric study based on a large number of documents, especially as citation practices vary among scientific fields and even within different areas within a single subfield (Bornmann and Daniel 2008). However, their influence tends to diminish over time and does not equate to a long-term enhancement of a researcher’s scientific impact (Fowler and Aksnes 2007), especially for highly-cited authors and documents, exposed in a bibliometric study. Citation counts thus remain a useful, if imperfect, proxy for scholarly influence, and our findings are interpreted within this acknowledged context.
Although citations are a metric of influence, they do not disclose the complex networks of connections among scholars. Science mapping utilizes visualization techniques to depict the structure and evolution of the field, revealing how research topics, collaborations, and trends are interrelated. By mapping the intellectual landscape, we can identify core themes, emerging areas of study, and the dynamics of interdisciplinary interactions (Župić and Čater 2015). We employ co-citation analysis to investigate the streams of academic research for government decision making based on official statistics. The identification of the most influential articles is made possible by the co-citation network of articles, which assesses the frequency with which two articles from the collection are cited together. The co-citation network facilitates the mapping of the fundamental themes (concepts, streams) and connections between them, as frequently co-cited articles are necessarily also frequently cited individually, assuming that these articles capture the important concepts and methods in the field (Small 1973). In addition, we employ co-occurrence analysis (Callon et al. 1991), which examines the frequency with which specific terms or keywords appear together in the collection, thereby uncovering patterns that reveal conceptual relationships and thematic clusters. By highlighting the interconnectedness of topics, co-occurrence analysis provides valuable insights into how scientific ideas converge and evolve, guiding further investigation into research directions.
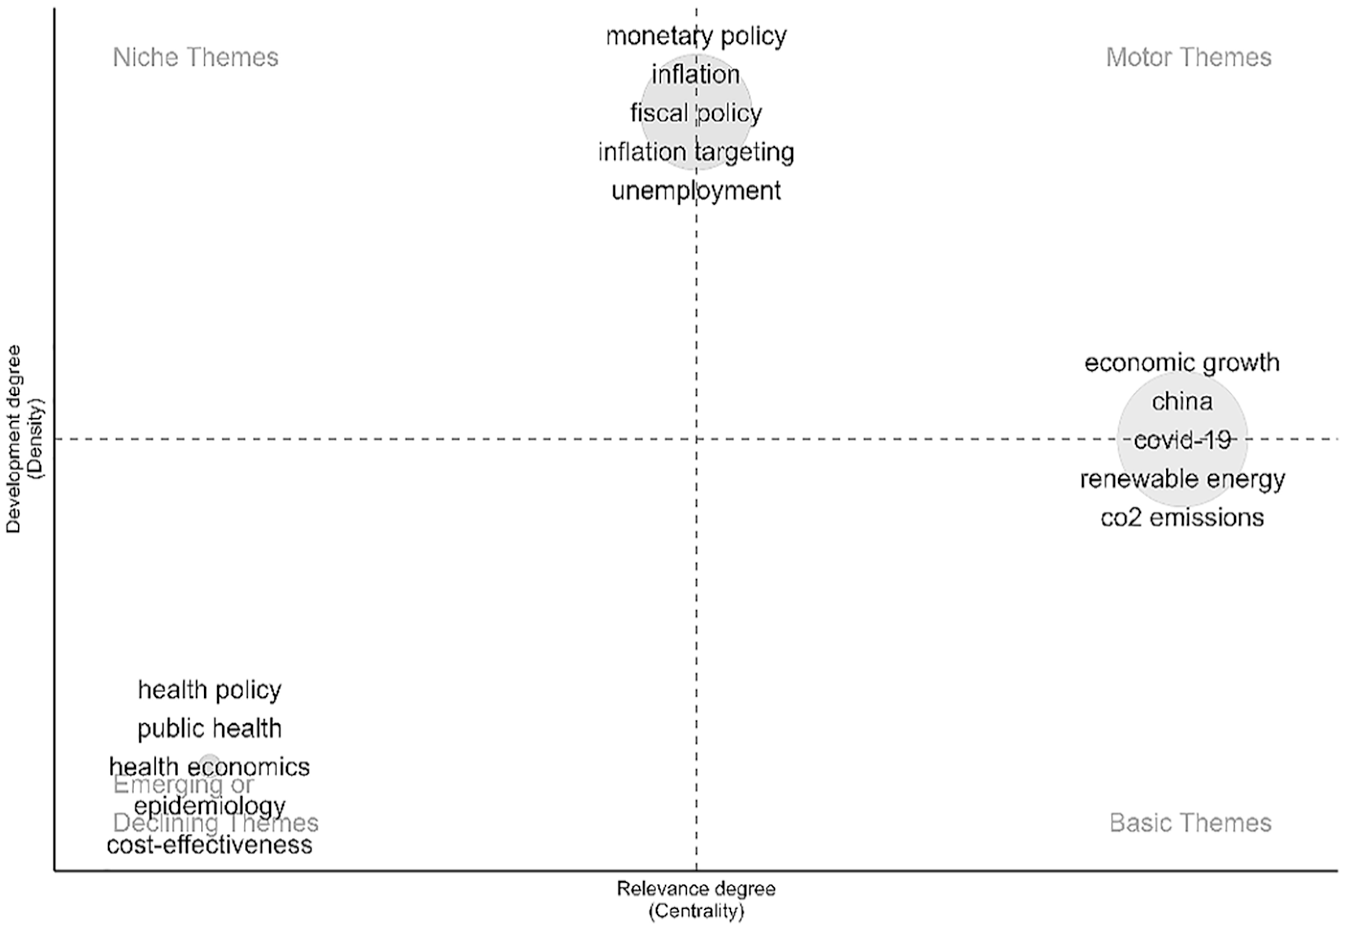
A strategic or thematic map is a two-dimensional diagram used to visualize research themes (Cobo et al. 2011). Namely, by applying the Walktrap clustering algorithm on the keyword network (individual author keywords), we can highlight different domain themes. Each theme (cluster) is characterized by two measures: (a) centrality, which measures the degree of interaction of a network with other networks, and (b) density, which measures the internal strength of the network. Centrality is a measure of the theme’s relevance, whereas density is a measure of the theme’s development (Callon et al. 1991). A research field composed of research themes is then classified into four groups of themes (see Figure 1):
– Motor themes (quadrant 1), characterized by high centrality and high density; these are well-developed themes that are important and influential in structuring a research field;
– Niche themes (quadrant 2), characterized by low centrality and high density; these are well-developed themes with little interaction with other research areas;
– Emerging or declining themes (quadrant 3), characterized by low centrality and low density; these themes are either new and growing or old and fading;
– Basic and transversal themes (quadrant 4), characterized by high centrality and low density; these themes are important, but internally not (yet) extensively developed.
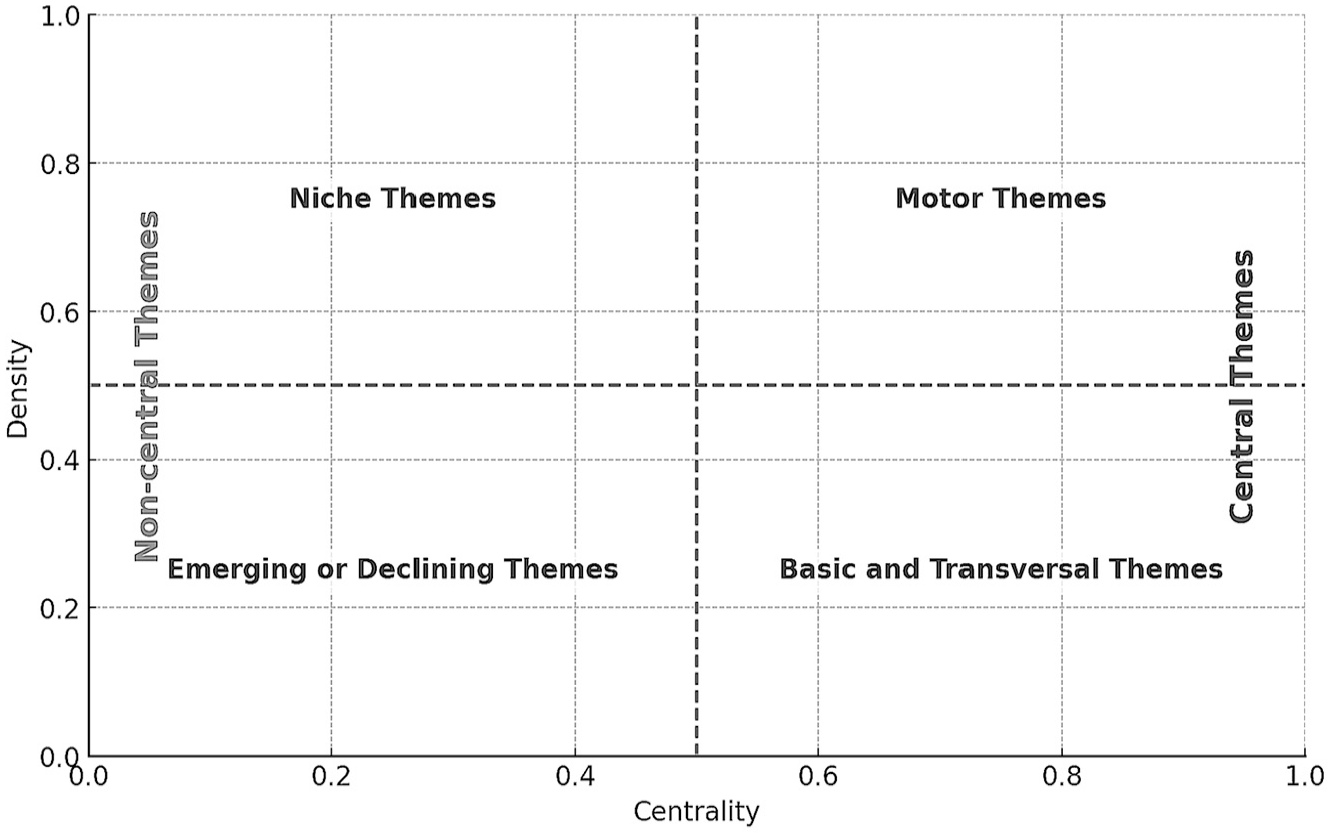
Strategic map of a research field (research themes based on keywords).
Similarly to Velasco-López et al. (2023), we refer to the themes on the right-hand side (motor themes and basic themes) as central and those on the left-hand side (niche themes and emerging or declining themes) as non-central. We divide the time frame of the collection to sub-periods (time slicing) and perform the thematic analysis on each sub-period.
Relevant documents and their statistics were gathered to perform the bibliometric and thematic analysis. The WoS Core Collection (Clarivate Analytics 2024) was chosen as the data source due to its quality, advanced analytical capabilities, and established reputation in the academic community. Unlike Google Scholar, which indexes a broad range of sources, including non-peer-reviewed content, the WoS Core Collection maintains strict inclusion criteria, ensuring that the most reputable and influential publications are included, resulting in a more focused and reliable dataset. Additionally, the WoS provides comprehensive citation data and advanced tools essential for robust bibliometric analysis, allowing detailed tracking of citation networks and other metrics crucial for understanding research trends. Scopus, on the other hand, has a somewhat broader coverage that includes more journals, particularly in emerging disciplines. In addition, it offers somewhat more balanced coverage across disciplines, including a better representation of the social sciences, which could be of interest in our case. We thus also performed the bibliometric analysis based on the Scopus database (Elsevier 2024) as a robustness check (not shown in the article due to space limitations). While the same search query resulted in more documents written by more authors, it turned out that there was little difference in the qualitative results based on the two databases. Our choice was finally justified by the fact that the WoS is often preferred for its depth in historical coverage and its broader citation connections across disciplines. Moreover, the WoS is widely recognized and trusted in the academic community, frequently used in academic evaluations, funding decisions, and institutional rankings, making it the most appropriate database for a study focused on understanding the role of official statistics in government decision making.
In order to conduct a search that accurately describes the topic at hand, several approaches were tested. The focus was on using official statistics in government decision-making processes, not, for example, for sample preparation in various research activities that are not directly linked to government policy making. Thus, the query was meant to be composed of two parts: one that would capture official statistics and one that would capture policy making. Each part would consist of a number of terms (words or phrases), whereas a relevant document should have at least one pair of terms from the two parts of the query in its “topic” (TS). Thus, the Boolean command OR would be used in each part of the query (within official statistics terms and policy-making terms), and the Boolean command AND would be employed to link the two parts of the query.
The “topic” searches the title, abstract, author keywords, and Keywords Plus of a document. These categories were deemed relevant due to missing articles in the conducted search if only some of the categories were chosen, as for example, some articles on the WoS lack selected keywords. Overall, this strategy may slightly overestimate the number of documents in the considered area, but including several categories in the search is of high importance to avoid missing important documents.
For the first part of the query, we first investigated official statistics’ themes or areas, such as demographic, economic, social, environmental, health, agricultural, transportation, and education statistics, to point out the most frequent ones. It turned out that these terms were much too broad and captured a large segment of documents, where the data employed were administrative or survey data that were not related to official statistics. Thus, we shifted our focus to key representative statistical products instead, such as “census,”“population projections,”“gross domestic product,”“public debt,”“wages,”“unemployment,”“consumer prices,” and “vital statistics,” to point out just the most common ones. This approach turned out to be much more relevant and was finally employed, even though some of the terms could not be used (e.g., “census” or “population census” is a term commonly used in forestry, ecology, biology, etc. and could not be employed directly in our analysis without substantially complicating the query), whereas others were omitted, as they co-occurred with the above terms or added few documents to the collection. In addition, some general terms related to the field were investigated, such as “official statistics,”“national statistics,”“public statistics,”“government statistics,”“federal statistics,” and “statistical indicators.”
For the second part of the query, we investigated terms related to policy making, such as “policy,”“decision,”“planning,”“strategy,”“governance,”“monitoring,” and “evaluation.” It turned out that apart from the first one, the remaining terms were either already covered by “policy” and one of the terms from the first part of the query, added few documents to the collection or indicated documents outside of the government decision-making domain (e.g., corporate or individual decision making). In addition, we investigated the institutions involved in public policy making, such as “government,”“ministry,”“agency,” and “authority,” but these also turned out to be either already covered in the pairs of terms from the query or added few documents to the collection. After a thorough investigation, we decided to pursue the principle of parsimony and conducted the search by executing the following (relatively) simple query:
(TS=(“official statistics” OR “national statistics” OR “vital statistics” OR “population projections” OR “unemployment rate” OR “gross domestic product” OR “gdp” OR “inflation” OR “average wage”)) AND (TS=“policy”).
Using this specific combination of search terms reduces the likelihood of including references unrelated to the use of official statistics in government decision making, which is a crucial aspect of our bibliometric and thematic analysis. The first part of the search query is focused on socioeconomic and demographic statistics, which might imply that the analysis is biased toward economic and social policies. However, we investigated numerous representative statistical products outside of the economic and demographic domains as search terms, such as “energy balance,”“energy consumption per capita,”“CO2 emissions per capita,”“recycling rate,”“municipal waste,”“crop yield,”“agricultural area,”“literacy rate,”“education enrollment,”“crime rate,”“building permits,”“urban density,”“passenger transport,”“tourist arrivals,”“cultural participation,” and “internet access,” to point out just a few. Again, these terms turned out to either co-occur with the existing terms from the query or added very few documents to the collection (mostly below 1% and at most 3.2% for the search terms just stated). Nonetheless, we performed the bibliometric analysis by including additional search terms as robustness checks (not shown in the article due to space limitations). It turned out that our findings are qualitatively robust to including additional, much less frequently used official statistics in the query.
Relevant documents were obtained from the WoS website on 16 July 2024. Initially, 28,301 hits were found using the above query. The dataset was cleaned by eliminating all non-English documents and documents with anonymous authors. We also excluded documents published in 2024 to ensure consistency when considering the number of publications per year. We limited our focus to articles and review articles only. Non-peer-reviewed documents, such as books and book chapters, were excluded.
We did not limit our search to specific WoS categories, as official statistics can be used in government decision-making processes in many research areas. The relevant documents are picked up by providing a well-chosen search query instead. We did restrict our search to the Science Citation Index Expanded (SCIE) and Social Sciences Citation Index (SSCI), which were chosen instead of the aggregate collection to optimize recall, precision, and reproducibility (Gusenbauer and Haddaway 2020). Although the WoS Core Collection includes articles published after 1900, we only included articles published after 1960. Based on examining the few indexed articles published before 1960, we believe that data before 1960 is incomplete and could compromise the results. Therefore, we only considered articles published between 1960 and 2023.
After eliminating all documents that could have contributed to inconsistent data, the number of documents was reduced to 20,582, which is our final count. Title, author(s), year of publication, keywords, abstract, citation data, and cited references comprise the extracted information for each article. Table 1 summarizes the main descriptive statistics about the bibliometric dataset. There are 20,582 articles in our collection, published in 2,308 journals, and written by 35,243 authors.
Main Information About the Data.
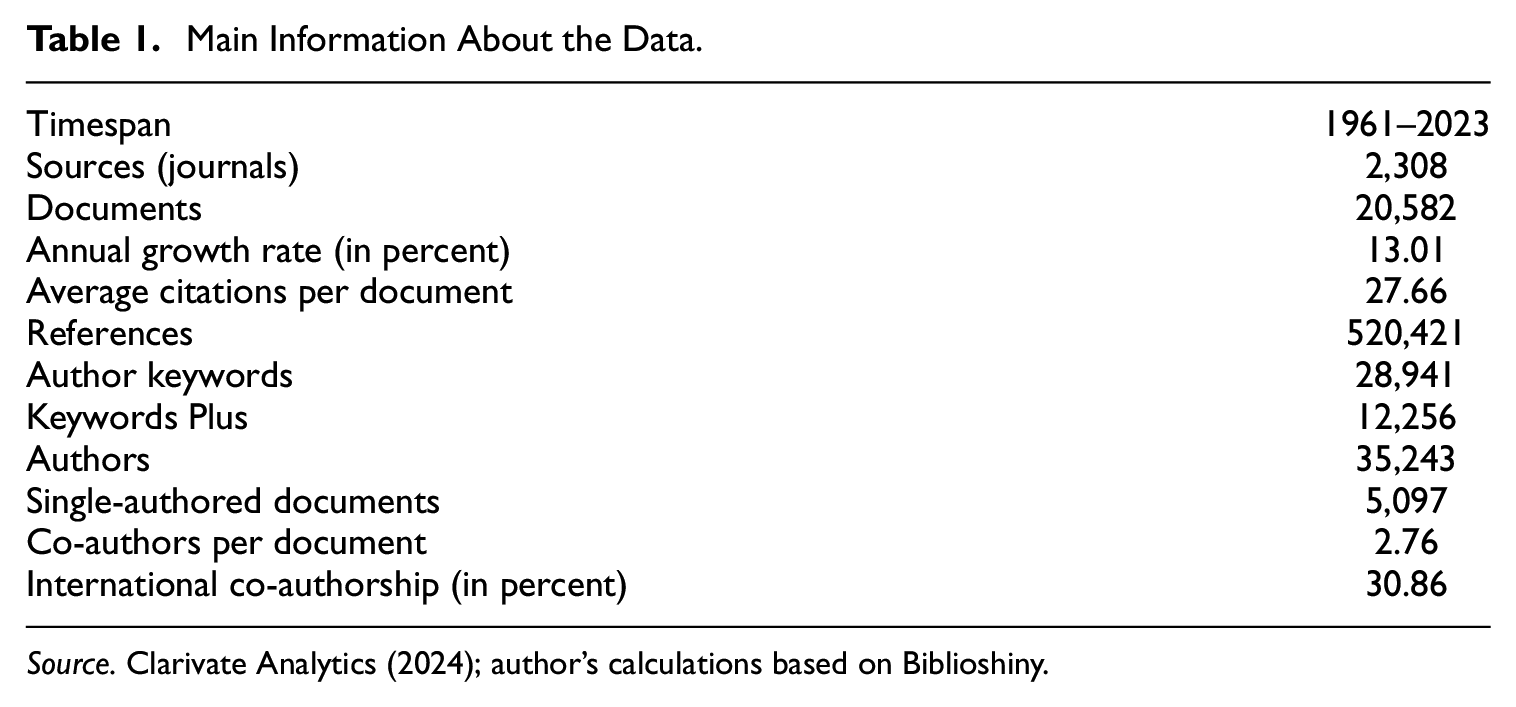
Source.Clarivate Analytics (2024); author’s calculations based on Biblioshiny.
As already emphasized, our search was not limited to specific WoS categories, as government decision making is not limited to a particular research area. This can be determined based on the structure of publications (articles) by WoS categories. As expected for government decision making based on official statistics, economics and finance are indeed the most represented research areas in our collection with 14,468 publications (70.3%). Still, they are followed by environmental studies with 4,219 publications (20.5%), energy research with 1,158 publications (5.6%), sustainable technology with 1,099 publications (5.3%), public health with 719 publications (3.5%), and others.
Comprehensive data analysis was performed by the open-source software R Studio due to its usefulness in statistical computing and graphics. The
3. A Systematic Overview
Figure 2 depicts the scientific production and citation trend related to government decision making based on official statistics over the period 1961 to 2023. The number of new publications grew over this period with an average annual growth rate of 13% (see Table 1). From Figure 2, it is evident that the mass of publications was low until the early 1990s, when the growth of publications started to intensify. This happened largely for two reasons. On the one hand, due to the increasingly widespread use of computers for complex empirical data analysis and exponentially increasing processing power of microprocessors for simulation. On the other hand, due to the emergence of the World Wide Web, there were possibilities it had to offer to researchers, particularly related to online resources and collaboration. The number of new publications in our collection reached 1,968 in 2023.
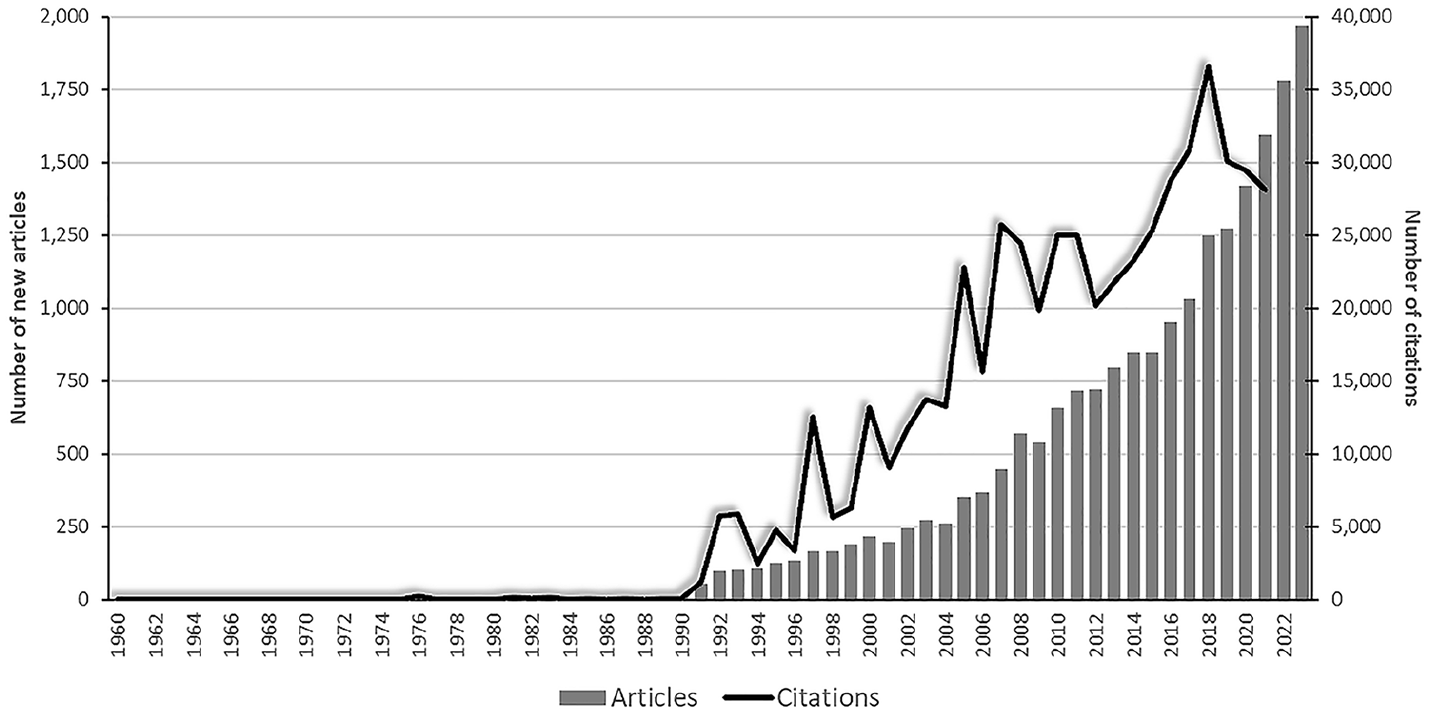
Annual publication and citation trend, 1961 to 2023.
The year-on-year growth rate in the number of publications did not exhibit substantial jumps, except in the years 2005 (36%), 2008 (27%), 2010 (22%), and 2018 (21%). The first jump happened after the Enron scandal (shifts in corporate governance and regulatory decision making after 2001), the Iraq war (widespread analysis of international law and political decision-making processes after 2003), the SARS outbreak (global scrutiny of government responses to pandemics, public health policies, and international collaboration after 2003), and the EU expansion (discussions on governance, integration policies, and decision making within the EU before and after 2004). The second jump occurred after the climate change discussions (the Stern Review in 2006 with an increasing focus on climate change policies) and the Global Financial Crisis (extensive research on economic policies and financial regulation, and government intervention strategies during and after 2007–2008).
The third jump appeared amid the continuation of the Global Financial Crisis and after the US presidential election (Barack Obama’s election in 2008 and the subsequent policy shifts in healthcare and economic stimulus measures). The last jump happened after the Paris Agreement (environmental policy and international collaboration on climate action after 2015), US Presidential election (Donald Trump’s election in 2016 and the subsequent shifts in both domestic and international policies), and the Brexit referendum (widespread study of political decision making, international relations and economic policies after 2016). Interestingly, the Covid-19 pandemic outbreak in 2020 does not appear to have caused a spike in the number of publications related to government decision making based on official statistics in the aftermath, but a steady year-on-year growth rate of 10.5% to 12.5% during 2020 to 2023. This steady growth will likely continue due to rising global economic and geopolitical instability after 2022 (Russia-Ukraine conflict, inflation and economic uncertainty, climate change events, global energy crisis, US presidential election, US-China rivalry, etc.).
The number of total (or global) citations also increased, though at a lower pace and with substantially more volatility (see Figure 1). The mass of citations was low until the early-1990s, when the growth of citations started to intensify and peaked in 2018 with publications published in that year accumulating 36,579 new citations, additionally highlighting the growing interest of the scientific and professional community in government decision making based on official statistics. The number of total citations in our collection reached 569,307 citations cumulatively during 1961 to 2023.
The most frequent keywords based on articles from our collection were (macro)economic, emphasizing monetary economics and policy. The latter include “monetary policy” (1,738 occurrences), “inflation” (1,145 occurrences), “inflation targeting” (459 occurrences), “Taylor rule” (204 occurrences), and “optimal monetary policy” (203 occurrences). Other keywords that were primarily macroeconomic include “economic growth” (857 occurrences), “fiscal policy” (472 occurrences), “unemployment” (257 occurrences), “GDP” (256 occurrences), “Phillips curve” (177 occurrences), and “exchange rate” (158 occurrences). Most frequent author keywords from other areas of government policy making were focused on energy policy (“energy consumption” and “renewable energy”), climate studies (“CO2 emissions” and “climate change”), and public health (“health policy” and “Covid-19”), with “China” also standing out (with as many as 565 occurrences).
Figure 3 presents the trend topics regarding the two most frequent author keywords per year since 2002. As we can see, in the 2000s and early 2010s, monetary topics were predominant among the author keywords. This is expected due to the events that happened in that period, such as the Dot-Com bubble and burst (in the early-2000s), the housing bubble and subprime mortgage crisis (mid- to late-2000s), the Global Financial Crisis (2007–2008), the monetary policy responses to the financial crisis, and regulatory reforms and discussions. In the mid and late 2010s, other government policy topics became more prevalent, such as fiscal policy, economic growth, renewable energy, and climate change. Fiscal policy and economic growth were policy-relevant due to the ongoing recovery efforts (2010–2015) after the Great Recession, Brexit (in 2016), the US Tax cuts and jobs act (in 2017), and the US-China trade war. Renewable energy and climate change were policy-relevant due to the Paris agreement (in 2015), technological advances and cost reductions, increasingly higher frequency of extreme weather events, and subsequent government and corporate commitments.
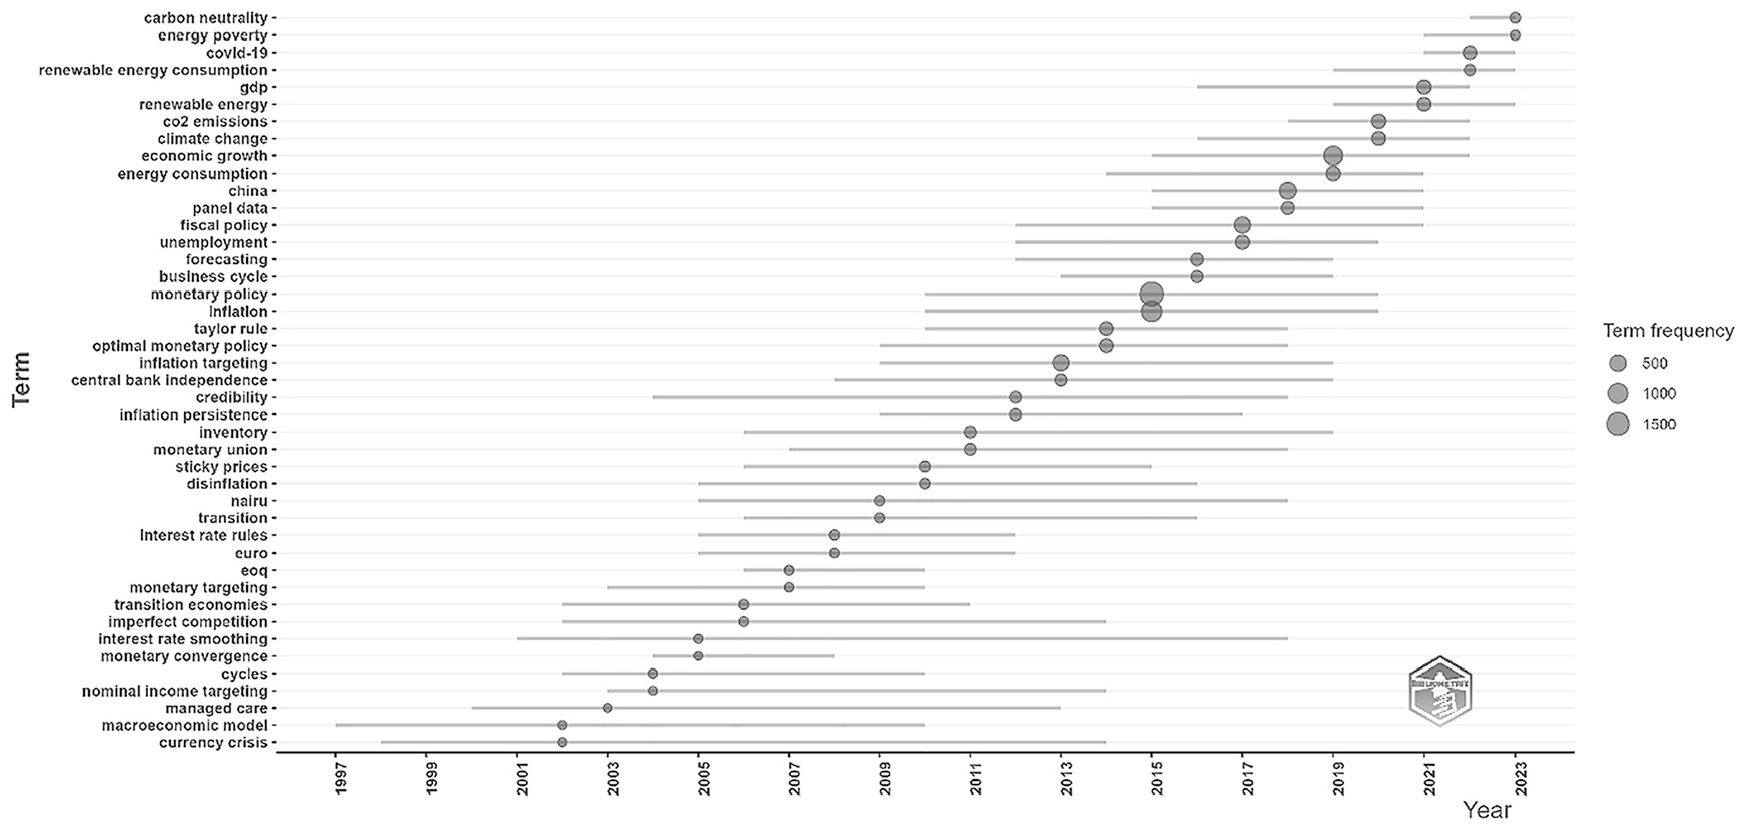
Trend topics in terms of the two most frequent author keywords per year, 2002 to 2023.
To obtain an insight into the current trend topics, we can take a closer look at the most frequent author keywords in the period 2018 to 2023. The latest topics in 2023 include “carbon neutrality,”“green finance,”“geopolitical risk,” and “energy poverty.” In 2022, those were “Covid-19” (the publications peaked two years after the pandemic broke out in 2020), “renewable energy consumption,”“ecological footprint,” and “carbon emission.” Other frequent topics during 2018 to 2023 include “climate change,”“health policy,”“financial development,”“urbanization,” and others. The analysis of trend topics in recent years demonstrates a clear shift in publications from traditional macroeconomic themes to economic, energy, and environmental sustainability, even though fiscal and monetary policies are still very much relevant (e.g., rising inflation and energy prices in 2021 and 2022 or targeted fiscal measures to help the population cope with the subsequent rising cost of living).
Figure 4 displays a keyword co-occurrence network of the fifty most important author keywords in government decision making based on official statistics. The figure shows three separate clusters of keywords, each closely interconnected with the others.
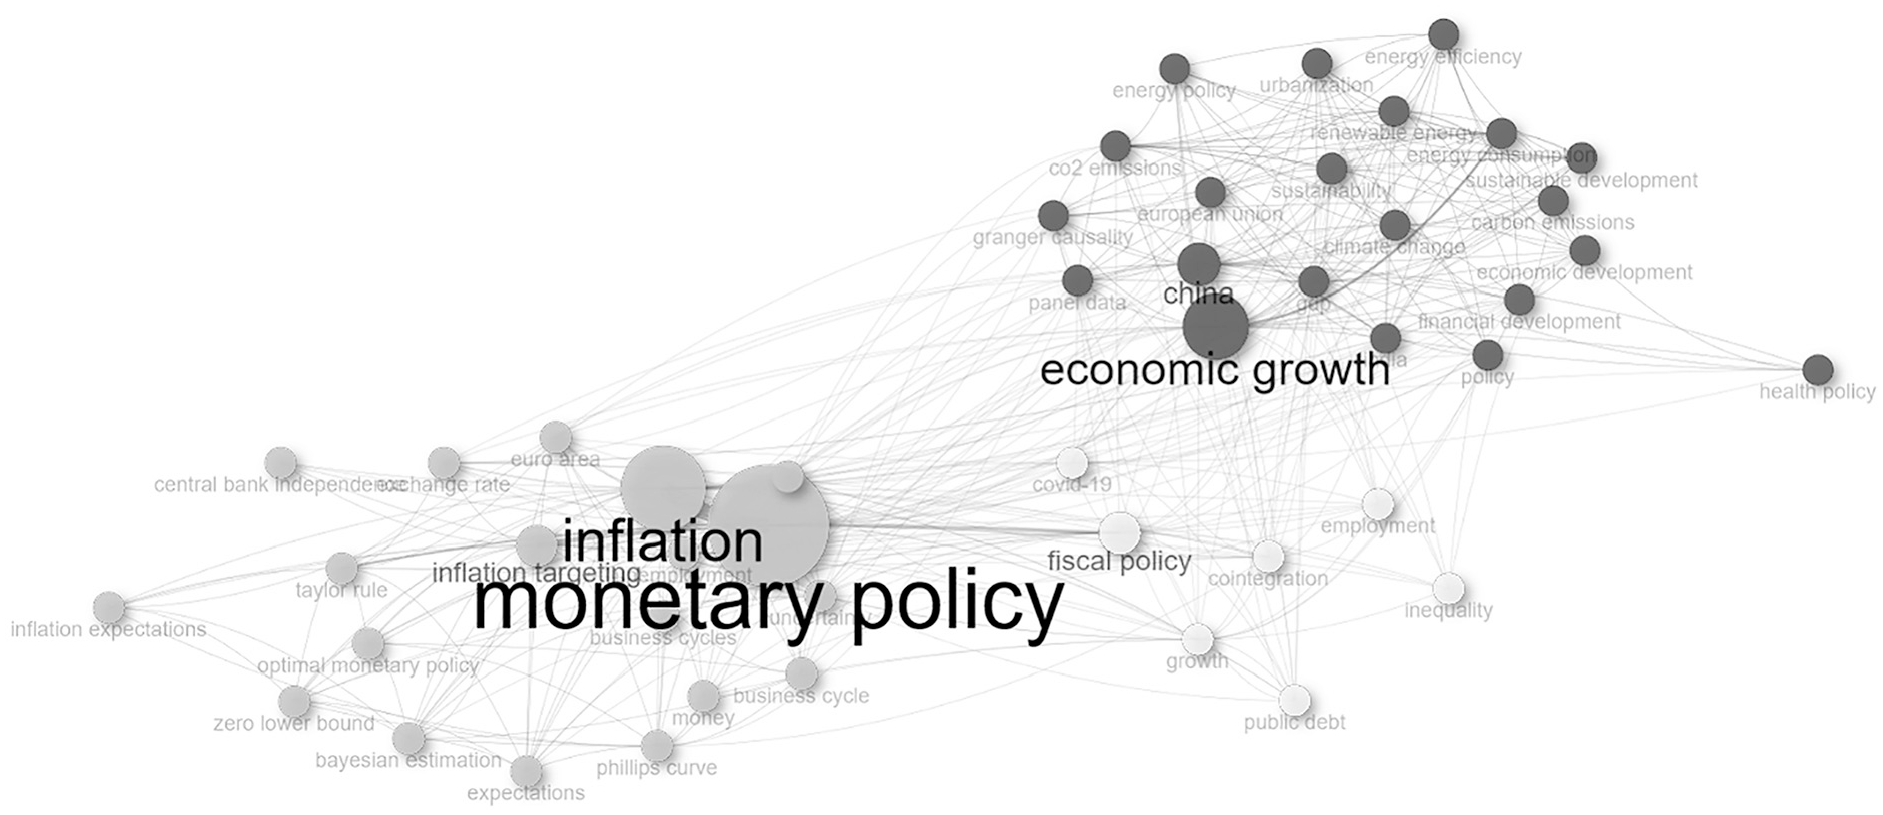
Co-occurrence network of the author keywords in the collection, 1961 to 2023.
The light gray cluster’s topic represents monetary policy, which is also the most frequent keyword of the cluster and the most frequent keyword overall in the collection. Other important keywords in this cluster include typical concepts from monetary economics, such as “inflation,”“inflation targeting,”“inflation expectations,”“money,”“exchange rate,”“Taylor rule,”“Phillips curve,”“business cycle,” and “central bank independence.” The white cluster’s topic represents fiscal policy, which is also the most frequent keyword of the cluster. Other important keywords in this cluster include typical concepts from public finance, such as “public debt,”“employment,”“inequality,” and “Covid-19.” The latter was tightly related to fiscal policy in the period 2020 to 2023 through economic stimulus, direct support, infrastructure funding, debt management, and improving fiscal sustainability.
Finally, the dark gray cluster’s topic represents sustainable policies that affect economic growth, the latter also being the most frequent keyword of the cluster. These development policies concern various ministry portfolios, government competences and research areas, such as energy, environment, urbanization, institutions, and public health. Important keywords in this cluster include “economic development,”“financial development,”“sustainable development,”“energy policy,”“energy efficiency,”“renewable energy,”“CO2 emissions,”“climate change,”“urbanization,”“health policy,” and “China.” The latter is intensely related to development policies that affect economic growth, firstly due to economic reforms, technological innovation, industrial policy, environmental policy, and sustainable development policies within China, but also due to the Belt and Road Initiative and China’s global economic influence.
4. Thematic Analysis
We now proceed with a thematic analysis (Callon et al. 1991) to upgrade our findings on the thematic structure of government decision making based on official statistics, presented in the previous section (trend topics and co-occurrence analysis). We start with time slicing, whereby we divide the time frame of the collection (1961–2023) into sub-periods in a way that they are contextually meaningful and, at the same time, contain a sufficient number of documents for a robust analysis. The entire time frame of the collection was thus divided into the following four sub-periods: 1961 to 1999 (1,256 documents), 2000 to 2009 (3,471 documents), 2010 to 2019 (9,093 documents), and 2020 to 2023 (6,762 documents).
According to the strategic diagram presented in Figure 5, during the period 1961 to 1999, research and policy activity was focused on five themes, with two central themes (motor themes and basic themes), two non-central themes (niche themes and emerging or declining themes), and one intermediary theme. The latter was a methodological theme of increasingly high importance for proper policy research. Namely, “cointegration” refers to consistent and unbiased estimation of long-term stable relationships among non-stationary variables in econometrics (Johansen and Juselius 1990). The two central themes were “monetary policy” (with concerns about inflation and unemployment) and “policy credibility.” The thematic analysis identified “economic growth” and “China” as non-central themes.
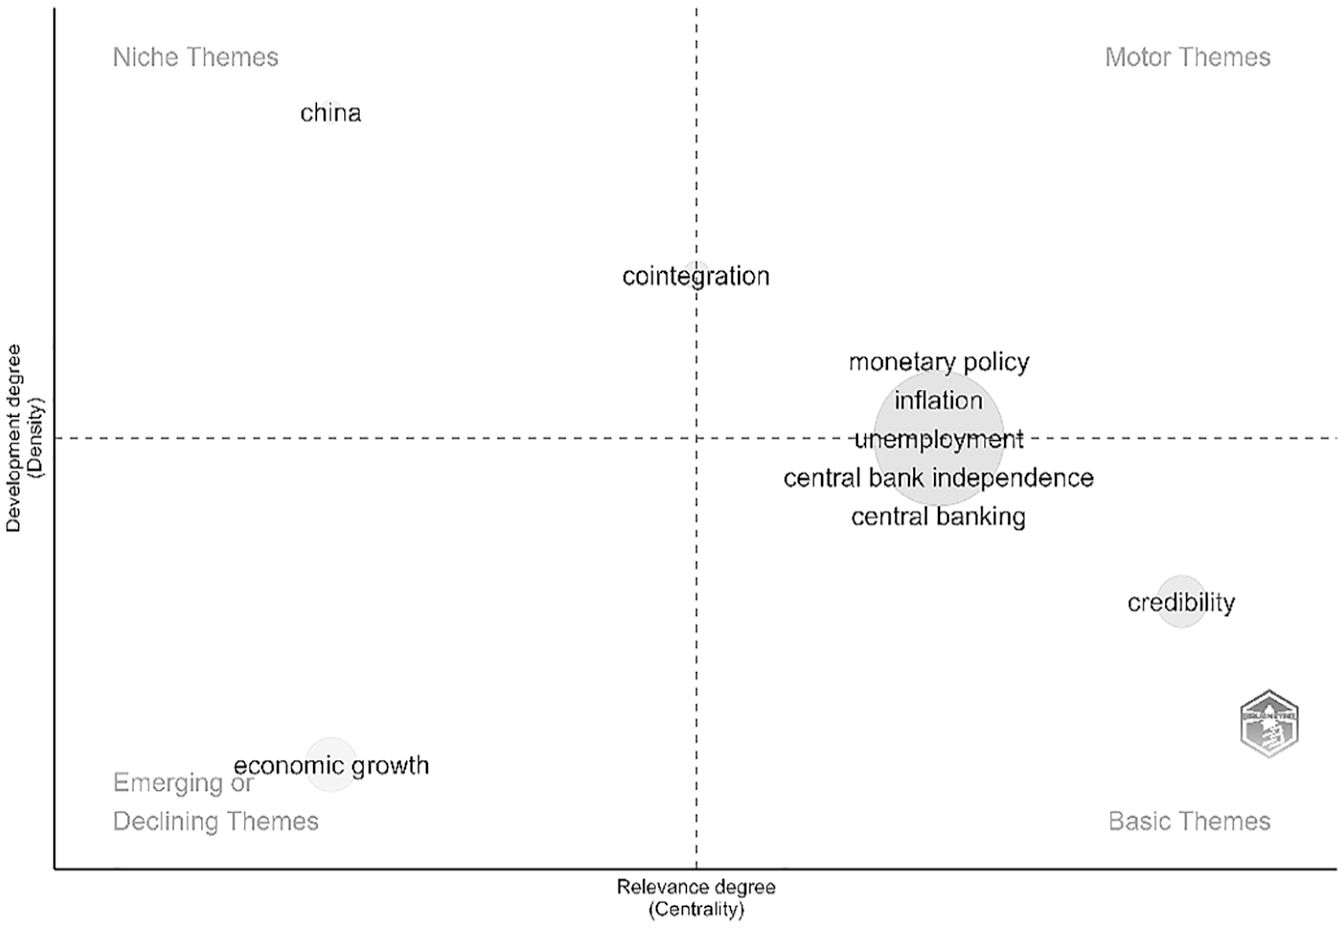
Strategic map based on author keywords, 1961 to 1999.
“Policy credibility” was a basic theme (important, but still in development), referring to the need for credible, rules-based policies to avoid the negative effects of time inconsistency (Kydland and Prescott 1977), especially in monetary policy (Barro and Gordon 1983). “Monetary policy” was at the intersection between basic themes and motor themes, that is, a theme that is important and is becoming well-developed. The two themes were thus closely related and marked by significant global developments from 1961 to 1999. The 1970s saw widespread inflation due to oil shocks, with many countries struggling due to a lack of credible policies. This inflation developed into stagflation, where high inflation and unemployment coexisted, exposing the limitations of existing monetary policies (Clarida et al. 2000). The 1980s brought the Volcker shock, where aggressive monetary tightening in the US set a global precedent for prioritizing inflation control (Taylor 1993). Nations like the UK, Germany, and Japan adopted more credible, rules-based monetary policies to combat inflation. The 1990s marked a global shift toward central bank independence (Rogoff 1985), helping secure low and stable inflation across various economies and contributing to the Great Moderation.
“Economic growth” was emerging in some aspects, but also increasingly developed research and important policy themes. The post-war boom of the 1960s, followed by the challenges of the 1970s, like oil shocks and stagflation, spurred a focus on balancing stability with growth (Alesina and Roubini 1992; Barro and Gordon 1983). The 1980s emphasized market-oriented reforms and globalization to drive growth, while the 1990s saw rapid development in emerging markets and the rise of sustainable growth discussions. Overall, economic growth remained a dynamic and evolving priority throughout this period. “China,” on the other hand, was largely a niche policy theme during this period. The country was initially isolated due to inward-focused policies and the Cultural revolution, with minimal participation in international economic systems (Knight 2003). Even as China began opening up with economic reforms under Deng Xiaoping in the late 1970s, its global importance remained limited compared to dominant issues, like the Cold War and international trade. It was not until the 1990s that China started to emerge as a significant global policy theme (Branstetter and Lardy 2008).
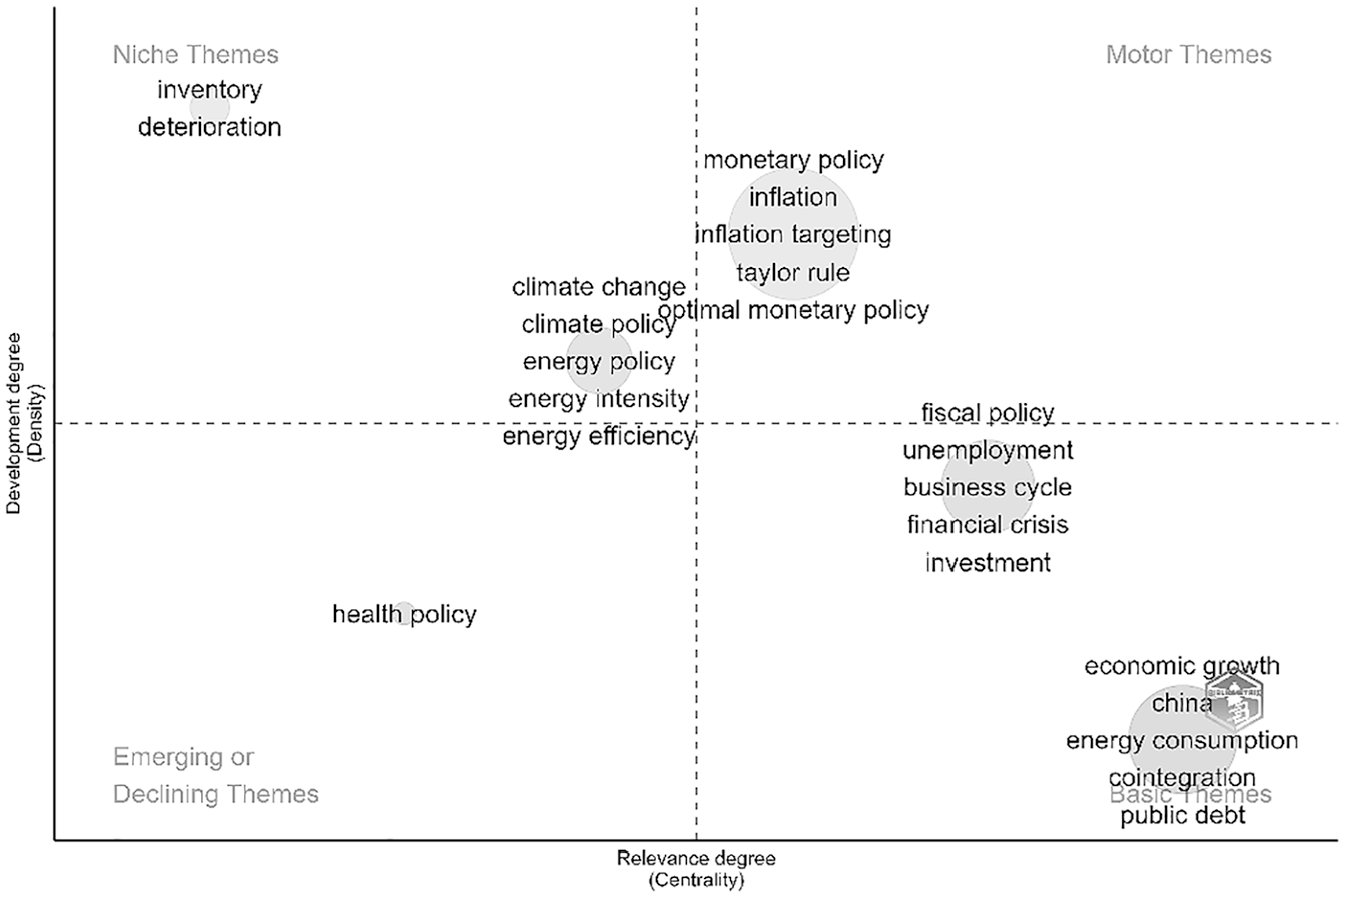
During the period 2000 to 2009, research and policy activity focused on six themes, with three central themes and three non-central themes (see Figure 6). The monetary policy theme has matured substantially as a research area and separated into two clusters: “monetary policy” and “optimal monetary policy.”“Monetary policy” was still at the intersection between basic and motor themes, whereas “optimal monetary policy” has become a motor theme.
Strategic map based on author keywords, 2000 to 2009.
The “optimal monetary policy” theme focused more on the theoretical underpinnings of monetary policy, emphasizing the design of optimal policy rules within frameworks that consider nominal rigidities, such as sticky prices, and the role of expectations and learning in economic behavior (Bils and Klenow 2004; Mankiw and Reis 2002). This theme is closely tied to advanced modeling techniques, exploring how central banks can manage inflation and output in the presence of these frictions. In contrast, the “monetary policy” theme was more empirical and policy-oriented, centered around the practical implementation of inflation targeting, the empirical relationship between inflation and unemployment, as described by the Phillips curve, and the coordination between monetary and fiscal policies (Cogley and Sbordone 2008). This latter theme is more concerned with real-world applications and the effectiveness of policy frameworks in achieving macroeconomic stability.
The “economic growth” theme has become a basic theme during this period, focusing on understanding how fluctuations in economic growth impacted labor market outcomes, particularly job creation and unemployment rates (Gertler and Trigari 2009). Academic research in this area often explored the extent to which robust economic growth translated into increased employment, with particular attention to the elasticity of employment with respect to growth and the impact of structural changes in the economy (Ball et al. 2013). The Global Financial Crisis of 2008 to 2009 highlighted the fragility of this relationship, as many economies experienced sharp declines in employment despite earlier periods of growth, prompting a deeper examination of the factors that influence the sustainability of growth-driven employment gains (Reinhart and Rogoff 2009). China was becoming central to this research due to its rapid economic expansion and significant role in driving global economic growth, influencing global trade dynamics, and affecting employment patterns in both developed and developing economies (Branstetter and Lardy 2008).
The two niche themes during this period were “energy policy” and “climate change,” with energy consumption also appearing as a keyword in the “economic growth” cluster. Energy policy research was closely linked to environmental and climate studies as well as economic growth, driven by the urgent need to address climate change and ensure sustainable development (Stern 2007). Researchers focused on the impact of energy consumption on greenhouse gas emissions and environmental degradation, exploring renewable energy sources and energy efficiency as key strategies for reducing carbon footprint, while supporting economic growth (Ozturk 2010; Sovacool and Brown 2009). The “green growth” concept emerged, advocating for economic development that aligns with environmental sustainability (OECD 2011). The thematic analysis also identified “inventory” as a non-central theme—an emerging and increasingly important research and policy theme, driven by advancements in supply chain management, globalization, and the need for efficiency amidst economic volatility (see e.g., Huang 2003), particularly highlighted during the Global Financial Crisis.
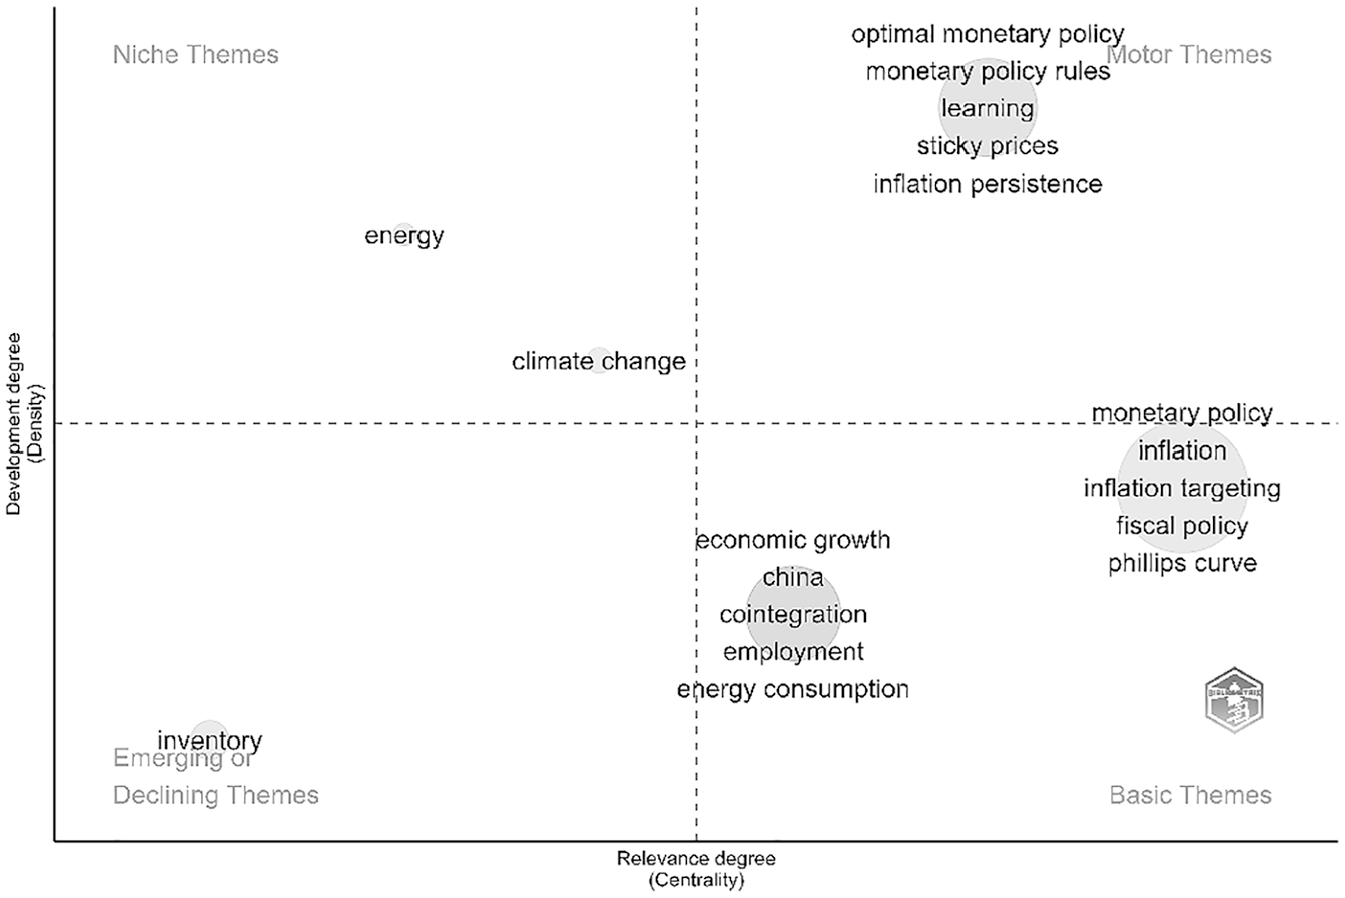
During the period 2010 to 2019, research and policy activity was again focused on six themes, with three central themes and three non-central themes (see Figure 7). The “economic growth” theme was still a basic theme, but with even more relevance during this decade. “Fiscal policy” emerged as another basic theme, close to becoming a motor theme. This happened due to the interconnected challenges faced by both developed and developing economies in the aftermath of the 2008 financial crisis (Eberhardt and Presbitero 2015). Countries worldwide grappled with slow recovery and sought to stimulate economic growth and employment through fiscal policies, leading to increased public debt levels (Ramey 2019). Simultaneously, energy consumption became a critical issue as global demand for energy continued to rise, driven by economic expansion, population growth, and urbanization (Ahmad and Zhang 2020).
Strategic map based on author keywords, 2010 to 2019.
This period also saw heightened awareness of the environmental impact of energy consumption, pushing for a global transition toward cleaner and more sustainable energy sources (Xue et al. 2022). The interplay between striving for economic growth, managing escalating public debt, and addressing the environmental and economic implications of energy consumption shaped global economic and policy discussions during this decade. China has become central to this research due to its rapid economic growth, substantial public debt accumulation, and significant global energy consumption (Piovani 2016), making it a key driver of global economic and environmental trends. “Monetary policy” was a motor theme during this decade, as the central banks globally used unprecedented monetary easing, including low interest rates and quantitative easing, to support economic recovery and stabilize financial markets in the aftermath of the 2008 financial crisis (Bernanke 2020; Cukierman 2019).
The topics related to energy policy and climate change were identified as one niche theme during this period, which was becoming crucial, as the global efforts intensified to transition to sustainable energy sources and mitigate the impacts of climate change, driven by growing awareness of environmental risks and the commitments made under the Paris Agreement (Nordhaus 2013). The “inventory” theme has become a developed niche theme during this decade, whereas the thematic analysis revealed “health policy” as an emerging policy theme. The latter was driven by the push for universal health coverage (Ottersen and Norheim 2014), the growing burden of non-communicable diseases, and the response to infectious disease outbreaks like Ebola and Zika (Gostin and Friedman 2014). The period saw increased international focus on strengthening health systems and global health security, setting the stage for future challenges, such as the Covid-19 pandemic.
Finally, during the period 2020 to 2023, academic research and policy activity focused on three themes (see Figure 8). The “economic growth” theme has developed and is now at the intersection of basic and motor themes. During this period, economic growth was heavily impacted by the Covid-19 pandemic, with global economies experiencing sharp contractions followed by uneven recoveries (Highkin and Van Leemput 2022). In the wake of the pandemic, many countries placed a renewed emphasis on renewable energy as part of stimulus measures aimed at driving sustainable growth (Mirziyoyeva and Salahodjaev 2023). China’s significant role in both economic recovery and renewable energy investment was central, as it continued to be the world’s largest emitter of CO2, while also leading in the deployment of solar and wind power (Zhang et al. 2023). This period saw a global push to balance economic growth with climate goals, with China at the crossroads of high emissions and green energy innovation.
Strategic map based on author keywords, 2020 to 2023.
“Monetary policy” is by now a highly developed theme, with somewhat decreased relevance compared to the previous period due to the dominance of extraordinary fiscal measures in response to the Covid-19 pandemic, limited room for further monetary easing, and the need to address supply-side shocks and inflation through non-monetary tools (Banerjee et al. 2023; Nersisyan and Wray 2024). Monetary policy became more relevant again toward the end of 2020 to 2023, when inflation became a significant concern, and central banks raised interest rates to combat rising prices (Bonam et al. 2024).
The third, “health policy” theme is still identified as an emerging policy theme during this period, which was dominated by the Covid-19 pandemic. The latter profoundly shaped decision-making and resource allocation (Antioch 2024). Health economics played a critical role in evaluating the cost-effectiveness of various pandemic responses, including lockdowns, vaccination campaigns, and healthcare resource management. Governments globally had to balance economic constraints with the urgent need to control the virus, leading to intense debates on the cost-effectiveness of different healthcare measures, such as testing, quarantine measures, and mass vaccination programs (Izadi et al. 2023). This period also highlighted the need for sustainable investments in public health systems to enhance resilience against future health crises (Gupta 2023).
5. Most Relevant Authors, Journals, and Articles
The top two most locally cited authors are Jordi Galí and Mark Gertler, with 1,860 and 1,786 local citations, respectively. They have published articles on monetary policy, inflation, and business cycles, but also on fiscal policy and monetary integration. The next two most locally cited authors already have somewhat fewer local citations: Richard H. Clarida has 1,445 citations, whereas Lars E. O. Svensson has 1,411 citations. The former has published articles on monetary policy rules and macroeconomic stability, whereas the latter has written extensively on inflation targeting in particular. The most influential authors are all currently active, well-known, and respected names in academia and policy. One can also observe that they primarily conduct academic research and provide policy advice in the field of economics and economic policy, with a heavy emphasis on monetary economics and policy.
Another aspect of the authors’ relevance is their co-citation network, which maps the relationships between authors based on how frequently their works are cited together in scholarly publications. As can be seen from Figure 9, in our case, the co-citation network consists of three separate clusters of the most frequently co-cited authors and some “separate” nodes, each closely interconnected with the others.
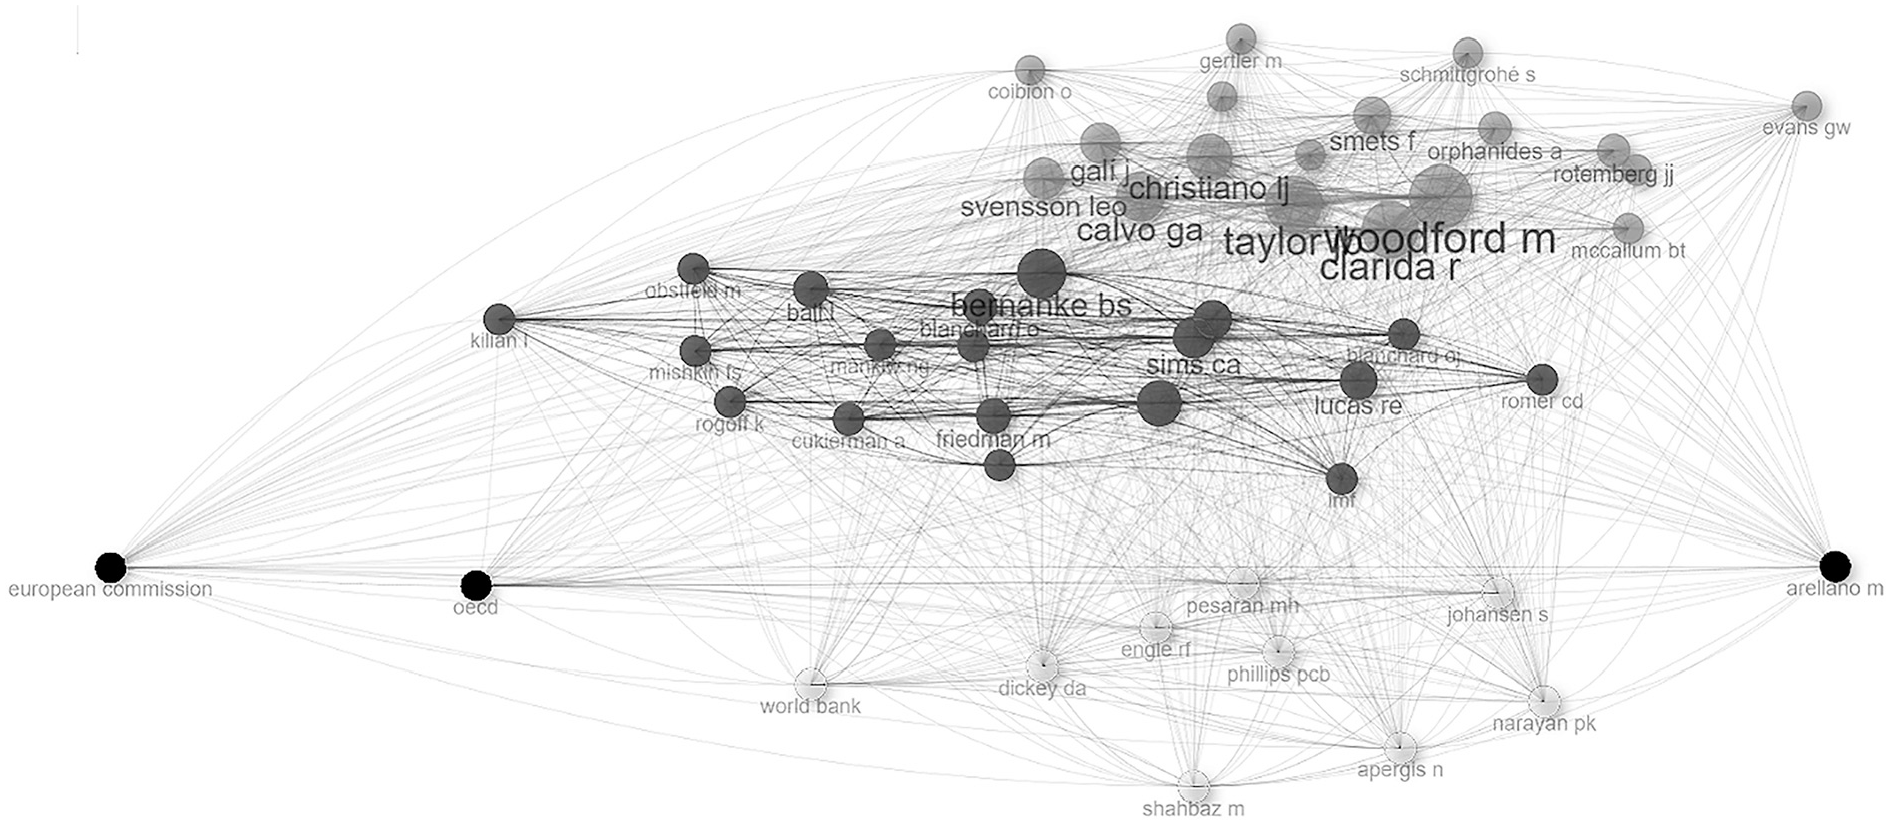
Co-citation network of authors in the collection, 1961 to 2023.
The light gray cluster represents authors who are focused on monetary economics and policy. We already identified some of the most influential ones from our collection, such as Clarida, Gertler, Svensson, and Galí. The dark gray cluster represents authors that are more focused on other macroeconomic aspects of the economy, such as fiscal policy or labor market, even though they may still address issues that are monetary in nature. These authors include (but are not limited to) Robert E. Lucas, Christopher A. Sims, Ben S. Bernanke, Olivier Blanchard, Robert J. Barro, Kenneth S. Rogoff, N. Gregory Mankiw, and Alberto Alesina.
The white cluster represents authors who provided important methodological contributions on top of their empirical and policy research. These include Søren Johansen (known for his cointegration approach), M. Hashem Pesaran (known for his contributions to time series and panel data econometrics), and David A. Dickey and Peter C. B. Phillips (both known for their unit root testing approaches). The black node representing Manuel Arellano (known for his dynamic panel data estimation approach) also belongs to this category. Again, all these names are well-known and respected in academia and policy. The other two black nodes, the European Commission and the OECD, represent major international institutions that produce vast research and policy output. Two additional such institutions are the International Monetary Fund and the World Bank, located in the blue and red clusters, respectively.
The top two most locally cited journals are the American Economic Review (with 26,252 citations) and the Journal of Monetary Economics (with 23,686 citations). The next most locally cited journals already have substantially fewer local citations: Energy Policy with 14,493 citations, Journal of Money, Credit and Banking with 12,801 citations, Econometrica with 12,252 citations, Journal of Political Economy with 11,906 citations, Quarterly Journal of Economics with 11,240 citations, and Energy Economics with 10,966 citations. These journals are among the most renowned and respected in economics and economic policy. The rankings change in the case of M-index. Environmental Science and Pollution Research now ranks first (with an index of 4.13), Journal of Cleaner Production ranks second (with an index of 2.81), and Renewable and Sustainable Energy Reviews ranks third (with an index of 2.57). We can thus observe a clear shift to energy and environmental studies and policy, when considering some additional indicators.
Another aspect of the journals’ relevance is their co-citation network, which maps the relationships between journals based on how frequently their works are cited together. As can be seen from Figure 10, in our case, the co-citation network consists of three separate clusters of the most frequently co-cited journals, each closely interconnected with the others.
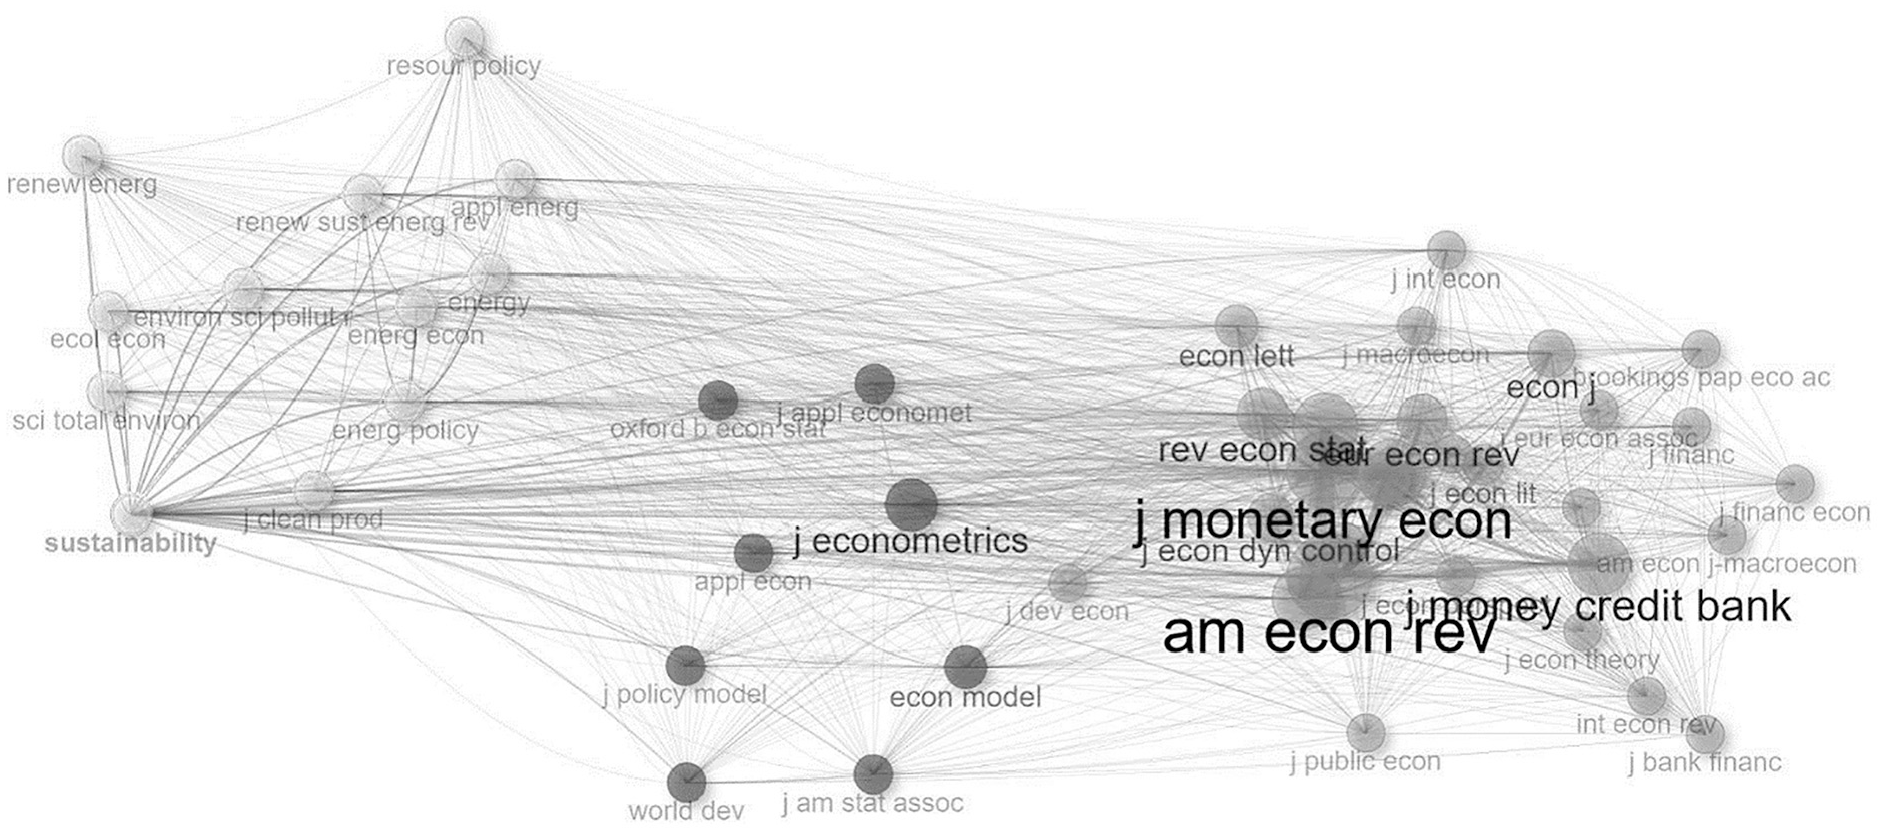
Co-citation network of journals in the collection, 1961 to 2023.
The light gray cluster represents journals that publish articles in economics and finance. Key journals from this cluster are the American Economic Review, Journal of Monetary Economics, Quarterly Journal of Economics, Journal of Money, Credit and Banking, Review of Economic Studies, Review of Economics and Statistics, European Economic Review, and the Economic Journal. The white cluster represents journals that publish articles in energy and environmental studies and policy. Key journals from this cluster include Energy Policy, Energy Economics, Energy, Journal of Cleaner Production, Renewable and Sustainable Energy Reviews, Ecological Economics, Environmental Science and Pollution Research, and Sustainability. Lastly, the dark gray cluster focuses on journals that publish methodological contributions on top of empirical and policy research. Key journals from this cluster are the Journal of Econometrics, Economic Modelling, Journal of Applied Econometrics, Oxford Bulletin of Economics and Statistics, Journal of the American Statistical Association, and the Journal of Policy Modeling.
Out of the fifty most influential articles based on the number of local citations, as many as thirty-five were focused either entirely or at least primarily on monetary policy. An additional six articles investigated inflation as such, and an additional three articles investigated consumer prices of goods and services (their structure and dynamics). This confirms our earlier findings about the prevalence of monetary economics and policy in terms of citation in the field of government decision making based on official statistics. The key underlying variable of these studies is inflation, which is calculated based on either the consumer price index, core consumer price index, producer price index, or GDP deflator. The remaining six most influential articles based on the number of local citations focused on fiscal policy, macroeconomic dynamics and business cycles, and energy policy. Out of the top ten most influential articles based on the number of local citations, as many as nine are focused either entirely or at least primarily on monetary policy. They all employ macro-level time series data. Besides inflation as the inevitable key variable calculated based on prices, they also include other official data, such as the gross domestic product (necessary as a measure of output and for calculating the output gap), unemployment rate, wages, consumption, and investment.
6. Most Productive Organizations
Finally, let us address the most productive organizations that use official statistics for academic research and policy advice in the government policy-making processes. Authors’ affiliations in the articles serve to identify these organizations. The Federal Reserve and the University of London are the two most represented organizations, with 799 (7.3%) and 730 articles (6.7%), respectively. Lagging behind, the European Central Bank follows with 550 articles (5.0%), the University of California with 487 articles (4.4%), the Chinese Academy of Sciences with 444 articles (4.0%), the National Bureau of Economic Research with 410 articles (3.7%), the International Monetary Fund with 369 articles (3.4%), and the Harvard University with 314 articles (2.9% of the articles).
Figure 11 depicts the evolution of the five most productive organizations according to the number of publications over time. As we can observe, the growth in the number of articles started in the early 1990s. It has been relatively gradual since then for some organizations, such as the Federal Reserve, the European Central Bank, and the University of California, but much steeper for others, such as the University of London (since the late 2000s) and the Chinese Academy of Sciences (since early 2010s). The latter two organizations are en route to first and fourth place, respectively, in the very near future (see Figure 11).
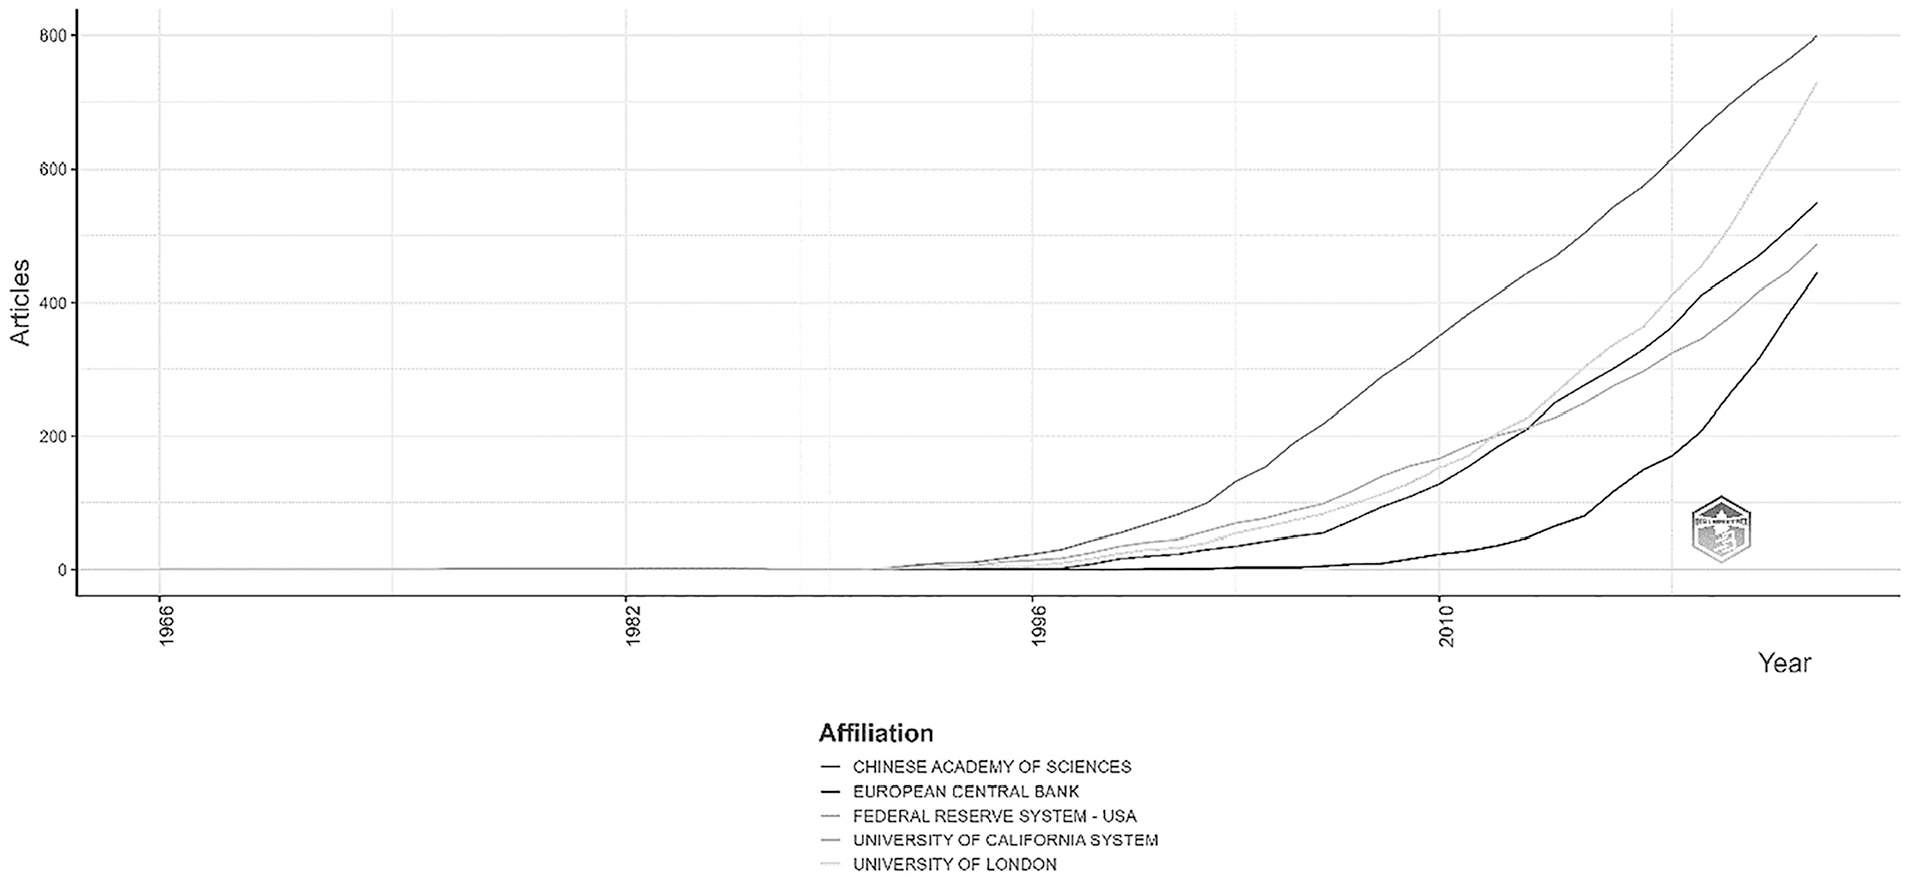
Cumulative publication growth of the most productive organizations, 1961 to 2023.
During the period 2000 to 2023, the authors affiliated with the Federal Reserve emphasize its evolving role in steering monetary policy, especially during economic crises. Articles discuss how the Fed’s decisions during events such as the 2007 to 2009 financial crisis and the Covid-19 pandemic involved unprecedented measures, such as near-zero interest rates, quantitative easing, and emergency lending, aimed at stabilizing the economy while sparking debates over inflation and long-term financial risk. Additionally, authors highlight the tension between its legally enshrined independence and the growing need for transparency and accountability in an era of rapid policy shifts and heightened public scrutiny.
Authors affiliated with the University of London have produced influential academic research in economic and social policy, addressing issues of wealth and income inequality, development economics, and the impact of globalization on welfare systems. Their contributions also span global health policy and environmental economics, most notably exemplified by the landmark Stern Review on climate change, which has shaped international debates on sustainable development and carbon pricing. Additionally, interdisciplinary studies on education and international governance have further enriched the policy discourse emerging from the University’s diverse academic community.
Authors affiliated with the European Central Bank have concentrated on monetary policy decision-making within a multi-national currency union, investigating the transmission mechanisms of policy rates, the implementation of quantitative easing, and the challenges of negative interest rate policies in a low-inflation environment. Their work during the Eurozone sovereign debt crisis has provided critical insights into the dynamics of sovereign debt, systemic risk, and macroprudential regulation, while recent studies have begun to explore emerging issues such as climate-related financial risks and the potential implications of digital currencies for monetary policy.
Authors across the University of California system have made significant contributions to policy research in areas such as environmental sustainability, economic inequality, and health policy. Their work has been instrumental in advancing our understanding of climate change impacts and renewable energy innovation, reflecting California’s progressive environmental agenda, while also shedding light on fiscal challenges and the social consequences of declining state funding in higher education. Additionally, these scholars have influenced public health and technology policy through empirical studies on topics ranging from pandemic response to digital innovation, consistently emphasizing evidence-based solutions for complex policy issues.
Publications authored by researchers affiliated with the Chinese Academy of Sciences have played a pivotal role in shaping China’s science and technology policy as well as its environmental and sustainability strategies. These studies have documented the transformation of research capacity through initiatives like the Knowledge Innovation Program, analyzed the efficacy of state-led innovation in high-tech industries, and provided critical assessments of air and water pollution and climate change. Moreover, these researchers have contributed to national advisory roles and the formulation of policies aimed at enhancing indigenous innovation, bridging fundamental scientific research with strategic industrial development and environmental conservation.
Another aspect of the organizations’ relevance in the field is their collaboration network, used to visualize and study the relationships between different organizations based on their scholarly output and co-authorships across publications. This approach is particularly useful in understanding the dynamics of intranational and international scientific and policy cooperation, the flow of knowledge, and the connectivity of the local and global research community. As can be seen from Figure 12, in our case, the collaboration network consists of three separate clusters of organizations. Each of those clusters is closely interconnected within and with the other clusters. This demonstrates the close collaboration of the organizations that use official statistics for academic research and policy advice in the government policy-making processes. Let us take a closer look at the clusters.
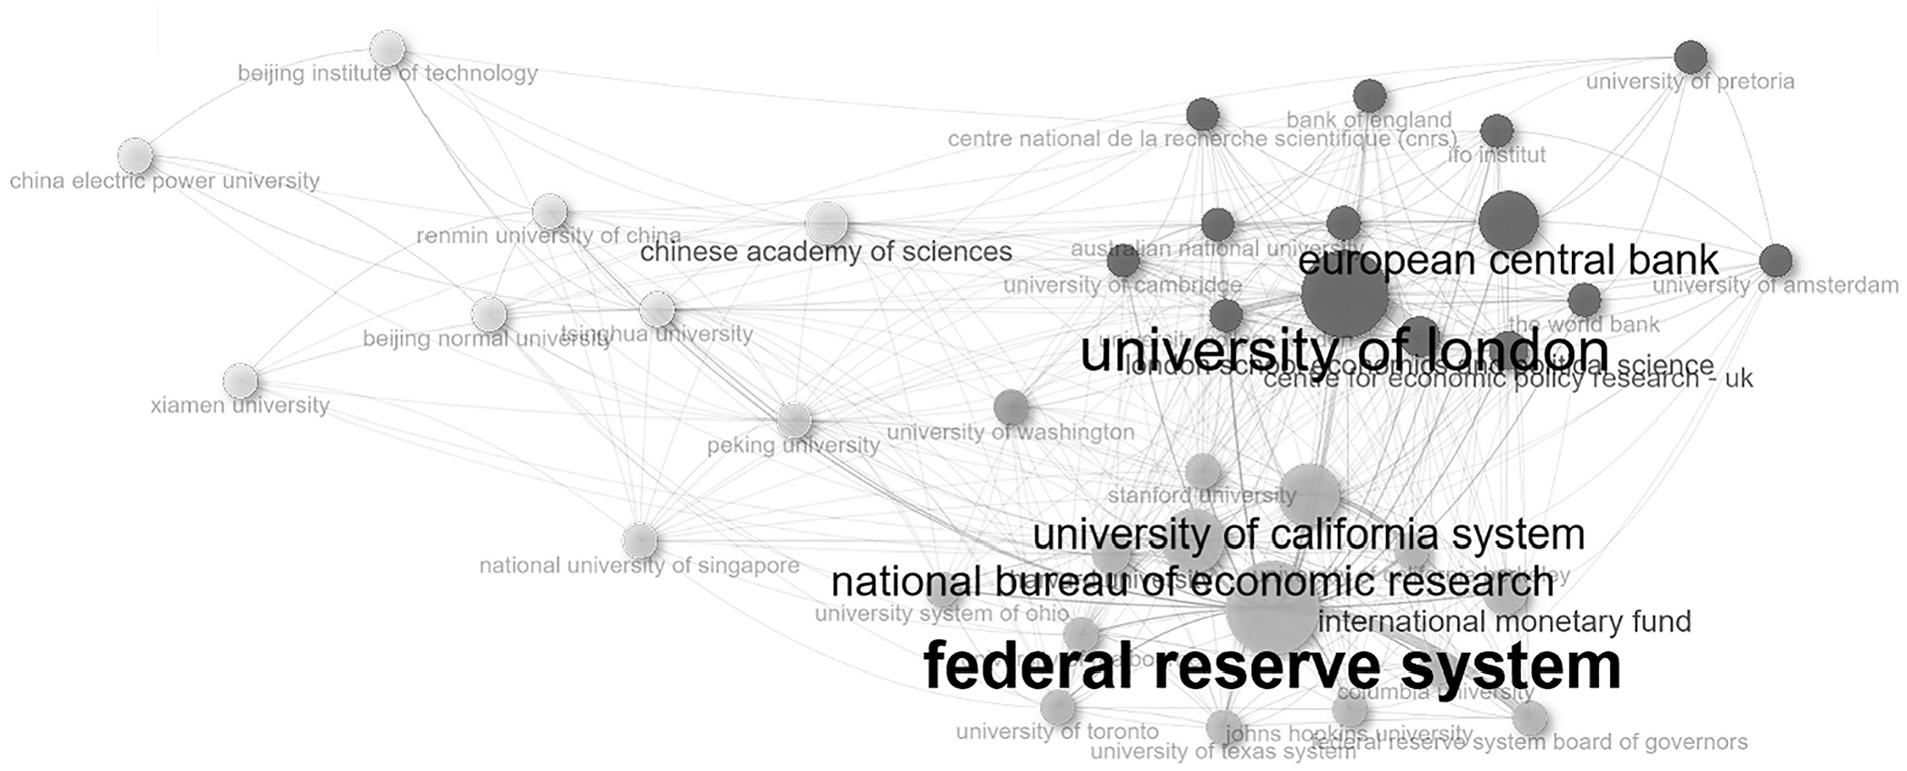
Collaboration network of organizations in the collection, 1961 to 2023.
The dark gray cluster represents mostly European organizations, such as the University of London, the European Central Bank, the Centre for Economic Policy Research, the University of Oxford, the London School of Economics and Political Science, Centre national de la recherche scientifique, and the Ifo Institut. The light gray cluster represents organizations located in the USA, such as the Federal Reserve, the University of California, the National Bureau of Economic Research, Harvard University, Stanford University, the University of Washington, and the International Monetary Fund. The white cluster represents mostly Chinese organizations, such as the Tsinghua University, the Renmin University of China, the Beijing Normal University, the Peking University, and the Chinese Academy of Sciences.
7. Concluding Remarks
In this article, we provided the first systematic overview of the existing academic research involving official statistics and government decision making by focusing on publications that use official statistical data and provide policy conclusions and advice that were used or could be used by public decision makers. The bibliometric methodology enabled us to objectively present the development of this research area in a historical context. While there were empirical studies on government decision making based on official statistics throughout the twentieth century, academic research in this area was limited until the early 1990s, when scientific and policy productivity started to intensify with the increasingly widespread use of computers for complex empirical data analysis and simulation. Various geopolitical, economic, financial, health, and environmental events and processes stimulated government policy-related research over the last thirty years. This steady growth in productivity is likely to continue, in part due to rising global economic and geopolitical instability in recent years and partly due to further expansion of academia and research globalization.
Even though we did not limit our investigation to any specific research area, it turned out that the most frequently studied phenomena were economic, more specifically macroeconomic, such as inflation (prices), unemployment rate, exchange rate, gross domestic product, and economic growth. The Global Financial Crisis and the Great Recession had a lot to do with this, but were not the only causes. The finding is robust to including additional, much less frequently used official statistics in the search query, as the included ones will co-occur. The co-occurrence analysis of keywords revealed three topics that were at the forefront of government policy making: monetary policy, fiscal policy, and sustainable policies that affect economic growth. The latter mostly include topics related to energy and environmental policy, as well as public health. The trending topics nowadays focus on sustainability issues, with an increasing importance of China and geopolitical risk.
The thematic analysis confirmed these findings, with several major identified themes dynamically evolving throughout the analyzed period. Monetary policy has constantly been a vastly relevant, central theme that has highly developed over the decades. Economic growth gained relevance over the second half of the twentieth century and has become a central, developed theme since then. Fiscal policy has been effective in tandem with monetary policy throughout this time, though it revealed itself as a separate, central theme in the 2010s, focused on recovery efforts after the Great Recession. Energy policy and climate change emerged as niche policy themes in the late 1990s, but have gained substantial relevance since. Health policy appeared as an emerging policy theme in the early 2000s, and has been dominated by the Covid-19 pandemic in the early 2020s. China was largely a niche policy theme until the 1990s, but developed into a central theme with respect to economic growth during the 2000s, and with respect to energy policy and climate change during the 2010s.
The co-citation analysis of authors revealed three groups of authors: those focused on monetary policy, those focused on other macroeconomic aspects, such as fiscal policy or labor market, and those that provide important methodological contributions. However, the most influential authors in terms of citation were primarily conducting academic research in monetary policy. The co-citation analysis of journals also revealed three groups of journals: those that publish articles in economics and finance, those that publish energy and environmental studies, and those that publish methodological contributions. Journals from these three research areas were also the most influential in terms of citation. The collaboration analysis of organizations revealed three groups of organizations: mostly European organizations, organizations located in the USA, and Chinese organizations. The Federal Reserve and the University of London were the two most productive organizations.
Our findings provide answers to the three research questions from the Introduction. Firstly, the use of official statistics data is more prevalent and has a greater impact on monetary policy research compared to other areas of policy making. Namely, our thematic analysis indicates that monetary policy has consistently emerged as a profoundly significant and central theme, evolving substantially over the decades. This is attributable to the direct and immediate economic influence of monetary decisions, and the high standards for data accuracy, timeliness, and transparency required for effective implementation and public accountability. Co-citation analysis of authors also revealed a large and prolific group of authors focused on monetary policy, many of whom have been among the most respected and influential researchers in terms of citation.
Secondly, we have observed a gradual transition from academic research on traditional policy topics, such as inflation, employment and economic growth, toward research on sustainability topics, such as renewable energy, carbon neutrality, green finance, and energy poverty. Some of these topics emerged as niche policy themes in the late 1990s, but have developed substantially and have become prevalent in the late 2010s, especially since 2019. The co-citation analysis of journals revealed a distinct group of journals that publish energy and environmental studies. These have become highly ranked in terms of influence over the years. Our findings are in line with broader global trends in societal, economic, and environmental priorities, such as global environmental concerns, shifts in the policy maker focus, technological advances, and shifts in investment practices toward sustainability.
Thirdly, we found ample evidence that China is becoming one of the most important sources of academic policy research domestically and globally. Namely, China became a prominent topic in the 2000s and 2010s as an emerging global power, especially in academic research and policy making related to economic growth, energy and climate change. In the co-occurrence network of keywords, it is part of the group representing sustainable policies that affect economic growth. In addition, in the collaboration network of organizations, one whole group is dedicated to Chinese organizations.
Our bibliometric analysis implies a mutual relationship between the official statistics authorities and the research and policy community. For those responsible for official statistics, our research demonstrates that their efforts to update contents through statistical plans regularly and to meet the unexpected needs that arise, such as for example, the need to measure the effects of the Covid-19 pandemic, are reflected in the use of this information by researchers and policy makers. In turn, for researchers and policymakers, our research implies that the efforts made by the official statistics organizations to guarantee quality data and make relevant open data available to society indicate that official statistics can be valued as a source of open and reliable data, enabling them to validate their theoretical models and methods. This creates a feedback loop where both groups benefit from and contribute to the data’s relevance and reliability.
However, our research is not immune to limitations that are beyond the scope of this analysis and may represent the starting point for further research. Firstly, we limit our focus to peer-reviewed academic publications, which provide quality, but do not cover all government decision making research based on official statistics. Including white papers, government reports, policy briefs, and industry analyses could broaden the perspective of the field. Secondly, it is difficult to capture the entire research and policy field of government decision making based on official statistics due to its extensiveness and complexity. Therefore, the identification of relevant articles may be based on a further evolved search query. Thirdly, the quality measure of the articles, journals, authors, and organizations is based primarily on the citation counts. However, such a measure may be subject to criticism as it does not account for self-citation and negative citation. Still, we believe that the findings of this article contribute to a deeper understanding of official statistics’ role in governance and inform the strategies to enhance their effectiveness in evidence-based government decision making.
Future research should complement our analysis of academic research involving official statistics and government decision making with quantitative and qualitative analysis of policy documents from the repositories of international organizations, such as the OECD, the United Nations, or the World Bank. While such an analysis will be limited in its geographical scope, time span, or research area, it should provide more depth to the relationship between official statistics and government decision making, a more explicit connection between the identified research themes and their tangible impact on governmental decisions, and expand on how official statistics directly influence decision-making processes.
In addition, future research could address the selection issue of the corpus by capture-recapture methods to estimate the total number of selectable documents. It could also perform an audit sampling of the obtained documents to identify false inclusions, leading to an estimated false-positive probability for each document in the corpus. Both approaches would enable additional sensitivity analysis based on the estimated capture probabilities and false-positive probabilities. Moreover, one could employ generative artificial intelligence for document analysis, such as large language models, in order to better summarize the contents of documents and especially to summarize a larger quantity of documents.