
Abstract
Insufficient Effort Responding (IER) threatens the integrity of survey data, affecting the validity of subsequent analyses. Various post-hoc methods have been developed to detect and eliminate questionable responses, but these methods risk under-detecting IER and over-detecting legitimate responses, introducing analysis biases. This study assessed six such methods—longstring, individual response variability, Mahalanobis distance, psychometric synonym, Standardized Log-likelihood, and Guttman error—as well as their combined application, under diverse conditions. The findings revealed that, in some scenarios, these methods performed no better than random guessing in identifying IER. Further, the performance of combination strategies was merely moderate, falling between the best and worst-performing methods. Alarmingly, excluding responses identified as low-effort often distorted statistical and psychometric estimates more severely than including them. These results underscore the imperative for researchers to judiciously apply IER detection techniques and critically evaluate their effects on data quality.
1. Introduction
Self-report surveys are a prevalent method for data collection, yet the quality of the data can be compromised by insufficient effort responding (IER). IER describes a situation where respondents give less effort than required while completing surveys (Curran 2016; Huang et al. 2015), which is highly prevalent in self-report surveys. To mitigate this, post-hoc IER detection methods are widely used to identify IER solely based on response patterns, without the need for additional items or external information, ensuring an unobtrusive data cleansing process (Meade and Craig 2012).
These post-hoc methods have been pivotal in research, used both as a means to gauge data quality and to validate new data-cleansing techniques (e.g., Bowling et al. 2021; Dunn et al. 2018; Schroeders et al. 2022; Tawa 2021; Toich et al. 2022). Additionally, the exclusion of data suspected of IER has often resulted in “clean” datasets (without IER data), which are then used for subsequent analyses, showing the significant impact of these methods on the research process (Arias et al. 2020; Conijn et al. 2019; Steedle et al. 2019; Vriesema and Gehlbach 2021; Ward and Meade 2018).
However, the widespread use of post-hoc methods warrants closer scrutiny, as their foundational assumption—that atypical response patterns necessarily indicate insufficient effort—remains contentious. It is unclear whether the data flagged by these methods truly reflect instances of IER or are simply outlier responses from conscientious participants. More concerningly, these methods may disproportionately flag individuals with specific traits, potentially reflecting response styles rather than effort levels. For example, research suggests that females are more likely to provide middle responses compared to males, and individuals from low-income groups tend to agree with items more frequently, making them more susceptible to being flagged as IER by certain post-hoc methods (Van Vaerenbergh and Thomas 2012). If such flagged responses are trait-driven rather than indicative of low effort, removing them risks creating a non-representative sample (Rios et al. 2017). Consequently, the indiscriminate exclusion of flagged data may undermine the integrity of the dataset. A critical question therefore remains: does the resultant “cleaned” dataset accurately represent the target population, or has it been inadvertently distorted by the elimination of potentially valid, albeit atypical, responses?
To address these issues, the present study systematically examined the performance with which these methods identify IER and the impact of their use on statistical and psychometric outcomes, using datasets with known IER status. The outcomes of this study aim to highlight the limitations of prevalent IER detection methods and to provide insights into enhancing the IER detection process. Ultimately, this could help ensure that survey data more accurately reflects the intended population.
2. Literature Review
2.1. Self-Report Surveys and Insufficient Effort Responding
Self-report surveys are among the most fundamental and widely utilized tools in psychology, education, and the social sciences (Joshi et al. 2015). These surveys provide researchers with critical insights into attitudes, behaviors, traits, experiences, and demographic information. A review of leading social science journals reveals that nearly half of published studies rely on self-report surveys, underscoring the growing dependence on this approach (Sturgis and Luff 2021). The COVID-19 pandemic further amplified the popularity of self-report surveys, as concerns over face-to-face interactions shifted data collection to remote methods (De Man et al. 2021).
Despite their widespread utility, the reliability of self-report survey data is often compromised by measurement errors, which can result in responses that fail to accurately reflect participants’ true attitudes or behaviors (Roberts et al. 2019). One significant source of such error is IER, a phenomenon where respondents invest less effort than required when completing surveys (Curran 2016; Huang et al. 2015). IER can arise from various factors, including inattentiveness, fatigue, or a desire to complete the survey hastily (Hong et al. 2020). Conceptually, IER is closely related to the notion of “satisficing,” which describes a cognitive strategy where individuals minimize effort by providing satisfactory but suboptimal responses (Krosnick 1991; Simon 1957; Tourangeau et al. 2000).
IER is highly prevalent in self-report surveys, affecting at least 10% of the sample (Meade and Craig 2012; Vriesema and Gehlbach 2021). In large-scale international assessments like the Programme for International Student Assessment (PISA; OECD 2019), IER presents a significant challenge due to the low stakes and lengthy nature of the tasks. Notably, around 70% of students have reported putting in less effort on PISA than they would on a high-stakes test (OECD 2019). Therefore, identifying and eliminating IER is crucial; otherwise, it can negatively impact the psychometric properties and, consequently, the validity of conclusions drawn from the data (Arias et al. 2020; DeSimone and Harms 2018; Steedle et al. 2019).
2.2. IER Detection
Researchers have developed a variety of approaches to detect IER, broadly categorized into proactive methods, post-hoc methods, and advanced techniques such as mixture models and machine learning.
Proactive methods involve embedding specific items or strategies within the survey to assess respondent attentiveness. For example, trap items (e.g., bogus or infrequency items) contain absurd or highly improbable statements, such as “I sleep less than one hour per night,” which attentive respondents are unlikely to endorse (Kim et al. 2018). Additionally, engagement or effort items placed at the end of a survey can directly measure participants’ self-reported effort levels (Berry et al. 1992; Meade and Craig 2012). These methods operate under the assumption that attentive participants will identify the correct or logical response.
Post-hoc methods analyze response patterns after data collection and do not require embedding additional items in the survey. These methods are built on the premise that IER produces aberrant response patterns that can be identified using statistical indicators, as discussed in subsequent sections.
Advanced approaches, such as the Mixture Model Approach, combine psychometric models with response behaviors, such as response times, to detect IER. For instance, Ulitzsch et al. (2021) proposed a model-based method that identifies IER by analyzing response times at the screen-by-respondent level without relying on arbitrary cutoff values. Machine learning methods, as another advanced approach, can leverage on-screen behaviors, such as response latencies, keystrokes, and other logged behaviors during computerized assessments, to detect IER. These methods assume that such behaviors reflect respondents’ underlying motivation and attentiveness. For example, Gogami et al. (2021) employed a supervised learning model based on response patterns and achieved an 85.9% detection accuracy for IER.
Notably, proactive methods are not applicable to completed datasets, such as those from large-scale international surveys that lack embedded catch items or engagement measures. While advanced methods like mixture models and machine learning offer powerful alternatives, they are often underutilized due to their technical demands. In contrast, post-hoc methods remain the most widely adopted approach in applied research (e.g., Hong et al. 2020; Meade and Craig 2012; Steedle et al. 2019; Vriesema and Gehlbach 2021), owing to their relative simplicity, accessibility, and ease of implementation. Given the practicality and prevalence of post-hoc methods, the current study focuses on examining and evaluating these approaches.
2.3. Post-Hoc Methods and Responding Patterns
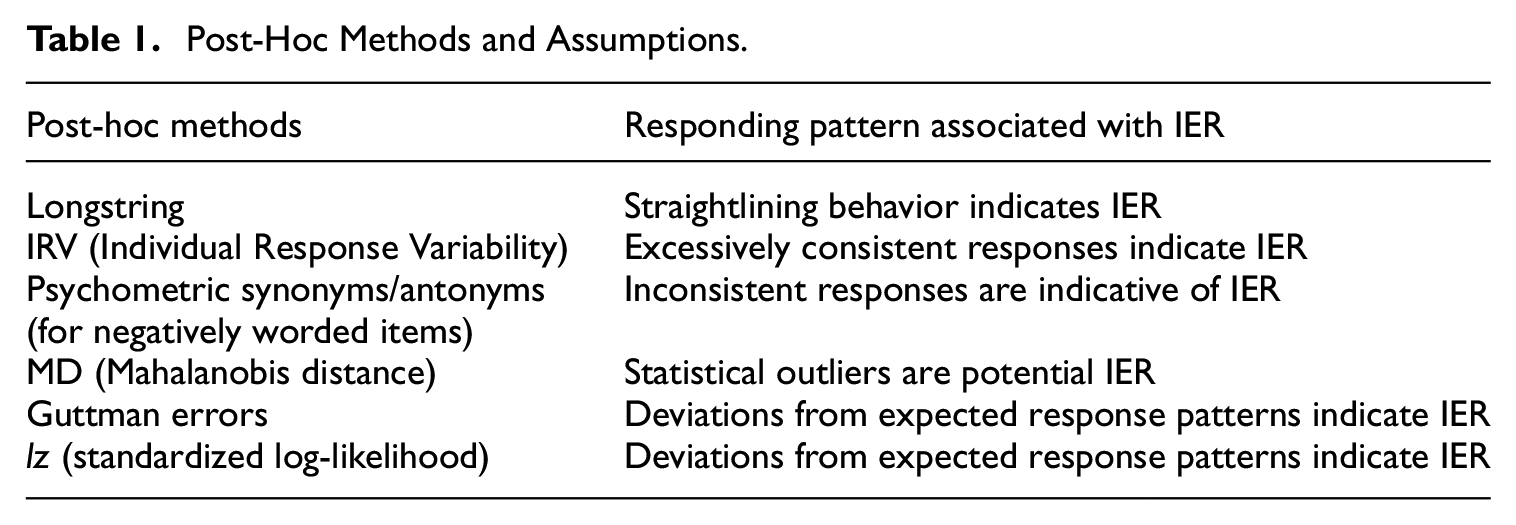
Post-hoc statistical analyses are an essential tool for identifying IER in survey data. These methods rely on detecting abnormal response patterns, which are operationalized through various statistical indicators. Below, several widely used methods are described, with technical details available in Curran (2016) and Meade and Craig (2012):
Longstring refers to the degree of overly consistent responding behavior. Respondents who respond with the identical option for a series of items (e.g., selecting “3” for many consecutive items) are suspected to be IER (Steedle et al. 2019).
Individual Response Variability (IRV) refers to the degree of overly consistent responding behavior. Assuming an “effortful” respondent should give different responses to different items, the IRV index measured the standard deviation of each participant’s responses to a set of items. Smaller standard deviations indicate a greater probability of IER (Dunn et al. 2018).
Psychometric Synonyms/Antonyms (PS/PA) examines the consistency of responses to items that are either highly positively correlated (synonyms) or highly negatively correlated (antonyms) as proposed by Goldberg and Kilkowski (1985). For PS, respondents are expected to provide consistent responses to similarly worded items. For PA, respondents are expected to show inverse response patterns for paired items with opposing content. Using the approach of Meade and Craig (2012), item pairs with correlations exceeding a predefined threshold (e.g., r > .4) are identified across the dataset. Each participant’s responses to these item pairs are then correlated to compute a PS score. A high PS score reflects consistency and attentiveness, while a low score suggests inconsistent responding, potentially indicating IER.
Mahalanobis Distance (MD) is the multivariate distance between the participant’s response vector and the average sample vector. Larger MD values indicate a higher IER probability (Mahalanobis 1936).
Guttman errors (Guttman 1944, 1945) rest on the assumption that individuals tend to provide correct answers to simple items and incorrect answers to difficult items (Curran 2016). In the context of polytomous survey data, attentive respondents are expected to agree more strongly with easier or more commonly endorsed items and less strongly with difficult or extreme items. A Guttman error occurs when this pattern is reversed, such as agreeing strongly with a rare, extreme item (e.g., “I always excel under pressure”) while showing weaker agreement with a moderate, more common item (e.g., “I perform well under pressure”), suggesting IER behavior.
Standardized Log-likelihood (lz) is based on the item response theory (IRT) and the person-fit statistic. The aggregated differences between each participant’s expected likelihood and observed responses are measured (Drasgow et al. 1985). The “expected likelihood” refers to the probability of a response pattern given the participant’s estimated ability and the characteristics of the items. For example, a high-ability respondent would be expected to correctly answer easier items with high probability and harder items with moderate probability. Deviations from this pattern, such as incorrectly answering easy items while correctly answering harder ones, suggest a lack of effort. The lz statistic follows an approximately normal distribution, with values below −2.33 (α = .01) indicating potential IER (Drasgow et al. 1985; Hong et al. 2020).
In summary, post-hoc methods are developed to detection IER on the assumption that IER is characterized by abnormal responding patterns, which, in turn, can be indicative of IER (Table 1).
Post-Hoc Methods and Assumptions.
2.4. The Challenges of Post-Hoc IER Detection Methods
Post-hoc IER detection methods have been extensively utilized in prior research for their non-intrusive nature, allowing for the analysis of response data without impacting the participant’s response process. However, the effectiveness of these post-hoc analysis methods may be affected by the hidden logical issues inherent in these methods. A fundamental concern with post-hoc methods is their underlying assumption: that atypical response patterns necessarily equate to a lack of effort. While certain behaviors, like straightlining or inconsistent responses, can be indicative of IER, automatically treating these behaviors as such may lead to erroneous conclusions. This inferential error is akin to the logical fallacy known as affirming the consequence, as discussed by Reuning and Plutzer (2020). They found that while straightlining is often considered a marker of IER, it may not signify low effort in surveys with high validity and reliability; thus, the context is critical.
More crucially, the primary goal of employing any IER detection method is to enhance the accuracy of analytical results. However, the potential for misclassification by these post-hoc methods may introduce a risk of bias in analytical outcomes. Actually, the impact of post-hoc methods on analytical results is uncertain. While some studies have shown that the use of IER detection methods can significantly improve the psychometric properties of a survey instrument, leading to better model fit and reliability (Arias et al. 2020; Voss 2024), and causing notable changes in statistical outcomes (Rios et al. 2017), other research suggests that the impact of these methods might be minimal, casting doubt on the necessity of their use (Steedle et al. 2019; Wise et al. 2020).
This divergence in findings indicates a significant knowledge gap regarding the efficacy of post-hoc IER detection methods. Therefore, it is crucial to reassess the accuracy of these methods and ascertain their true influence on data analysis results. Such an examination should be broad, encompassing varied levels of survey data quality to fully understand the implications of IER detection on research outcomes.
2.5. The Present Research
Previous research has suggested the exclusion of IER data prior to analyses (Arias et al. 2020), however, the assumption that such exclusion leads to more accurate results warrants thorough scrutiny. Concerns persist about the logicality of IER detection methods, their impact on the representativeness of samples, and the observed discrepancies in statistical and psychometric findings across studies. Therefore, the current study is designed to critically evaluate the accuracy of using IER detection methods within survey research by:
Assessing the performance of post-hoc methods and their combinations in classifying IER and non-IER.
Investigating the impact of post-hoc methods and the optimal combination strategy on statistical and psychometric indicators by comparing the results before and after the removal of flagged responses against true values.
3. Method
To effectively evaluate the efficiency of IER detection methods, it is essential to utilize survey responses with known IER status. In this study, we generated valid responses (non-IER) and IER separately and then merged them into a composite dataset of 1,000 responses. Utilizing this mixed dataset with known IER status, we examined the effectiveness of various post-hoc methods and their combinations. Our research method is organized into five sections, which will be introduced in the subsequent parts.
Benchmark Dataset Introduction: The first section establishes the foundation by detailing the existing dataset from the 2015 PISA. This dataset serves as the empirical ground for deriving parameters for our subsequent simulation work, ensuring that our simulations accurately mirror real-world survey data.
Non-IER Data Generation: The second section elucidates the process of generating non-IER data.
IER Data Generation: The third section is devoted to the creation of IER data.
Simulation Conditions: The fourth section describes the simulated conditions applied to our datasets. These conditions were designed to mimic a wide range of survey settings, allowing us to assess the effectiveness of IER detection methods in various contexts.
Analytical Strategy: The fifth section delineates our analytical strategy for evaluating the effectiveness of the IER detection methods and their impact on the interpretability of survey data.
3.1. Benchmark Dataset
This study commenced by sourcing well-established scales from the 2015 PISA, which provided a robust evaluation of cognitive skills in Reading, Mathematics, and Science of fifteen-year-old students, in addition to surveying their attitudes and learning-related behaviors (OECD 2017). From the PISA 2015 dataset, two scales were carefully chosen for our analysis: one featuring positively worded items and another containing both positively and negatively worded items. The first, the Science Self-Efficacy Scale (ST129), contains eight positively worded items on a 4-point Likert scale, such as “How easy do you think it would be for you to perform the following task on your own? Recognize the science question that underlies a newspaper report on a health issue,” with response options from “I could do this easily” to “I couldn’t do this.” The second scale we utilized is the Sense of Belonging to School Scale (ST034), which comprises six items on a 4-point Likert scale. This scale is distinct in that it includes an equal number of positively and negatively-worded items, such as “I feel like I belong at school” and its counterpoint “I feel lonely at school,” offering a range of response options from “strongly agree” to “strongly disagree.” This intentional selection of scales, one with uniform item phrasing and another with varied phrasing, was made to examine the impact of item wording on the detection of IER, thereby enhancing the robustness of our study’s conclusions. We selected data from Spain due to its large sample size (N = 39,066). For ST129, the data showed a Coefficient α of .89, with factor loadings ranging from 0.66 to 0.75, and for ST034, a Coefficient α of .87, with factor loadings ranging from −0.74 to 0.81.
3.2. Non-IER Data
Achieving survey data entirely free of IER is an unrealistic goal in empirical research, as no method can completely prevent or detect all instances of IER. Acknowledging this limitation, our study created non-IER responses on selected scales using a latent variable model inspired by Reuning and Plutzer (2020), to mimic real responses. This model operates on the understanding that valid responses to self-report questionnaires involve cognitive processes such as reading, comprehension, and recall, which are contingent upon the respondent’s motivation and cognitive capacity (Tourangeau et al. 2000). Building on a latent variable model described by Reuning and Plutzer (2020), we treated the latent variable as the underlying construct driving responses. Our method followed their approach of mapping latent mental answers onto discrete response categories using predefined thresholds. This mapping ensured that the simulated responses were consistent with the latent variable’s scale and mirrored the distributional and psychometric properties of real-world data. The formula that delineates the process of valid response generation is presented as follows:

In this formulation,
Referring to the existing data of the two target scales, the
3.3. IER Data
To examine IER, we utilized both simulated and real-world IER data. Simulated IER data is commonly used in research because identifying actual IER cases in real-world datasets is inherently challenging (DeSimone et al. 2018). However, it is important to note that the assumptions and methods used to generate simulated IER data can significantly influence the perceived performance of IER detection methods (Curran and Denison 2019). Simulated datasets often lack the interdependence and covariance observed in real-world response data, which may limit their ability to accurately reflect the complex nature of careless responding. To address this limitation, some studies have incorporated real-world IER data, often obtained by instructing respondents to answer carelessly or by employing trap items to identify low-effort responses (e.g., Arias et al. 2020; Kim et al. 2018; Nichols and Edlund 2020). In the current study, we combined both simulated and real-world IER data to comprehensively evaluate the performance of post-hoc detection methods.
3.3.1. Simulated IER Data
Previous studies have typically simulated straightlining and random responding as IER (DeSimone et al. 2018; Hong et al. 2020; Steedle et al. 2019). In our study, we produced random responses by deriving one option from a set of four equally probable response options for each item, ensuring that each option had an identical chance of being selected. Straightlining responses were simulated by selecting a single response option randomly from a set of four equally probable response options and then applying this same option across all eight or six items. Our final IER dataset was composed of an equal mix of straightlining and random responding.
3.3.2. Real-World IER Data
One inherent limitation of simulating IER data is its failure to fully replicate the complex and unpredictable nature of real-world data. To address this shortcoming, our study incorporated an IER dataset obtained from real-world responses. This approach allowed for a more accurate reflection of IER phenomena. In this context, the study characterized IER through two observable behaviors: rapid responding and the provision of nonsensical answers to open-ended questions. Real-world IER was identified based on these two well-documented indicators, which have been consistently recognized in prior research as markers of low-effort responding (Liu and Hau 2020; Read et al. 2022; Zhang and Conrad 2014). Building on the criterion by Huang et al. (2012), which flags responses quicker than two seconds per item as potential IER, this study adjusted the flagging thresholds to two seconds for positively worded items and extended it to three seconds for negatively worded items, recognizing the additional cognitive processing required for the latter. Specifically, we flagged respondents who, despite providing complete responses on the target scales, either (a) finished the entire scale in sixteen seconds for ST129 or fifteen seconds for ST034, which led to 849 participants being flagged for ST129 and 105 for ST034, or (b) demonstrated minimal effort during the response process by giving invalid answers (missing or nonsensical) at least three times on four open-ended typing items (Items OCOD1, OCOD2, OCOD3, and ST065—for example, when asked to type the name of a specific school science course, participants were expected to type an answer rather than select from options), resulting in 674 participants flagged for ST129 and 799 for ST034 due to IER (Notably, the reported number reflects the exclusion of cases with any missing data on the target scale ST129 or ST034). In total, we constructed two separate IER datasets for the two scales, comprising 1,475 respondents for ST129 and 887 respondents for ST034. Their data on the target scales were then utilized to represent a real-world IER dataset for subsequent analyses.
3.4. Simulated Conditions
We generated 100 replicates, each with N = 1,000 cases, consisting of non-IER and IER data with known IER status. The non-IER was randomly selected from the simulated valid responses, while the IER data was randomly extracted from the simulated IER or real-world IER dataset. We employed six common IER detection methods to detect IER across 90 situations (3 × 3 × 5 × 2) for two scales (a total of 180 situations), which varied in: (a) three IER prevalence percentages, (b) three IER severity levels, (c) five levels of flagging criteria, and (d) two sources of IER data. We selected these factors to thoroughly assess IER detection methods across diverse conditions that could arise in real survey settings. These scenarios varied based on the following factors:
IER Prevalence: This factor represents the proportion of respondents displaying IER within the dataset. We manipulated this prevalence at three levels: low (6%), medium (24%), and high (42%), indicating the percentage of respondents that were IER.
IER Severity: This factor pertains to the extent of the items that are affected by IER. To manipulate IER severity for both the simulated and real-world IER datasets, we varied the number of items affected by IER within the flagged cases, ensuring that not all flagged responses in the IER dataset were treated as fully impacted, thereby allowing for variation in severity. We simulated three degrees of IER severity—low, medium, and high—where the severity level was determined by the number of items impacted by IER. For high severity IER, the effect extended to all eight evaluated items. Medium severity was characterized by IER influencing either seven or all eight items for IER participants, with an equal probability of 50% for each. Low severity was defined by an equal one-third likelihood of IER affecting six, seven, or all eight items.
Flagging Criteria: We set various cutoff values for flagging a response as IER, ranging from lenient to strict, to decide what proportion of the population would be flagged. These criteria corresponded to specific percentiles of each IER detection method, adjusted for the IER prevalence in the dataset. For instance, with a 6% IER prevalence, cutoff values were set to capture the top 1%, 2%, 4%, 6%, and 8% of participants most likely to exhibit IER; for 24% prevalence, the cutoffs were 4%, 8%, 16%, 24%, and 32%; and for 42% prevalence, the cutoffs were 7%, 14%, 28%, 42%, and 56%. For example, for datasets with 6% IER prevalence, the cutoff values for indices such as IRV, lz, and PS were set at their respective 1%, 2%, 4%, 6%, and 8% percentiles, whereas for longstring, MD, and Guttman error detection was at the 99%, 98%, 96%, 94%, and 92% percentiles.
Sources of IER Data: IER data can derive from either a simulated IER dataset or a real IER dataset.
3.5. Analyses
The effectiveness of IER detection methods was assessed using the composite dataset with known IER status. The evaluation metrics included precision, which measures the proportion of correctly identified IER instances among those flagged, and recall, which assesses the percentage of flagged IER instances out of all actual IER instances. To balance the trade-off between precision and recall, we computed the F1 score, which serves as the harmonic mean of these two metrics. The F1 score offers a single measure of the detection methods’ performance quality, with higher values indicating better performance (Sokolova et al. 2006):

In addition to evaluating the six individual methods, we assessed the performance of all possible combinations of these six post-hoc methods, resulting in fifty-seven combination strategies. Additionally, a random classifier (detect IER randomly), guessing the presence of IER based on its prevalence in the dataset (yielding an F1 score equivalent to the IER prevalence), was served as a baseline to benchmark the performance of the IER detection methods.
In addition to evaluating the performance of IER detection methods, we also assessed the influence of using IER detection methods on statistical estimates. This included an examination of standard deviation (SD), Comparative Fit Index (CFI), Root Mean Square Error of Approximation (RMSEA), correlation coefficients, and Coefficient
4. Results
4.1. Performance of Post-Hoc Methods
4.1.1. Performance of Individual Methods
We observed consistent trends across five levels of cutoff values. Consequently, for brevity and clarity, we reported the F1 values only at the fourth level of the cutoff value for each IER detection method. And the influence of the cutoff value on the performance of IER detection methods were discussed in a subsequent section. Detailed results for all cutoff levels, as well as precision and recall rates for each method, are presented in Appendix 1 of the online supplementary materials, available on OSF (https://osf.io/gj9mc/), in Tables 1 to 12. Our analysis indicated that in several specific situations, IER detection methods were less effective than a random classifier, a result that is illustrated by the dotted lines in Figures 1 and 2. Additionally, inconsistencies arose between simulated IER and real IER in their impact on the detection methods’ effectiveness.
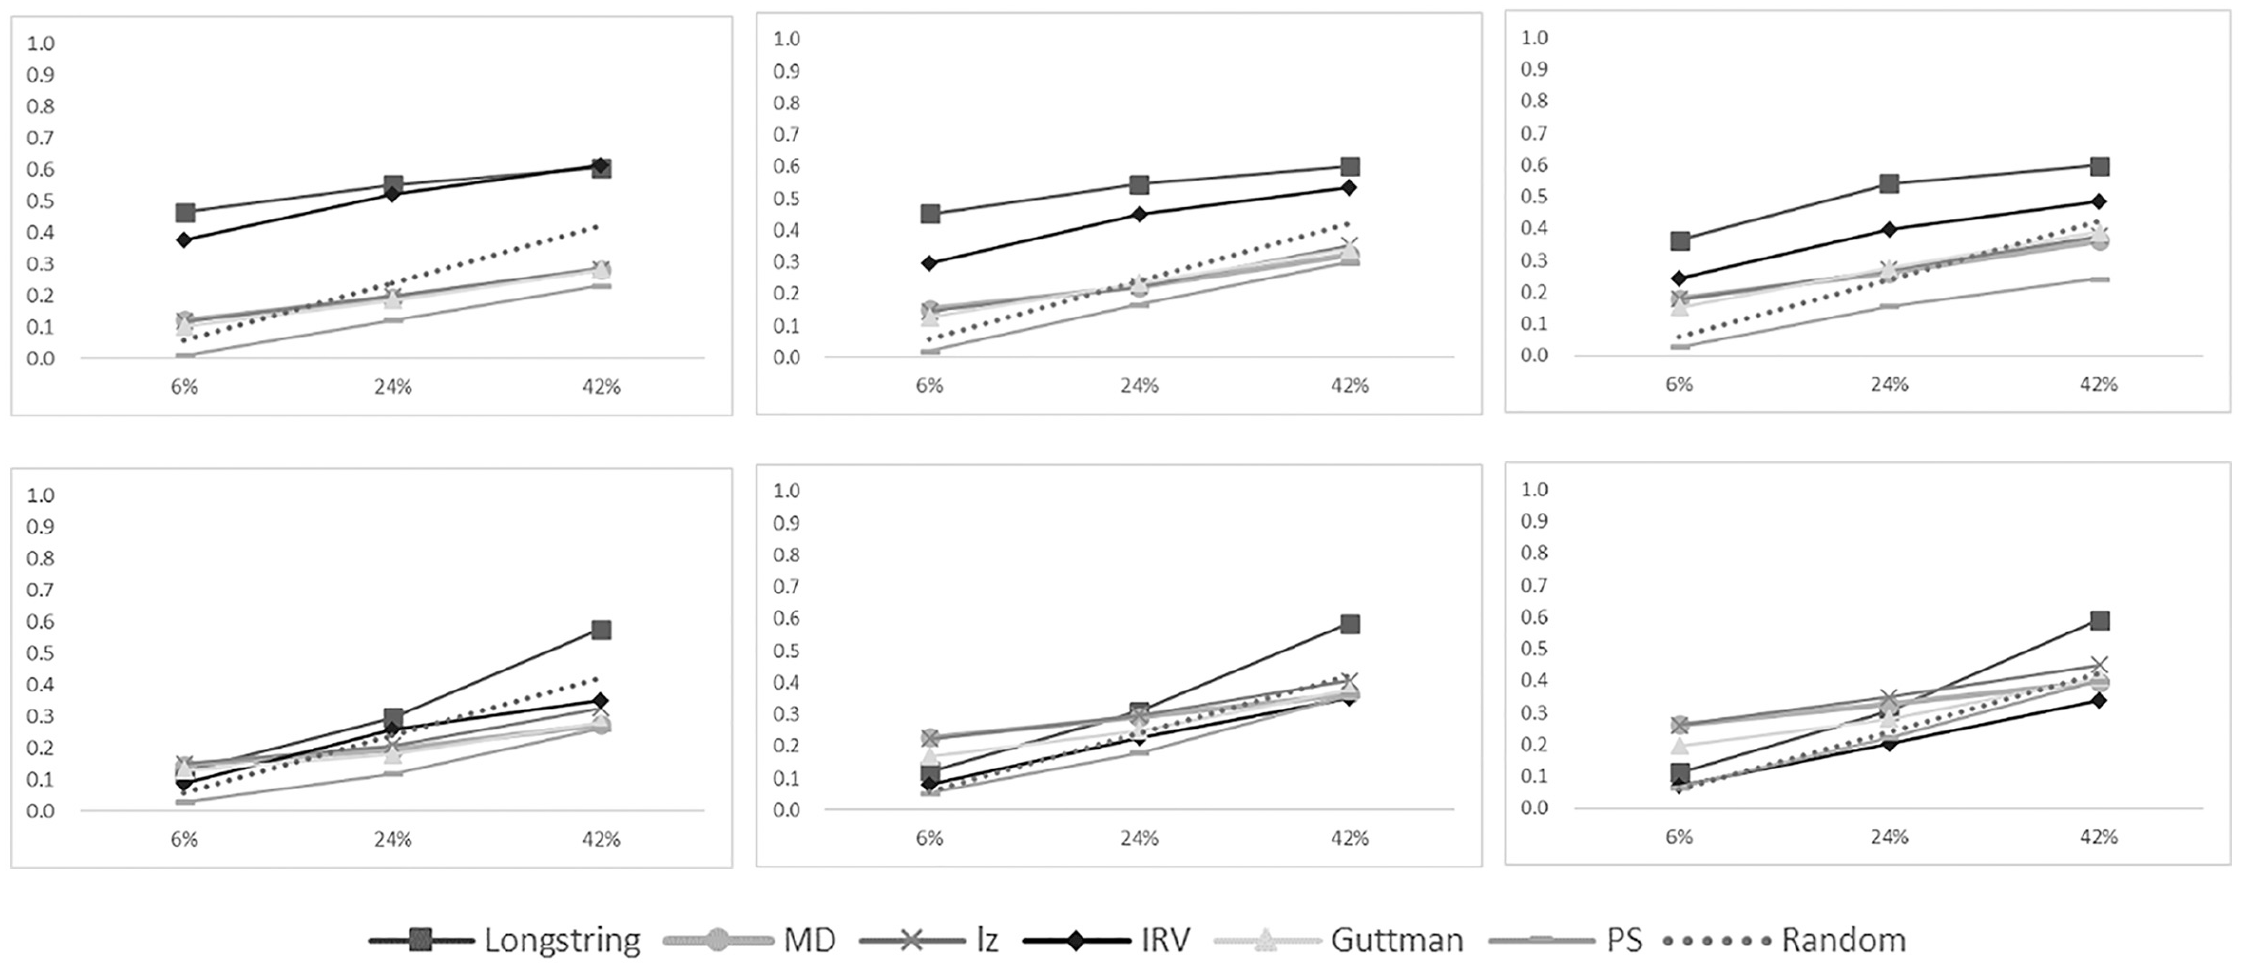
F1 scores of six IER detection methods for ST129 (above) and ST034 (below) with real IER.
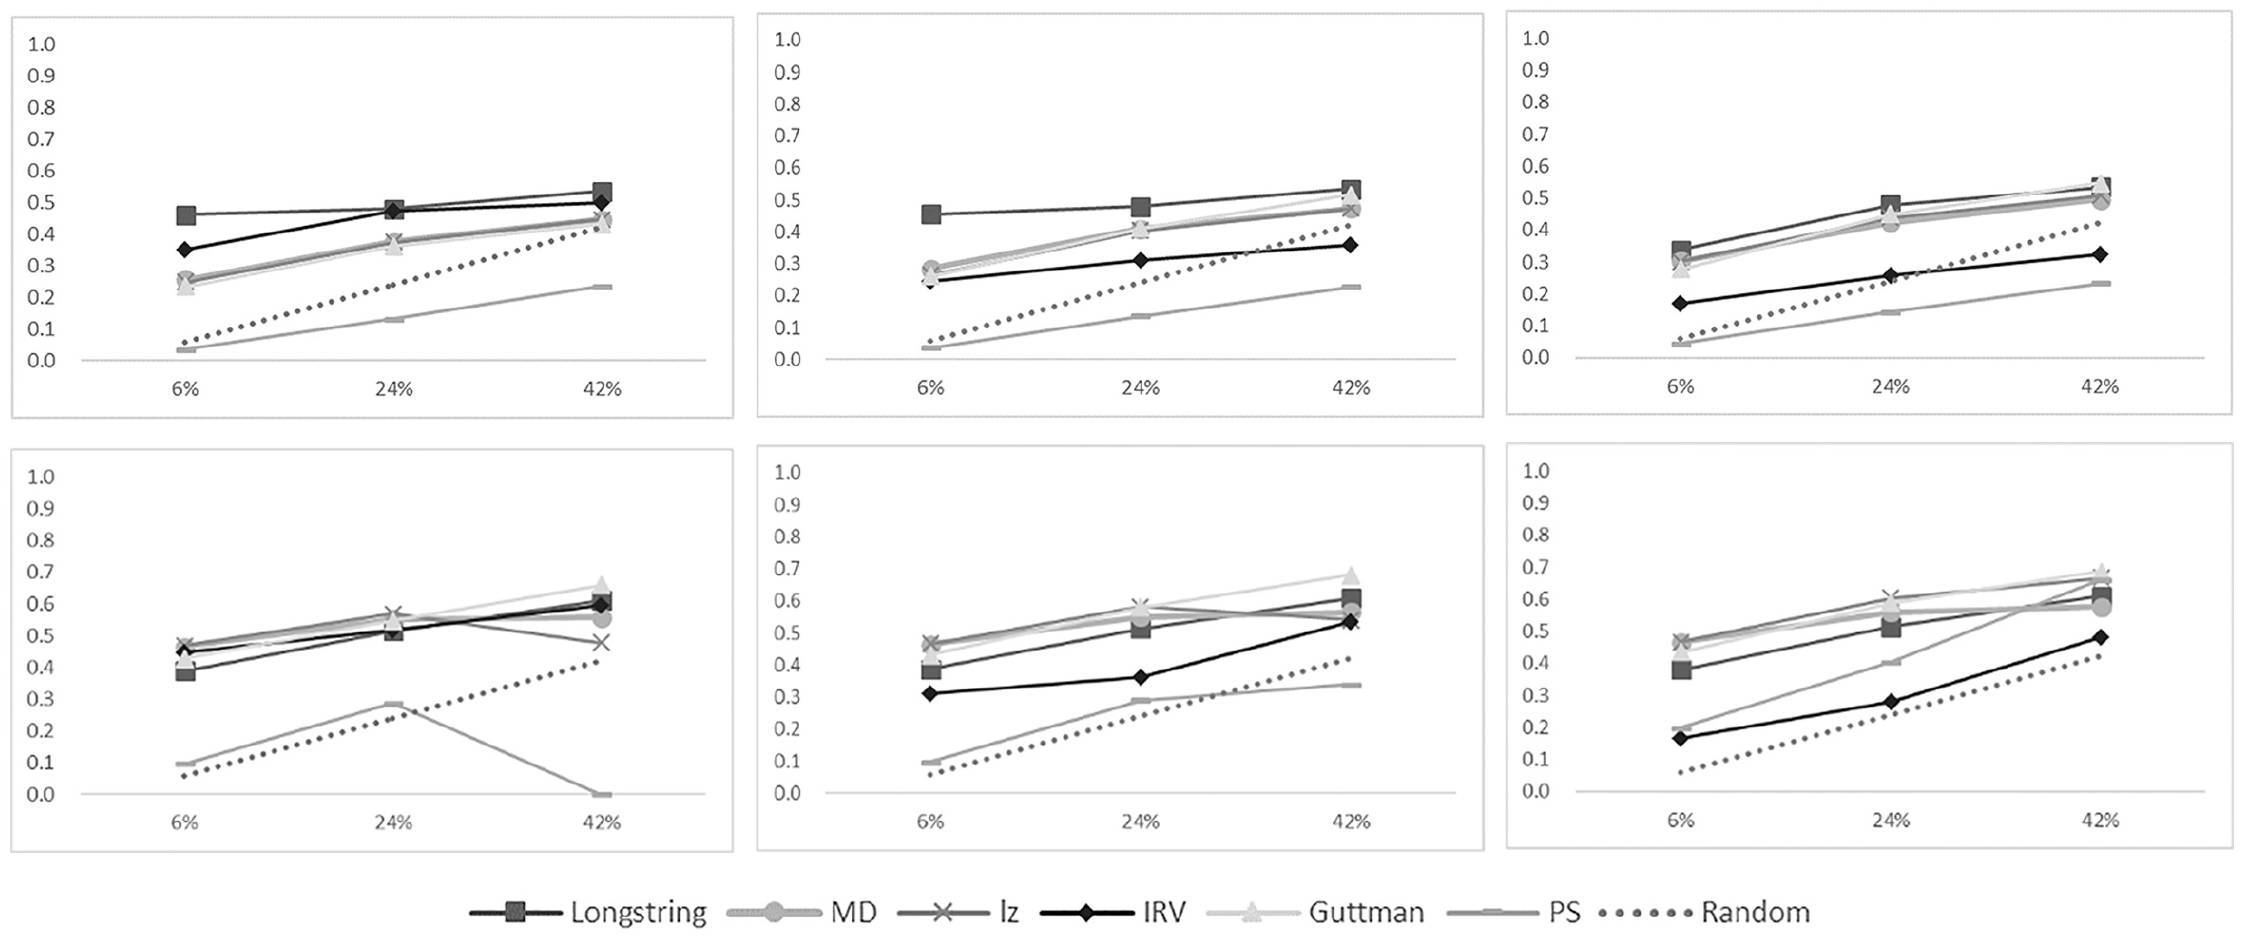
F1 scores of six IER detection methods for ST129 (above) and ST034 (below) with simulated IER.
In the case of real IER data (Figure 1), differences emerged in detection methods’ performances on scales with and without negatively worded items (ST129 and ST034). For scales devoid of negatively-worded items, longstring and IRV methods outstripped the random classifier in most scenarios. However, other detection methods did not surpass the random classifier. In contrast, for scales with negatively worded items (ST034), all methods showed similar F1 scores to the random classifier, indicating limited effectiveness in this case.
In simulated IER case (Figure 2), considering scales with (ST034) and without (ST129) negatively worded items, most methods demonstrated superior performance to that of a random classifier, except for IRV and PS. This contrast between real and simulated IER suggests that the nature of IER can significantly influence the performance outcomes of detection methods.
Beyond the IER type and the nature of the scales used, three additional conditions—IER prevalence, severity, and cutoff value—can influence the performance of IER detection methods, as illustrated in Figures 1 and 2.
IER Prevalence: An increase in IER prevalence within a sample generally resulted in higher F1 scores for the random classifier. However, the slope of increase for F1 scores of IER detection methods was less steep than the random classifier, suggesting a diminished efficiency of these methods as IER became more prevalent in the sample.
IER Severity: The performance of IER detection methods was nuanced. IRV’s F1 scores increased with higher severity IER, while MD, lz, and Guttman error showed better performance at lower severities. Longstring’s F1 scores remained stable across severity changes, but PS consistently underperformed, unaffected by changes in prevalence or severity.
Cutoff Values: We found that less stringent cutoffs negatively impacted precision but improved recall (Tables 1–12 in Appendix 1). Since F1 scores are dependent on both precision and recall, determining the optimal cutoff level with the highest F1 was challenging due to fluctuations across different conditions.
Overall, the efficacy of IER detection methods frequently fell below an F1 of 0.6 (ranging from 0 to 1), and their performance was even inferior to that of a random classifier under some conditions. The type of IER—whether it was simulated or real—had a profound impact on the performance of these methods. The majority of the IER detection methods underperformed compared to the random classifier in identifying real IER. In contrast, when it came to detecting simulated IER, most methods, except IRV and PS, proved to be satisfactory. In addition, the efficacy of IER detection methods diminished with rising IER prevalence and was intricately affected by the severity of the IER.
4.1.2. Performance of Combination Strategies
The use of combination strategies is motivated by the complementarity of different detection methods, as each method has its own strengths and weaknesses and targets different types of invalid data (Curran 2016; Meade and Craig 2012). We evaluated all fifty-seven combination strategies of the six post-hoc methods by calculating precision, recall, and F1 scores across 180 scenarios. Our findings indicate that no single combination strategy consistently outperformed all other methods across all scenarios based on F1 scores. In most situations, the best-performing detection method was an individual method rather than a combination. This suggests that while combining methods may help address the limitations of individual approaches by balancing their strengths and weaknesses, it does not necessarily lead to superior performance in all cases.
To identify the most effective combination strategies, we summarized the top-performing combinations based on their F1 scores. Specifically, we calculated the average F1 scores for both simulated and real IER datasets, separately for scales with and without negatively worded items. For each combination strategy, the same cutoff level was applied consistently across all methods within the combination. To evaluate overall performance, we calculated the average F1 scores across different cutoff levels, IER severities, and IER prevalence rates. Among the top 10 combination strategies for each dataset, we identified the overlapping strategies that performed well in both simulated and real IER datasets. For the ST129 scale (without negatively worded items), the best-performing combinations across both simulated and real IER datasets were: MD + IRV + Guttman, lz + IRV + Guttman, MD + Guttman, Guttman + PS, and longstring + lz + IRV. For the ST034 scale (with negatively worded items), the best-performing combinations were: IRV + Guttman + PA, and longstring + lz + IRV. Notably, the combination longstring + lz + IRV showed strong performance across both scales (with and without negatively worded items), making it a particularly promising approach for detecting IER in diverse contexts. This can be attributed to the complementary nature of the three methods, as each targets a distinct form of IER. Longstring detects repeated selection of the same response option, IRV identifies overly consistent answers, and lz flags anomalous response patterns, such as answering difficult questions correctly while missing easier ones. By addressing these diverse patterns, the combination effectively captures a broader range of IER, enhancing its applicability across varied survey contexts. The detailed performance results of fifty-seven combinations are provided in the Appendix 2 in the OSF (https://osf.io/gj9mc/).
4.2. Impacts of Post-Hoc Methods
While post-hoc methods have been used in prior studies to eliminate potential IER, the question of whether their removal actually enhances analytical outcomes remains uncertain. For it, we explored the effects of removing flagged data on a variety of psychometric and statistical measures, including SD, Coefficient α, CFI, RMSEA, and correlation coefficients. Our analysis involved comparing three distinct datasets: the first, labeled “True Value” in Figures 3 and 4, contains data completely free of IER contamination; the second, referred to as “Whole,” comprises data with IER contamination; and the third includes the same contaminated data after the application of various IER detection methods, with the cleaned datasets identified by specific labels such as “longstring,”“MD,”“lz,”“IRV,”“Guttman,”“PS,” and the “combination” (longstring + lz + IRV) as depicted in the figures. We assessed the IER effects on two scales: ST129 without negatively worded items (Figure 3), and ST034 with them (Figure 4), by adding both real IER (figures’ upper parts) and simulated IER (figures’ lower parts) to a pure dataset. To simplify the presentation of our findings, we chose a scenario with a medium level of IER prevalence (24%) and medium severity (with IER occurring on seven to eight items) as representative of our results (refer to Figures 3 and 4). The comprehensive results for all 180 conditions can be found in the Appendix 1 (Figures 1–10).
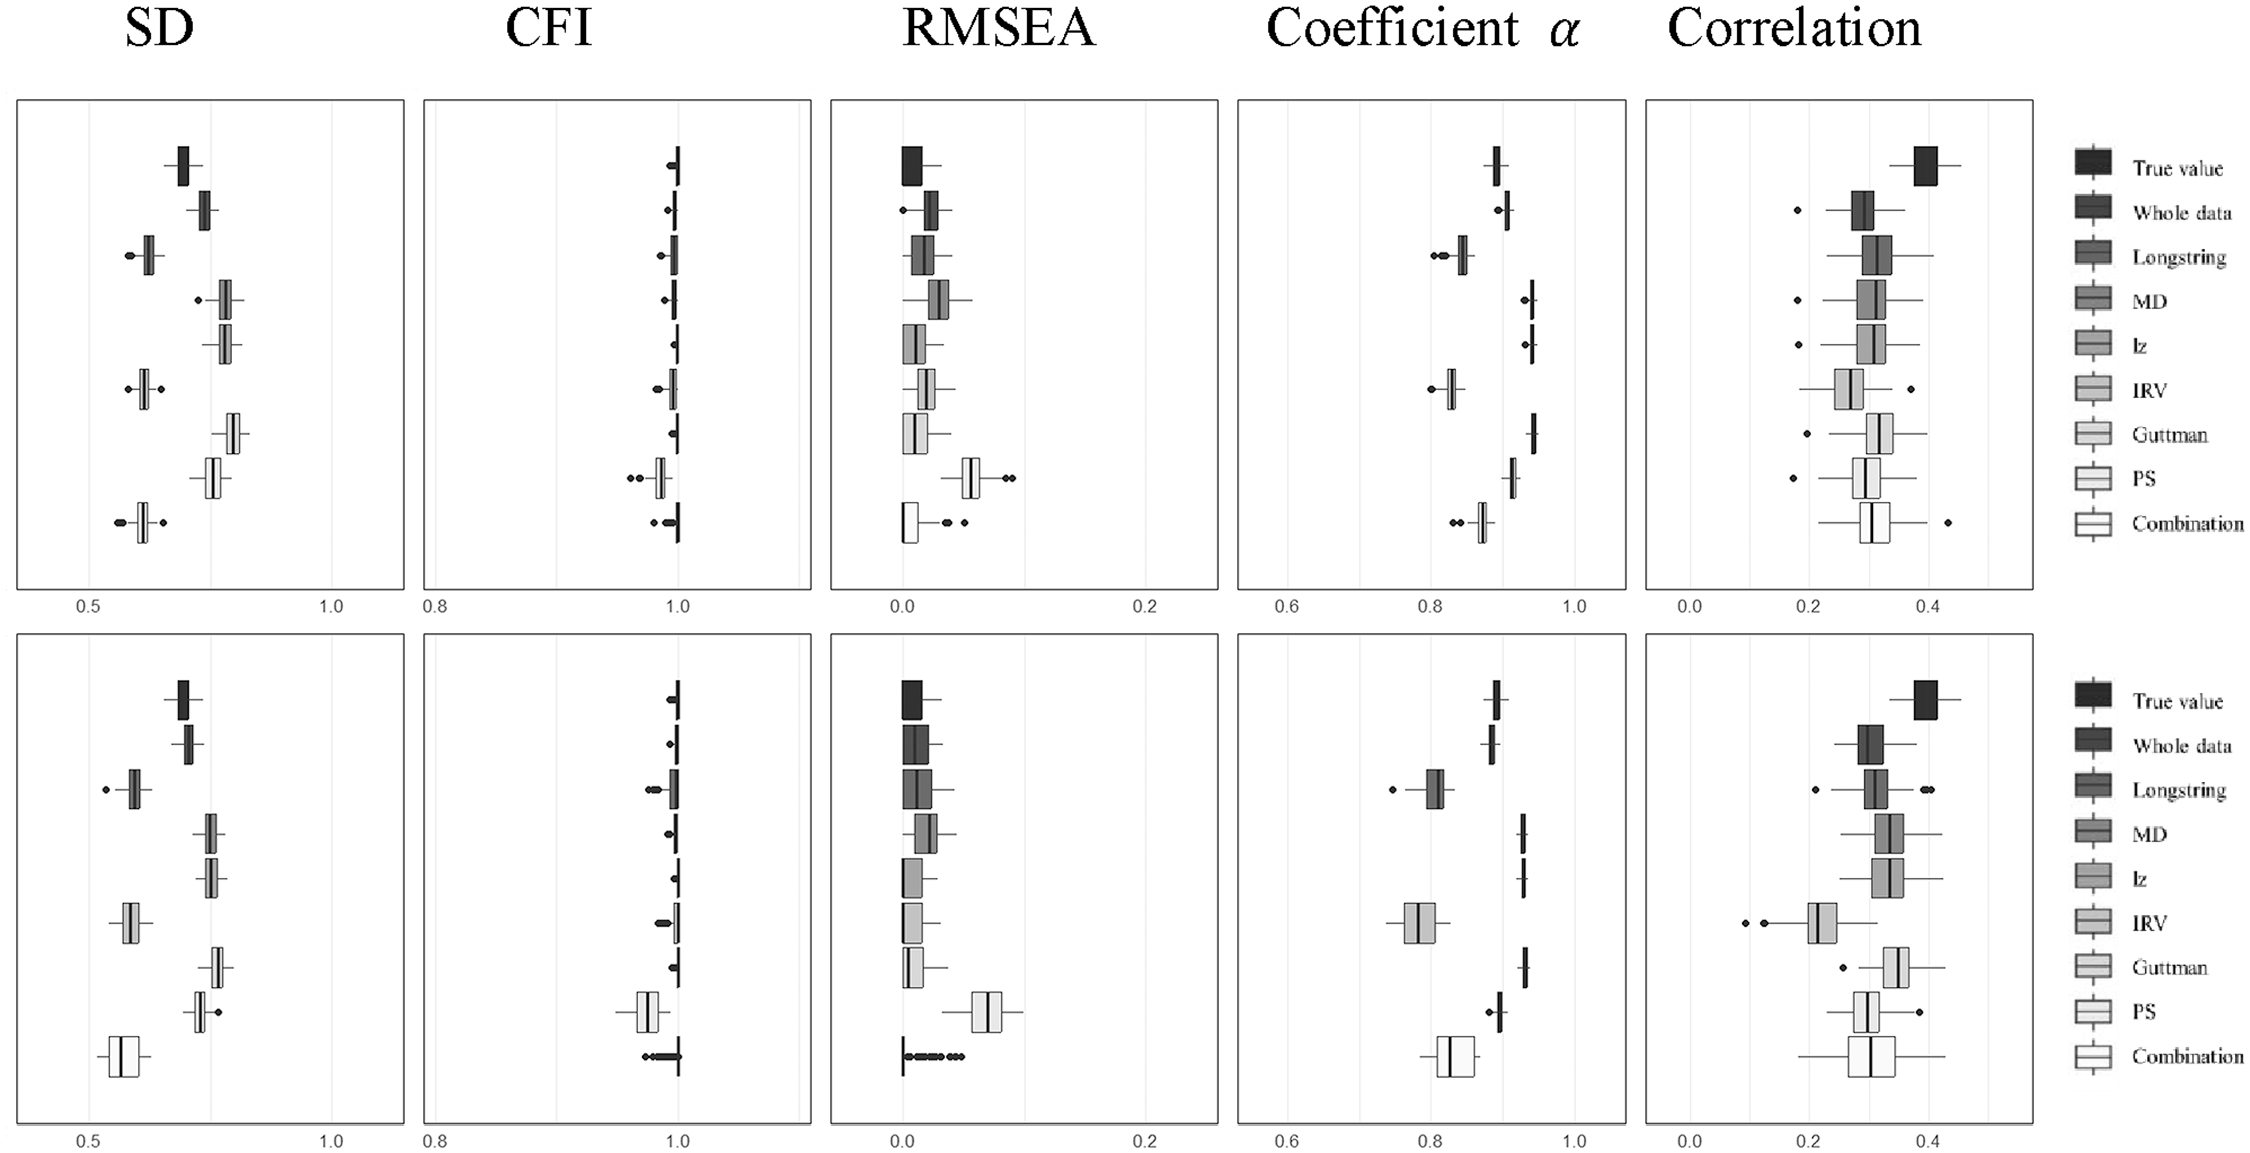
Effects of six IER detection methods on ST129 (top: real IER; bottom: simulated IER).
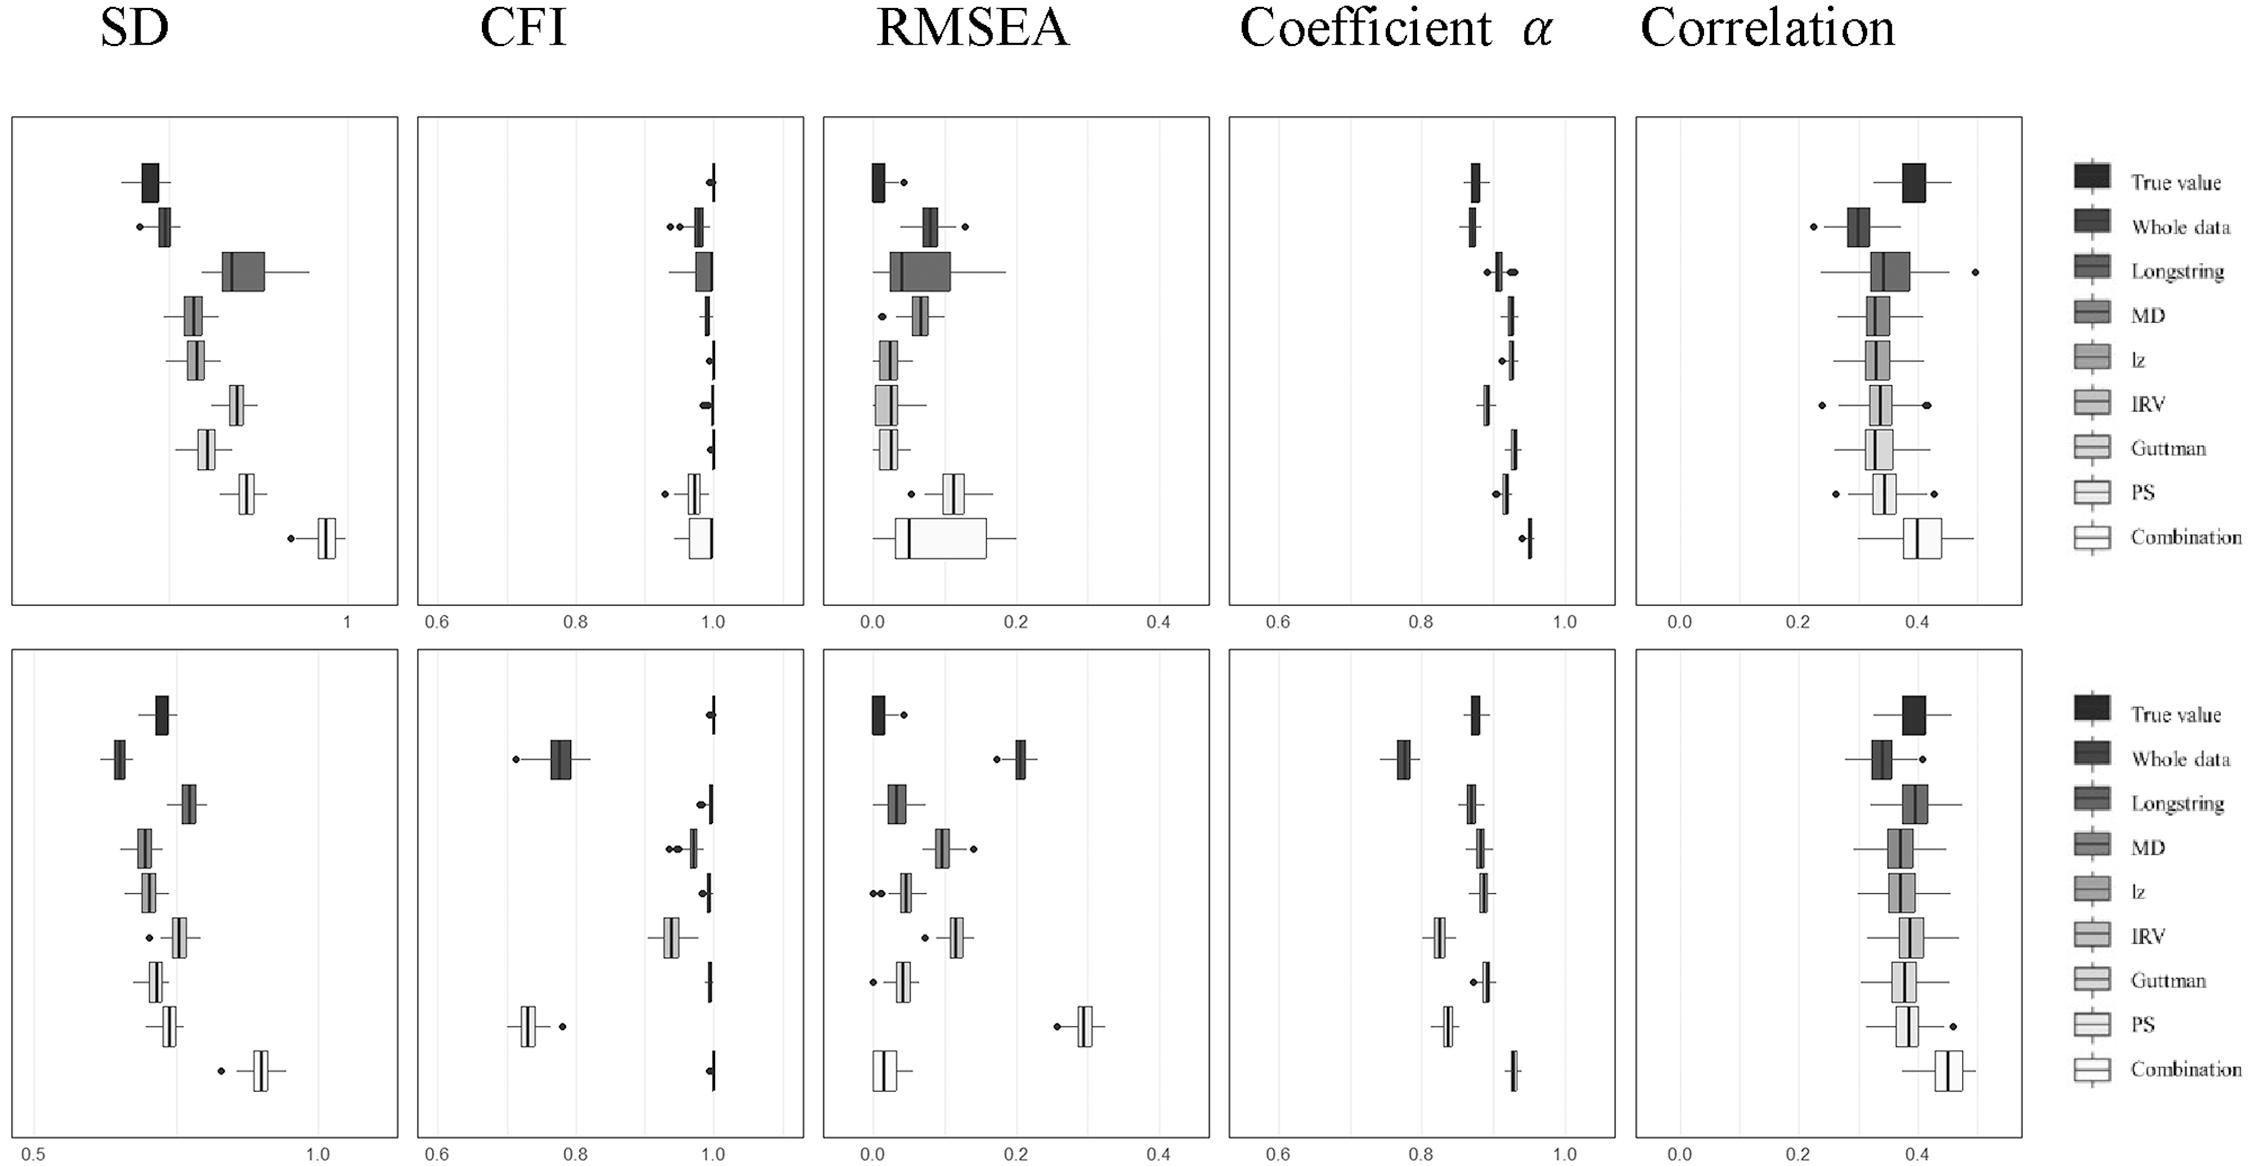
Effects of six IER detection methods on ST034 (top: real IER; bottom: simulated IER).
4.2.1. SD of Mean Scores in Sample
The influence of IER on SD or other statistical indicators was analyzed by comparing non-IER data (“True Value” as shown in Figures 3 and 4) with data containing IER (“Whole”). We observed that IER resulted in a noticeable distortion in the SD of the mean scores. The nature of this distortion, whether it manifested as an increase or a decrease, was found to be multifaceted, being affected by the type of IER (real or simulated) as well as the characteristics of the scale in question (with and without negatively worded items). Additionally, the extent of the SD distortion was found to fluctuate in relation to the prevalence and severity of the IER introduced into the dataset.
The goal of IER detection methods is to correct skewed values to more accurately reflect the true values. However, when these methods were applied to detect and remove potential IER (as labeled in Figures 3 and 4), the adjusted SD values often deviated further from the true values compared to the untreated, IER-contaminated data (further from “True Value” compared to “Whole” in Figures 3 and 4). This suggests that the application of these detection methods or combination frequently led to SD estimates that were more distorted than those obtained from the IER-contaminated data without using any IER detection methods.
4.2.2. Model Fit Indicators
We found that the model fit, as indicated by CFI and RMSEA, remained satisfactory and stable for the scale without negatively worded items (ST129, Figure 3). Despite the introduction of IER and the application of IER detection methods to filter data, the CFI consistently stayed above 0.9 and the RMSEA remained below 0.1, closely mirroring the true values—even in scenarios with a high prevalence of IER (e.g., 42%). Conversely, for the scale including negatively worded items (ST034, Figure 4), the introduction of IER caused more significant deviations in model fit measures. However, the employment of individual IER detection methods and the proposed combination generally led to improvements in model fit, with lz standing out for its effectiveness in correcting the model fit indicators. It should be noted that low severity IER may lead to more substantial inaccuracies in the estimates of model fit indicators (Figures 1–10 in Appendix 1).
4.2.3. Coefficient
Our results indicated that the presence of IER distorted the estimates of Coefficient
Furthermore, the attempt to correct for IER by applying detection methods and the combination to eliminate suspected IER data sometimes led to more inaccurate estimates of Coefficient
4.2.4. Correlation Coefficient
IER weakened correlation estimates for both types of scales, as depicted in Figures 3 and 4. This deviation from the true values was more pronounced when IER was more prevalent and severe. Most IER detection methods can effectively mitigate this issue, bringing the correlation estimates closer to their true values. However, they were not infallible, especially in cases where IER was highly prevalent in the data (e.g., 42%). For instance, MD effectively corrected correlation estimates at lower IER levels (6% and 24%). Yet, at a higher IER incidence (42%), it caused greater distortion in the correlation coefficients for the ST034 scale.
4.2.5. Summary
Introducing IER into clean data can skew SD and
IER detection methods, intended to address statistical inaccuracies, frequently did not return values to their true state and could even exacerbate distortions, especially for SD and
5. Discussion
Identifying and removing IER using post-hoc methods has become a common practice to ensure survey data quality (e.g., Magraw-Mickelson et al. 2022; Nichols and Edlund 2020; Steedle et al. 2019). Yet, our finding indicated that these methods often do not reliably distinguish between IER and non-IER more effectively than the random classifier. Furthermore, the elimination of data flagged through these methods and the combination strategies cannot guarantee improved accuracy in statistical and psychometric analyses and may, in some scenarios, introduce greater errors than using the contaminated data directly. We also found that the effectiveness of IER detection methods and their combinations varies due to complexities such as data quality levels—encompassing IER prevalence, severity, and type—scale characteristics like negatively worded items, and varying flagging criteria.
5.1. The Efficacy of Post-Hoc Methods
Post-hoc detection methods were developed to filter out low-quality responses from research data. Nevertheless, these methods can mistakenly identify non-IER respondents as IER (false positives) and fail to detect actual cases of IER (false negatives). This misclassification is evidenced by F1 values lower than 0.6 in Figures 1 and 2. Furthermore, our analysis indicated that employing some methods can alter the data’s SD,
The underlying issue with these methods is their reliance on ranking respondents based on the probability of IER, which is typically judged by specific abnormal response behaviors. This ranking process can inadvertently eliminate valid data in a biased manner. For instance, non-IER responses might be wrongly classified as IER, especially when respondents have distinctive response patterns or when survey questions are not optimally designed. An example of this is the removal of respondents based on their longstring values; individuals who consistently choose “totally agree” could be misidentified as IER. Consequently, this approach can lead to excluding the samples with extreme values (e.g., selecting “totally agree” consecutively) simply because they display response patterns similar to those flagged as IER. This issue is underscored by findings from Wang and Hau (2024), who observed that at least 70% of the longest straightlining patterns in certain scales were attributable to non-IER respondents. These results highlight the significant risk of erroneously removing valid data when post-hoc methods are employed to clean datasets.
Given these inherent limitations, combining multiple post-hoc methods does not consistently yield better results than using individual methods alone. Although the theoretical rationale for combining methods is to leverage the strengths of different approaches, such combinations often fail to achieve the desired synergies. Instead, the performance of combined methods is frequently hindered by the weaknesses of poorly performing individual methods, which offset the strengths of better-performing ones. As a result, the combined strategies tend to perform at an average level, often falling short of the performance achieved by individual methods with stronger efficacy. This counterintuitive outcome highlights the challenges of relying on combination strategies to enhance data quality and calls for more robust approaches to mitigate the limitations of post-hoc detection methods. To overcome these challenges, Wang and Hau (2024) suggest a more comprehensive approach, incorporating additional indicators such as trap items and response time alongside post-hoc methods. Such multifaceted strategies can better distinguish genuine responses from spurious ones, improving the accuracy of IER detection and overall data quality.
5.2. The Impact of IER on Outcomes
Even a small amount of IER data can significantly alter statistical and psychometric outcomes, occasionally resulting in totally different conclusions (Arias et al. 2020). Our findings reinforce this, demonstrating that incorporating IER into uncontaminated data can distort SD and Coefficient α away from their true values, and attenuate correlations, with distortions intensifying as IER becomes more prevalent and severe.
However, the distorting impact of IER on outcomes is complex, influenced by factors such as data quality, the nature of the scale, and the type of IER present. Our results indicated that, apart from correlation coefficients between the target scale and an external criterion which are uniformly reduced by IER, the impact of IER on other statistical and psychometric indicators is susceptible to the scale’s nature, particularly the presence of negatively worded items, and the type of IER (simulated vs. real-world). For instance, the impact of IER on SD and Coefficient α—whether it causes a decrease or an increase—varies based on these factors. CFI and RMSEA were relatively unaffected for scales without negatively worded items, even with more prevalent IER in data (e.g., 42%). However, CFI and RMSEA were affected on scales with negatively worded items, even at low percentage of IER in population. Surprisingly, lower severity IER could more severely affect CFI and RMSEA than higher severity, suggesting that model fit suffers more when participants provide IER on only some items rather than all. All these nuanced impacts of IER could account for the lack of consensus in prior research regarding the effects of IER on these indicators.
5.3. The Change of Results After Using Post-Hoc Methods
The effectiveness of post-hoc methods in achieving more accurate analysis cannot be assured. When compared to using datasets originally contaminated with IER, we observed that correlation coefficients were more accurate—closer to the true values—when IER detection methods were applied, but this improvement was limited to samples with a lower incidence of IER (e.g., 6% and 24%). In terms of model fit indices, the lz was the only approach that consistently brought the CFI and RMSEA closer to true values. Conversely, for SD and Coefficient α, the application of IER detection methods and the combination strategy always resulted in less accurate outcomes than not using them. In conclusion, our findings suggest that the application of IER detection methods does not guarantee increased accuracy across all indicators. Surprisingly, these methods and the combination can sometimes lead to estimates that deviate further from the true values than initially expected.
These negative consequences arise from two primary sources. First, when IER cases are not fully detected, residual measurement error remains in the dataset, which can attenuate effect sizes or introduce noise, as discussed in Section 5.1. This incomplete detection may explain why certain metrics, such as SD and coefficient α, become less accurate after applying these methods. Second, even when IER detection is highly effective, the selective removal of respondents flagged as IER can introduce bias. If the removed respondents are not randomly distributed across the sample but instead share specific characteristics (e.g., lower ability, lower motivation, or particular demographic traits), their exclusion may distort the representativeness of the dataset. This could lead to estimates that deviate further from the true values, as the filtered data no longer reflects the target population. These factors emphasize the need to carefully evaluate and adjust post-hoc IER detection techniques to mitigate unintended biases and preserve data integrity.
5.4. Implications for Researchers and Practitioners
5.4.1. The Way of Dealing with IER Data
Directly removing the identified IER data by post-hoc methods is not an ideal strategy for addressing low-quality self-report data; yet, using these methods to delete dubious data is a common way in related studies (Meade and Craig 2012; Steedle et al. 2019). To enhance the effectiveness of IER detection, a comprehensive approach to evidence collection is crucial. By integrating process information (Liu and Hau 2020; Wise and Kong 2005), like response times and missingness, and incorporating trap items (e.g., “I was born on February 30th”; Beach 1989), researchers can gain more nuanced insights into respondent behaviors. In addition, researchers may employ imputation techniques as a means to deal with the identified IER data (DeSimone and Harms 2018). Future research should explore imputation techniques to mitigate the impact of IER on data quality.
5.4.2. Comparing the Impact of Real Versus Simulated Data on IER Detection Efficacy
Our findings demonstrate that the type of IER—whether simulated or real-world—significantly affects the performance of IER detection methods. Curran and Denison (2019) compared simulated data with real-world data using commonly employed IER response metrics and observed notable differences in detection efficacy. These discrepancies arise because the assumptions and design choices underlying simulation processes often fail to fully capture the complexity of real-world careless responding. Simulated data tends to rely on simplified assumptions about IER behaviors, such as purely random or fully invariant responses, which do not account for the nuanced overlap between careless and genuine response patterns frequently observed in real-world datasets. This fundamental limitation helps explain why post-hoc detection methods perform differently when applied to simulated IER versus real-world IER in the present study.
In our study, we focused on simulating only two types of IER behaviors—straightlining and random responding. However, real-world IER behaviors are far more complex and heterogeneous than these simplified scenarios, encompassing a wider range of patterns that are not easily captured by current simulation models. This complexity underscores the inherent challenge of using simulated data to replicate the intricacies of real-world IER. Our findings further highlight that simulated and real-world IER not only produce divergent results in the performance of detection methods but also differ in their impact on statistical outcomes. While simulations are indispensable for creating datasets with a known IER status, particularly given the practical difficulties of collecting real-world IER data, their validity ultimately depends on how well they reflect the characteristics of real-world IER. Therefore, a deeper understanding of real-world IER behaviors is essential for improving the representativeness and validity of simulation-based studies, which remain a critical tool for advancing research on IER detection.
5.5. Limitations and Future Directions
A limitation of this study is that we only examined post-hoc detection methods. Some IER indicators have not been examined in this study because of the complexity, or the impossibility to being examined through simulation, such as response time and trap items. And some newly proposed methods based on factor model, IRT, or machine learning (e.g., Arias et al. 2020; Gogami et al. 2021; Schroeders et al. 2022) have not been examined in this study due to operational difficulty. Future studies to generalize our findings to a broader range of other methods are necessary. Moreover, while simulation studies provide valuable insights into the performance of IER detection methods, they fail to capture the full range of errors observed in real-world survey responses. For instance, genuine respondent errors—such as misunderstanding item content, socially desirable responding, or an inability to answer certain items—are common in practice but were not represented in this study. These errors frequently coexist with IER within the same dataset, adding layers of complexity to the interpretation of detection indices. To enhance the ecological validity of simulations, future research should incorporate these additional sources of error, thereby better reflecting the multifaceted nature of real-world survey data.
For future directions, two primary issues warrant attention. First, given that excluding participants identified with IER can compromise sample representativeness, future research should emphasize prevention strategies rather than relying solely on detection and removal. Specifically, improving survey design factors—including survey length optimization and clearer instructions—may proactively enhance respondent engagement and reduce IER occurrence. Second, researchers should move beyond exclusive reliance on self-report survey data by integrating mixed methodologies and employing advanced analytical tools, such as machine learning techniques, to enrich data quality and analytical rigor.
Footnotes
Acknowledgements
We want to express sincere gratitude to Prof. Hau Kit-Tai for his constructive advice and invaluable insights, which significantly enhanced the quality of this article.
Funding
The author(s) received no financial support for the research, authorship, and/or publication of this article.
Data Availability
Data is available on PISA’s official website (https://www.oecd.org/pisa/). The appendices are provided in the OSF (![]() ).
).
Received: September 2, 2024
Accepted: April 10, 2025