
Abstract
The popularity of self-report surveys brings to light the issue of insufficient effort responding (IER), where participants lack motivation to respond thoughtfully, thereby compromising data quality. A prevalent form of IER, known as straightlining, occurs when participants consistently select the same response for multiple items, leading to potentially biased outcomes. Typically, researchers apply a uniform threshold criterion across all response options (e.g., nine consecutive identical answers in any option are considered problematic). Considering the diverse or near-normal distribution patterns in questionnaire responses, employing varied thresholds for different options may be more appropriate. This study utilized both simulated data and real, large-scale international survey data to examine the likelihood of straightlining as IER across various options. The findings revealed that legitimate straightlining (non-IER) was more common at the extremes than in the middle options. Moreover, the study highlights the significant risks of incorrectly categorizing non-IER straightlining as IER without corroborating evidence. In conclusion, our results question the conventional approaches to eliminating straightlining, including (a) the application of a uniform cutoff value across different options or adopting stricter criteria for middle options and (b) the direct removal of straightlining as IER without additional verification.
1. Introduction
Insufficient effort responding (IER) poses a significant threat to the data quality in Likert-scales (Arias et al. 2020; Meade and Craig 2012). Straightlining, a common manifestation of IER in Likert scales, occurs when participants select uniform responses for consecutive items to conserve cognitive effort, regardless of the content and direction of the items (Arias et al. 2020; Vriesema and Gehlbach 2021). Although many researchers have emphasized the necessity of identifying and removing straightlining responses before conducting proper analyses (e.g., Dunn et al. 2018; Kim et al. 2018; Meade and Craig 2012), there is few guidance on how to address straightlining across different options (e.g., whether nine consecutive “4”s are as problematic as nine consecutive “3”s). Therefore, the present research examined theoretical distributions under various hypothetical conditions to recommend strategies for establishing appropriate cutoff values for straightlining across different options.
1.1. Insufficient Effort Responding and Straightlining
Likert scales are commonly used to collect data in psychological, educational, or other social science research (Bucher and Sand 2022; Houtenville et al. 2021). However, as the surveys have no direct consequences on the respondents, some of them may answer irresponsibly, in an IER manner. They may not spend effort answering due to inattentiveness, exhaustion, or speeding (Curran 2016; Hong et al. 2020; Huang et al. 2015; Tawa 2021). IER is close to the concept of “satisficing,” which refers to suboptimal decision-making strategies to conserve respondents’ cognitive energy (Simon 1957). When participants do not have the motivation to respond carefully, they may just try to provide a response rather than respond to the specific content of the items (Krosnick 1991). As one common kind of IER or satisficing, straightlining helps respondents conserve their mental energy by endorsing the status quo by applying one satisfactory answer to different items consecutively in one scale (Yan 2008). This issue is exacerbated when respondents quickly answer a series of questions on a single scale, as they are more likely to overlook items with reversed phrasing or varied content (Krosnick 1991).
The problem of straightlining is especially prevalent for questions in grid format, with the design of all items sharing the same responding options in the form of a matrix (Debell et al. 2021; Mavletova et al. 2018; Roßmann et al. 2018). Items in the grid format can have a carryover effect, in which participants likely provide similar responses when they notice similarities across items (Dillman et al. 2014).
Identification and removal of straightlining responses are essential, without which straightlining will have a detrimental impact on estimates of psychometric properties, such as inter-item correlation, alpha, and the component structure (Arias et al. 2020; DeSimone et al. 2018; Yan 2008). DeSimone et al. (2018) showed that straightlining had a more pronounced impact on data quality than random responding (another IER type).
1.2. How Many Consecutive Identical Responses Should be Considered as IER?
As a direct and useful indicator of IER, straightlining behavior is used widely to detect potential IER (e.g., Huang et al. 2012; Meade and Craig 2012; Vriesema and Gehlbach 2021; Zhang and Conrad 2014). In practice, straightlining participants are flagged as IER when they tick identical responses consecutively over a preset cutoff value (Costa and McCrae 2008; Dunn et al. 2018; Hong et al. 2020; Meade and Craig 2012; Steedle et al. 2019). However, there is no consensus on whether one single cutoff value for all options or different values should be used for different options.
Some researchers conveniently set one cutoff value for straightlining responses without considering the position of options (DeSimone et al. 2018; Dunn et al. 2018; Meade and Craig 2012; Vriesema and Gehlbach 2021). That is, these researchers assumed respondents were equally likely to choose consecutively in different options, whereas others thought their likelihood varied across options. Thus, supporting the latter belief, Costa and McCrae (2008) flagged the participants as IER when they had at least six “strongly disagrees,” nine “disagrees,” ten “neither agree nor disagrees,” fourteen “agrees,” or nine “strongly agrees” in the Minnesota Multiphasic Personality Inventory (MMPI) scale. Johnson (2005) proposed a scree-like test method (cutoff at the sudden drop in the scree plot of the longest response string frequencies) and selected 9, 9, 8, 11, and 9 as cutoff values for Options 1 to 5, respectively, in his study. Subsequent research also adopted this “scree-like” strategy to determine the cutoff values for each option (Hong et al. 2020; Huang et al. 2012). Nevertheless, none of these researchers explained why different cutoff values were chosen for different options, nor did they provide theoretical or empirical justifications for their choices.
In sum, there is no unanimous view about whether we should have different cutoff values for straightlining for different options. Theoretical rationales for doing or not doing so have not been well-researched.
1.3. IER Likelihood in Straightlining
The assumption that researchers can eliminate straightlining IER using uniform cutoff values across various options rests on the belief that a specific option neither increases nor decreases the likelihood of straightlining. However, this assumption should not be accepted until two related research questions are addressed: (a) If it is assumed that most items approximate a normal distribution with more frequent responses in the middle than at the extremes, should we consider a longer straightlining IER cutoff for the central options? (b) Is the incidence of straightlining as IER equally probable across all options in actual data?
A significant challenge in applying a single cutoff value for different options when detecting straightlining is the participants’ tendency to prefer specific options, which deviates from a random selection of each option with equal probability. Indeed, Schulz et al. (2012) observed participants adopting specific patterns even when asked to choose numbers randomly. Additionally, Keusch and Yang (2018) found a propensity for respondents to select options on the lower end of a scale. Consequently, if participants naturally show longer sequences of the same response for particular options, it is crucial to recalibrate the straightlining cutoff for those options. Analogously, if non-IER participants tend to agree more often than disagree, consecutive agreements should be expected to occur more frequently than disagreements, suggesting that the cutoff for identifying agreeing IERs should be higher than for disagreeing.
Moreover, as straightlining encompasses both IER and non-IER responses (Reuning and Plutzer 2020), it is vital to evaluate the frequency of IER and non-IER in straightlining for each option. If straightlining for a particular option is primarily due to IER, it may be feasible to eliminate such patterns with minimal risk of removing valid responses. Conversely, if straightlining predominantly represents valid responses, treating them as IER brings a significant risk of discarding valid responses. Therefore, addressing straightlining necessitates a customized approach, with flagging criteria individually tailored for each option.
1.4. Differences due to Position of Options: Middle Versus Two Ends
The tendency to exhibit a centrality bias in responding to questionnaires is expected, where participants are more inclined to select middle choices and less likely to choose the extremes. Previous research by Shaw et al. (2000) has confirmed that individuals tend to favor middle options over extreme ones when faced with a series of similar items. In our study, we explored the influence of the location of response options—whether situated in the middle or at the two ends of the scale—on the propensity of respondents to engage in straightlining behavior. Considering that the orientation of options on Likert scales may vary, ascending or descending, we simplified our approach for clarity and assumed a symmetrical distribution; thus, we only compared the end options with those in the middle. In the context of this study, “middle options” are defined as those choices that do not occupy the outermost positions on the scale. For example, on a 4-point scale (1–4), the middle options would be 2 and 3; on a 7-point scale (1–7), the middle options would range from 2 to 6.
1.5. Mathematical Formulation for Straightlining in Valid Responses (Non-IER)
Referring to related research (Reuning and Plutzer 2020), mathematically, the

where K is the chosen number from the range of response options for question j (e.g., 1, 2, 3, or 4 in a 4-point scale),
The formulation of a straightlining behavior from Item j to Item j + n can be expressed mathematically like this:
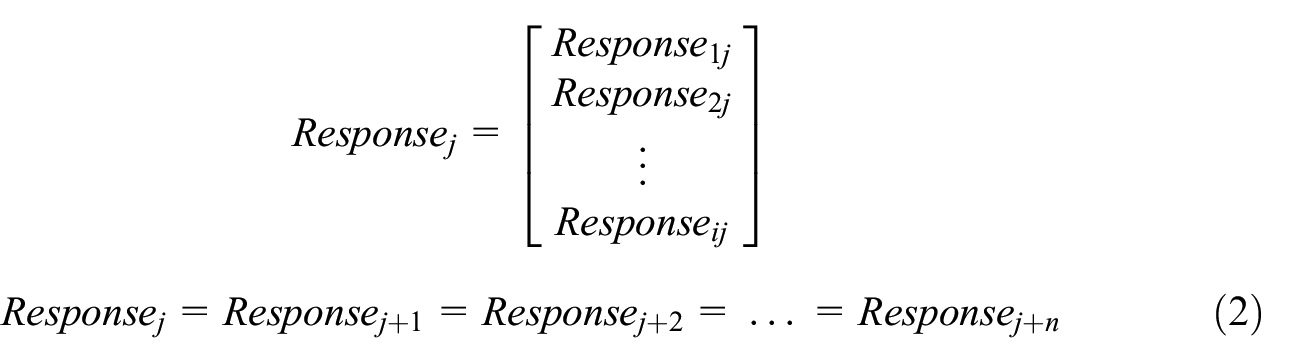
The
1.6. The Present Research
In the context of Likert scales, no guidelines address the detection of straightlining with respect to the position of options. The present research examined whether the position of the option (extreme ends vs. middle options) influenced the incidences of straightlining and, consequently, how to establish criteria for flagging straightlining across various options. To this end, we conducted a series of three studies.
Study 1 calculated and compared the incidences of straightlining for each option, using simulating non-IER data. It provided a controlled environment to identify natural straightlining incidences across different options without the influence of IER.
Study 2 assessed the effectiveness of applying a uniform cutoff value for identifying straightlining without regard to option positions. During this stage, IER was deliberately added to the simulated non-IER responses, allowing investigation into the risk of misidentifying straightlining for different options.
Study 3 sought to corroborate the simulated findings by examining real survey data. Specifically, PISA data was analyzed to assess the prevalence of IER in straightlining for each response option, aiming to strengthen the conclusions drawn from the first two simulations.
The findings from these studies could provide recommendations for researchers on the application of cutoff values for straightlining, taking into account the potential impact of the option’s position on the scale.
2. Study 1: Estimating Valid Straightlining (Non-IER) at Different Options
Often neglected by most researchers, despite the chance being very small, non-IER participants may also coincidently select a consecutive long string of identical choices. To evaluate such an assumption and phenomenon, we calculated the frequency of straightlining within valid responses (non-IER) to establish baseline incidences for each option. This study assessed the incidences of straightlining among different options using simulated valid responses and investigated how this incidence varied with different attributes of the scales.
2.1. Design of the Simulation
In the simulation, each responding choice can be influenced by the factor loading
It was posited that the frequency distribution of these options approximated a normal curve, with middle options such as “agree” being more commonly selected than extremes like “completely agree.” Therefore, the “common” level was defined with the following characteristics: item loading of .7, four response options in ascending order (where larger values indicate a stronger trait), and a normal distribution pattern for the options. To explore the effects of these three manipulated factors, we set the “contrast” level at: an item loading of .4 (compared to .7 at the “common” level), a 7-point scale (in contrast to the “common” 4-point scale), and a uniform distribution (in contrast to the normal distribution at the “common” level), resulting in a 2 × 2 × 2 factorial design.
Specifically, for 4-point scales, the normal distribution yielded frequencies of 15%, 35%, 35%, and 15% for Options 1 through 4, respectively, whereas the uniform distribution produced 25% for each of the four options. For 7-point scales, the normal distribution resulted in frequencies of 5%, 10%, 20%, 30%, 20%, 10%, and 5% for Options 1 through 7, respectively, while the uniform distribution yielded approximately 14% for each of the seven options. We simulated responses on a nine-item scale for each of the eight conditions (2 × 2 × 2), generating 100,000 datasets for each scenario.
We computed and compared the frequency of straightlining for each option in the eight conditions. Specifically, for each option, the maximum number of consecutively chosen identical option (ranging from 0 to 9, e.g., seven consecutive Option 1) was counted for every respondent. Then, we counted the respondents who had straightlining with a specific length (0–9) for each option. For instance, for the straightlining with eight consecutive responses on the first option (responding with “1, 1, 1, 1, 1, 1, 1, 1”), we counted the number of participants who chose eight consecutive “1” (excluding nine “1”). For eight types of scales, each option’s straightlining with a length from 1 to 9 is shown in Tables A1 and A2.
Our interest was to identify instances of IER straightlining; therefore, we focused on the longer patterns of straightlining involving nine consecutive identical responses (Figure 1). By comparing the likelihood of straightlining across options among non-IER participants, we could establish a baseline of straightlining for each option in making recommendations for IER deletion.
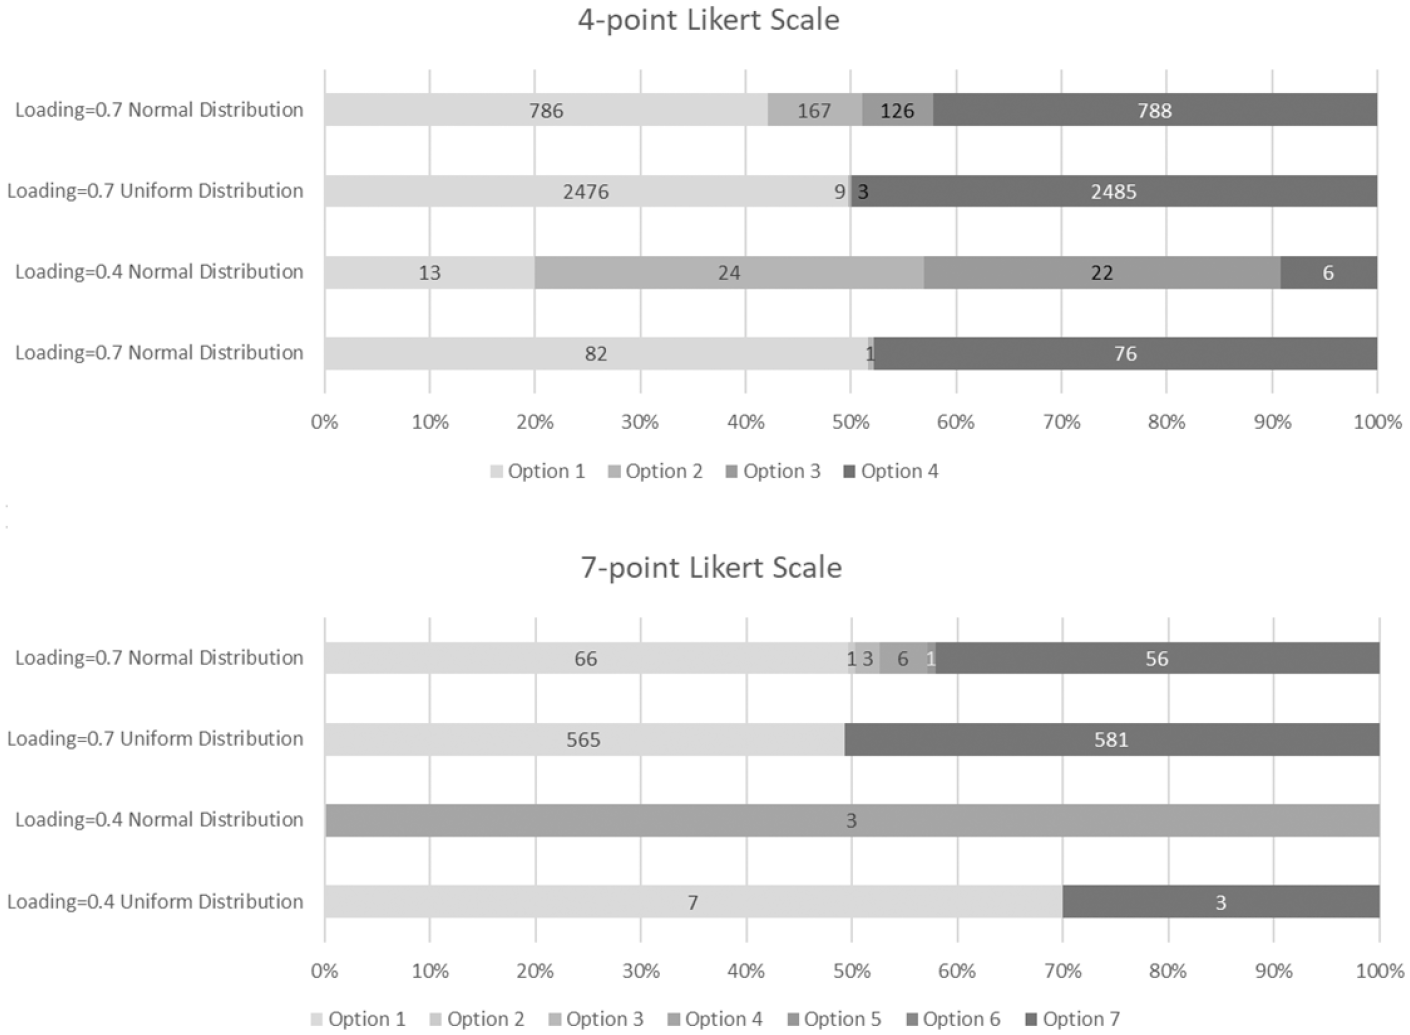
Number and proportion of straightlining at different options for 4-point scale (top) and 7-point scale (bottom).
2.2. Results
In most situations, the longest straightlining (selecting an identical option on nine questions) tended to happen more frequently at the two ends rather than in the middle. Under most situations, more straightlining was found at the first and last options than at the middle options, manifested by the longer bars on two-ended options (Figure 1, corresponding to the lightest subsections and the darkest subsections in the Likert scale). As all our data were non-IER, if all the longest straightlining were to be treated as IER, then more valid straightlining on the extreme options would be wrongly flagged as IER than in the middle options.
In the condition with low item loadings (.4) and normal frequency distribution, we observed higher incidences of straightlining on the middle options compared to the ends. However, the total number of straightlining for all options was negligible. For example, only 65 out of 100,000 respondents showed straightlining behavior in the 4-point Likert scale, and only 3 in the 7-point Likert scale. Thus, basically, straightlining in non-IER data tended to be more prevalent at the ends than the middle options.
The comparison of the two kinds of distribution (normal vs. uniform, Figure 1) showed that the uniform distribution produced more straightlining at the two ends and less at the middle (Figure 1). The bars in Figure 1 containing “uniform distribution” are always dominated by the lightest and the darkest color (options at the two ends). This reflected comparatively more responses at the two ends in the uniform distribution than in the normal distribution.
Notably, when the number of options increased from 4 to 7 (Figure 1, the graph at the top vs. the graph at the bottom), or item loading decreased from .7 to .4, the total number of straightlining decreased. This was because identical answers would reduce when there were more choices or items were less correlated with each other. Thus, fewer options (4-point) or higher item loading (.7) led to more straightlining in non-IER responses.
3. Study 2: Consequences of Using the Uniform Cutoff Values for Straightlining in Different Options
Study 2 examined the potential risks of applying a uniform cutoff value for straightlining across different options. Specifically, we introduced instances of straightlining that were actually IER into the pool of valid responses and assessed the rate of erroneous removal (non-IER straightlining) at each option.
3.1. Design of Simulation
By adding IER straightlining responses to non-IER responses, we examined the consequences of correct and wrong removal of potential IER data when all the longest straightlining responses were removed as IER. We used a typical situation with a 4-point scale, .7 item loading, and normally distributed responses to show the consequences of using the same cutoff value.
Three kinds of straightlining data were simulated as real IER and then added into non-IER responses respectively, including (a) straightlining with a normal distribution (15%, 35%, 35%, and 15% for Options 1–4, respectively), (b) straightlining with uniform distribution (25% for each of options), (c) straightlining with a close-to-U-shape distribution (e.g., 42%, 8%, 8%, 42%), which may be close to the empirical distribution detected in PISA data. Two levels of IER proportions (3% and 15%) which consisted of (a) an equal number of straightlining responses in seven, eight, and nine items (e.g., 1% responses showed identical answers for seven, eight, and nine consecutive items, respectively, 1% × 3), or (b) only straightlining on nine items (e.g., 3%), were added to non-IER responses, respectively. The purpose was to examine the consequences of our IER removal strategies under different conditions. Totally, 3 IER Distribution × 2 IER Proportions × 2 Length of Straightlining (7–9 and only 9) of IER were added to a non-IER data set.
Utilizing the established IER status, we assessed the precision of applying a uniform cutoff value (where straightlining IER was equal to or greater than 7 or 9 for the two respective levels of straightlining length). Precision referred to the proportion of the real IER in the sample flagged as IER; the larger, the better.
3.2. Results
Simulation results revealed the drawbacks and significant consequences of indiscriminately applying the same cutoff value to eliminate straightlining responses across four options. Effective elimination is characterized by high precision rates, which imply fewer incorrect removals of non-IER responses and more accurate removals of IER responses. The findings indicated that, under most scenarios (Table 1), options at the two extremes exhibited a lower precision rate in detecting straightlining IER than the middle options when using the uniform cutoff value. For example, in the scenario with a normal distribution of IER and an added 3% of nine straightlining as IER, the precision rate was only 36% to 37% for the extreme options, significantly less than the 88% for the middle options. Consequently, utilizing the same cutoff value across options led to a higher risk of incorrect non-IER removal at the extremes compared to the middle. The issue of incorrect removal (low precision) became relatively widespread when the IER proportion increased from 3% to 15%. As the percentage of IER in the dataset increased (comparing 3% with 15% IER, as shown in Table 1), precision rates improved for all options. Furthermore, introducing shorter sequences of straightlining, such as selecting seven and eight identical consecutive responses (as noted in the columns “straightlining 7, 8, 9” in Table 1), would reduce precision rates for all options. This implies that including short straightlining IER can lead to a decrease in precision when identifying straightlining behaviors. This general observation was altered only when the IER straightlining exhibited a U-shaped distribution (Table 1). Under these conditions, the precision rate was similar or even higher for straightlining at the extremes compared to the middle option.
Precision Rates in Using the Same Cutoff Values for Options at Two Ends and at the Middle.
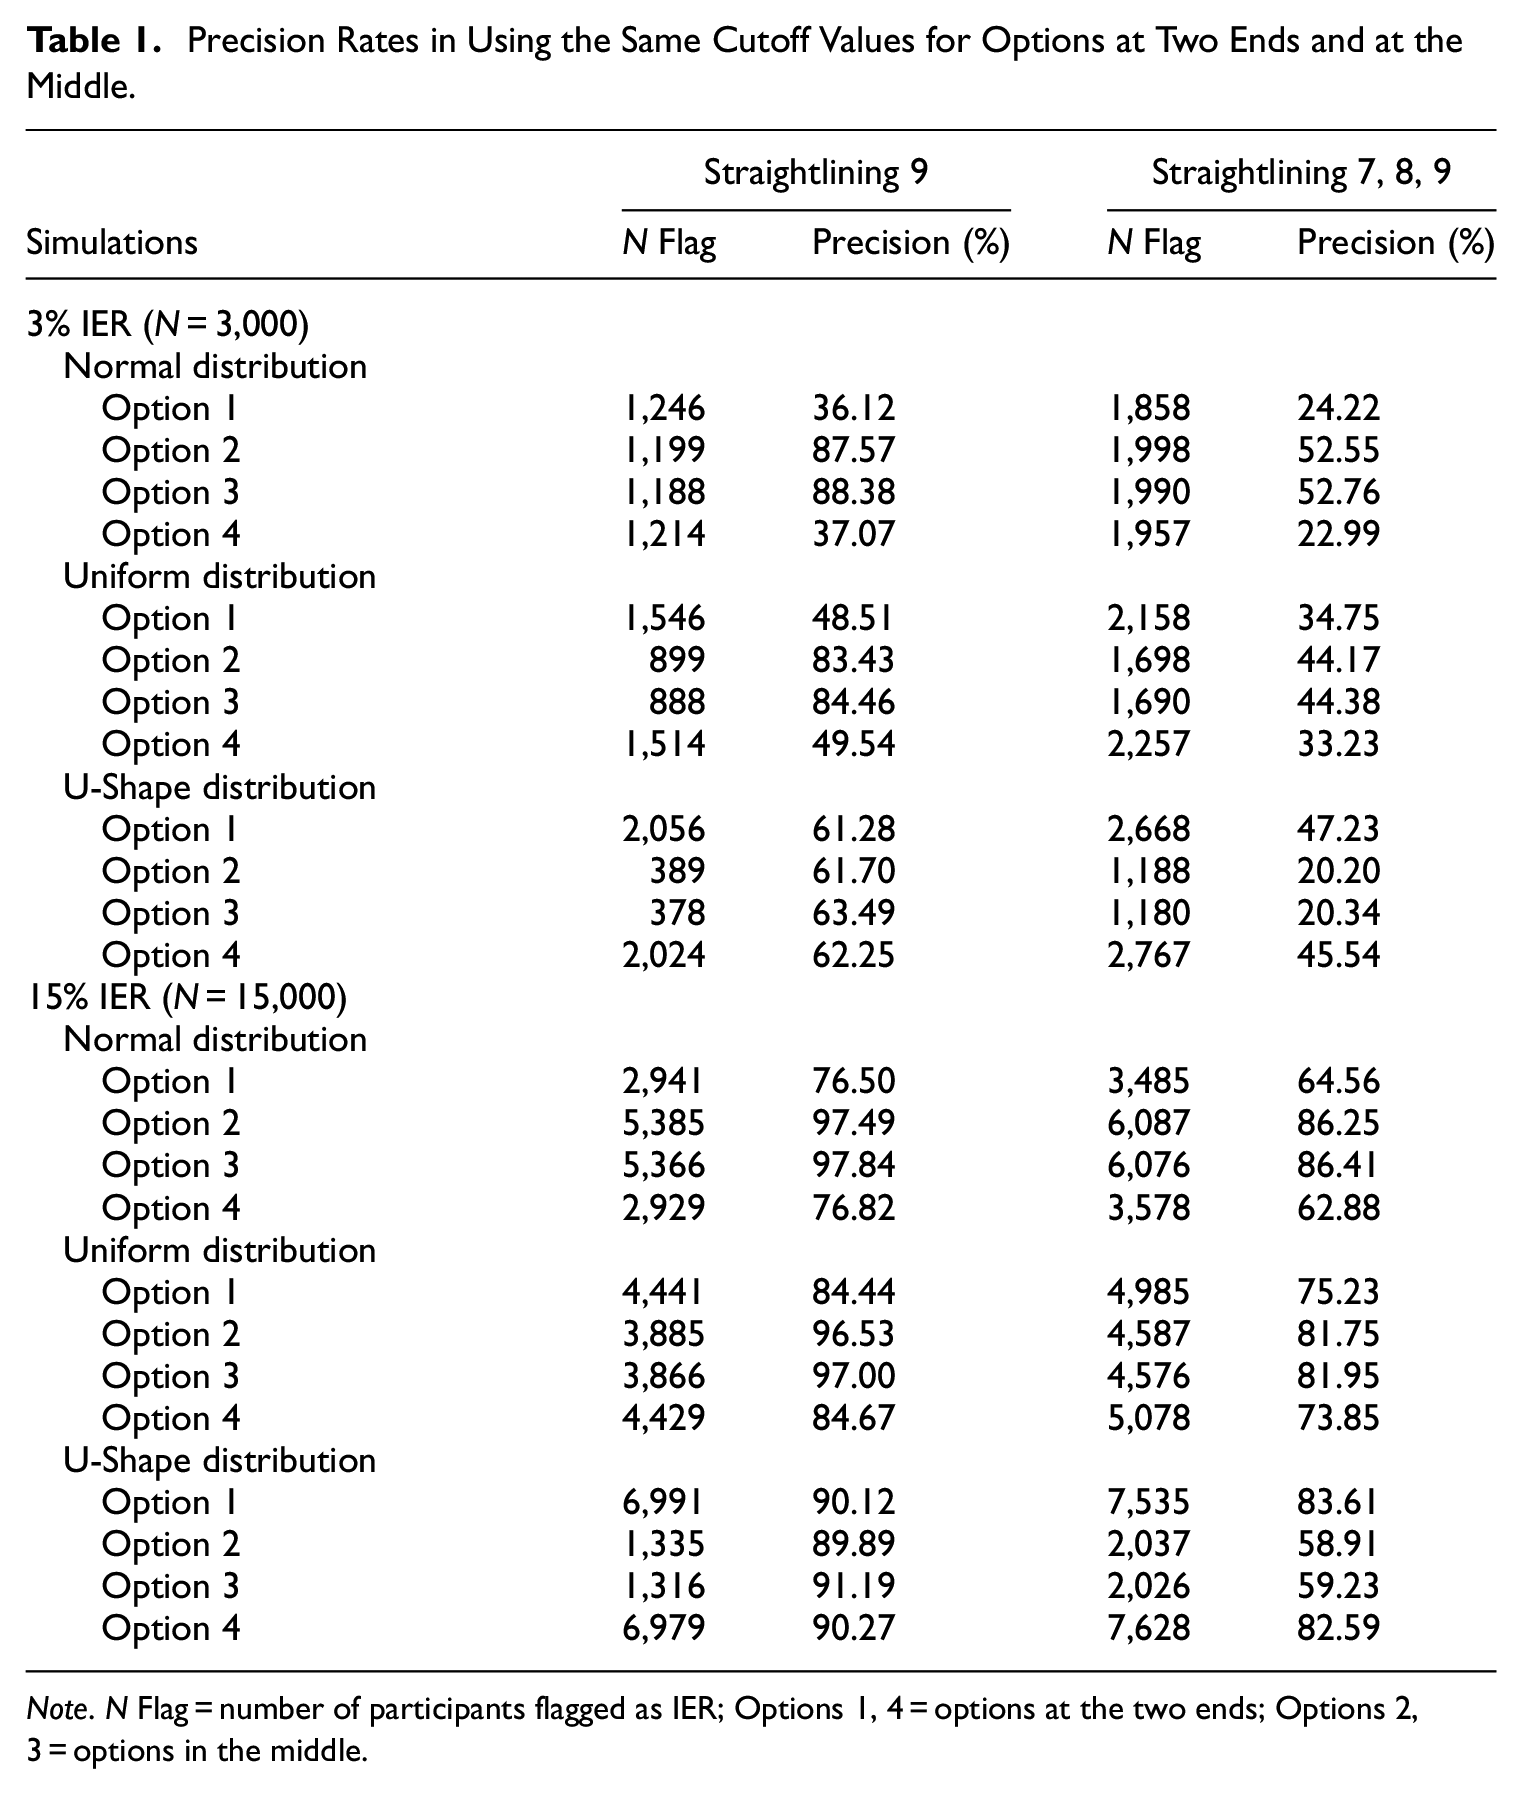
Note. N Flag = number of participants flagged as IER; Options 1, 4 = options at the two ends; Options 2, 3 = options in the middle.
In summary, the simulations demonstrated that the proportion of IER, the frequency distribution of IER straightlining, and the length of straightlining could all affect the precision rates for each option when identifying suspect straightlining responses. To examine potential factors possibly influencing IER, it would be beneficial to validate and support these findings with empirical data, which was the objective of our Study 3.
4. Study 3: IER Likelihood in Straightlining Across Options in Empirical Data
Although the above two simulation studies showed the baseline of straightlining across options and the potential problems of using the uniform cutoff value to detect IER straightlining, examining and interpreting these issues using authentic empirical data is necessary. Study 3 explored how IER straightlining likelihood varied across options in the large-scale international survey data PISA 2015. The 2015 cycle was chosen because of the availability of relatively long scales.
4.1. Method
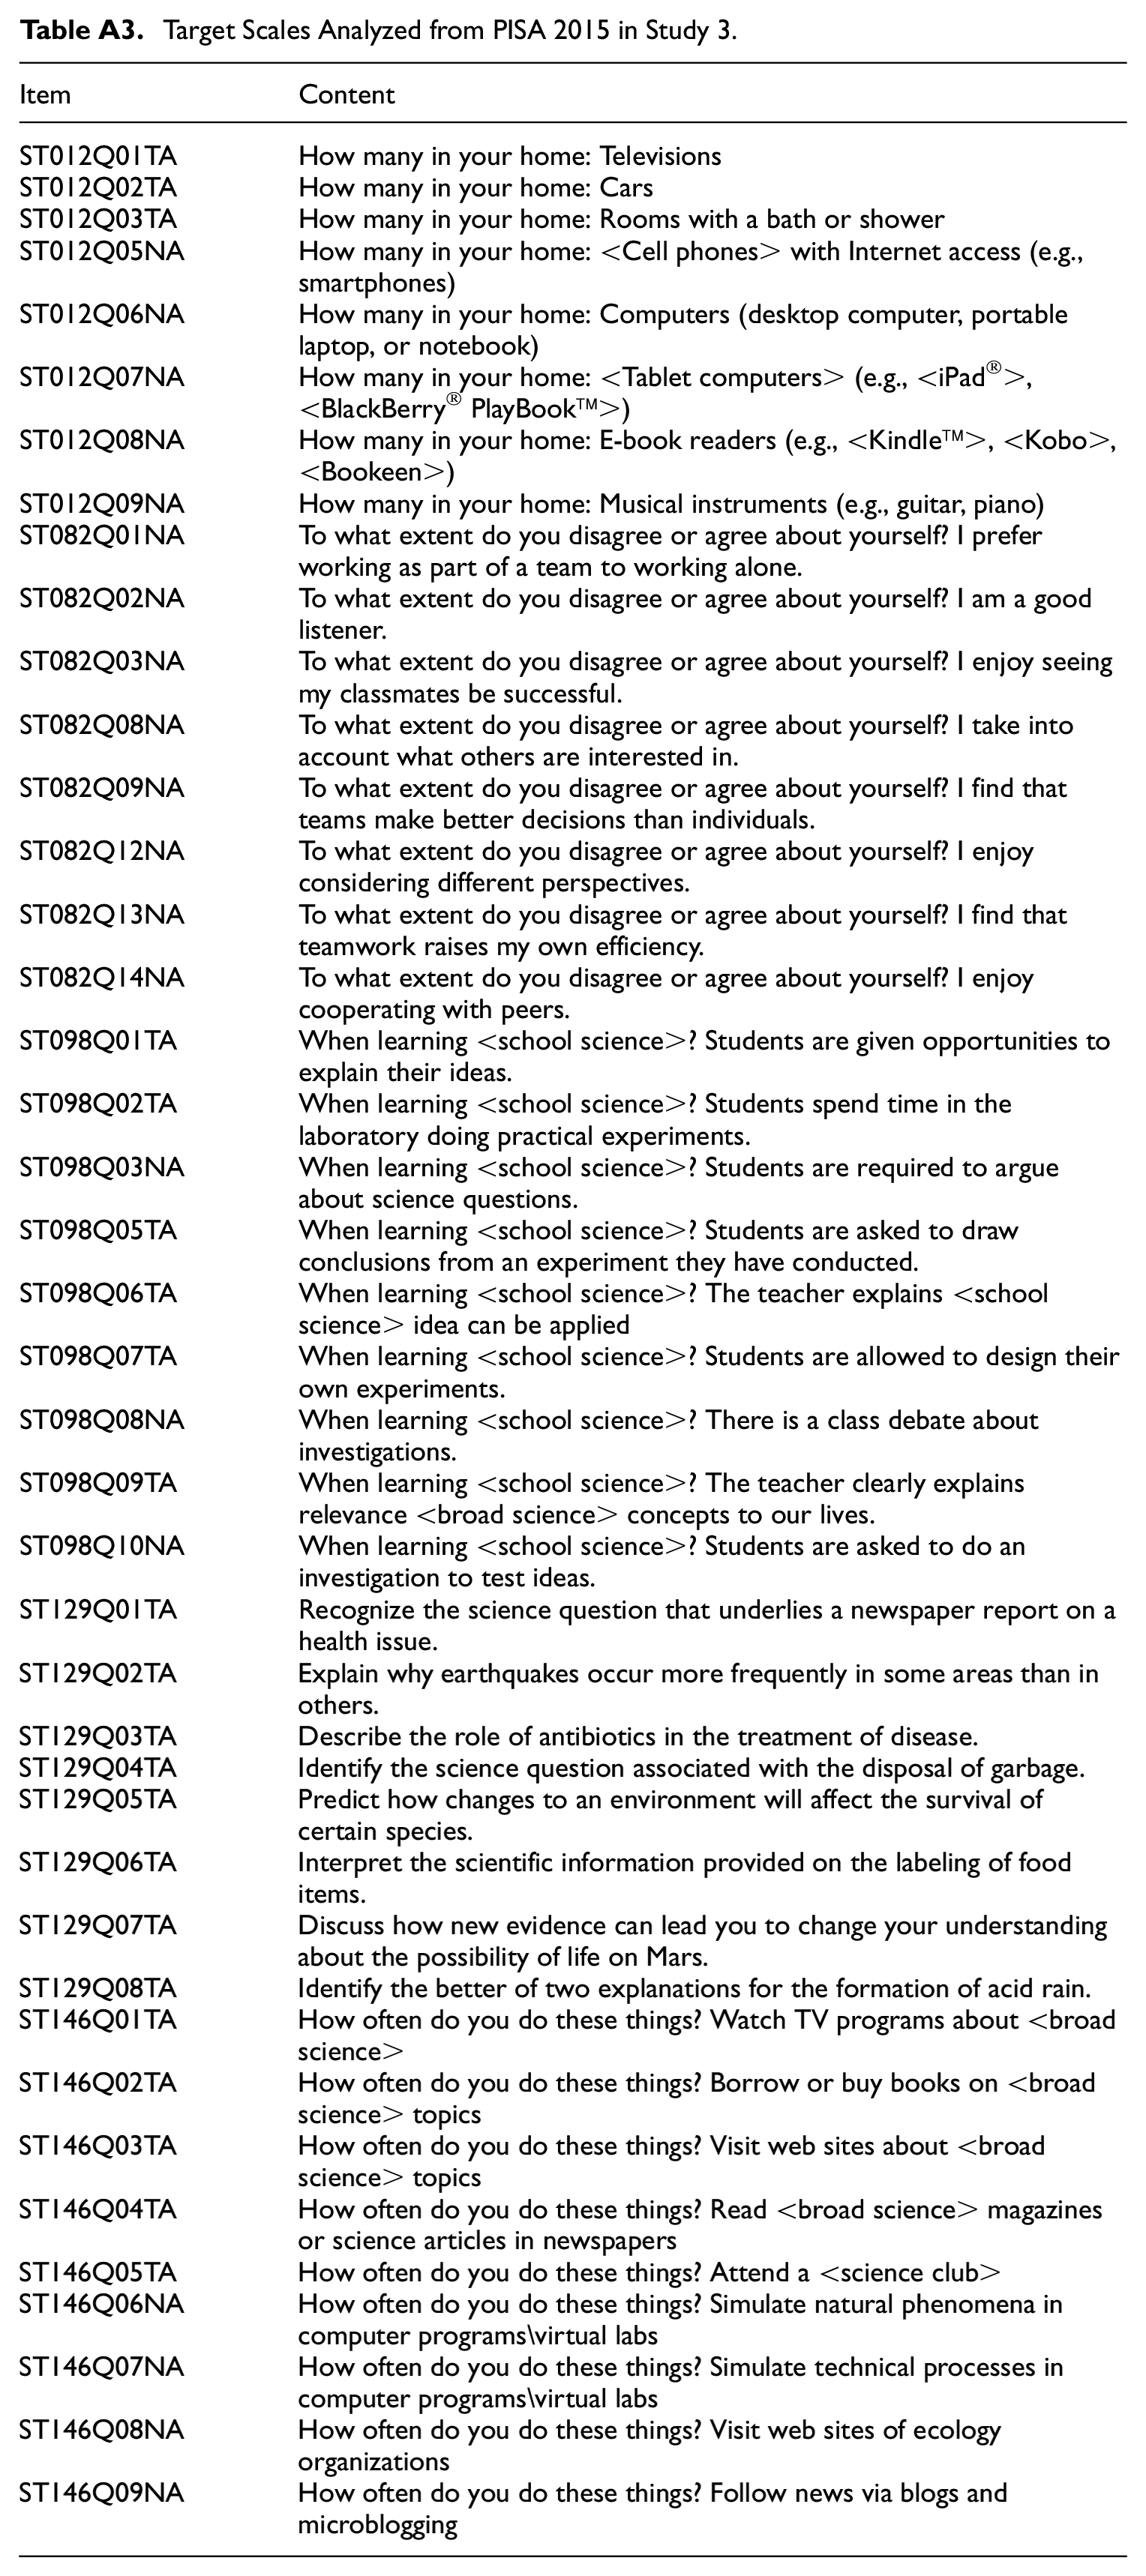
In the PISA 2015 assessment, five 4-point Likert scales, each comprising a minimum of eight items, were employed to examine the association between the likelihood of IER and straightlining across options (OECD 2017). Further specifics of the scales under consideration are provided in Table A3. The five scales included:
inquiry-based science teaching and learning practices (ST098; e.g., “Students are given opportunities to explain their ideas”),
family property (ST012; e.g., “How many televisions at your home”),
students’ dispositions for collaborative problem solving (ST082; e.g., “I am a good listener”),
science self-efficacy (ST129; e.g., “Recognize the science question that underlies a newspaper report on a health issue”), and
science activities (ST146; e.g., “How often do you do these things? Watch TV programs about <broad science>”).
Totally, responses from 5,713 students in the USA were used. Inattentive items were widely used to label IER in real data (Arias et al. 2020; Kim et al. 2018; Nichols and Edlund 2020). Following earlier research that showed responding time was correlated with IER straightlining strongly (Zhang and Conrad 2014), we classified IER (coded 1) and non-IER (coded 0) according to individuals’ responding time and their answers on the attentive item ST121 in the PISA student questionnaire. Students were considered as IER in responding when (a) their average responding time of the target scale was one second or less; or (b) they provided incorrect answers to ST121 (e.g., participants were told “<NAME 1> gives up easily when confronted with a problem and is often not prepared for his classes”; participants would be considered IER (attentive) if they “totally agreed” or “agreed” in rating that “<Name 1> is motivated”). Then we counted the number of IER and the number of non-IER among the respondents using the longest straightlining for each option. Admittedly, students with short response time were not necessarily all straightliners (they could be IER of another type), and straightliners’ response time was not necessarily all unreasonably short, we postulated that there would be some detectable relation for us to triangulate the two constructs.
4.2. Results
Comparing respondents classified by their answers on ST121, we found that those identified as potentially exhibiting IER were more prone to give nonsensical answers or to skip open-ended questions than their non-flagged counterparts. This difference was statistically significant (t = 8.752, p < .001), indicating that respondents who answered ST121 incorrectly were less motivated to complete the questionnaire thoroughly. Then, based on the flagging derived from ST121 and response time, the data revealed that the proportions of IER differed across each option’s straightlining for the five scales. For instance, straightliners on the second option of ST012 were 100% IER, whereas the IER for the last option (on the right end) was only 15.38% (Table 2). Therefore, a cutoff value of 8 might be effective for eliminating straightlining responses for the second option but less appropriate for the fourth option. In essence, students marking “4, 4, 4, 4, 4, 4, 4, 4” on ST012 should not be assumed to have the same likelihood of exhibiting IER as those who selected “2, 2, 2, 2, 2, 2, 2” on this scale. This is due to the fact that even attentive respondents might consistently choose the last option on this scale.
Proportions of IER Straightlining for Each Option.
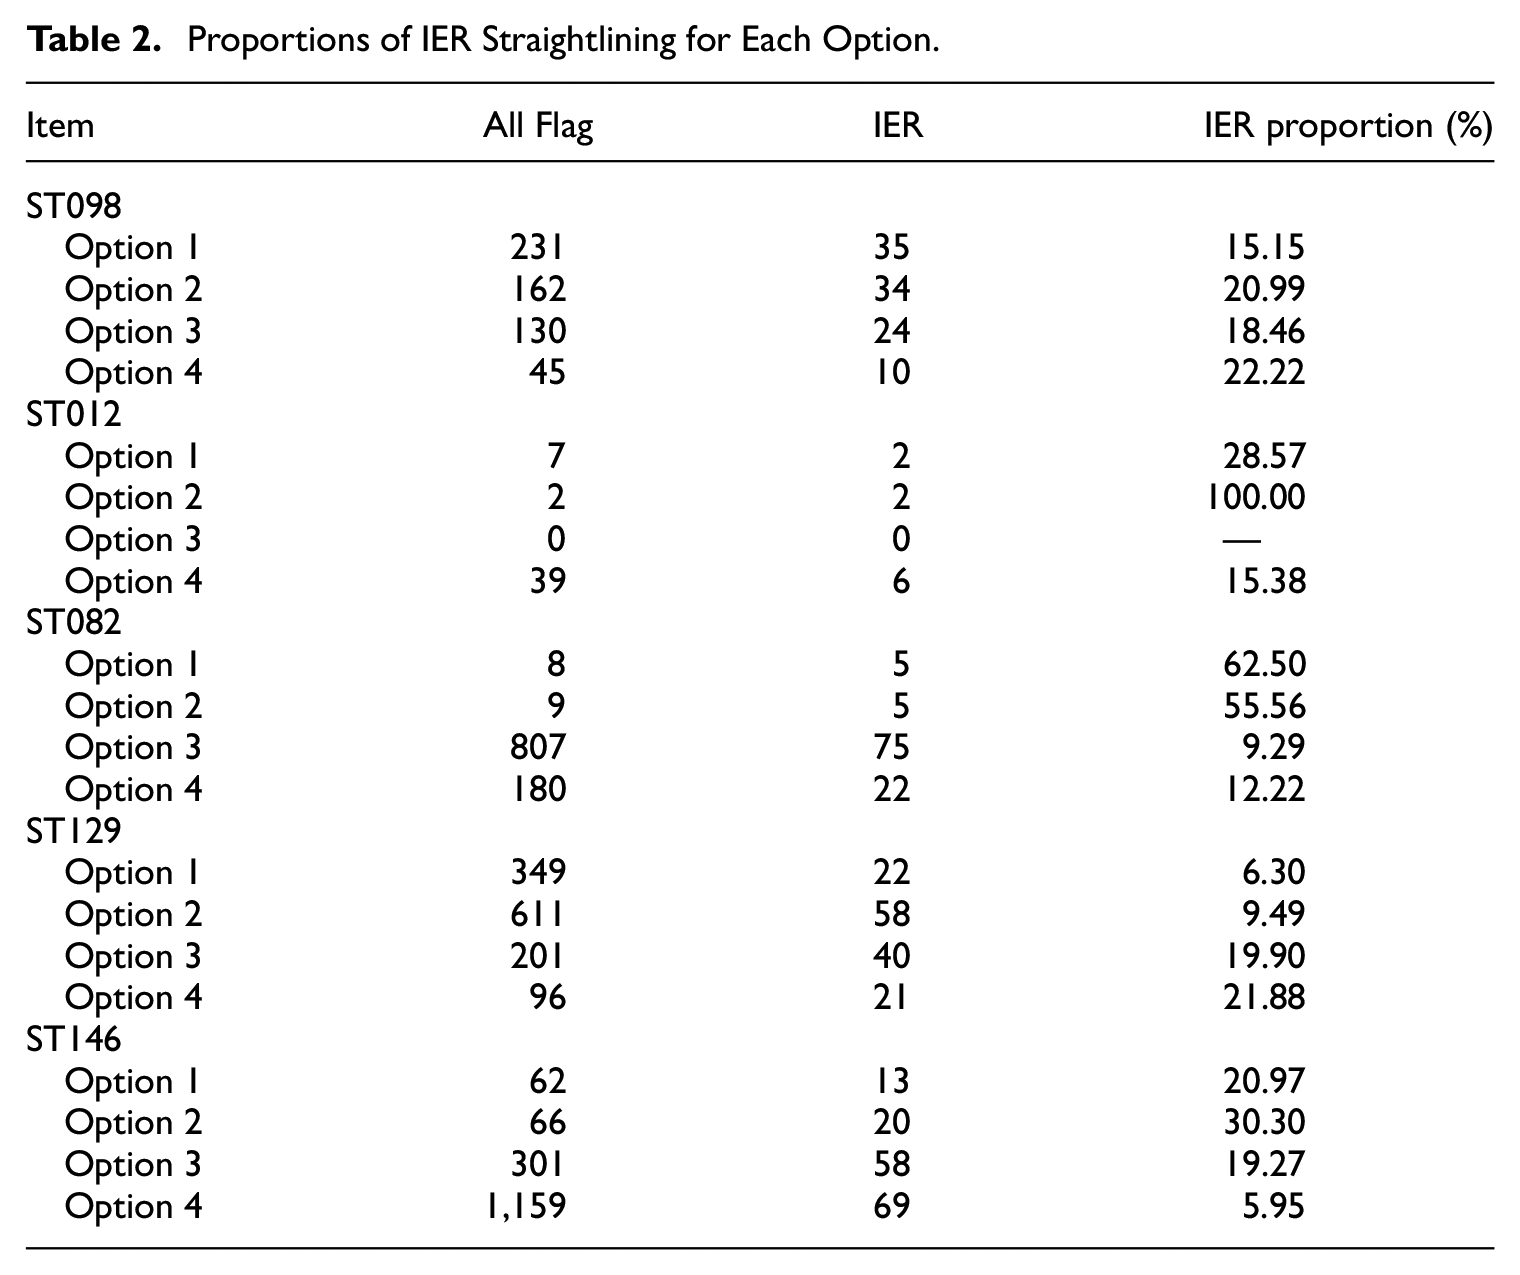
Unexpectedly, IER proportions in straightlining were small for most scales. Other than ST012 and ST082, the scales less than 31% IER straightlining. In ST146, by classifying the longest straightlining across all options as IER, only 160 participants would be correctly identified and removed, amounting to 10% of the 1,588 participants flagged for straightlining (summed across options in Table 2).
5. Discussion
5.1. Inappropriateness of Using a Uniform Cutoff Value for Straightlining Across Options
Our findings raise important questions about the common practice of applying a uniform cutoff value for detecting straightlining as IER. The data from this study suggest that straightlining is not uniformly distributed across all response options. This pattern was corroborated by the empirical data from PISA, indicating that such behavior is not a random occurrence but is related to the position of the response options. For example, in scale ST012, a sequence of extreme option “1, 1, 1, 1, 1, 1, 1, 1” was less likely to indicate IER, with a precision rate of 28.57%. In contrast, a sequence of the middle option “2, 2, 2, 2, 2, 2, 2, 2” had a 100% chance of representing genuine IER. The use of an identical cutoff value disregards the differential risk associated with removing valid versus invalid straightlining responses based on option position.
The implication is clear: a one-size-fits-all approach in removing the same percentage of IER from all options to cleaning data from straightlining may lead to the erroneous exclusion of valid data, potentially skewing the results of a study. Researchers must consider the position of options when establishing cutoff values for straightlining, ensuring they account for the inherent differences in generating straightlining. This could involve developing scale position-specific cutoff values or adopting more sophisticated statistical techniques to differentiate between potential IER and non-IER. By doing so, we can improve the accuracy of data-cleaning processes and enhance the validity of research findings.
5.2. Against Common Sense—Valid Straightlining More Often at Two-End Options
Contrary to the conventional practice of setting a strict cutoff value for detecting straightlining in middle options (based on the assumption that valid straightlining is more prevalent there), a simulation study using non-IER data demonstrated otherwise. The study found that “legitimate” straightlining occurred more frequently at the two-end options than at the middle option, even with respondents selecting each option with equal probability on the scale (uniform distribution). This was more obvious for scales with higher item loadings and fewer options.
Although some researchers realize the necessity of using different cutoff values to detect straightlining for different options, they usually select stricter thresholds (i.e., more consecutive same answers to be considered IER) for middle options than those at the two ends in applied empirical research. For instance, Johnson (2005) proposed a scree-like test to determine the cutoff value for straightlining across options and picked 6, 9, 10, 14, and 9 for each response category from “very inaccurate” to “very accurate.” Similarly, Costa and McCrae (2008) adopted for their Neo personality inventory-revised (NEO PI-R) thresholds of: 6, 9, 10, 14, and 9 for five points, respectively, while Huang et al. (2012) used 7, 7, 12, 10, and 8 for this scale. All of them had stricter cutoff values (a larger value for the same consecutive answers as IER) for the middle option than those for the two-end options, which was in the opposite direction to results in our simulation results (i.e., straightlining more frequently at two ends).
Our simulated data showed more frequent straightlining at the two-end options and less frequent at the middle options, suggesting severe wrong removal of non-IER data (for some extreme straightlining) in these studies. Results with the PISA data also suggested more frequent removal of non-IER straightlining responses at the two ends for most of the scales (except ST082 and ST129, Table A3).
The above results, contradictory to researchers’ expectations, are likely due to high item loadings in the questionnaire scale. A good-construct scale has large item loadings (e.g., .7), reflecting the high inter-correlations among the items in the scale. Careful non-IER respondents are supposed to provide consistent answers across various items. Thus, on a 4-point scale, consistent respondents who choose the first option (“1”) at the beginning of the scale will likely continue to choose the first option or the option near it. That is, there is a strong likelihood of having “1” or “2” in the subsequent item for consistent respondents starting with “1.” In contrast, consistent respondents starting with the middle option “2” may choose “1,”“2,” and “3” in the subsequent item. Thus, even though the frequency of selecting options at the two ends is lower than that at the middle option, straightlining at the two ends can happen more frequently than middle straightlining. Notably, our study examined scales with relatively few points (e.g., 4 points), so the two ends started with reasonably large percentages compared to a scale with more points (e.g., 7 points). Thus, there is a greater likelihood of observing more relatively long straightlining at the two ends on a 4-point scale than on a 7-point scale (Figure 1).
Despite the method being used in many studies, we do not recommend the scree-like test method to determine the cutoff values for straightlining across options (e.g., Hong et al. 2020; Huang et al. 2012; Steedle et al. 2019). The scree-like test assumes the change in the frequency of straightlining reflects the change in IER seriousness. However, our simulation results show that the characteristics of scales (number of options, item loadings, and the distribution of the options) can induce more non-IER straightlining responses, especially for options at two ends. Thus, it is uncertain whether the sudden change in straightlining is caused by IER straightlining or non-IER straightlining, rendering the scree-like test dubious.
5.3. Problems in Wrong Removal of Straightlining
Although IER can be manifested as straightlining, not all straightlinings are IER. Previous research through Monte Carlo simulations showed that this is a typical fallacy of falsely affirming the consequent and non-IER straightlining would increase when the quality of survey questions improved (increasing factor loadings of items; Reuning and Plutzer 2020). Consistent with the results of the simulated data, the PISA data showed a different trend across options. PISA data showed that the straightlining percentages differed across the four options with less real IER in the longest straightlining. For ST012 and ST082, deleting the longest straightlining for some options (e.g., the second option for ST012, and the first option for ST082) was acceptable. However, for ST098, ST129, and ST146, the longest straightlining for each option contained a large number of non-IER straightlining. At least 70% of the longest straightlining may be non-IER straightlining for these scales, alerting us to the seriousness of wrong removal of non-IER data when using the strictest cutoff value for straightlining in some scales.
Some careful non-IER respondents may still provide straightlining responses on some scales, and we cannot assume all straightliners to be IER. Our simulation studies showed that under some conditions (e.g., high item loadings and fewer options), there is more non-IER straightlining. Just imagine the extreme situation for a scale with the highest item loading “1” and only two options for each item. It is likely that respondents will tick identical options consecutively. It would lead to more frequent straightlining because the contents among items are similar, and there are only two options. Thus, for the scales with high item loadings and fewer options, straightlining responses should not be taken for granted to be IER without other converging evidence.
5.4. Recommendations and Limitations
Based on our research findings, we propose three practical recommendations for survey researchers:
Utilize variable cutoff values for straightlining based on the choice options. Distinct response options warrant different straightlining cutoff values, with more stringent criteria for extreme options where non-IER straightlining is more likely to occur.
We cannot assume all straightliners to be IER, particularly on scales with high positive item loadings and few response options (e.g., dichotomous scales). Straightlining in these contexts may not necessarily be all IER. Conversely, on scales with low item loadings or scales with negatively worded items where item loadings are high in the negative direction, and with a broader range of response options (e.g., 7-point scales), straightlining is more indicative of IER.
Enhance the correct detection of IER by considering a comprehensive set of indicators in addition to the straightlining criterion. This multifaceted approach aids in distinguishing genuine from spurious response patterns. These indicators may include: Response Time: Monitor abnormally rapid response time which may imply a lack of thoughtful consideration. Bowling et al. (2021) suggested that items answered in less than two seconds on one page might be flagged for potential IER. Infrequent Items: These are items typically endorsed at low rates, such as “I have been to every country in the world” (Meade and Craig 2012). Unusually, high agreement with these items is indicative of IER. Instructed Response Items: Insert specific items requiring respondents to follow instructions to confirm their attentiveness. For example, “Please answer ‘Somewhat disagree’ for this question” (Nichols and Edlund 2020) can check for respondent’s compliance and attention. Self-report Engagement: Deploy single-item self-assessments at the end of the survey to gauge the respondent’s effort and attention, such as “I put forth ____ effort toward this study” or “In your honest opinion, should we use your data in our analyses for this study?” (Meade and Craig 2012). These self-reports can provide valuable insight on respondent’s engagement with the study.
The findings from this research added valuable insights into the phenomenon of straightlining in survey research, yet they come with limitations. The first limitation is that the IER detected in Study 3 may represent only a subset of the total IER present in the dataset. Given that no method can guarantee the detection of all types of IER, some IER responses may inevitably slip through unnoticed. In Study 3, IER designation was based on responses to an attention-check item and the analysis of response times. While this method is informative, it might not encompass all possible types of IER. As a result, our approach could miss certain instances of IER, potentially underestimating the prevalence and impact of straightlining associated with IER in the dataset. To address these limitations, future research should incorporate a more extensive set of IER indicators, which would allow for a more comprehensive assessment and deeper understanding of the straightlining behavior in survey responses.
The second limitation of this study is the lack of concrete guidance on establishing cutoff values for straightlining across different response options. Although the research sheds light on how the positioning of options can influence straightlining, it stops short of providing definitive cutoff points for each option. The research indicates that the determination of straightlining cutoffs should be context-specific, reflecting the range of response options and the nuances of the survey context, which renders the establishment of universal cutoff values for straightlining infeasible. Moreover, the study did not consider the potential effects of survey design elements such as question order randomization and the inclusion of both positive and negative item phrasings. These factors are known to influence both the manifestation of straightlining and its detection (Robie et al. 2022; Vriesema and Gehlbach 2021). Therefore, to effectively address and mitigate straightlining, future research should integrate these critical survey design aspects.
At last, further investigation is needed to understand how exclusion based on straightlining affects the representativeness of survey data and the implications for data quality, including validity and reliability, across demographic groups. By refining the criteria for detecting straightlining and examining its impact on survey outcomes, researchers can enhance the utility and accuracy of survey data in capturing the nuances of human responses.
Footnotes
Appendix
Target Scales Analyzed from PISA 2015 in Study 3.
| Item | Content |
|---|---|
| ST012Q01TA | How many in your home: Televisions |
| ST012Q02TA | How many in your home: Cars |
| ST012Q03TA | How many in your home: Rooms with a bath or shower |
| ST012Q05NA | How many in your home: <Cell phones> with Internet access (e.g., smartphones) |
| ST012Q06NA | How many in your home: Computers (desktop computer, portable laptop, or notebook) |
| ST012Q07NA | How many in your home: <Tablet computers> (e.g., <iPad®>, <BlackBerry® PlayBook™>) |
| ST012Q08NA | How many in your home: E-book readers (e.g., <Kindle™>, <Kobo>, <Bookeen>) |
| ST012Q09NA | How many in your home: Musical instruments (e.g., guitar, piano) |
| ST082Q01NA | To what extent do you disagree or agree about yourself? I prefer working as part of a team to working alone. |
| ST082Q02NA | To what extent do you disagree or agree about yourself? I am a good listener. |
| ST082Q03NA | To what extent do you disagree or agree about yourself? I enjoy seeing my classmates be successful. |
| ST082Q08NA | To what extent do you disagree or agree about yourself? I take into account what others are interested in. |
| ST082Q09NA | To what extent do you disagree or agree about yourself? I find that teams make better decisions than individuals. |
| ST082Q12NA | To what extent do you disagree or agree about yourself? I enjoy considering different perspectives. |
| ST082Q13NA | To what extent do you disagree or agree about yourself? I find that teamwork raises my own efficiency. |
| ST082Q14NA | To what extent do you disagree or agree about yourself? I enjoy cooperating with peers. |
| ST098Q01TA | When learning <school science>? Students are given opportunities to explain their ideas. |
| ST098Q02TA | When learning <school science>? Students spend time in the laboratory doing practical experiments. |
| ST098Q03NA | When learning <school science>? Students are required to argue about science questions. |
| ST098Q05TA | When learning <school science>? Students are asked to draw conclusions from an experiment they have conducted. |
| ST098Q06TA | When learning <school science>? The teacher explains <school science> idea can be applied |
| ST098Q07TA | When learning <school science>? Students are allowed to design their own experiments. |
| ST098Q08NA | When learning <school science>? There is a class debate about investigations. |
| ST098Q09TA | When learning <school science>? The teacher clearly explains relevance <broad science> concepts to our lives. |
| ST098Q10NA | When learning <school science>? Students are asked to do an investigation to test ideas. |
| ST129Q01TA | Recognize the science question that underlies a newspaper report on a health issue. |
| ST129Q02TA | Explain why earthquakes occur more frequently in some areas than in others. |
| ST129Q03TA | Describe the role of antibiotics in the treatment of disease. |
| ST129Q04TA | Identify the science question associated with the disposal of garbage. |
| ST129Q05TA | Predict how changes to an environment will affect the survival of certain species. |
| ST129Q06TA | Interpret the scientific information provided on the labeling of food items. |
| ST129Q07TA | Discuss how new evidence can lead you to change your understanding about the possibility of life on Mars. |
| ST129Q08TA | Identify the better of two explanations for the formation of acid rain. |
| ST146Q01TA | How often do you do these things? Watch TV programs about <broad science> |
| ST146Q02TA | How often do you do these things? Borrow or buy books on <broad science> topics |
| ST146Q03TA | How often do you do these things? Visit web sites about <broad science> topics |
| ST146Q04TA | How often do you do these things? Read <broad science> magazines or science articles in newspapers |
| ST146Q05TA | How often do you do these things? Attend a <science club> |
| ST146Q06NA | How often do you do these things? Simulate natural phenomena in computer programs\virtual labs |
| ST146Q07NA | How often do you do these things? Simulate technical processes in computer programs\virtual labs |
| ST146Q08NA | How often do you do these things? Visit web sites of ecology organizations |
| ST146Q09NA | How often do you do these things? Follow news via blogs and microblogging |
Funding
The author(s) declared that they received no financial support for the research, authorship, and/or publication of this article.
Received: May 2023
Accepted: June 2024