
Abstract
Careless responses by survey participants threaten data quality and lead to misleading substantive conclusions that result in theory and practice derailments. Prior research developed valuable precautionary and post-hoc approaches to detect certain types of careless responding. However, existing approaches fail to detect certain repeated response patterns, such as diagonal-lining and alternating responses. Moreover, some existing approaches risk falsely flagging careful response patterns. To address these challenges, we developed a methodological advancement based on first-order Markov chains called Lazy Respondents (Laz.R) that relies on predicting careless responses based on prior responses. We analyzed two large datasets and conducted an experimental study to compare careless responding indices to Laz.R and provide evidence that its use improves validity. To facilitate the use of Laz.R, we describe a procedure for establishing sample-specific cutoff values for careless respondents using the “kneedle algorithm” and make an R Shiny application available to produce all calculations. We expect that using Laz.R in combination with other approaches will help mitigate the threat of careless responses and improve the accuracy of substantive conclusions in future research.
Data collection through surveys is subject to considerable data quality threats because of careless response behaviors (DeSimone et al., 2015). Careless responding, also referred to as random response (Beach, 1989), insufficient effort responding (Huang et al., 2012; Huang & DeSimone, 2021), or inattentive responding (Curran, 2016), occurs when participants respond to survey questions without paying sufficient attention to the items or the instructions (Meade & Craig, 2012). Careless responding leads to serious consequences such as distorted means and covariance structures, item correlations, factor loadings, and construct dimensionality (Arias et al., 2020; Goldammer et al., 2020; Huang et al., 2015b; Kam, 2019; Kam & Meyer, 2015). Problems caused by careless responding are not just mere methodological curiosities. Careless respondents damage scales’ reliability, leading researchers and practitioners to rely on distorted and imprecise measures (Arias et al., 2020; Huang et al., 2012; Maniaci & Rogge, 2014). In addition, because it inflates and/or deflates Type I error rates, careless responding leads to over- and underestimation of the strength of relations between variables (e.g., Goldammer et al., 2020; Huang et al., 2015b; Maniaci & Rogge, 2014).
Careless responding can be broadly categorized into random responding and nonrandom patterned responding, with the latter including straightlining (i.e., identical consecutive responses) and seesaw responding, which comprises repeated response patterns such as diagonal-lining (e.g., 1-2-3-4-5-4-3-2), alternating extreme pole responses (e.g., 5-1-5-1-5-1-5-1) and alternating responses with low variance (e.g., 4-5-4-5-4-5-4-5) (DeSimone et al., 2018; Meade & Craig, 2012; Ulitzsch et al., 2022). Unfortunately, there is abundant evidence that careless responding is pervasive in organizational survey research (Goldammer et al., 2020). For example, base rates of careless responding range from 3.5% (Johnson, 2005) to 10.6% (Kurtz & Parrish, 2001) and even more than 50% (Baer et al., 1997), depending on how careless responding is measured. Given the increased popularity of online surveys (e.g., Ward & Meade, 2023), addressing careless responding has become an even more urgent methodological challenge.
Prior research has developed several robust precautionary (e.g., page time and instructed response items) and post-hoc procedures to detect careless responding (as described in the next section of our article). While we acknowledge that proposed solutions developed to date are undoubtedly helpful in detecting a specific type of careless responding, we provide evidence that existing approaches fail to detect other careless response patterns or falsely flag careful response patterns that are particularly pernicious in leading to incorrect substantive conclusions. Therefore, we developed a posthoc procedure to detect patterned careless responding: the Lazy Respondents (Laz.R) index. Our Laz.R index differs from existing solutions because we use first-order Markov chains to measure the degree to which participants display careless response behavior. This methodological innovation relies on the premise that, for careless respondents, the last response is a useful predictor of the following response. Consequently, our approach is more powerful in detecting nonrandom patterned responding, such as straightlining and seesaw responding, as it employs a broader definition of patterned responding and serves as a valuable addition to other procedures.
The remainder of our article is structured as follows. First, we briefly overview existing precautionary and post-hoc measures of careless responding and highlight their limitations. Next, we describe the development of Laz.R and compare the reliability and validity provided by careful and careless respondents as identified by Laz.R. We also compare Laz.R to the most widely used precautionary and post-hoc measures of careless responding using large, publicly available datasets as well as in an experimental study. By doing so, we provide empirical evidence that Laz.R improves validity compared to existing approaches. Specifically, we ascertained that Laz.R correctly identifies patterns of careless respondents that some or all other indices overlook. In addition, we describe how to use the “kneedle algorithm” (Satopää et al., 2011) to identify sample-specific cutoff values needed to distinguish careful versus careless respondents. Lastly, we provide specific recommendations on using Laz.R and introduce a user-friendly R Shiny application to detect careless respondents in future research.
Existing Approaches for Detecting Careless Respondents and Their Limitations
Approaches for detecting careless respondents can be classified into two main types (Curran, 2016; Meade & Craig, 2012). First, precautionary approaches aim to prevent careless response behaviors through survey design choices, such as including specific items or scales, which capture a variety of careless response behaviors but are not always feasible or available (e.g., when researchers use archival data; Hill et al., 2022). On the other hand, posthoc approaches, sometimes labeled indirect measures (Goldammer et al., 2020), are based on conducting analyses after data collection and usually analyze response patterns based on item content or order. These approaches use different logical concepts, including pattern indices, outlier analysis, and consistency indices, to detect cases of content nonresponsivity.
Precautionary Approaches
This section summarizes the most common precautionary measures. More extensive discussion of these and other approaches can be found in Bowling et al. (2023), Curran (2016), DeSimone et al. (2015), Meade and Craig (2012), and Ward and Meade (2023). 1
Response Time
This technique excludes respondents based on a minimum response time for the entire survey, survey pages, or single items. The rationale is that a minimum amount of time is needed for “careful” respondents to cognitively process the questionnaire items, recall response-relevant information, and translate this information into a response (Bowling et al., 2023; Huang et al., 2012).
Self-Reported Indicators
Self-reported indicators are attention-check questions that ask participants whether they answered carefully and honestly or whether they paid sufficient attention or devoted effort to the study (e.g., “I carefully read every survey item,” Meade & Craig, 2012).
Infrequency Items
Infrequency items, also known as bogus items, prompt for unambiguous correct or incorrect responses (e.g., “I have never used a computer,” Huang et al., 2015a). These items can be used at several points throughout the survey to identify participants who fail one or more items (DeSimone et al., 2015).
Instructed Response Items (IRIs)
IRIs are items such as “respond with strongly disagree for this item.” These items have the advantage that answers are clearly instructed and give no leeway for expected responses (Meade & Craig, 2012). Like infrequency items, these questions can be used at several points throughout the survey to screen out participants who failed at least once.
Inability to Recognize Item Content
Bowling et al. (2023) argued that careless respondents are less likely to read and process the content of a questionnaire thoroughly and, thus, would be less likely to recognize item content. The authors asked survey participants to respond to ten multiple-choice questions about the content of items they previously included in their main survey.
While the precautionary approaches are useful and valuable, they also have limitations. For example, participants often perceive self-reported indicators, infrequency items, and instructed response items as insulting, especially when they voluntarily participate in the study. Crowdsourcing platform participants (e.g., MTurk) are quite familiar with such items and, thus, easily detect and correctly respond to them even though they do not carefully respond to each item throughout the questionnaire. Moreover, researchers often find themselves in situations that do not allow for changes in survey design ex-post (e.g., when they use secondary data sources) or require further statistical steps to detect careless respondents after data collection. Therefore, posthoc measures, which we describe next, are essential.
Post-Hoc Approaches
Longstring Index
This technique builds on the idea that careless respondents resort to answering patterns in which they repeatedly choose an identical answer option, called strings (Costa & McCrae, 2008; Johnson, 2005). Based on the computation of either the maximum string or the average string length, cases of careless responses are identified (Meade & Craig, 2012). For example, an answer pattern of 1-1-1-1-1-2-2 on a scale from 1 = disagree to 5 = agree includes a string of length five (1-1-1-1-1) and a string of length two (2-2), resulting in a maximum string of 5 and an average string of 3.5. The longstring index is limited in terms of the types of detectable patterns. For example, it can detect straightlining but not cases where respondents chose any other pattern, like seesaw response patterns (e.g., 1-2-3-4-5-4-3-2-1 or 1-2-1-2-1-2-1).
Mahalanobis Distance
As an outlier index (Aguinis et al., 2013), the Mahalanobis distance (D; Mahalanobis, 1936) has also been suggested to detect careless respondents (Meade & Craig, 2012). Mahalanobis D flags respondents who respond substantially atypically compared to others in the sample. It is computed as the multivariate distance between a respondent's response vector and the vector of the sample means. High values indicate high deviances from the sample mean on Mahalanobis D, and further attention is needed since they might be careless respondents. There is no clear cutoff, but outliers can be detected with the help of a quantile plot (as implemented by the R careless package). Clearly, careless responding is not the only reason why a respondent might deviate from typical respondents. Thus, focusing on Mahalanobis D might lead researchers to discard accurately responding and “interesting” outliers (Aguinis et al., 2013).
Intraindividual Response Variability (IRV)
IRV measures an individual's standard deviation of responses across a set of consecutive items (Dunn et al., 2018). The implementation of this index varies across studies. Some propose that careless respondents have a particularly low IRV and thus have a relatively invariant response pattern (e.g., 1-2-1-2-1-2-1; Dunn et al., 2018; Goldammer et al., 2020). If researchers follow the recommendation to flag participants with a low IRV, they cannot detect cases where respondents chose seesaw response patterns (e.g., 1-5-1-5-1-5-1-5 or 1-2-3-4-5-4-3-2-1). In a test of popular indices’ effectiveness in detecting careless responses, Goldammer et al. (2020) found that IRV does not perform better than chance.
Psychometric/Semantic Synonyms (PsychSyn) and Antonyms
These consistency indices determine whether participants contradict themselves across item pairs. Specifically, this involves computing within-person correlation across item pairs with a strong positive (negative) sample correlation (threshold |r| > .6; Goldberg & Kilkowski, 1985; Johnson, 2005; Meade & Craig, 2012). Responses are considered careless if the correlations are not consistent with the underlying notion of synonymy. These consistency indices are not able to detect cases where careless respondents choose central tendency patterns (e.g., 3-3-3-3-3-3-3). Also, these options require the survey to query related items regarding synonymy. In cases where only a few items that are not highly correlated are included in the survey, consistency indices underperform regarding careless responding detection.
Person-Fit Statistics for Polytomous Items Using Item-Response Theory (IRT)
Person-fit statistics can be used to identify inconsistent item score patterns within the sample or based on the fit of an IRT model (Niessen et al., 2016). Overall, IRT models describe the probability of a respondent choosing a specific answer to an item based on their latent traits (e.g., personality or intelligence). These models calculate the likelihood of a respondent with a particular trait level selecting a particular answer option, and a low likelihood indicates an inconsistent item score pattern. Two examples are the nonparametric number of Guttman errors GPoly (Meijer et al., 1994) and the lzpoly statistic for polytomous items (Drasgow et al., 1985). Guttman errors occur when a respondent's answers deviate from the expected hierarchical pattern of response options on a polytomous item. The expected hierarchical pattern is based on the popularity of each item step in the sample (e.g., from strongly disagree to disagree). lzpoly is defined as the standardized log-likelihood of an item score vector under an IRT model (see Drasgow et al., 1985, for computational details on the computation).
Laz.R: Theoretical Background and Computation
Careless respondents choose low-effort routes to complete a survey as quickly as possible. In other words, they click through questions without paying much attention to the item's content. From a theory standpoint, Laz.R identifies low-effort routes through a survey and detects careless response patterns. From a statistical standpoint, Laz.R is based on first-order Markov chains. The usefulness of Markov chains in identifying careless respondents was first pointed out by Stark et al. (2017), but their research focused on dichotomous items with the same answering probabilities.
To illustrate the theory underlying Laz.R, consider a situation involving the development of a personality assessment instrument. Our instrument includes 50 items, each rated on a Likert scale, to keep our illustration simple, with anchors ranging from 1 = disagree to 4 = agree. Lucy, our first participant, is the prime example of a straightliner and checks the same scale anchor on the left (1 = disagree) for all 50 questions. So, in the data file, Lucy's resulting sequence is “1-1-1-1-1-1-1-1…1.” John is also a careless respondent but is slightly more creative and uses a seesaw pattern. He starts with the item anchor on the left, moves stepwise to the right, back to the left, and so forth. Thus, John's sequence of answers is “1-2-3-4-3-2-1-2…1-2.” As a third illustrative participant, Emma reads all questions carefully and tries to answer truthfully. She selects scale anchors that reflect her personality best and selects the answers “4-2-2-3-3-4-2-1” for the first eight questions. Her answering behavior does not follow a simple pattern based on item order.
Laz.R uses participants’ response patterns to detect careless respondents. It is based on the notion that careless respondents’ answers to the next question are contingent on the previous answer. Accordingly, analyzing patterns and transitions across answers reveals whether item sequence or item content determines a participant's response behavior. This consists of three steps (please see “Supporting Materials A: Details on Laz.R Computation” for additional technical information in the Supplemental Material).
Step 1: Transition Matrix
In the first step, we summarize patterns of answers in a transition matrix
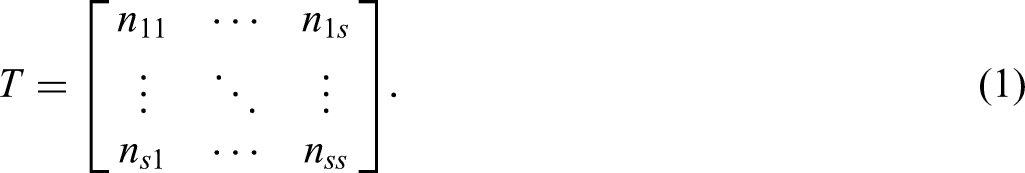
In our example, the element n12 indicates the absolute number of cases when a1 is followed by a2 in an individual's answer sequence. For example, we find this transition at the beginning of John's answering sequence and whenever he starts counting upwards again.
Step 2: Transition Probability Matrix
Based on the transition matrix, we compute a transition probability matrix
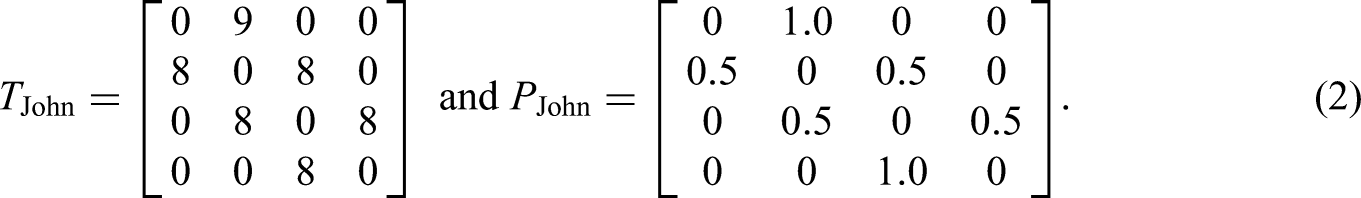
For John, equation 2 shows that a1 is always followed by a2, and a2 is either followed by a 1 or a 3, which results from his pattern consisting of 1-2-3-4-3-2-1. Accordingly, the transition probabilities for 2 are p21 = 0.5 and p23 = 0.5, and p22 = p24 = 0, as the two latter transitions do not occur in John's answering pattern. Mathematically, this can be understood as the first-order Markov chain transition probability because we compute the probability for the following state solely based on the current state. For John's case, it might seem plausible to include not only his latest answer to predict the f answer. If we know the answer that precedes the 2, we know whether he is currently counting upwards or downwards and, hence, if a1 or a3 will follow. Note, however, that transition matrices and transition probability matrices for higher-order Markov processes are much more complex, and we will later show that first-order Markov chains can also identify such cases of careless responding.
Step 3: Laz.R Scores
In the next step, we multiply each element of
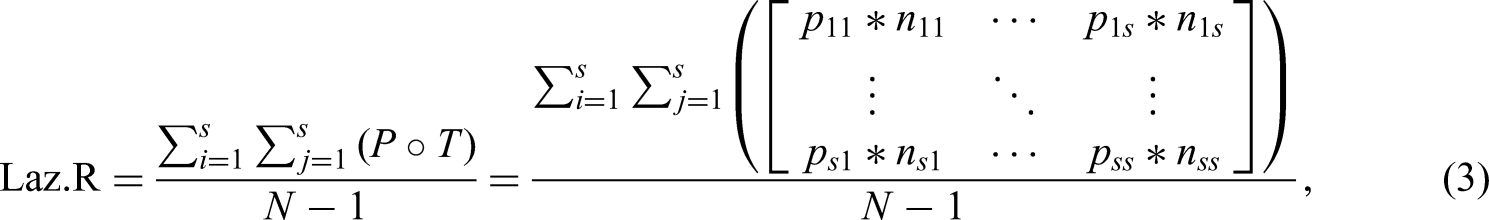
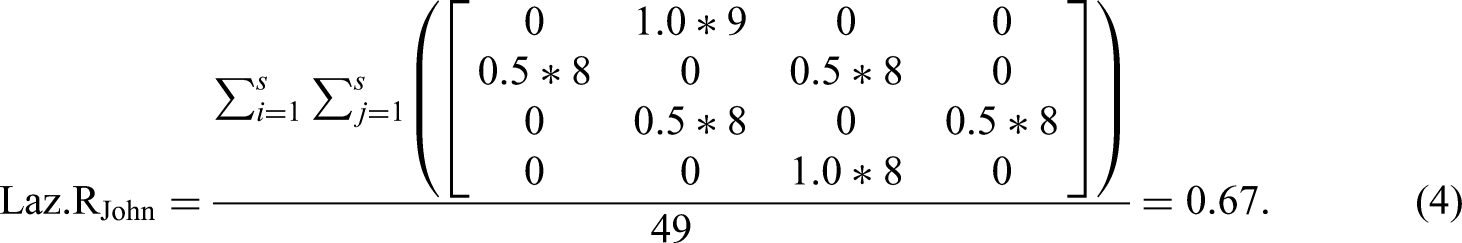
John's prediction accuracy is relatively high with Laz.RJohn = 0.67 because of his patterned response behavior. Laz.R scores of careful respondents should be much lower, as their responses are less likely to exhibit discernible patterns (please see “Supporting Materials A: Details on Laz.R Computation” for an extended example in the Supplemental Materials).
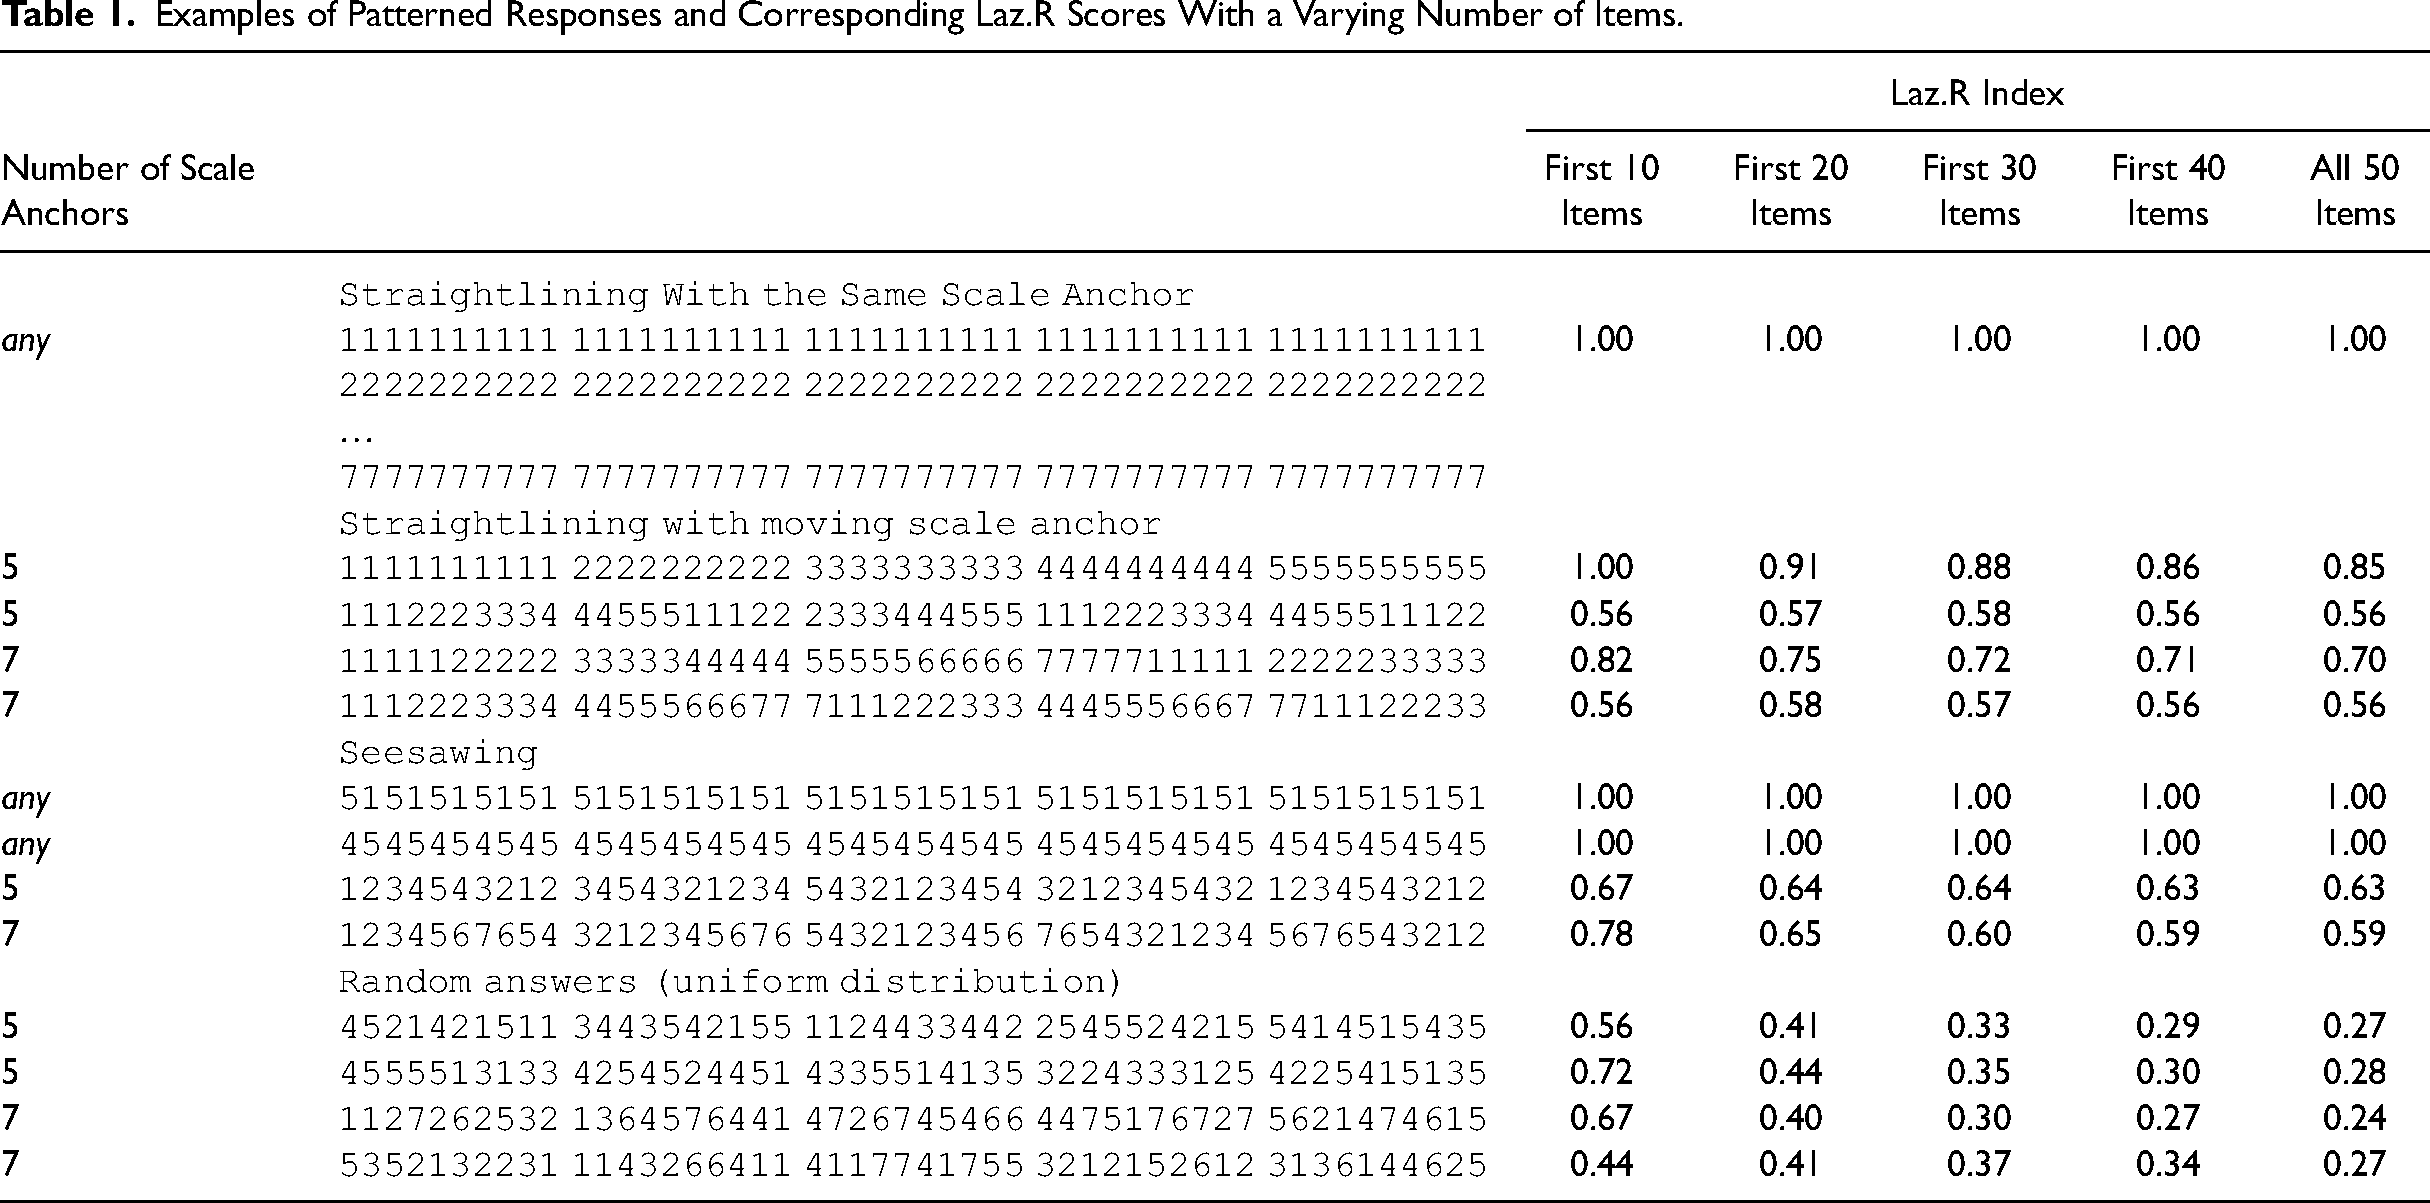
The example above only addresses a specific case to describe the theory behind the development of Laz.R. So, we provide an extended set of patterned responses in Table 1. For example, seesaw responding with 10 items alternating between five scale anchors (i.e., 1234543212) generates a Laz.R score of 0.67. If this pattern continues over a range of 50 items, the corresponding Laz.R score is 0.63.
Examples of Patterned Responses and Corresponding Laz.R Scores With a Varying Number of Items.
To make a value-added contribution to the literature, it is essential to demonstrate that patterned responses impact the reliability and/or validity of research findings and that our proposed index effectively identifies instances of careless responding that are not detected by existing indices. Accordingly, we next describe two studies (i.e., Studies 1 and 2) examining the reliability and validity of careful and careless respondents identified by Laz.R, followed by two additional studies (i.e., Studies 3 and 4) comparing Laz.R with existing approaches for detecting careless respondents.
Identification of Careful and Careless Respondents Using Laz.R: Implications for Reliability and Validity
We used two publicly available datasets from https://openpsychometrics.org/_rawdata (for a more detailed description of all the datasets we used, please see the “Supporting Materials B: Description of Datasets” section in the Supplemental Material). Both datasets use common scales in a very large sample, covering a great variety of careless response patterns. We computed Laz.R scores for all participants. Then, we compared those individuals with a very high Laz.R score (“careless respondents”) to individuals with medium to low scores (“careful respondents”). Specifically, if validity estimates are worse in the group of careless respondents, this would provide evidence of Laz.R's ability to identify careless response patterns. When assessing reliability estimates, we sought to compare careless and careful respondents, as reliability is likely to increase with straightlining but decrease with seesaw responding and random answering patterns. We conducted all analyses using R, Version 4.4.1 (R core team, 2024; code available upon request).
Study 1: Reliability and Validity Using Laz.R With Big 5 Personality Dimensions
Sample and Measures
This dataset includes 1,015,342 observations of the IPIP Big-Five Factor Markers, an inventory of 50 items to assess the Big 5 personality dimensions (Goldberg, 1992). The Big 5 personality dimensions have long been the most prominent way to operationalize personality characteristics and have been shown to predict employees’ attitudes, behavior, performance, and career success (Judge et al., 1999; Van Iddekinge et al., 2009). Each dimension was measured with ten items on a 5-point Likert scale ranging from 1 = disagree to 5 = agree (including 24 reverse-coded items). The item order in the questionnaire followed the same pattern for all participants, with always one item from each Big 5 dimension in the same order. At the end of the survey, participants were asked to indicate whether they had answered the questions accurately and whether their answers could be stored and used for research. Therefore, data for only these participants are available. In addition, we removed all respondents with incomplete questionnaires, which resulted in our study's N = 874,434.
Results
An exploratory view of the data reveals that the extreme answering patterns discussed in Table 1 rarely occurred in the sample. For example, only 0.039% of respondents (341 out of 874,434) answered all questions with scale anchor 1, and 0.0075% (66 respondents) answered the whole questionnaire consistently with the pattern 1-2-3-4-5-4-3-…. However, the data show that most careless respondents did not strictly follow the same extreme pattern throughout the whole questionnaire. Instead, many respondents varied their patterned answering behavior. For example, some respondents started with the same scale anchor for the first items, then moved to count up and down; others started with no clear answering pattern for the first items but alternated between 1 s and 5 s in later parts of the questionnaire. In the following analyses, we thus study not only cases with the most extreme Laz.R scores but select a proportion of careless respondents that also include individuals with partly patterned answering.
Proportion of Careless Respondents. The proportion of careless respondents may vary across studies. For the sake of simplicity, we set the cutoff value to 5%, which is within the range of rates of careless responding reported in previous research (Baer et al., 1997; Johnson, 2005; Kurtz & Parrish, 2001). Thus, we flagged participants with the 5% highest Laz.R scores as careless respondents (N = 43,722), and the remaining 95% are included in the group of careful respondents (N = 830,712).
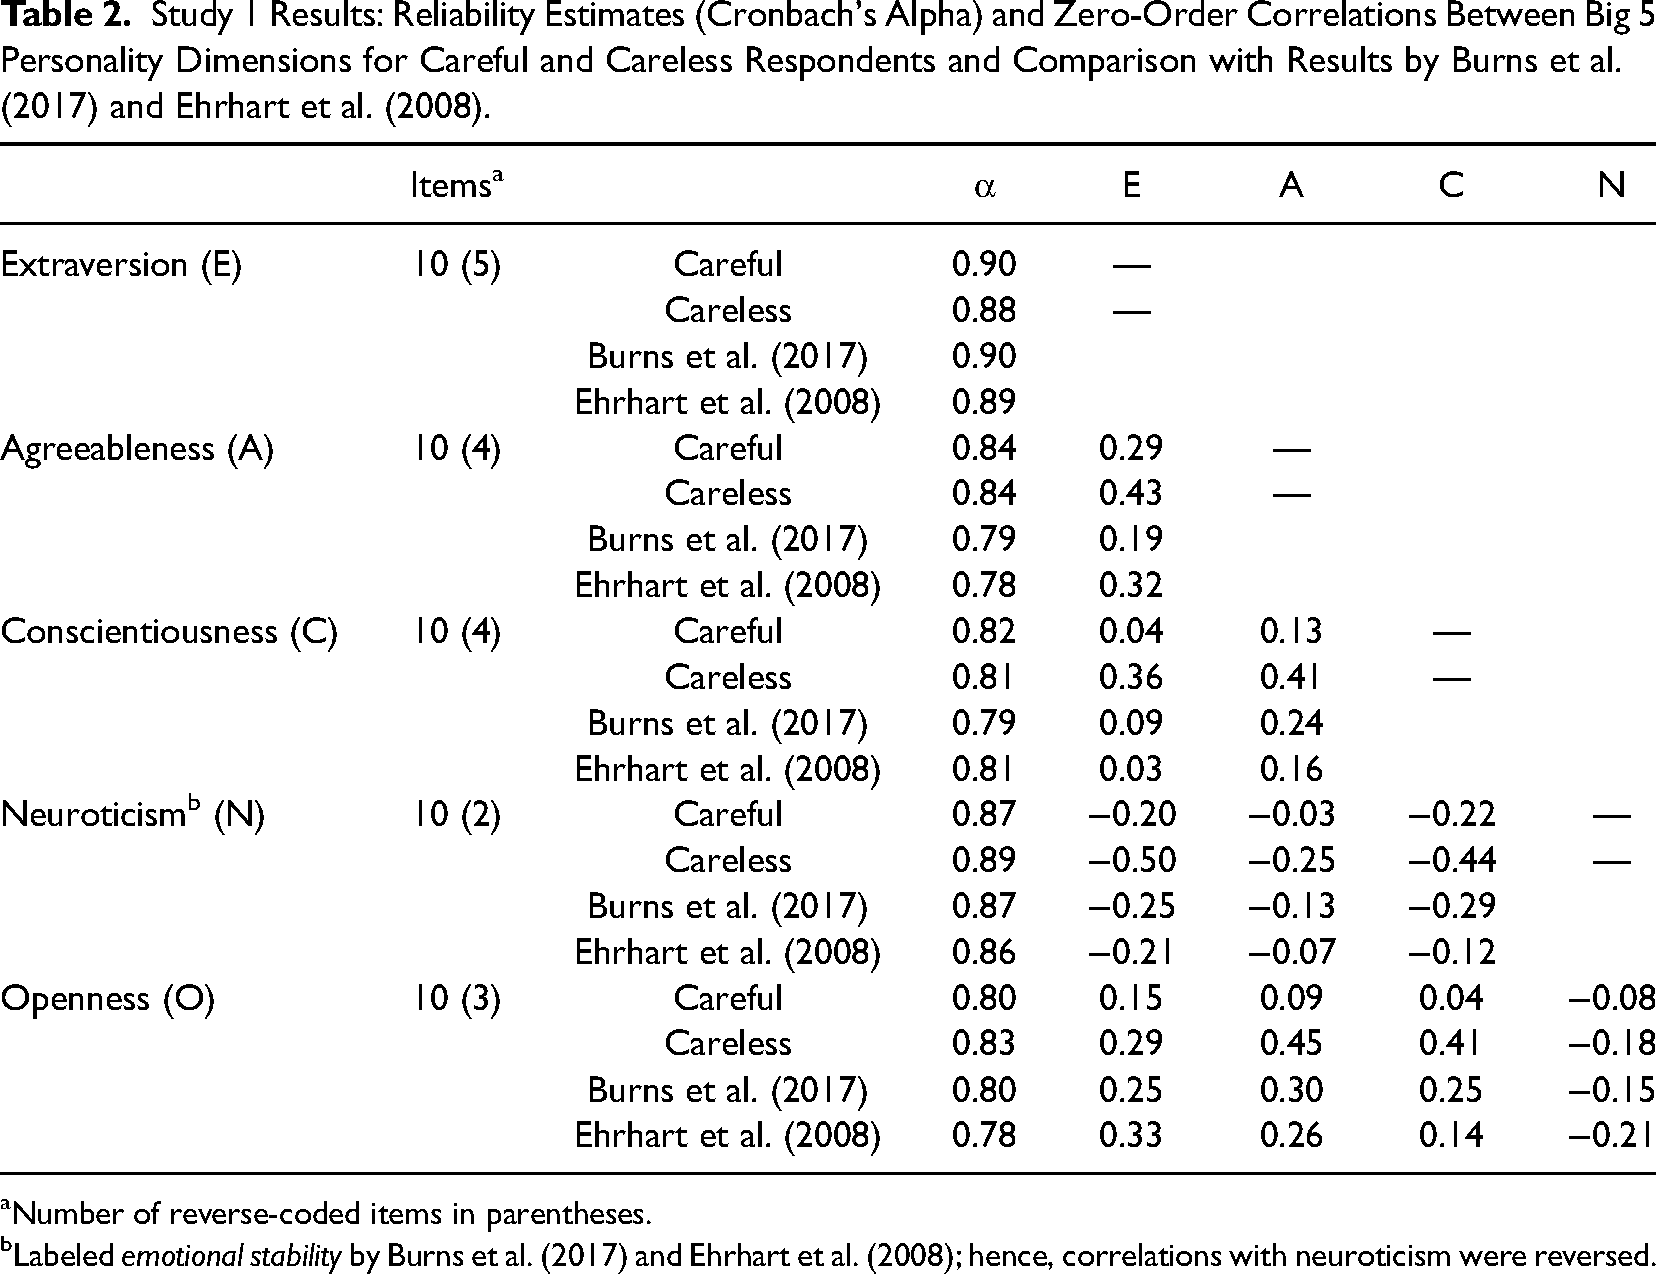
Reliability. As shown in Table 2, we computed Cronbach's α and zero-order correlations between all five personality constructs for the careful and careless respondents group. We also compared these results with those reported by Burns et al. (2017) and Ehrhart et al. (2008) because these studies use the same scales to provide reliability estimates and correlations among Big 5 dimensions. Results summarized in Table 2 show that reliability estimates are comparable across groups, varying between α = 0.80 and 0.90 for careful respondents and between α = 0.81 and 0.89 for careless respondents.
Study 1 Results: Reliability Estimates (Cronbach's Alpha) and Zero-Order Correlations Between Big 5 Personality Dimensions for Careful and Careless Respondents and Comparison with Results by Burns et al. (2017) and Ehrhart et al. (2008).
Number of reverse-coded items in parentheses.
Labeled emotional stability by Burns et al. (2017) and Ehrhart et al. (2008); hence, correlations with neuroticism were reversed.
Validity. Big 5 personality questionnaires intend to capture independent dimensions of an individual's personality (Barrick & Mount, 1991), and thus, we should expect low correlations among the five subscales, indicating discriminant validity. As shown in Table 2, all correlations among subscales were lower in the group of careful respondents compared to careless respondents. Differences ranged from Δr = .14 (e.g., extraversion and agreeableness) to Δr = .37 (conscientiousness and openness). We used the cocor.indep.groups function from the R package cocor (Diedenhofen & Musch, 2015) to perform significance tests for differences between correlation coefficients in two independent groups; all differences between the groups of careful and careless respondents were significant at p < .001. Overall, the mean correlation coefficient among personality dimensions was r = .13 in the group of careful respondents and r = .37 in the group of careless respondents.
To assess convergent validity, we compared results from careful and careless respondents to findings from two published validation studies that used the same 50 IPIP questionnaire items (Burns et al., 2017; Ehrhart et al., 2008). A comparison of the ten correlations among Big 5 personality dimensions in the two validation studies with the careful/careless groups revealed a mean deviation of
Discussion
The differences in correlations computed from the careless compared to careful respondents subgroup are very large compared to typical correlations reported in organizational research (Bosco et al., 2015). Specifically, Bosco et al. (2015) reported that medium effect sizes range from |r| = .09 to .26. These findings contextualize the differences that we found as large, given that they ranged between Δr = .14 and Δr = .37.
Our analyses identified the group of careless respondents by their high Laz.R scores. We argued that high Laz.R scores indicate minimum effort from respondents, resulting in patterned answering behaviors. One might argue that the opposite (i.e., completely random response behavior) can also indicate careless responding. Beach (1989), for example, used the term random responder to describe what we defined as careless responding. Random responding produces an answer pattern with very low predictability and, hence, very low Laz.R scores (see the last rows in Table 1 for examples). Accordingly, the respondents with very low Laz.R scores might also be of interest. If truly random responses characterize this group, scale reliability will be low because inter-item correlations that result from random responses are expected to be zero. Additional group analyses with the 5% lowest Laz.R scores revealed that scale reliability ranged between 0.79 (openness) and 0.88 (extraversion). Furthermore, in eight out of ten cases, correlations among subscales were lower in the group with the 5% lowest Laz.R scores compared to the other 95% of participants. Because the Big 5 personality dimensions should be independent, lower subdimension correlations indicate higher discriminant validity. Overall, we did not find evidence for a lower reliability or discriminant validity in the participants with very low Laz.R scores. Thus, we did not separate the individuals with low Laz.R scores for the remaining analyses.
Study 2: Reliability and Validity Using Laz.R With Holland Occupational Themes (i.e., RIASEC)
Sample and Measures
We used 145,828 survey responses to 48 items based on the Holland Occupational Themes (Holland, 1997), a popular taxonomy of individuals’ traits as part of the most established theory of careers and vocational choice. The instrument covers vocational interests that have been shown to predict job performance, turnover, and career choices (Song et al., 2024; Van Iddekinge et al., 2011). The questionnaire comprised six subdimensions: realistic (R), investigative (I), artistic (A), social (S), enterprising (E), and conventional (C), or RIASEC. Each is measured using eight items that describe various tasks. Participants used a 5-point scale ranging from 1 = dislike to 5 = enjoy to rate how much they would enjoy performing each task (e.g., “Design artwork for magazines” from the artistic scale and “Give career guidance” from the social scale). Items were from an item pool developed by Liao et al. (2008). After removing incomplete questionnaires, Study 2's N = 135,764.
Results
Proportion of Careless Respondents. Again, for now, we used a cutoff of 5% to distinguish careful from careless respondents, generating a subgroup of N = 128,976 careful and a subgroup of N = 6,788 careless respondents.
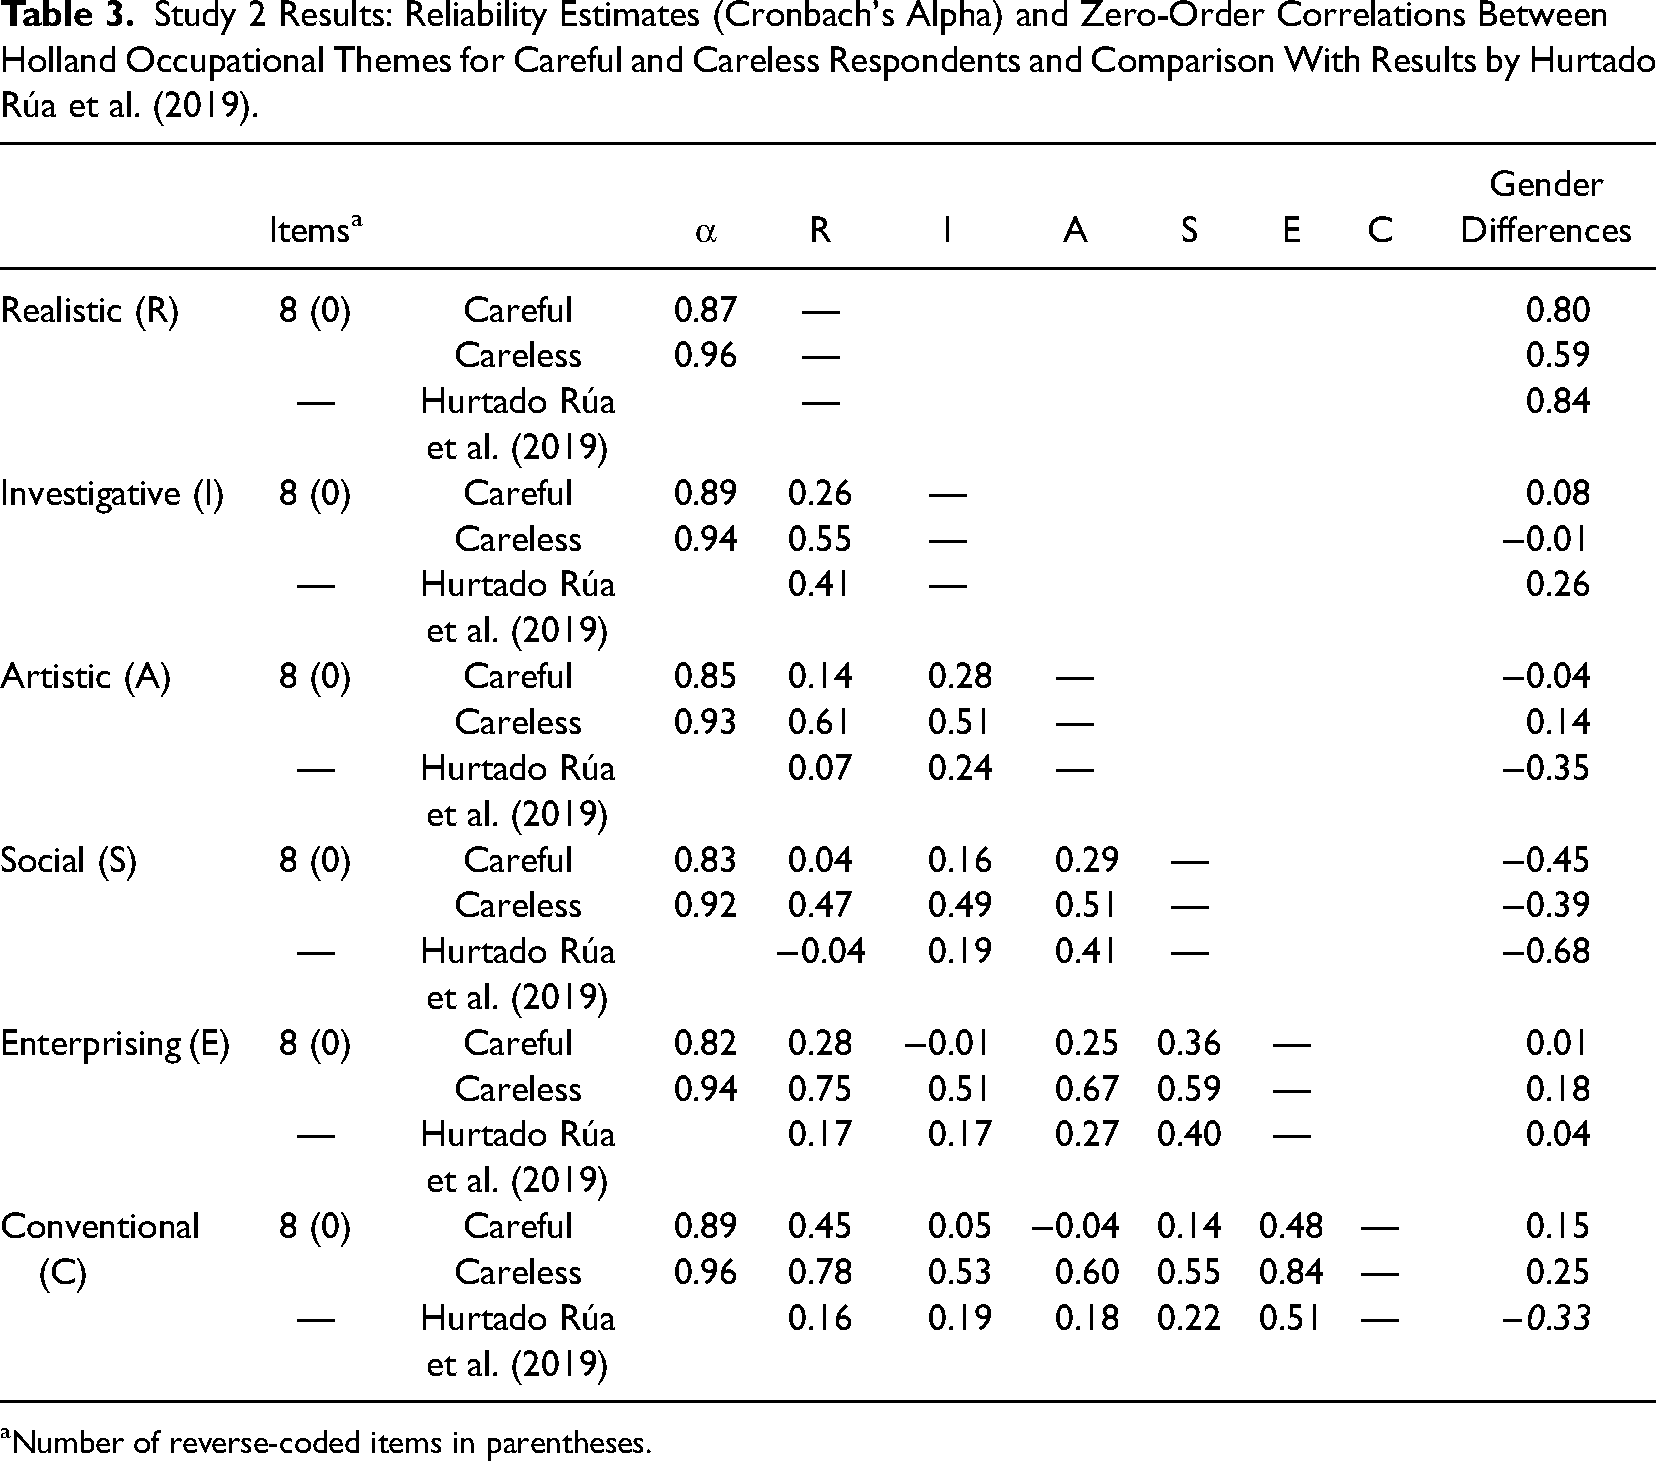
Reliability. Results in Table 3 show that reliability was slightly higher in the group of careless respondents (Cronbach's α ranging from 0.92 to 0.96) than in the group of careful respondents (Cronbach's α ranging from 0.82 to 0.89). An explanation for this result is the lack of reverse-coded items in the RIASEC questionnaire. In other words, participants with suspicious answering patterns such as 1-1-1… or 5-5-5… generate highly consistent results on all subscales.
Study 2 Results: Reliability Estimates (Cronbach's Alpha) and Zero-Order Correlations Between Holland Occupational Themes for Careful and Careless Respondents and Comparison With Results by Hurtado Rúa et al. (2019).
Number of reverse-coded items in parentheses.
Validity. Table 3 also shows results for discriminant validity. The pairs of subscales R-S, I-E, and S-C are especially important because they constitute opposites of Holland Occupational Themes’ hexagon (Holland, 1997) and should, therefore, yield low or even negative coefficients. Correlations in the group of careful respondents for these three pairs of subscales were r(R−S) = .04; r(I−E) = −.01; and r(S−C) = −.04. For careless respondents, these correlations were r(R−S) = .47; r(I−E) = .51; and r(S−C) = .60. Again, we conducted significance tests for differences between correlation coefficients in two independent groups using the R package cocor. Differences between correlation coefficients of RIASEC dimensions were significant at p < .001 when comparing the careful and careless respondent groups.
To assess convergent validity, we compared the RIASEC correlation patterns of careful and careless respondents to findings from a recently published meta-analysis (Hurtado Rúa et al., 2019). Pairing the six RIASEC subdimensions resulted in 15 unique correlation coefficients between subdimensions, which deviated from meta-analytical findings by
As additional evidence, previous research also analyzed gender differences for the RIASEC interest types, summarized in a meta-analysis by Su et al. (2009). In all six RIASEC subdimensions, the deviation of effect sizes from meta-analytic findings was smaller for careful respondents than for careless respondents, with a mean deviation of
Discussion
As a consequence of using Laz.R scores to distinguish between careful and careless respondents, we produced noticeable improvements in psychometric properties and substantive results. Regarding reliability, the nonexistence of reverse-coded items seemed to increase Cronbach's α in the group of careless respondents. Regarding discriminant validity, correlations among subdimensions were much higher in the group of careless respondents, even when no positive correlation was suggested by theory. Lastly, convergent validity was higher in the group of careful respondents, as the correlation patterns among subdimensions in the group of careful respondents were more similar to results from other studies than the correlation patterns of careless respondents.
Value-Added Contributions of Laz.R Above and Beyond Existing Approaches for Detecting Careless Respondents
In this section, we describe the results of studies examining the benefits of using Laz.R compared to posthoc (Study 3) and precautionary (Study 4) approaches. We begin with post-hoc approaches because they are more directly comparable to Laz.R.
Study 3: Empirical Comparison of Laz.R With Post-Hoc Approaches
Sample and Measures
For an empirical comparison of the different posthoc measures, we used the same Big 5 data as in Study 1. In addition to Laz.R, we computed the longstring index, Mahalanobis D, IRV, PsychSyn/PsychAnt, GPoly, and lzPoly. For PsychSyn, we set three thresholds with r(item i, item j) > .40/.50/.60. For example, there were 56 correlations with r > .40 in the data, which were used to compute PsychSyn. Similarly, thresholds for PsychAnt were set to r(item i, item j) < −.40/−.50/−.60. Results for psychometric antonyms with r(item i, item j) < −.60 are not shown because correlations among pairs of items did not pass this threshold in this dataset. We used the careless package (Yentes & Wilhelm, 2021) and the PerFit package (Tendeiro et al., 2016) in R to compute established posthoc measures.
Results and Discussion
We report results in two sections based on the two types of careless responses discussed in the introduction: (a) nonrandom patterned responding and (b) random responding. First, we defined answering sequences that we consider typical for straightlining and seesaw responding and computed posthoc indices for these patterns. Second, we produced random answering sequences and computed the different indices for these random response patterns.
Analysis of Typical Answering Patterns for Careless Respondents. The upper section of Table 4 shows selected straightlining and seesaw answering patterns and corresponding values for the five post-hoc careless responding indices. A direct comparison of index values is not feasible because they have different upper and lower limits. Hence, the table shows percentile ranks for index comparison. Thus, a percentile rank of 1 indicates that the case was among the 1% of answering patterns with the most extreme index scores, and hence, we might flag the respective sequence as stemming from a careless respondent. For Laz.R, longstring, and Mahalanobis D, high index values flag careless respondents and, thus, receive low percentile ranks. For IRV and PsychSyn, low index values indicate careless respondents; hence, we transformed low index values to low percentile ranks for these indices. Note that for IRV, some researchers have suggested to examine cases with high index values (e.g., Marjanovic et al., 2015). Following this approach, cases in our analyses with high percentile rank for IRV should be flagged.
Study 3 Results: Percentile Ranks and Values for Careless Responding Indices: Laz.R., Longstring, Mahalanobis Distance (MD), Intraindividual Response Variability (IRV), Psychometric/Semantic Synonyms (PsychSyn) and Antonyms (PsychAnt), GPoly, and lzPoly.
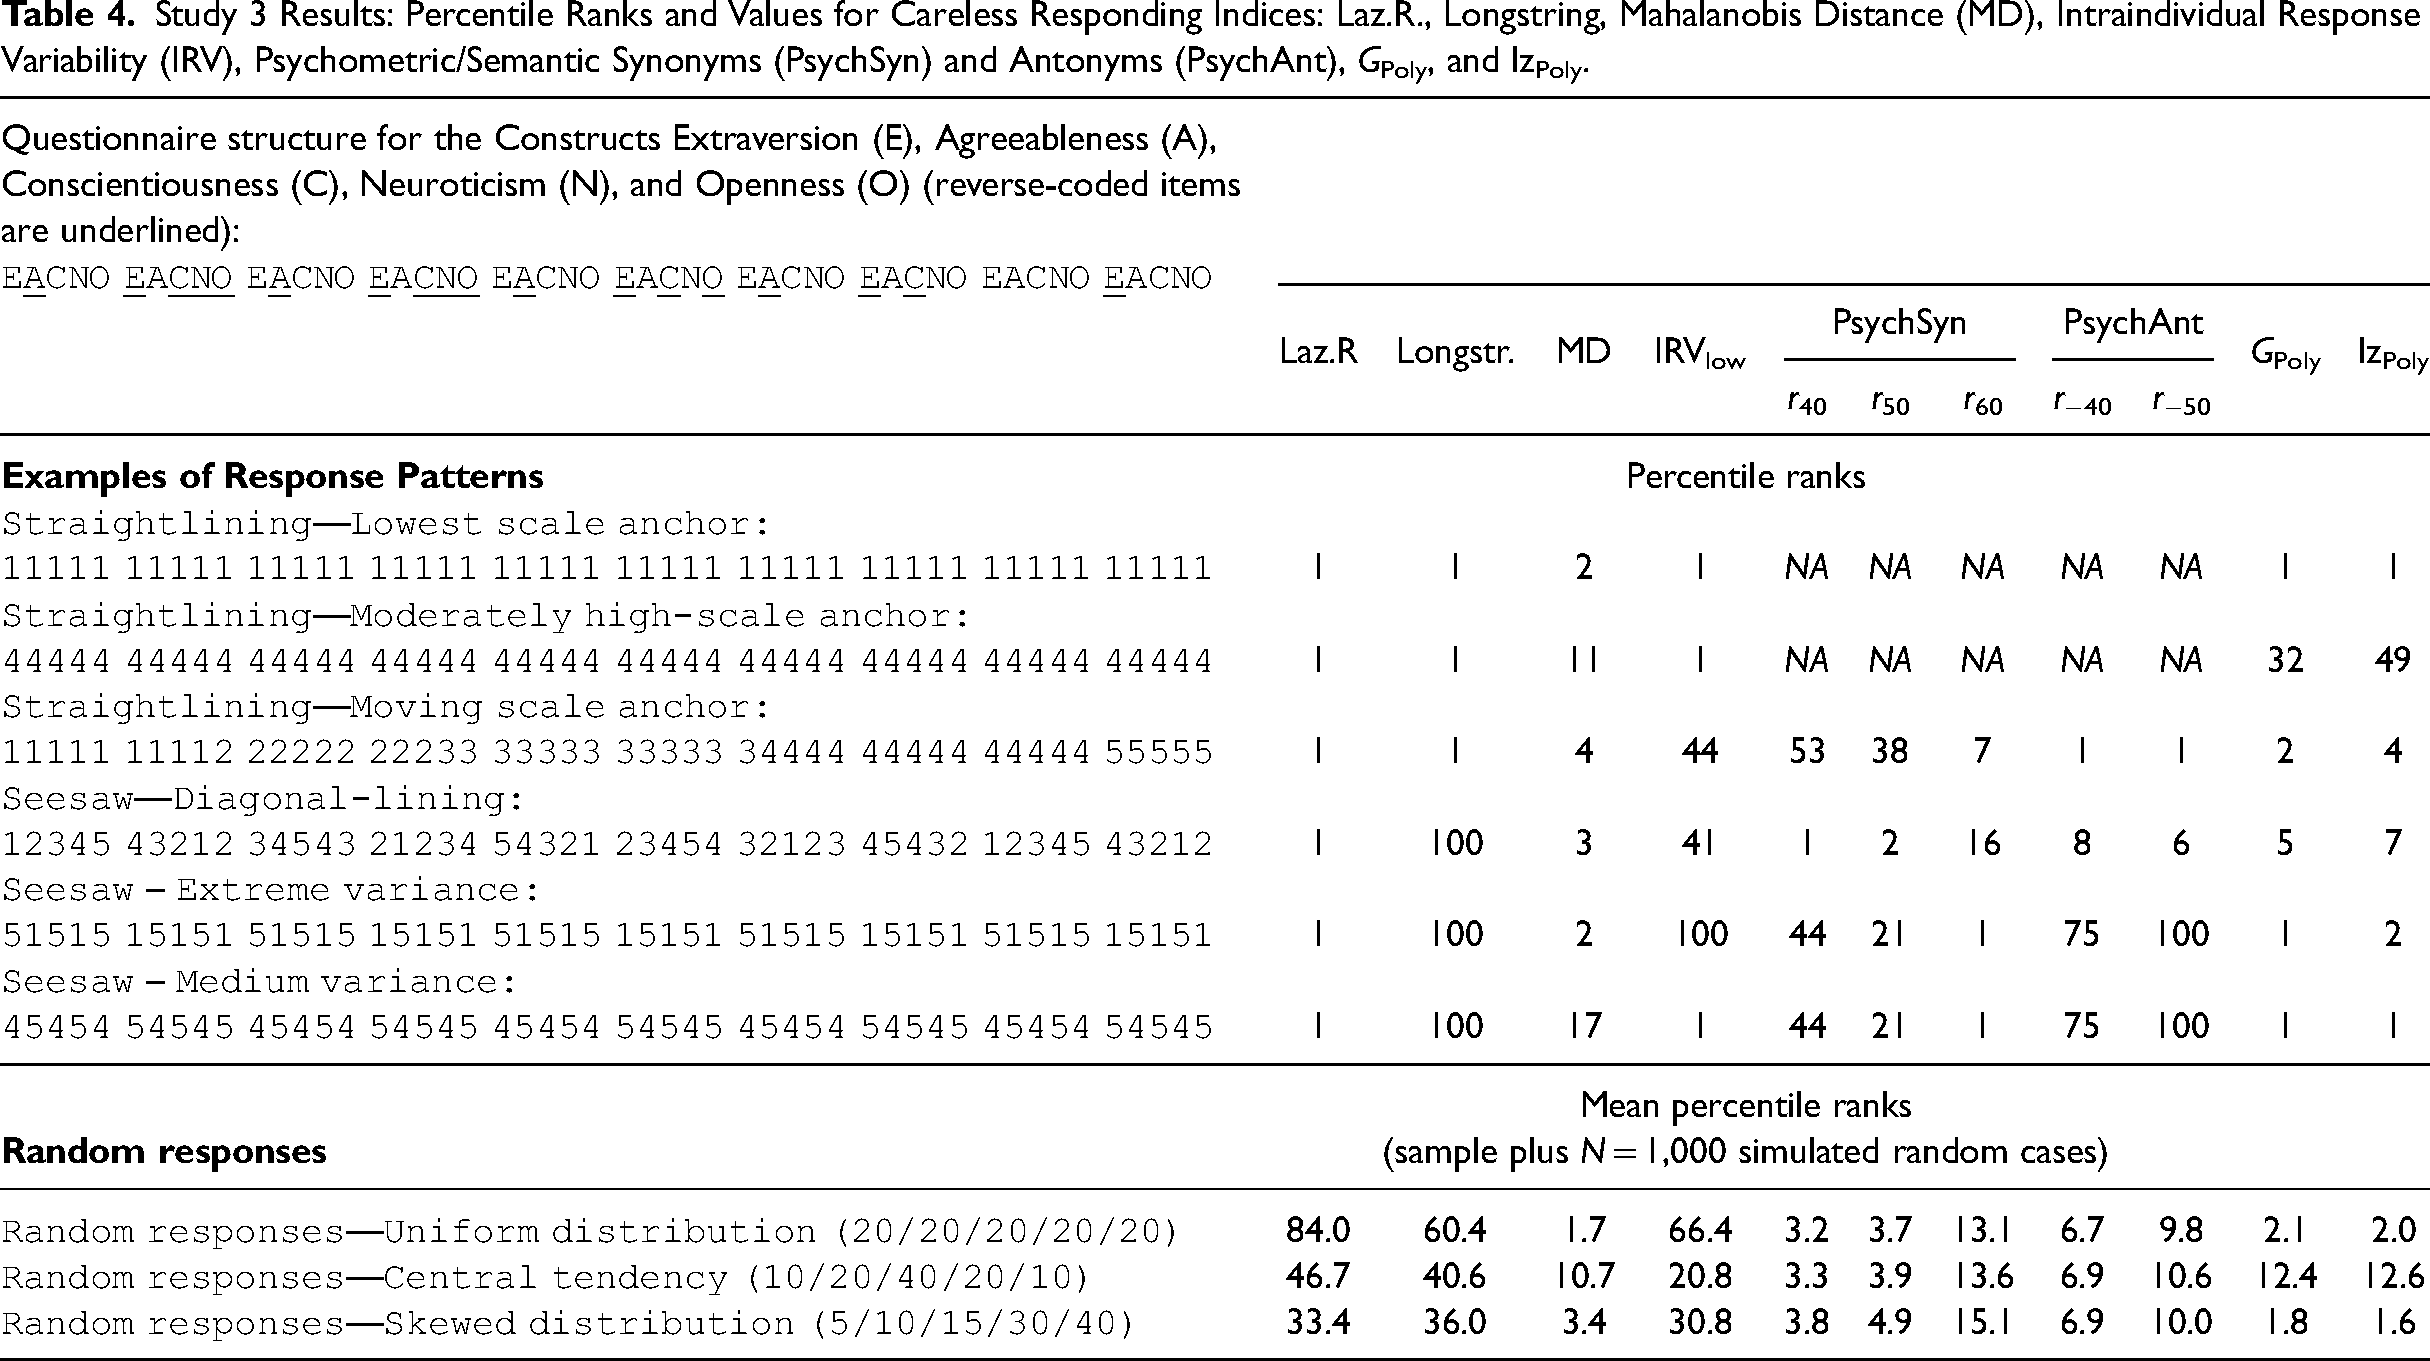
The first typical sequence of careless respondents is, again, the answering sequence 1-1-1-1-1-…. This straigthlining pattern is flagged as an extreme case by Laz.R, longstring, Mahalanobis D, IRV, GPoly, and lzPoly (in the first or second percentile). PsychSyn did not flag this pattern (99th percentile) because the responses do not vary; thus, a correlation among those highly correlated items in the full sample could not be computed for this case. An analysis of other straightlining and seesaw patterns in Table 4 reveals that longstring and IRV did not flag seesaw patterns (e.g., 5-1-5-1-5-… and 1-2-3-4-5-4-3-…). Also, Mahalanobis D, GPoly, and lzPoly did not flag patterns with values often close to the scale mean (e.g., 4-4-4-4-4-…). Finally, PsychSyn only flagged the pattern 5-1-5-1-5-… as an extreme case (first percentile) but did not identify the other patterns of careless respondents.
An analysis of these typical patterns of careless respondents revealed that only Laz.R flagged all pre-defined patterns correctly. At the same time, the other indices showed various weaknesses that logically follow from the respective index construction.
Analysis of Random Responding. In addition to patterned responses, random responding is a second category of careless responding that needs to be identified by careless responding indices (De Simone et al., 2018; Meade & Craig, 2012). When respondents choose answers randomly, their answering sequence contains values that depend neither on item content nor order. Note that there are no typical random response patterns (such as straightlining or seesaw answering), but random answering behavior can easily be simulated. Hence, we conducted additional analyses that extended the Big 5 dataset by N = 1,000 simulated random cases. For example, we simulated cases when each answering option has the same probability (uniform distribution). We computed careless responding indices for the extended datasets with N = 874,434 + 1,000 = 875,434 cases and calculated the mean percentile rank of the 1,000 cases of random responding. A very high or low mean percentile rank for an index indicates its ability to identify random responding. As shown in the lower part of Table 4, Mahalanobis D, PsychSyn, GPoly, and lzPoly (r > .40/.50) showed the best performance. For example, the mean percentile rank for PsychSyn with r > .40 was 3.3 when we simulated random responses with a central tendency. Laz.R was not capable of identifying random responding.
In sum, the results provided evidence that Laz.R outperformed other posthoc indices in identifying all types of patterned responding, but it was less useful in detecting random responding.
Study 4: Empirical Comparison of Laz.R With Precautionary Approaches (CR Study)
Precautionary procedures are more direct approaches to identifying careless respondents than posthoc statistical procedures. Therefore, they are valuable indicators of high index quality when both a precautionary measure and a corresponding posthoc statistical procedure identify the same individual. Since precautionary measures, by definition, must be implemented before data collection, we conducted a careless respondents study (CR study) specifically designed to compare Laz.R scores with various precautionary approaches and other existing posthoc measures.
Sample and Measures
To examine careless responding and increase the number of careless respondents in our dataset, we chose a study design aimed to elicit a high proportion of careless responding (e.g., a long and exhausting questionnaire with a tedious design), which is often called an “extreme-groups design” approach (Cortina & DeShon, 1998). We also manipulated survey conditions: 50% of participants received standard instructions (control condition), and 50% were instructed to respond without effort (low effort condition, “Please respond to all questions without effort. In fact, we request that you do so. There is no risk of penalty,” following Huang et al., 2012).
We recruited 465 participants via Amazon Mechanical Turk (MTurk). Following best-practice recommendations (Aguinis et al., 2021; Feitosa et al., 2015), we restricted participation to US individuals with a HIT approval rate > 95%. Additionally, we recruited only those currently employed or self-employed individuals, as the questionnaire included several work-related questions. In our sample, 38.06% were female, 61.94% were male, and the average age was 31.37 years (SD = 4.94). The highest education level was distributed as follows: 10.32% high school degree (or similar), 0.86% professional degree, 64.09% bachelor's degree, 23.87% master's degree, and 0.86% doctorate degree. On average, participants completed the questionnaire in 9 min and received 0.50 USD for their participation.
As in Study 1, participants first completed 50 items from the IPIP to assess the Big 5 personality dimensions. We then incorporated additional scales commonly used in organizational studies to demonstrate the broad applicability of our findings. Specifically, we assessed participants’ satisfaction with work itself and with pay (five items each, Bowling et al., 2018), career satisfaction (five items, Greenhaus et al., 1990), job insecurity (three items, Hellgren et al., 1999), three dimensions of psychological empowerment, namely, meaning, competence, and self-determination (three items each, Spreitzer, 1995), perceived needs-supplies fit and perceived demands-ability job fit (three items each, Cable & DeRue, 2002) as well as subjective/occupational stress (four items, Motowidlo et al., 1986).
In addition, we included several indices to detect careless responding. Within the scales mentioned above, we embedded three infrequency items from Huang et al. (2015a) and three instructed response items (e.g., respond with “disagree” for this item). Throughout the survey, we included ten items and asked participants to recognize item content at the end of the questionnaire with 10 multiple-choice questions, following the approach of Bowling et al. (2023). In total, participants answered 103 items (including 16 embedded careless responding items) that we used for later analyses of response patterns (please see the “Supporting Materials C: Scales, Survey Design, and Additional Results for Study 4 (CR Study)” for additional details in the Supplemental Materials). Unless otherwise specified, scales were measured using a 5-point Likert scale (1 = disagree, 5 = agree).
We also used the 9-item diligence scale by Meade and Craig (2012) at the end of the questionnaire as a robustness assessment of self-reported careless responding. We assessed the page time index and computed several posthoc indices such as longstring, Mahalanobis D, IRV, psychometric synonyms, and the person-fit statistics GPoly and lzpoly. 3
Results and Discussion
Descriptive statistics and correlations between different measures to identify careless respondents are shown in Table 5. An important observation is the generally low to moderate strength of relationships among the most careless responding indices. For example, correlations of the content recognition index with other careless respondent indices range between |r| = .57 (for psychological synonyms) and |r| = .02 (for GPoly). Similarly, correlations of Laz.R scores with other indices vary between |r| = .66 (for IRV) and |r| = .10 (for psychological synonyms). These results replicate what other researchers have reported before; that is, most careless responding indices are not highly correlated (e.g., Goldammer et al., 2020; Meade & Craig, 2012; Ulitzsch et al., 2022). It suggests that researchers might not want to rely on a single index when identifying careless respondents in their data but instead employ two or more potent indices.
Study 4 Results: Descriptives and Zero-Order Correlations Between Careless Responding Indices.
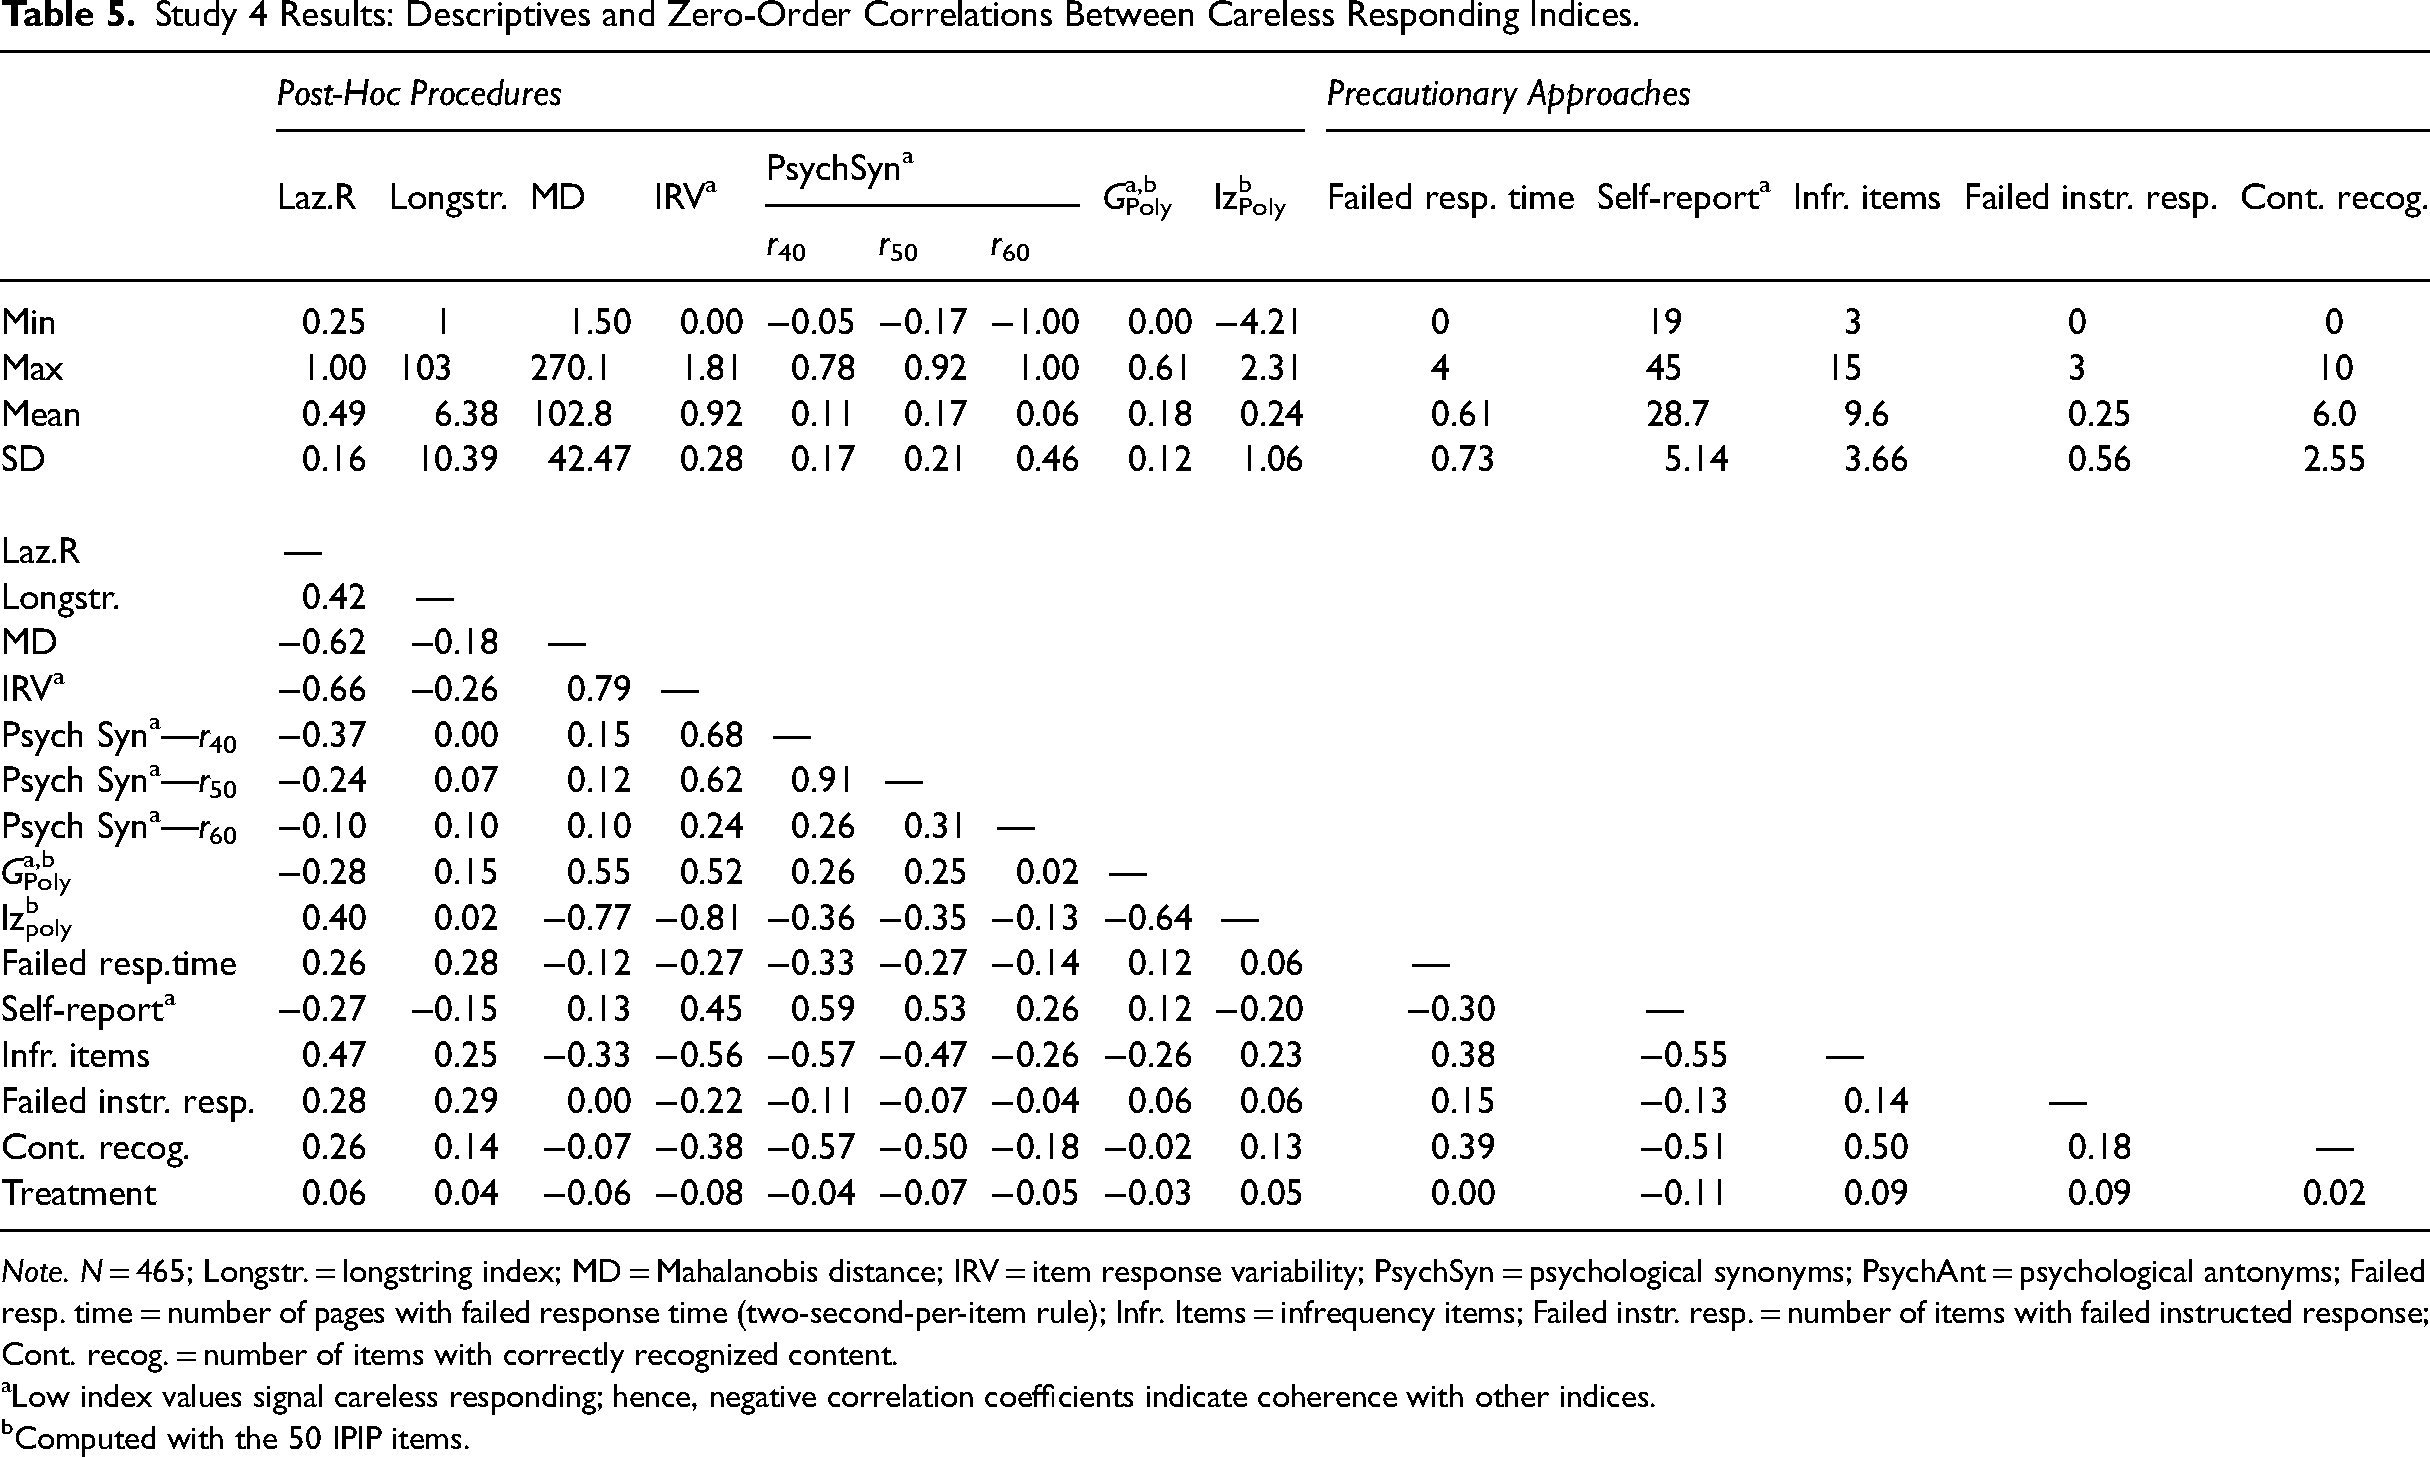
Note. N = 465; Longstr. = longstring index; MD = Mahalanobis distance; IRV = item response variability; PsychSyn = psychological synonyms; PsychAnt = psychological antonyms; Failed resp. time = number of pages with failed response time (two-second-per-item rule); Infr. Items = infrequency items; Failed instr. resp. = number of items with failed instructed response; Cont. recog. = number of items with correctly recognized content.
Low index values signal careless responding; hence, negative correlation coefficients indicate coherence with other indices.
Computed with the 50 IPIP items.
Several additional findings are noteworthy. First, we included three instructed response items throughout the questionnaire such as “Please select ‘agree’ for this item.” A closer examination of response patterns suggests that these items were largely ineffective. For instance, several respondents consistently chose the same anchor or a seesaw pattern for all items except for the three instructed response items (e.g., “444…444
Second, inspecting response patterns indicates that careless respondents tend to select scale anchors on the right side of the scale (i.e., to agree to questions in our questionnaire). Participants exhibiting highly patterned responses almost exclusively selected high-scale anchors, resulting in patterns such as “55555….” or “454545…”. Consequently, in an exploratory analysis, we found a correlation of r = .46 between Laz.R scores and the total sum of all items. The tendency of careless respondents to favor specific scale anchors has been previously documented (Costa & McCrae, 2008). This pattern was also evident in the Big Five dataset used in Study 1, where the number of individuals who consistently selected the same scale anchor for all items was unequally distributed on the scale ranging from 1 (disagree) to 5 (agree) with 341, 59, 683, 45, and 544 respondents, respectively.
A third noteworthy finding relates to the low-effort condition in our study. We advised 219 participants to respond to all questions with minimum effort (following Huang et al., 2012). However, this treatment was ineffective 4 and only slightly influenced their response behavior. The last row in Table 5 shows weak correlations of the low-effort condition with different careless responding indices. Although we designed the questionnaire to provoke careless responding in all participants, we were surprised that the low-effort treatment was largely ineffective.
General Discussion of Studies 1–4
We began by comparing careful and careless respondents in Studies 1 and 2, demonstrating that using Laz.R scores led to improvements in psychometric properties. In Study 3, we evaluated Laz.R against other careless responding indices, highlighting its utility as an additional tool for detecting careless respondents. However, findings also indicated that no single index fully captured all forms of careless responding. Study 4 was designed to compare Laz.R with a wide range of precautionary approaches. To achieve this, we employed a questionnaire design specifically intended to elicit a high number of careless responses, creating an optimal setting for index comparison. This approach does not reflect, does not reflect the typical context for organizational researchers. While the types of careless response patterns observed in Study 4 are arguably comparable to those in other studies, the proportion of careless respondents is likely much higher than what would typically be expected in standard survey research. Therefore, we caution researchers against using the results from Study 4 as a baseline or a model for survey design in their own studies. Nevertheless, a particularly noteworthy finding from Study 4 was the low to moderate correlations between most careless responding indices. To test the generalizability of this finding, we conducted a set of supplemental analyses with the Big 5 and RIASEC datasets that we used in Studies 1 and 2 (see Table 6). In addition to posthoc statistical approaches, we report correlations with response time, as time stamps were available for both datasets. Correlations among different indicators were also low, with only high correlations between Laz.R and Longstring (Big 5: r = .63; RIASEC: r = .82), and between the four indices IRV, Mahalanobis D, GPoly, and lzPoly. However, note that low IRV and high Mahalanobis D values have been suggested to indicate careless responding, making the positive correlation less intuitive. Mathematically, the positive correlation can be attributed to the fact that both the Mahalanobis distance and IRV involve calculating the deviation of each response from a mean value. Specifically, the formula for the Mahalanobis distance includes the deviation of each response from the overall mean of each item. In contrast, IRV computes the deviation from the individual's overall mean response. Thus, IRV and Mahalanobis distance increase as responses deviate from mean values. Lastly, we did not find high correlations of post-hoc indices with response time. However, comparing response time with actual answering patterns casts doubts on the sensitivity of the two-second-per-item rule (i.e., its ability to avoid false negatives). In the two datasets, 1,672 (Big 5) and 388 (RIASEC) individuals chose the same scale anchor throughout all items. 80.3% (Big 5) and 46.4% (RIASEC) of these extreme answering patterns were flagged as careless respondents when applying the two-seconds-per-item rule (Huang et al., 2012).
Zero-Order Correlations Between Careless Responding Indices for the Big 5 (Below Diagonal) and the RIASEC Dataset (Above Diagonal).
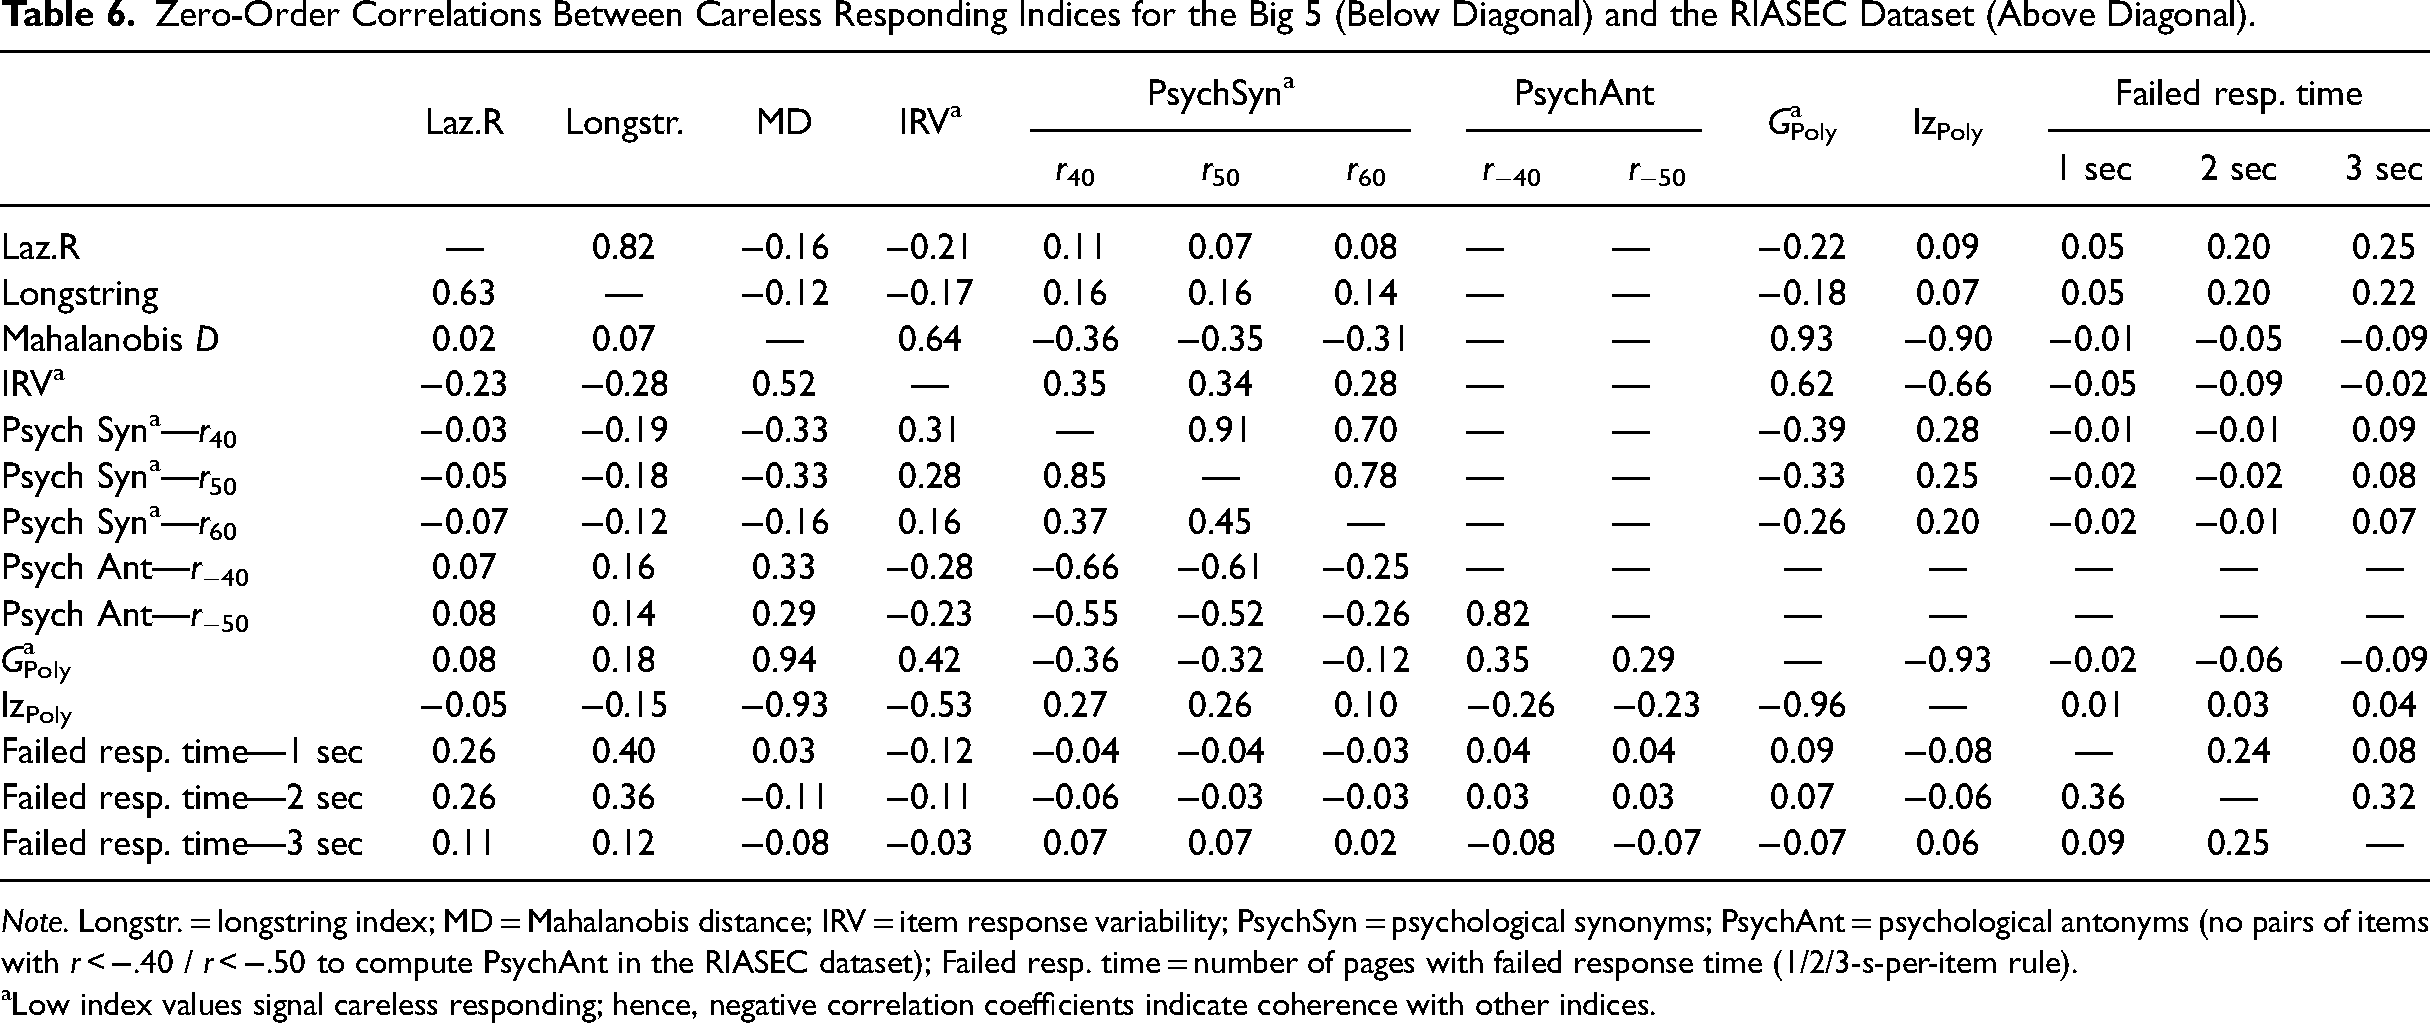
Note. Longstr. = longstring index; MD = Mahalanobis distance; IRV = item response variability; PsychSyn = psychological synonyms; PsychAnt = psychological antonyms (no pairs of items with r < −.40 / r < −.50 to compute PsychAnt in the RIASEC dataset); Failed resp. time = number of pages with failed response time (1/2/3-s-per-item rule).
Low index values signal careless responding; hence, negative correlation coefficients indicate coherence with other indices.
Overall, results in Studies 3 and 4 showed that the precautionary measures only identified a fraction of careless respondents but failed to capture a larger number of suspicious answering patterns, especially in longer questionnaires. While this finding aligns with Barends and de Vries (2019), we extend previous research by demonstrating the usefulness of Laz.R as an additional measure to identify those suspicious answering patterns even when precautionary measures were already implemented (please see for details the “Supporting Materials D: Empirical Comparison of Laz.R with Precautionary Approaches” in the Supplemental Materials). However, additional research is required to expand upon these preliminary findings and to comprehensively understand the complexities and optimal configurations of careless respondent indices. Next, we turn to the issue of how to more precisely identify Laz.R cutoffs to distinguish careful from careless respondents.
Using the Kneedle Algorithm to Set Cutoff Values for Laz.R
Previous research (e.g., Johnson, 2005; Kurtz & Parrish, 2001; Meade & Craig, 2012) and our own results showed that the percentage of careless respondents seems to differ substantially between samples. This makes a rule of thumb based on a universal cutoff value for Laz.R and other posthoc approaches less desirable. Accordingly, we offer a method to find sample-specific cutoff values for Laz.R.
Careless responding may occur in extreme forms such as when respondents completely ignore item content and answer all questions with the same scale anchor. However, our results showed that respondents often seemed to answer only some parts of the questionnaire with insufficient effort, possibly because of temporary distractions or because they lost interest during questionnaire completion. For Laz.R, we expect a group of careless respondents with only slightly higher Laz.R scores when only a few items were clicked through, up to extreme Laz.R scores for respondents who clicked through the whole questionnaire. We believe that most survey participants are for the most part careful respondents, which should be reflected in relatively similar Laz.R scores for this group. Accordingly, when Laz.R scores are sorted from high to low, there should be a “knee” in the graph, distinguishing the careless respondents with very high to slightly higher Laz.R scores from careful respondents with relatively similar Laz.R scores. To illustrate this point, we reanalyzed data from the three datasets we used in our earlier studies (i.e., Big 5, RIASEC, and CR study). We sorted the Laz.R scores of all respondents from the highest to the lowest as shown in Figure 1. For example, in the left panel in this figure, we show results from the Big 5 dataset that was introduced above. This graph starts with < 1% of respondents that have extreme Laz.R scores, followed by a steep decline, before the graph levels off after a sharp curve—the “knee” of this graph—at about 5%–10%. The graphs for the three samples are similar: they start with a steep decline in Laz.R scores, followed by a knee, and afterward, scores level off. We argue that cases on the left of this knee might be considered careless respondents. Suppose we find such a knee point in a sample. In that case, this cutoff value can guide researchers to identify cases that should be scrutinized further and possibly excluded from further analyses because of careless responding.
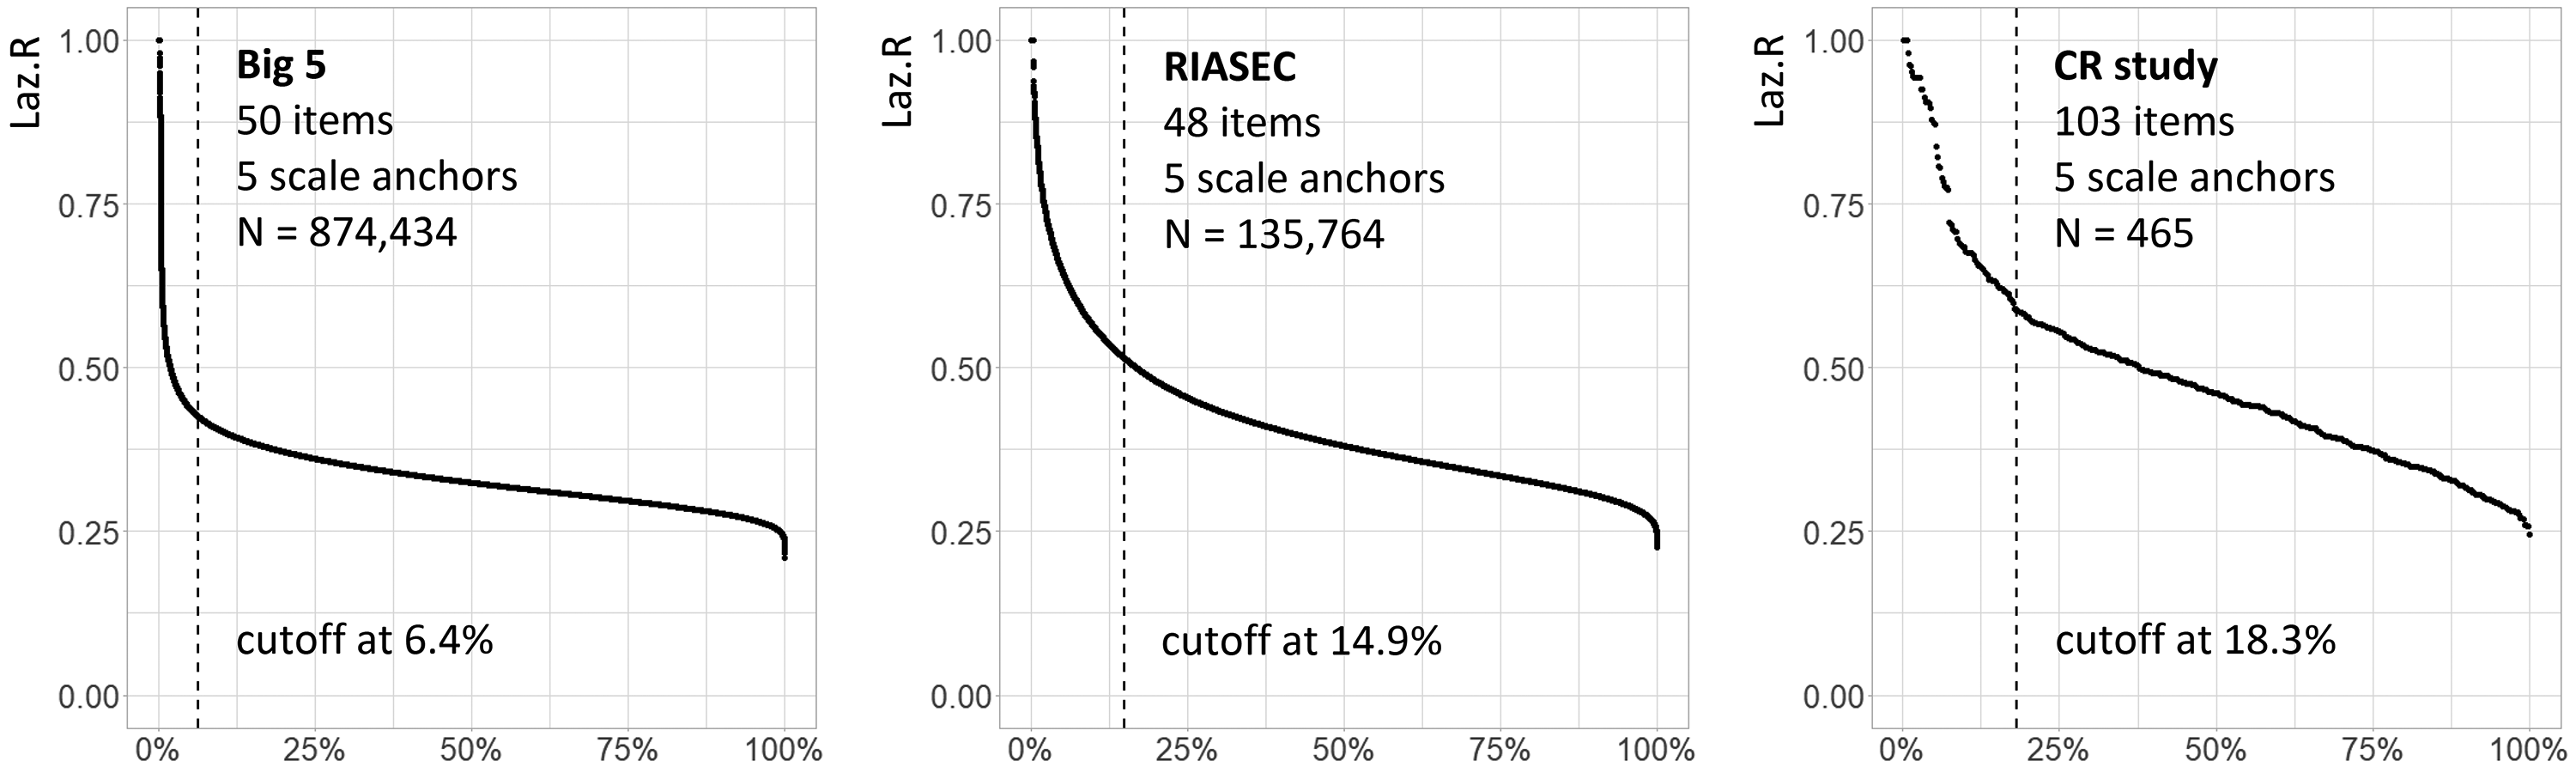
Kneedle cutoff values to distinguish careful from careless respondents across samples using Laz.R.
In computer science, the kneedle algorithm was developed to detect knee points (i.e., points where a curve flattens out; Satopää et al., 2011). The dotted lines in the panels in Figure 1 indicate knee points from the kneedle algorithm in each sample. For example, this line is at 6.4% in the Big 5 dataset graph. Thus, we might flag the 6.4% of respondents with the most extreme Laz.R scores as careless respondents and possibly remove these cases after further inspection. The kneedle cutoff for data from the CR study is 18.3%, which is in line with our observation that this dataset contained a larger number of careless respondents (see “Supporting Materials E: Kneedle Cutoffs in Additional Datasets” for examples of kneedle cutoffs in other datasets and for other posthoc indices in the Supplemental Material).
Best-Practice Recommendations for Using Laz.R in Combination With Existing Approaches
Survey Design
When designing a survey, we recommend using scales with reverse-coded items or other means that make the simplest “clicking-through” patterns (i.e., choosing the same scale anchor) identifiable in later analyses. Without reverse-coded items, researchers cannot distinguish careless respondents from individuals who genuinely answered the constructs by consistently choosing the same scale anchor, especially in shorter questionnaires. In addition, if researchers collect primary data or rely on secondary data including precautionary measures, we suggest combining Laz.R with precautionary measures, which is consistent with existing recommendations (e.g., DeSimone et al., 2015; Goldammer et al., 2020; Kam & Meyer, 2015). We have briefly introduced the most common precautionary measures, but a detailed analysis of existing options goes beyond the scope of this study. Note, however, that we found a larger number of suspicious cases not flagged by the respective precautionary measure in the three datasets that we used to compare posthoc and precautionary measures. Precautionary measures might even lose some of their power when respondents get paid for survey participation. Some respondents may engage in careless answering or utilize bots while deliberately attempting to pass precautionary items to secure their compensation. Thus, if researchers are concerned that bots generated their survey responses, they may consider incorporating specific bot detection measures (Bernerth et al., 2021; Xu et al., 2022).
Data Analysis
Based on our results, we first recommend the use of the Laz.R index to identify nonrandom patterned responses, like straightlining and seesaw responding. Our analyses have shown that the Laz.R index captures forms of patterned responses that other indices overlook. Specifically, for seesaw response patterns such as 4-5-4-5 or 1-2-3-4-5-4-3-2-1, the Laz.R index demonstrates a superior ability to detect these consistently patterned response structures compared to other indices.
Researchers should include all items with a similar number of answering options from their survey instrument (e.g., all items from 5-point scales). Note that a lower number of items might produce more false positives. For example, if only four items are used for index computation, the pattern 5-5-5-5 results in extreme scores for Laz.R, longstring, IRV, and Mahalanobis D, although it might reflect true answering behavior. We thus suggest using twenty or more items for index computation. If desired, missing data can be added as an additional category to the scale anchors. We further recommend conducting a combined analysis of Laz.R results to identify nonrandom patterned responses, alongside utilizing Psychometric/Semantic Synonyms or a person-fit statistic (e.g., GPoly and lzPoly) to detect random responses. Precautionary measures should also be considered if available. Researchers should report their approach and the number of deleted cases in publications.
Moreover, we advocate employing the kneedle algorithm to determine cutoff values for post-hoc approaches. Thus, for Laz.R, we suggest that all cases that have a score above the kneedle cutoff should be inspected and removed from further analyses, except if there is evidence that the respective response pattern emerged from careful responding.
Finally, for easy and accessible use, we implemented our approach to detecting careless responding in an interactive web application, using the shiny package in R (Chang et al., 2015). The R Shiny app is available at https://hrmmannheim.shinyapps.io/ShinyCR_App/ and guides users through a step-by-step process from uploading the data to initiating the computations of post-hoc indices and cutoff values. With this app, we make the computation of Laz.R and other common posthoc approaches readily available for fellow researchers and practitioners. Figure 2 summarizes our recommendations.
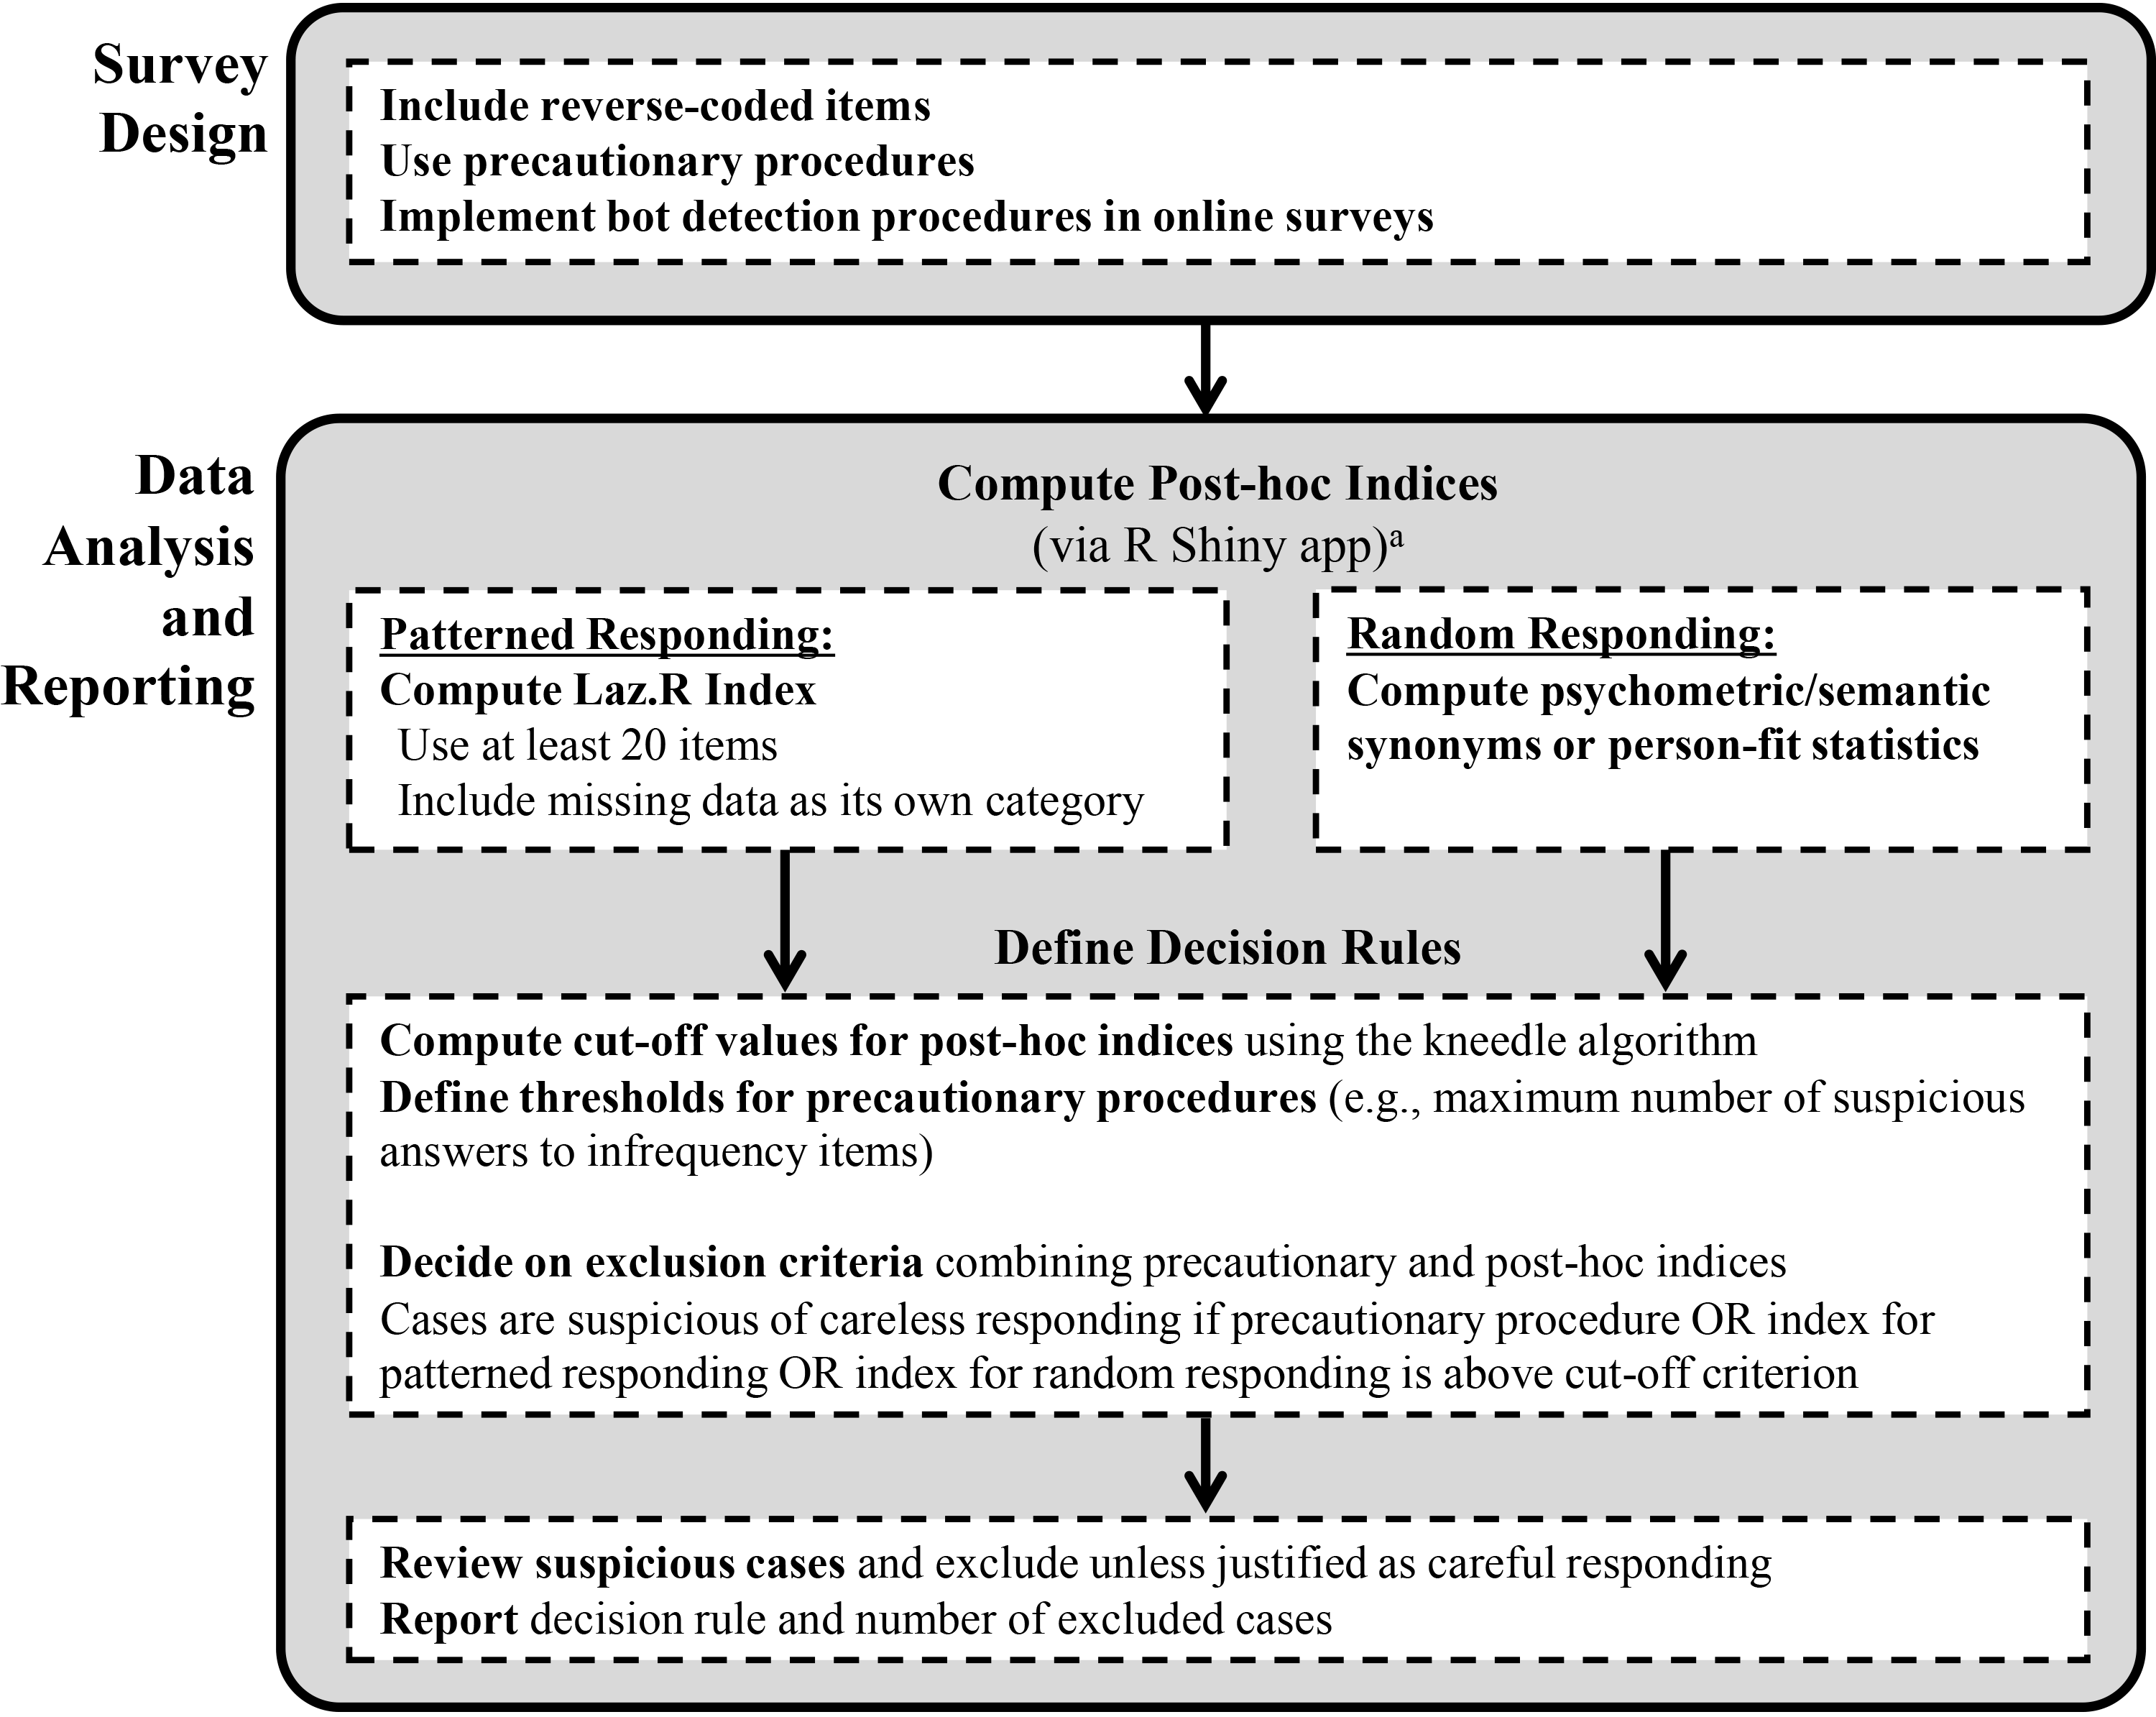
Summary of recommendations and tools for identifying different types of careless responding.
Conclusions
Laz.R makes explicit that some careless respondents take a low-effort route and “click through” the survey, disregarding the content of specific items. We analyzed three datasets and provided evidence that the use of Laz.R improves psychometric properties and the accuracy of substantive conclusions. For example, in Study 1, the mean correlation among the theoretically independent Big 5 personality dimensions was r = .13 for careful respondents (i.e., those with high Laz.R scores) and r = .37 for careless respondents (i.e., those with low Laz.R scores). In Study 2, correlations of the three theoretically opposite subdimensions of the RIASEC questionnaire were r = .04/−.01/−.01 for careful respondents, but—contrary to theory—strongly positive for careless respondents with r = .47/.51/.60. These results indicate that conclusions are biased by overly positive relationships if researchers fail to detect careless respondents. Based on its consistently superior performance across all datasets, we recommend the use of Laz.R for detecting patterned responses. Additionally, we suggest that researchers employ Psychometric/Semantic Synonyms and person-fit statistics to identify random responses. For index computation, we encourage the use of the user-friendly R Shiny app, which requires no R knowledge, combined with precautionary approaches, to minimize the detrimental effects of careless respondents on substantive conclusions.
Supplemental Material
sj-docx-1-orm-10.1177_10944281251334778 - Supplemental material for Using Markov Chains to Detect Careless Responding in Survey Research
Supplemental material, sj-docx-1-orm-10.1177_10944281251334778 for Using Markov Chains to Detect Careless Responding in Survey Research by Torsten Biemann, Irmela F. Koch-Bayram, Madleen Meier-Barthold and Herman Aguinis in Organizational Research Methods
Footnotes
Declaration of Conflicting Interests
The author(s) declared no potential conflicts of interest with respect to the research, authorship, and/or publication of this article.
Funding
The author(s) received no financial support for the research, authorship, and/or publication of this article.
Supplemental Material
Supplemental material for this article is available online.
Notes
Author Biographies
![]()
References
Supplementary Material
Please find the following supplemental material available below.
For Open Access articles published under a Creative Commons License, all supplemental material carries the same license as the article it is associated with.
For non-Open Access articles published, all supplemental material carries a non-exclusive license, and permission requests for re-use of supplemental material or any part of supplemental material shall be sent directly to the copyright owner as specified in the copyright notice associated with the article.