
Abstract
Estimation at fine levels of aggregation is necessary, to better describe society. Small area estimation model-based approaches that combine sparse survey data with rich data from auxiliary sources have been proven useful to improve the reliability of estimates for small domains. Considered here is a scenario where small area model-based estimates, produced at a given aggregation level, need to be disaggregated to better describe the social structure at finer levels. For this scenario, an allocation method was developed to implement the disaggregation, overcoming challenges associated with data availability and model development at such fine levels. The method is applied to adult literacy and numeracy estimation at the county-by-group-level, using data from the U.S. Program for the International Assessment of Adult Competencies. In this application, the groups are defined in terms of age or education.
Keywords
1. Introduction
Making effective evidence-based policies and laws relating to adult education requires sound research based on reliable data that are most relevant to jurisdictions such as counties, states, and demographic groups within counties and states. As a multicycle international study involving over thirty countries under the leadership of the Organization for Economic Cooperation and Development (OECD), the first cycle of the Program for the International Assessment of Adult Competencies (PIAAC) was designed to provide national estimates of the proficiency of adult literacy, numeracy, and problem-solving skills. In the United States (U.S.), PIAAC is sponsored by the National Center for Education Statistics (NCES) at the Institute of Education Sciences (IES). The U.S. PIAAC survey involves a multistage probability design with in-person data collections that include a screener questionnaire, a background questionnaire, and an assessment of adult skills. Approximately 12,330 U.S. adults aging 16 to 74 and living in households were surveyed for U.S. PIAAC during three rounds of data collection fielded in 2012, 2014, and 2017. Each round of data collection involved an area probability sample, including a national sample in 2012, a national supplement in 2014 from the same selected areas as in 2012, and another national sample in 2017 from a new sample of areas. Combining the 2012/2014/2017 samples increased the number of counties with PIAAC data for the small area estimation modeling process. Sample weights were created for the combined PIAAC 2012/2014/2017 sample. The 2012–16 American Community Survey (ACS) 5-year Public Use Micro Sample (PUMS) data were used to construct control totals for calibrating the PIAAC sample weights for the combined sample. Details about the 2012/2014/2017 combined sample are provided in Krenzke et al. (2019). In the rest of the paper, we will refer to the U.S. PIAAC as PIAAC and we will refer to the 2012/2014/2017 U.S. PIAAC survey sample as PIAAC survey sample.
National survey estimates constructed using the PIAAC sample were of high quality. However, the PIAAC sample size was too small to support the production of survey estimates at disaggregate levels. To address the need for disaggregated statistics, Krenzke et al. (2020) and Li et al. (2022) developed hierarchical Bayes model-based small area estimation (SAE) methodology to produce county, state, and state by age and education groups estimates for average scores for literacy and numeracy, and various proficiency levels. The methodology used the PIAAC survey data and auxiliary data from the ACS. The resulting SAE estimates provide reliable U.S. official statistics of adult literacy and numeracy skills in all fifty states, all 3,141 counties, and the District of Columbia, and in all fifty states and the District of Columbia by six age groups, 16 to 24, 25 to 34, 35 to 44, 45 to 54, 55 to 64, and 65 to 74 year old, and four education groups, less than high school, high school diploma or an alternative to high school diploma, some college (no degree or attained associate’s degree), and bachelor’s degree or higher.
Complementing the estimation of county, state, and state by age and education groups adult proficiency, this paper further addresses the need for disaggregated statistics. Specifically, county by group estimation of adult proficiency is addressed, where the quantities of interest are the same as the ones considered in Krenzke et al. (2020) and Li et al. (2022), and the groups of interest are the same ones considered in Li et al. (2022). A deterministic method is used to allocate the previously available state by group estimates to the county by group level, for all the counties nested within the corresponding state, using the ratios of county to state estimates. The allocation is applied to the posterior samples available for the state, county, and state by group quantities of interest, resulting in pseudo-posterior distributions for the county by group quantities of interest. The resulting county by group-level estimates are available in a publicly available interactive tool known as the Skills Map and available at https://nces.ed.gov/surveys/piaac/skillsmap/, along with the previously available county, state, and state by group-level estimates, for all outcomes of interest, the proportions at or below Level 1 (P1), at Level 2 (P2), and at or above Level 3 (P3), and average scores.
The rest of the paper is organized as follows. In Section 2, we describe the data available from PIAAC, the Skills Map, and the ACS, serving as input into the county by group-level estimation process. The allocation method is presented in Section 3 and validation metrics are provided in Section 4. A discussion is provided in Section 5. Additional details about the allocation method are included in the Appendix. Unless otherwise noted, selected results are presented throughout the manuscript only for one quantity of interest, the proportion at or below Level 1 literacy, and for one demographic group, the population with less-than-high-school education. Results for all quantities of interest and for all domains of interest are comparable and are available in the Skills Map and in the report Erciulescu et al. (2022).
2. Data Available at Various Levels of Aggregation
Person-level survey data are available from PIAAC and are used to produce survey estimates for the county by group domains with sample data. Because these data are sparse at disaggregated levels such as county by group, an indirect estimation approach is developed. The indirect estimation approach uses data produced as the output of SAE models for higher levels of aggregation, that is, county, state, and state by group. The survey estimates and select auxiliary data are used in the validation process of the indirect county by group estimates. Selected details about the PIAAC survey, model, and auxiliary data are provided in the rest of this section. Providing further details is beyond the purposes of this paper. See Krenzke et al. (2020) and Li et al. (2022) for additional details, and Krenzke et al. (2024) for a succinct version of Krenzke et al. (2020).
2.1. Survey Estimates
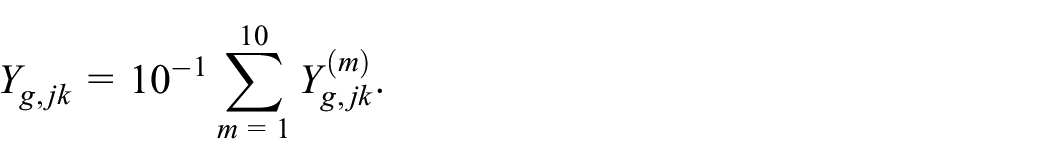
Following Li et al. (2022), a multiple imputation approach (Rubin 1987, 1996) is implemented for constructing the survey estimates and the associated variance estimates. The PIAAC micro-level data includes ten plausible values generated from a posterior distribution by combining item response theory scaling of the cognitive items with a latent regression model using information from the background questionnaire in a population model (Hogan et al. 2016; Krenzke et al. 2019; Mislevy and Sheehan 1989, 1992). For each plausible value, Háyek-type estimates and associated Taylor-series approximated variance estimates (Särndal et al. 1992) are constructed for the county by group-level quantities of interest, with survey weights calibrated to 2013 to 2017 ACS control totals for age groups, education levels, gender, and race/ethnicity within state. The variance units or clusters are assumed to be the secondary sampling units, which are groups of census blocks. Variances for domains nested within a variance cluster are nonestimable. Therefore, for county-by-group domain estimation, the methodology in Krenzke et al. (2020) and Li et al. (2022) is not directly applicable.
Let
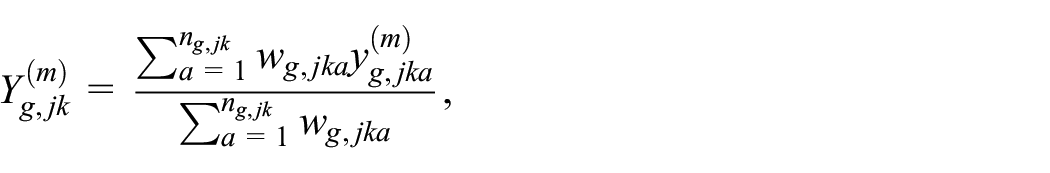
where
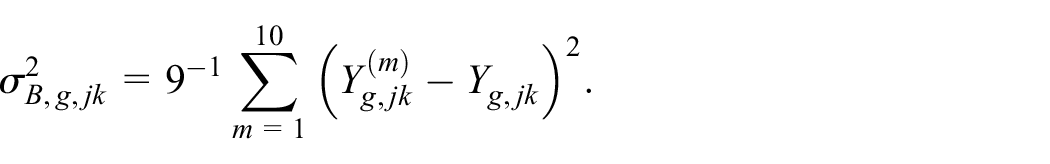
To complete the survey estimation process, the variances of the county by group-level survey estimates are estimated using the multiple imputation approach by combining the within-imputation and between-imputation variances,
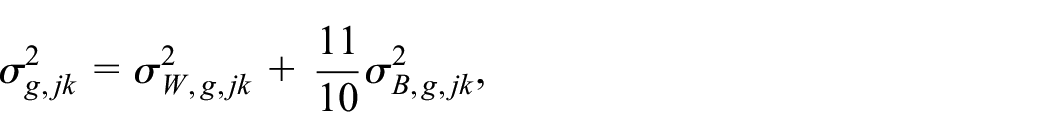
where
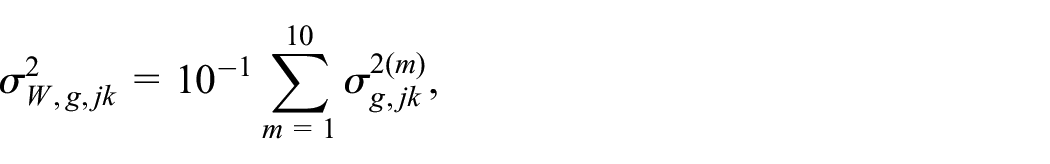
where
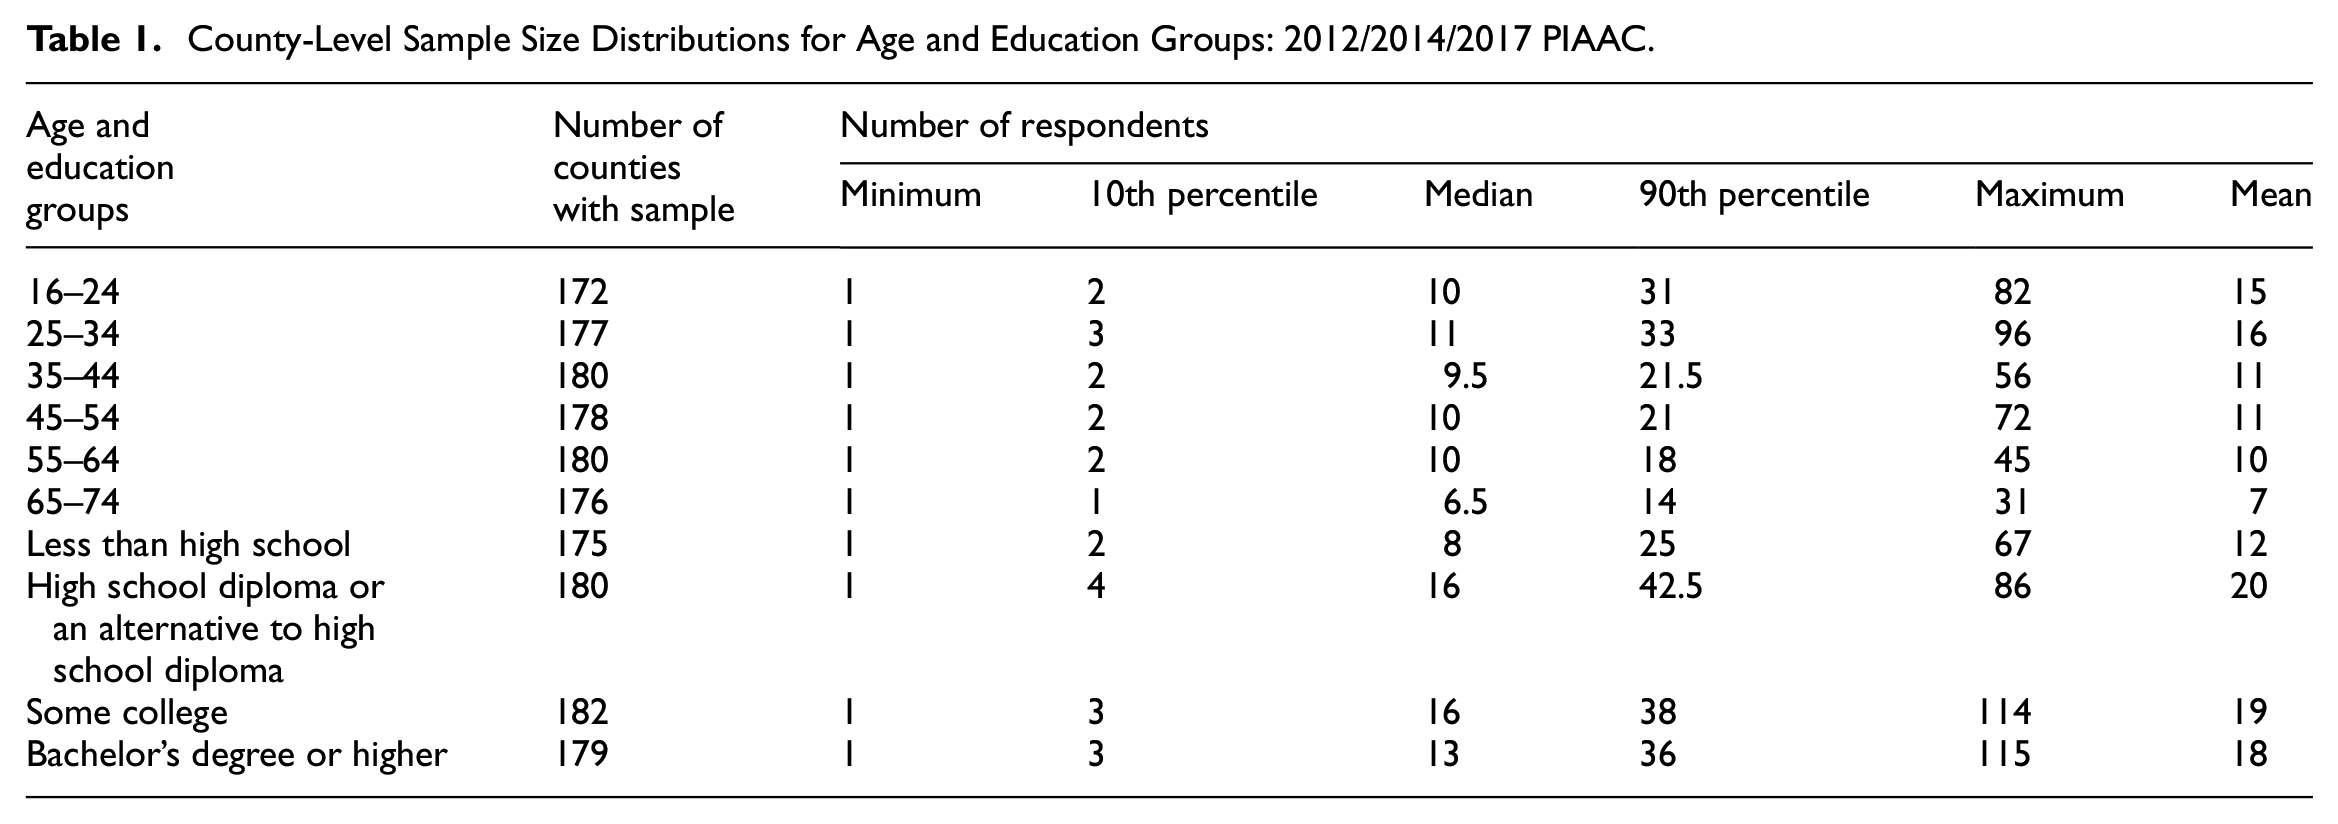
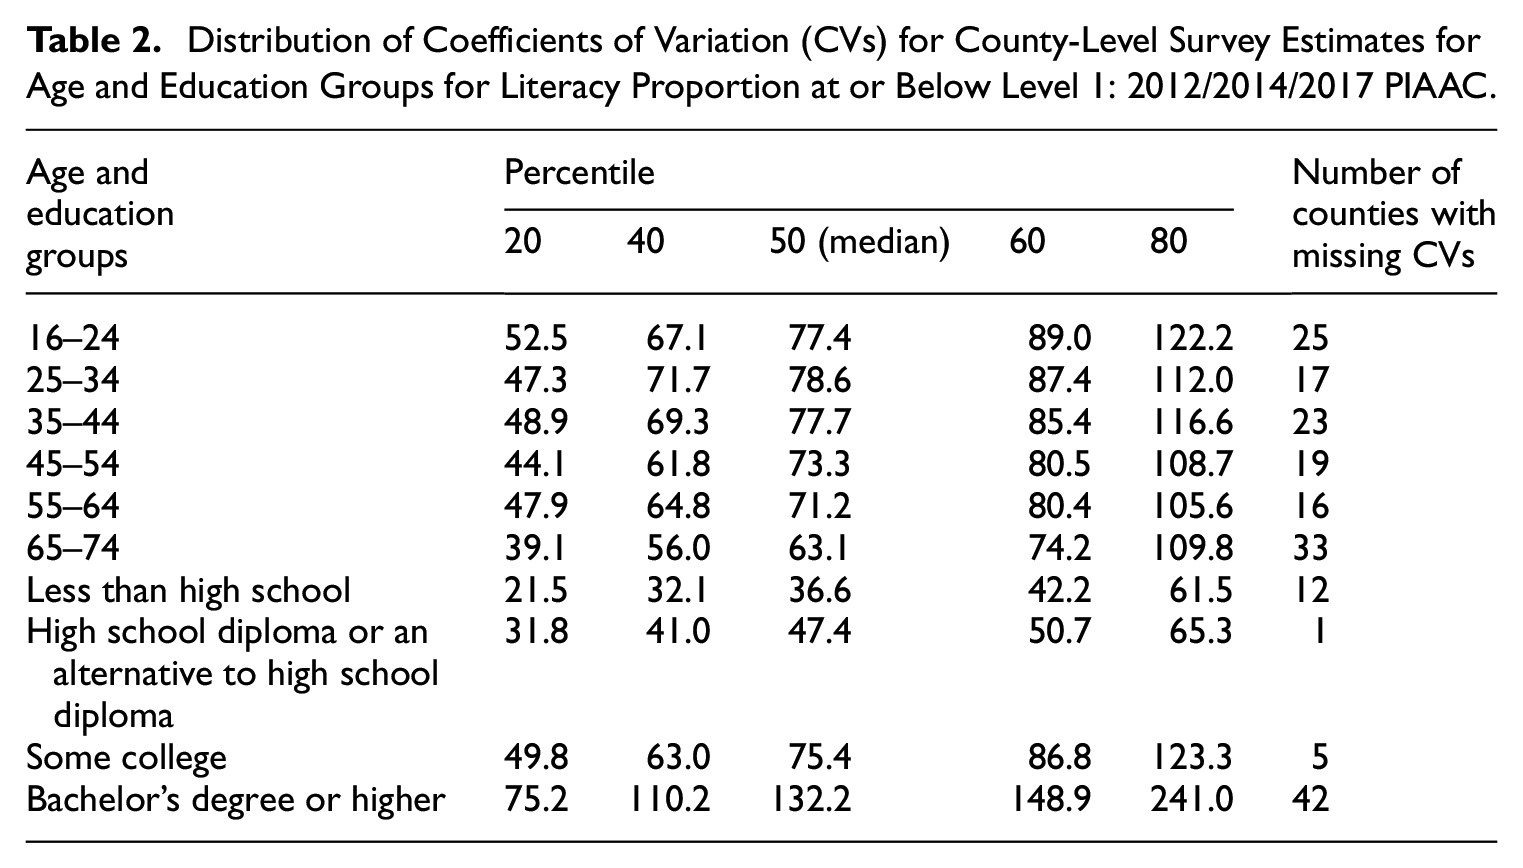
The number of county by group domains with sample data and the distributions of county by group domain sample sizes are provided in Table 1. With a small number of county-level survey estimates available for the groups, an indirect estimation approach is deemed necessary to produce estimates for all the county by age/education group domains. The medians of the county by group domain sample sizes range from 6.5 to 16, indicating that the survey estimates are subject to great uncertainty in most county by group domains. As illustrated in Table 2, the median coefficients of variation (CVs) for county-level survey estimates of literacy P1 for age and education groups, ranges from 36.6% to 132.2%. In addition, some of the CVs are not available, because the associated survey estimates are either zero or have nonestimable variances. In addition to producing estimates for all the domains of interest, the indirect estimation approach described in the next section helps reduce the uncertainty of the survey estimates. For the rest of the manuscript, let the county by group domains with sample data be denoted by in-sample domains and let the county by group domains without sample data be denoted by not-in-sample domains.
County-Level Sample Size Distributions for Age and Education Groups: 2012/2014/2017 PIAAC.
Distribution of Coefficients of Variation (CVs) for County-Level Survey Estimates for Age and Education Groups for Literacy Proportion at or Below Level 1: 2012/2014/2017 PIAAC.
2.2. Model-Based Estimates
Posterior distributions for the adult proficiency quantities of interest at the county, state, and state by group levels were produced in Krenzke et al. (2020) and Li et al. (2022) using area-level hierarchical Bayes linear models. Point estimates with associated variance estimates and credible intervals are directly available to download from the Skills Map. Also produced were 4,500 posterior samples for the adult proficiency quantities of interest. These posterior samples are used in this manuscript to construct the county by group-level estimates using an indirect estimation approach. High level details about the production of these model estimates are presented in the rest of this section. See Krenzke et al. (2020) and Li et al. (2022) for additional information.
In Krenzke et al. (2020), the proportions P1 and P3 were modeled using a bivariate model specified as follows:
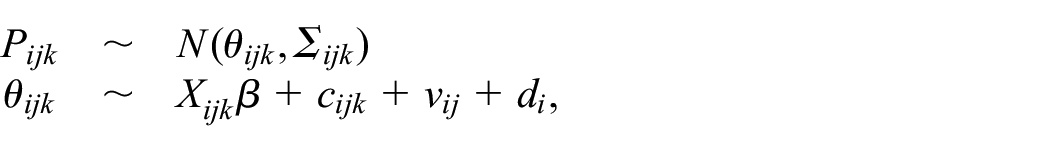
where

where
In Li et al. (2022), for each group
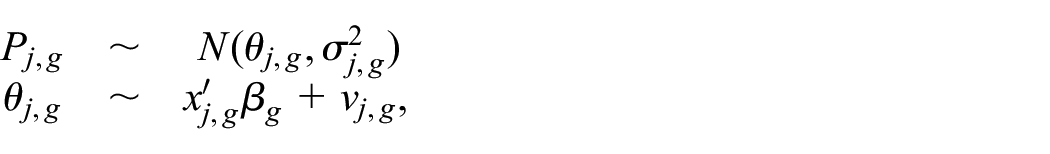
where

where
Without loss of generality in notation, let
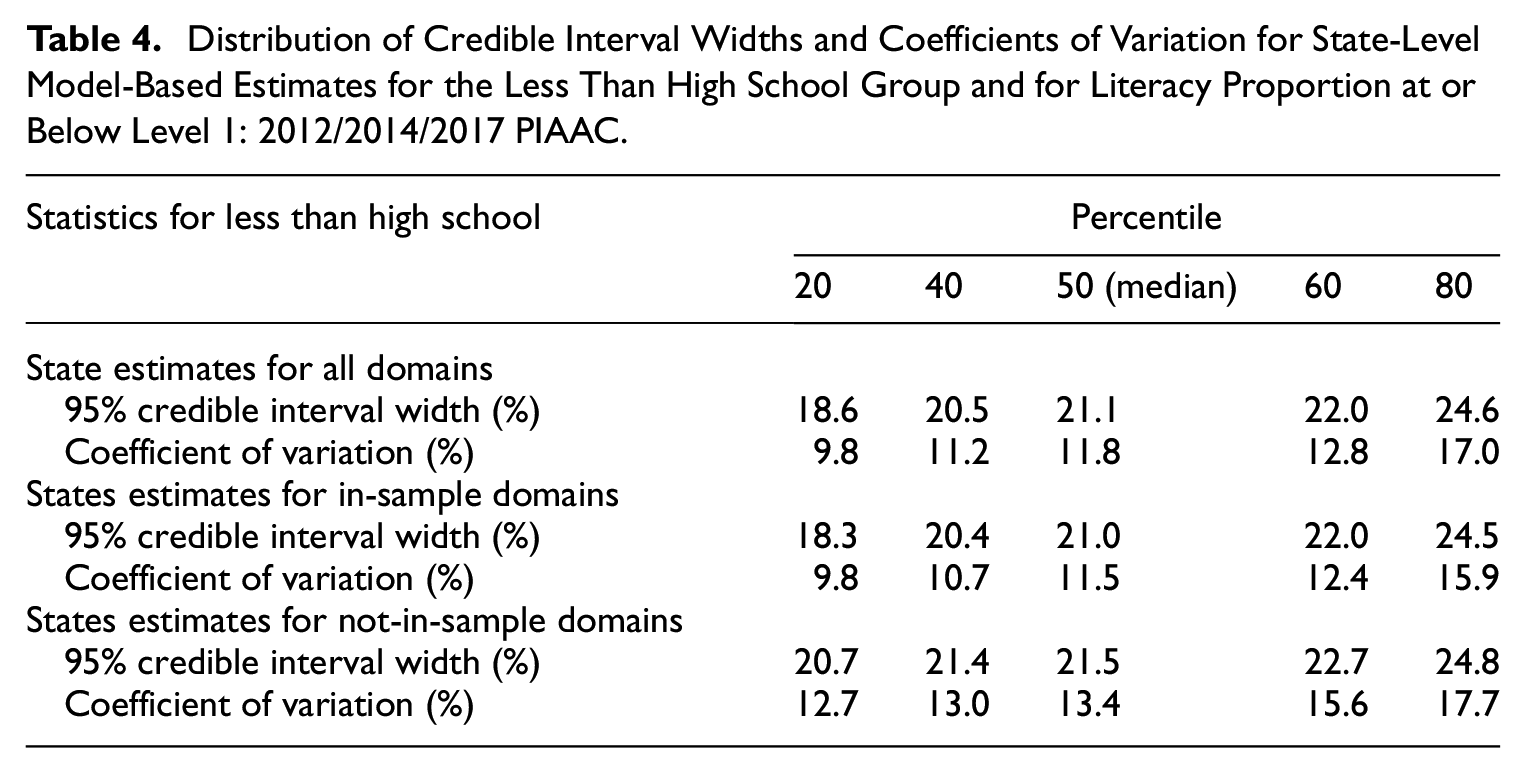
The quality of the county by group-level estimates is dictated by the quality of the county-level, state-level, and state by group-level model-based estimates, since the latter serve as the only inputs into the model used to produce the former, to be described in the next section. Uncertainty statistics for model-based estimates of literacy P1 are provided in Tables 3 and 4. Recall that these model-based estimates were produced using hierarchical Bayes small area estimation models. The median credible interval width is 8.0% for county-level model-based estimates of P1, 6.1% for state-level model-based estimates, and 21.1% for state-level model-based estimates of literacy P1 for the less-than-high-school education group. In addition, the median CV is 10.0% for the county-level model-based estimates of P1, 8.1% for the state-level model-based estimates of P1, and 11.8% for state-level model-based estimates of literacy P1 for the less-than-high-school education group.
Distribution of Credible Interval Widths and Coefficients of Variation for County-Level and State-Level Model-Based Estimates for Literacy Proportion at or Below Level 1: 2012/2014/2017.
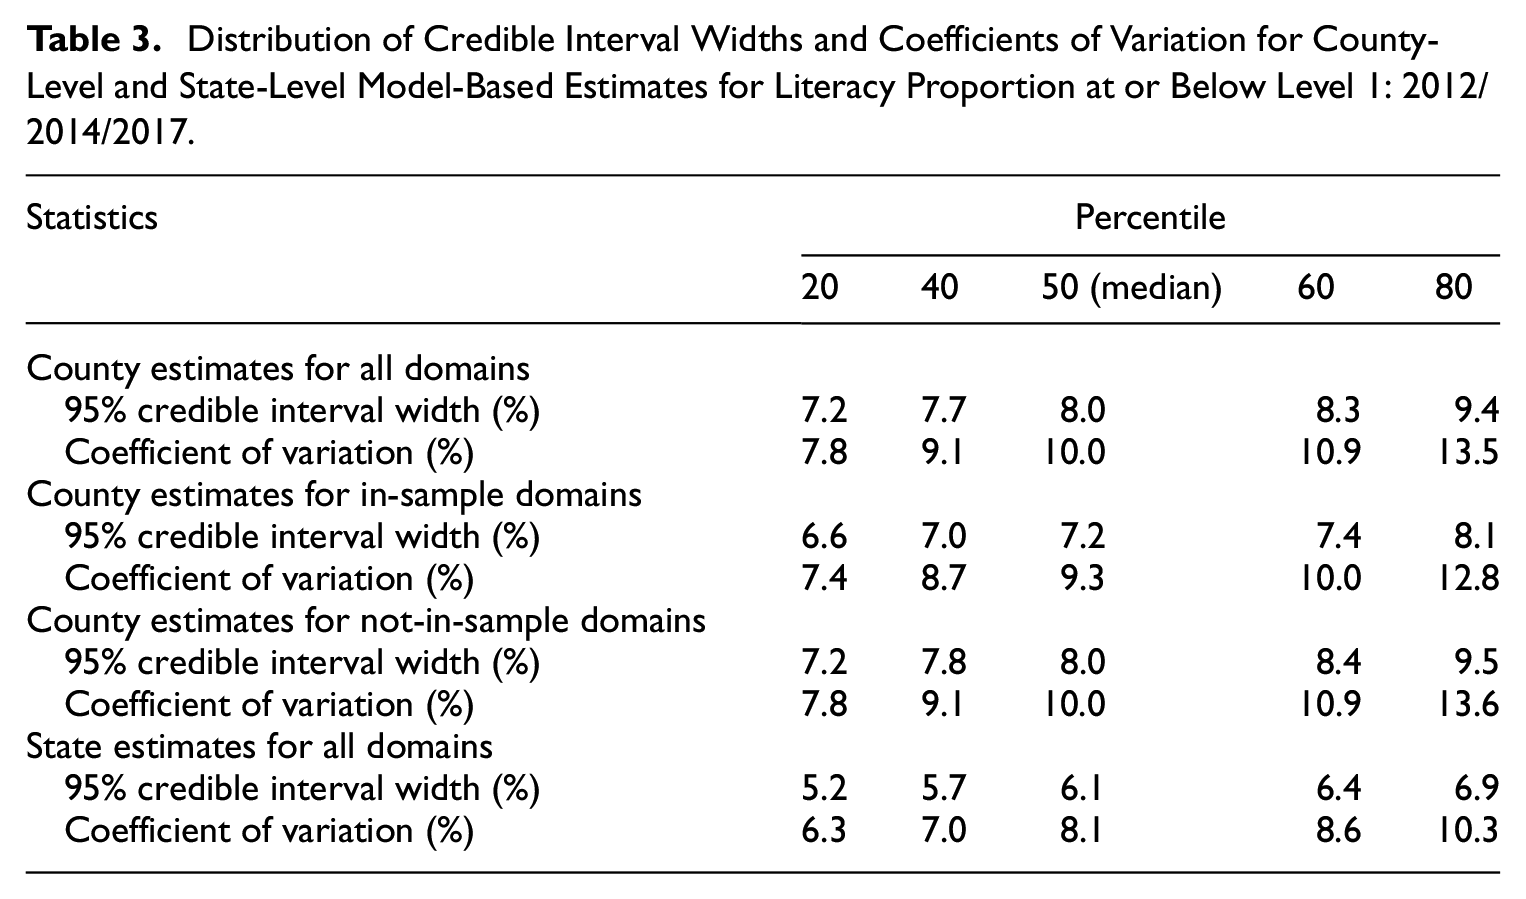
Distribution of Credible Interval Widths and Coefficients of Variation for State-Level Model-Based Estimates for the Less Than High School Group and for Literacy Proportion at or Below Level 1: 2012/2014/2017 PIAAC.
Finally, it is important to note that the posterior distributions for the county-level and state-level adult proficiency quantities were produced assuming normal distribution for the data level in the hierarchical Bayes model specified for the survey estimates (see Krenzke et al. 2020). Hence, some of the posterior samples
3. Allocation Method
The county-level indirect estimates for groups are constructed using an allocation method. This method consists of using the county-level, state-level, and state by group-level SAE model-based estimates and allocating them to the county by group domains of interest via a deterministic model. Model-based estimates for P1 and P3 are constructed first, and then their sum is subtracted from one to obtain the model-based estimates for P2; recall that P1 + P2 + P3 = 1 by definition. Also, literacy and numeracy measures are estimated independently. These approaches are consistent with the approaches in Krenzke et al. (2020) and Li et al. (2022).
Following the notation from the previous section, let the pseudo-posterior samples for the county by group-level quantities of interest be defined as
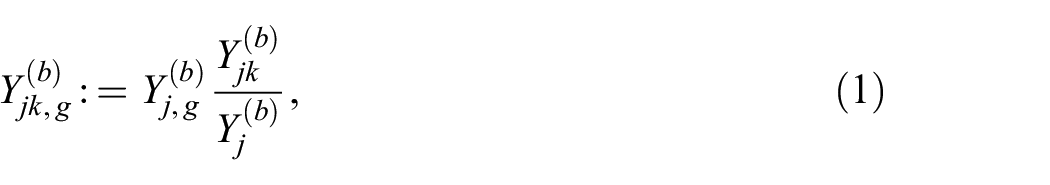
where
Among the 175 counties with sample data for the less-than high-school education group, there were three P1 model-based literacy estimates greater than 1. Among the 2,967 counties without sample data for the less-than-high-school education group, there were forty-two P1 model-based literacy estimates greater than 1. None of the county-level P1 model-based estimates for the less-than-high-school education group were below 0. No adjustment was needed for the average score model-based estimates because all were positive. The P1 literacy model-based county by group-level estimates for the population with less than high school education are illustrated in the map in Figure 1.

Map of county-level model-based estimates for the proportion at or below Level 1 literacy for less-than-high-school education group (as percentages).
4. Validation of Final Estimates
The survey estimates constructed for the county by age/education groups serve as inputs into the validation process, along with the selected ACS estimates related to proficiency described in Section 2. Three validation metrics are considered: (1) visual displays of the magnitude and direction from survey estimates to model-based estimates, (2) visual displays of the relationship between the proficiency estimates and related ACS variables, and (3) uncertainty measures for the model-based estimates.
The deviation plots in Figure 2 show the magnitude and direction from survey estimates to model-based estimates of literacy proportions for the less-than-high-school education group, by sample size. The starting point of the arrow is the survey estimate and the end point of the arrow is the model estimate. Short arrows correspond to small differences between the survey and the model-based estimates and long arrows correspond to large differences between the survey and the model-based estimates. The deviation is more substantial in domains with smaller sample sizes than those in domains with larger sample sizes. Arrows pointing upward correspond to negative differences between the survey and the model-based estimates and arrows pointing downward correspond to positive differences between the survey and the model-based estimates. Both positive and negative differences are observed.

Literacy proportion (less than high school)—Deviation plots of point estimates by sample size.
Two ACS variables related to adult proficiency are now selected in the validation of the county by group-level estimates. They are available from the initial pool of variables considered by Krenzke et al. (2020) for the SAE models that combined PIAAC survey data with ACS data. The first variable is the proportion of population below poverty and the second variable is the proportion of population employed. The former variable is one of the seven covariates included in the SAE models in Krenzke et al. (2020) and Li et al. (2022). While the latter variable was not included as a covariate in the SAE models in Krenzke et al. (2020) or Li et al. (2022), it was part of the initial pool of variables considered in the development of those models. The proportion of population employed was not included in the final SAE models because this variable was highly correlated with other model covariates. These variables are available from the 2013 to 2017 ACS, for all the county by group domains of interest. Both the ACS estimates and the PIAAC estimates are “period” estimates, being constructed using combined samples across multiple years.
Scatterplots of estimates of literacy P1 for the less-than-high-school education group are illustrated in Figure 3, against the selected ACS variables (proportion of population below poverty, proportion of population employed). In general, similar range of the survey estimates and model-based estimates, and similar relationship between the ACS variables and the estimates are observed, with this relationship being clearer between the model-based estimates and the ACS variables than between the survey estimates and the ACS variables. This result is expected because the county by group-level model-based estimates are functions of the county, state, and state by group-level model-based estimates, which are themselves functions of, or related to, the ACS variables considered here; recall that the county, state, and state by group-level model-based estimates are composites of survey estimates (when available) and ACS estimates (as described in section 1) which include estimated proportions of population below poverty and other covariates related to the proportion of population employed (as described above).

Literacy proportion at or below Level 1 for less-than-high-school education group versus selected ACS variables—County by group-level estimates: 2012/2014/2017 PIAAC.
As reported in Table 5, the median credible interval width is 24.5% for county-level estimates of literacy P1 for the less-than-high-school education group, where the median is taken over all the county by group domains in the U.S. When these county by group domains are categorized by sample availability, the median credible interval widths are 22.7% and 24.7% for in-sample and not-in-sample domains, respectively.
Distribution of Credible Interval Widths and Coefficients of Variation for County-Level Model-Based Estimates for Less Than High School for Literacy Proportion at or Below Level 1: 2012/2014/2017 PIAAC.
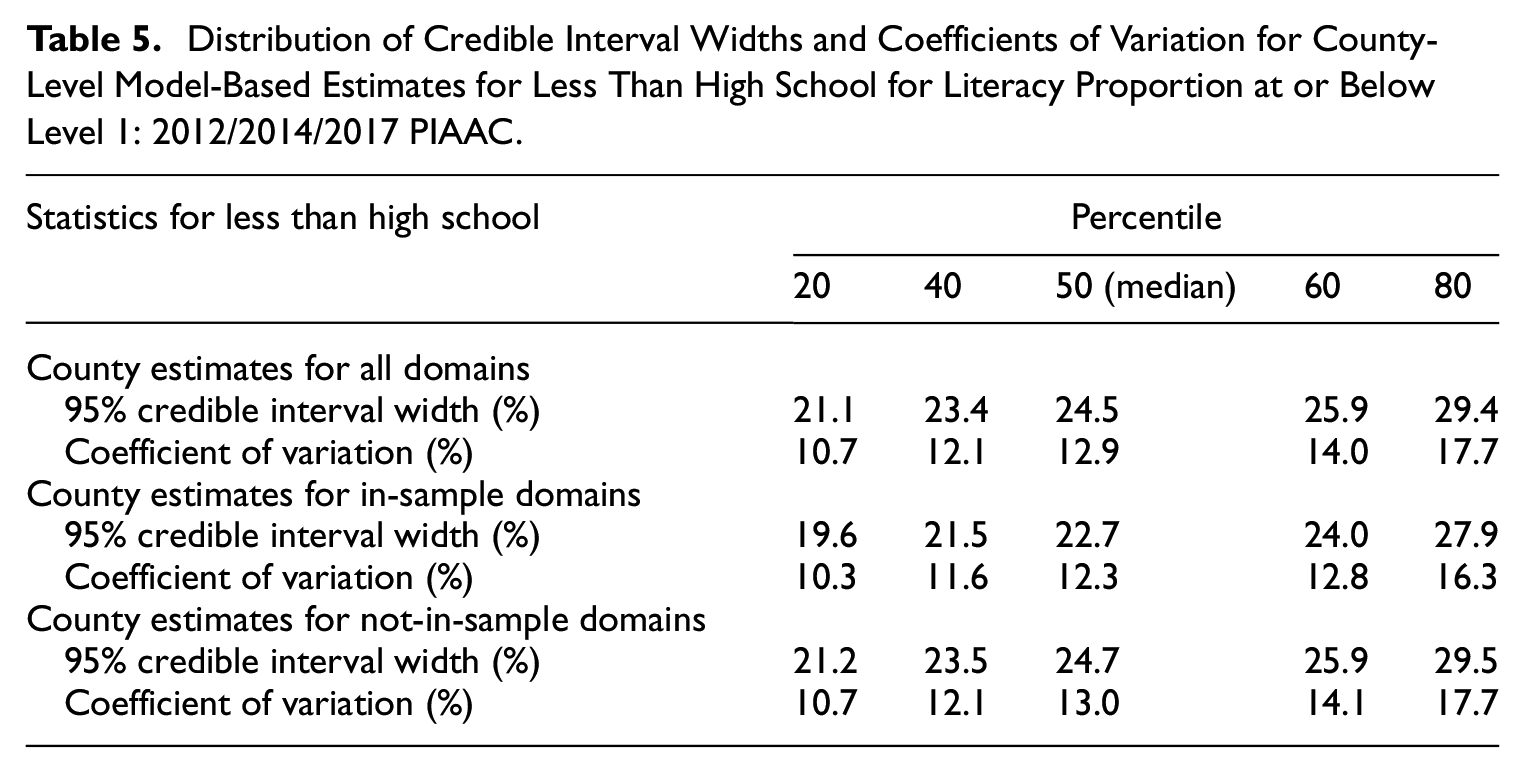
The CVs for the county-level model-based estimates of literacy P1 for the less-than-high-school education group are also summarized in Table 5 by sample availability. For most of these county by group domains, the CVs are lower than 20%. All CVs reported in Table 5 for in-sample domains are less than half of the corresponding CVs for the survey estimates reported previously in Table 2. This result is expected because the uncertainty in the model-based county-level, state-level, and state by group-level estimates used as inputs into the allocation method was lower than the uncertainty in the corresponding survey estimates (see Krenzke et al. 2020 and Li et al. 2022). Also, the CVs reported in Table 5 are larger than the CVs for the state-level model-based estimates of literacy P1 for the less-than-high-school education group reported previously in Table 4: the state-level estimates by group have a median CV of 11.8% compared to 12.9% for the county-level estimates by group. This result is expected because the level of aggregation in this paper is finer than the level of aggregation in the cited report (county by group vs. state by group).
5. Concluding Remarks and Discussion
An allocation approach was developed to produce county-level model-based estimates of adult proficiency for six age groups and four educational attainment groups. Previous model-based SAE estimates, constructed at the county, state, and state by group levels, served as inputs into the allocation approach. The resulting county by group-level estimates are available in the Skills Map at https://nces.ed.gov/surveys/piaac/skillsmap/, along with the previously available county, state, and state by group-level estimates.
Due to challenges related to data availability at the county by group level, a top-down estimation approach was adopted in this manuscript, unlike the estimation approach in Krenzke et al. (2020) and Li et al. (2022). By starting with the available estimates at the county, state, and state by group levels, the proposed method allows for estimation at the county by group level, with pseudo-posterior distributions computed for all the quantities of interest at this fine level of aggregation. No benchmarking adjustments are necessary to the county by group-level estimates, because upon aggregation to higher levels these estimates are consistent with the previously available estimates that served as starting values in the estimation process. While the proposed method is based on the exact definition of the quantities of interest, an approximation of this definition had to be implemented due to a lack of consistently measured and reliable population estimates at nested levels of aggregation. The evaluation of the implicit working assumption and resulting estimates did not raise any serious concerns.
Because this manuscript addresses the production of reliable estimates for small domains, where there was insufficient sample data available, there are similarities between the presented estimation approach and small area estimation approaches (see Rao and Molina 2015). However, unlike many small area estimation studies, the presented estimation approach did not start at the level of aggregation at which estimates were needed, or at a lower level of aggregation followed by an aggregation step to higher levels. Also, unlike a small area estimation study, the presented estimation approach did not explicitly address variance reduction in the survey estimates at the level of interest. The observed variance reduction was a result of the variance reduction already achieved by Krenzke et al. (2020) and Li et al. (2022). To note, an area-level small area estimation model specified for the county by group-level survey estimates would have addressed variance reduction explicitly. However, in addition to good quality for the survey variance estimates, the predictive power of such a model would have needed a strong set of available predictors for all the domains of interest. In addition, benchmarking adjustments would have been needed for the resulting estimates to be consistent with the previously published estimates, and any aggregation to higher levels implies availability of consistent population totals (to serve as aggregation weights).