
Abstract
The European Statistics Awards Programme is a multiannual program for engaging with, and tapping into the potential of, the research and innovation community at large. This is achieved through competitions with pecuniary prizes for the best performers. One of the strands within that program offers awards for the accurate nowcasting of monthly time series of interest to policymakers. This paper presents the design of the nowcasting competition as well as the performance of the best entries of the first annual round. In terms of accuracy, the competition has generated promising results—which do however need further fine-tuning before being possible to deploy in statistical production. The competitions feature a particular prize for submissions having a potential for scaling up to regular statistical production—and in response to this, teams have submitted ample documentation (including code). The awards program should also generate experience that the official statistics community can learn from. This paper demonstrates how the multi-annual nature of the program has allowed various design changes to be implemented for the last nowcasting round. The main work now lies ahead: the paper outlines the plans for further developing the most promising competition contributions, potentially leading to new Eurostat experimental statistics products.
1. Introduction
1.1. The Need for More Timely Official Statistics
The string of recent crises have demonstrated like never before the value of accurate and timely data to support the democratic decision processes. For instance, the Covid-19 crisis required timely data to underpin public health policy (see Equiza-Goñi 2022; Rosenbaum et al. 2021; Vestergaard and Mølbak 2020). In recent years, the producers of official statistics have therefore been faced with increased demands from their users to be more responsive and agile especially in times of crises, to expand the range of statistics produced, and to improve their timeliness and level of detail. To take but one recent example from a European context (with similar requirements being expressed in other international fora), the European Statistical Governance Advisory Board (2024) recommended that official statistics producers further improve the timeliness through building on positive experience of early estimates and experimental statistics. Such calls for action from key stakeholders constitute a key driver for innovation in official statistics, in that they draw the attention to the need to innovate; this visibility does, in turn, lead to skills and resources being devoted to the issue.
1.2. Approaches to Increase the Timeliness of Official Statistics
While official statistics producers typically limit themselves to publishing statistics about the recent past (leaving it up to users to produce forecasts about the future), there is already a trend toward shrinking the time elapsed between the reference period under study and the first publication of statistics—that is, increasing the timeliness. Schematically speaking, there are two different approaches to achieve this: (i) accelerate the production chain, thus generating the current design-based estimates faster; (ii) apply model-based methods—which may include large bodies of (sometimes proprietary) auxiliary data. While reality is often a sliding scale (even purportedly design-based estimates frequently rely upon model-based approaches for the treatment of item or unit nonresponse), D’Elia (2014) provides an overview of the two approaches and a framework for comparing them. In the same vein, Chen et al. (2022) note that approach (i) can be costly, may place undue burden on respondents, and may reduce the rate of response—and notes how blending in approach (ii) (using alternative data sources and contemporary machine learning techniques) provides a possible bridge for the data availability gaps that producers of official statistics face. Both D’Elia and Chen et al. discuss applications related to national accounts, which is an example of an official statistics area that does already at present include model-based elements from time series. For instance, Eurostat has been publishing flash estimates for various economic indicators for about two decades (Eurostat 2016). These flash estimates provide preliminary figures on economic metrics such as GDP growth, inflation, and unemployment rates, giving policymakers and analysts an early indication of the state of the economy before final data become available. Thus, for at least some domains, model-based approaches are already part and parcel of regularly disseminated official statistics products.
1.3. Innovation as a Means to Achieve More Timely Official Statistics
With new data sources becoming available, new approaches based on advanced modeling (possibly using alternative, almost real-time, information) have an important potential to provide accurate estimates of key indicators much faster than before; there is thus scope for innovation. The official statistics community has a longstanding tradition of fostering innovation and outreach to the research community at large. One important approach traditionally pursued is the funding of research—such as the various projects related to forecasting under the 5th European Research Framework Programme presented by Eurostat (2007).
Another important way of engaging with the scientific community is by means of events. For more than thirty years, Eurostat has organized a conference series on New Techniques and Technologies (NTTS) in official statistics (Di Iorio et al. 2021; Karlberg et al. 2015, 2018), which has brought together official statisticians with the research community.
There is already today considerable activity in the research community on topics related to official statistics. However, it seems to be the case that much of this activity takes place among institutions with a longstanding tradition of official statistics research and education—such as current and former holders of the European Masters in Official Statistics (EMOS) label (Navarre et al. 2021; Zwick 2016).
1.4. New Approaches to Reach New Communities
While it is absolutely essential to nurture the connection with the established official statistics research community, there is arguably an untapped potential for innovation in the field of European statistics represented by the manifold academic and professional disciplines typically not involved in official statistics (Eurostat 2020).
Somewhat related to this need, the European Statistical System (ESS)—that is, Eurostat together with numerous European National Statistical Institutes (NSIs)—has reached out to the education community through the European Statistics Competition (ESC), and thereby managed to engage with thousands of secondary school pupils and their teachers (Sanz et al. 2019). While the primary objective of the ESC was to increase statistical literacy, an unforeseen collateral advantage was the numerous highly original promotional videos for European statistics that have resulted from the ESC final round each year.
The European Big Data Hackathon, launched in 2017 (Karlberg et al. 2018) generated innovative solutions related to issues such as labor market skills (Opik et al. 2018), time use (Zeni et al. 2021), international trade and early warning systems. In the most recent (Eurostat 2023a) hackathon, the challenge was to develop an early warning system relevant for EU policymakers based on anonymized daily financial transaction data made available by a data aggregator and data science company. The participants had to swiftly produce indicators informing an urgent policy response—a concrete example of using privately held data for statistical purposes. The organization of the hackathon series has provided the members of the ESS with the opportunity to engage with data intermediaries and private data holders, data scientists and consultants from academia and the private sector, IT experts and infrastructure providers, policy experts and researchers. Similar initiatives have also been taken at the global level under the auspices of the United Nations—including datathons, which (in contrast to hackathons that are focusing on the delivery of a prototype at the end of the event) are more oriented toward the analysis of a given dataset.
The official statistics community has also taken various steps to reach out to scientific actors within the private sector traditionally not active in official statistics in order to make use of their skills and insights in non-traditional application. Within the ESS, the ESS Committee endorsed an innovation agenda in February 2023 (Ascheri et al. 2022; Eurostat 2023b, 2024a). This agenda aims at addressing today’s pressing challenges but also seeks to ensure that the ESS grasps the opportunities offered by new digital technologies to explore new data sources in order to meet the expectations of the users for more timely statistics.
The agenda also recognizes the need to expand and strengthen collaboration with academia and the private sector that is often well equipped in the new tools, technologies, and skills. The agenda encompasses cooperation with stakeholders outside the ESS, including non-statistical organizations and their innovation centers and hubs. Universities and research institutes obtain specific attention in the agenda, especially considering that they provide access to state-of-the-art data analytics research and can be critical when it comes to developing applied research in the domain of official statistics.
1.5. Competitions to Improve Official Statistics Nowcasting Methods
The ESC clearly does not target the scientific community at all, and the European Big Data Hackathon is limited by design to teams nominated by the NSIs of the ESS (thus mainly targeting NSI staff and only taking scientists on board if designated by an NSI) as well as EMOS students. In contrast, other competitions—at the European level most notably the Big Data Competition (BDCOMP), dedicated to nowcasting with the possible use of auxiliary “big data” sources (Kovachev et al. 2017)—have had a more inclusive approach, and have thus seen a large share of contributions from academia.
While BDCOMP was carried out with limited means and on an experimental basis, and with a relatively low level of participation, Eurostat recently (Eurostat 2020) decided to launch a more ambitious program, offering pecuniary awards for innovative solutions and improvements, and engaging in outreach to the various relevant communities to make the availability of these awards known. This was done through the European Statistics Awards Programme which spans over a few years and encompasses two strands:
The European Statistics Awards for Nowcasting, with the first two rounds launched in 2022 (Eurostat 2022a) and 2023 (Eurostat 2023c). Each round lasts around one year and contains three nowcasting competitions.
The European Statistics Awards for Web Intelligence, with the first round launched in 2022 (Eurostat 2022b).
In Section 2 of this paper, we present the design of the European Statistics Awards for Nowcasting in more detail. Thereafter, we summarize the level of participation and the nature of the submissions of the teams in Section 3. We then proceed to discuss the quantitative and qualitative results of the first nowcasting round in Section 4, while Section 5 contains some concluding remarks concerning concrete steps taken to make use of the nowcasting methods developed by the teams, planned improvements to the design of the final round of the nowcasting awards program and possible future improvements for subsequent programs of a similar nature.
2. The Nowcasting Awards: A New Initiative
2.1. Objective
The objective of the European Statistics Awards for Nowcasting is to discover promising methodologies and potential external data sources that could be used to improve the timeliness of key EU economic indicators.
The awards also aim to—in line with the ambitions of the ESS innovation agenda (Eurostat 2023b, 2024a)—explore novel ways to engage with communities outside of the traditional statistical ecosystem, and interact directly with data scientists eager to experiment and showcase innovative approaches to nowcasting taking benefit of the data revolution and advanced methods.
The European Statistics Awards for Nowcasting is run as a program with annual rounds of three concurrent competitions rather than as a one-off exercise. This renders economies of scale (as the overhead is shared), with infrastructure set up and material prepared for the first round being available for reuse in subsequent competition rounds. There also is a learning process for the organizers from which they can benefit during subsequent rounds. Additionally, the activities dedicated to the promotion of the competition can reach an ever-wider audience with each new round, thus leading to higher participation.
2.2. Selection of Time Series
While there are numerous monthly time series being published by Eurostat, great attention was put to their characteristics when selecting them. The general approach was to have each nowcasting round addressing a different statistical domain: business statistics for the first round, energy statistics for the second round and trade statistics for the third (forthcoming at the time of writing) round. The individual time series were also assessed for policy relevance and public interest at the time of the launch of the nowcasting round, with close contact between the organizing team and the Eurostat colleagues responsible for the relevant statistical areas. Importantly, the time series were also assessed for their current timeliness: if the current first European statistics releases would already be very timely (with flash estimates published early on), there would not be much potential for improvement. Conversely, indicators with a very long time between the end of a reference period and the publication of European statistics would (while having a great innovation potential) be problematic as they would require a very long time for a nowcasting round to render a result. The latter was also a reason for limiting the scope to monthly time series—as lower-frequency (e.g., quarterly or yearly), series would result in competitions with a very long time span (if the traditional approach of requiring nowcasts for more than one time period is applied).
For the first nowcasting round, where the three time series concerned business statistics, the topics selected were: producer prices in industry (PPI), production volume in industry (PVI), and tourism (the number of nights spent at tourist accommodation establishments). Those were time series of public interest considering the general importance of prices (not the least during the current time of high inflation) and the impact of the pandemic and other crises (not the least on the tourism industry).
For the second nowcasting round, the three energy statistics time series selected concerned electricity availability, oil (and petroleum product) deliveries, and (inland) gas consumption. They have a high relevance due to their recent high volatility given the war in Ukraine, rising prices, shortages in supply as well as ecological pressure linked to climate change. In 2024, a third nowcasting round will be launched, with the general theme being international trade statistics.
2.3. General Competition Rules
Each time series is considered in isolation—so formally, six different nowcasting competitions have been launched to date (three for business statistics and three for energy statistics). As per the competitions rules posted at the competition website (https://statistics-awards.eu/), teams of up to five persons can compete in the nowcasting awards. To have an eligible entry for the competition, a team must provide point estimates for at least five (out of the up to twenty-seven) countries for which the time series is published. These estimates have to be provided for a minimum of six reference periods (months); for the first round, teams were required to provide them for six consecutive (out of eight possible) months, whereas for the second round, any six (out of ten possible) months are required.
As the objective of the competition is to elicit as many good approaches as possible, each team is allowed to make multiple (up to five) different entries which may apply different nowcasting approaches. For each entry, the team is required to provide a brief description of the approach used to arrive at their estimates. As further illustrated in Section 2.5 below, entries that use an approach consistently throughout the competition (while possibly varying some hyperparameters) are rewarded for integrity. Each submission for a reference month had to be provided before the end (midnight GMT) of the last day of that month (thus truly making it a nowcast).
2.4. Accuracy Awards
The key aspect of a nowcasting model is to consistently deliver accurate estimates. For this reason, the accuracy prizes of the nowcasting competition mainly consider the mean of the squared relative error (MSRE) of the nowcasted values (with the first official release by Eurostat of the monthly value of the time series as the reference). However, considering that teams may submit nowcasts for different sets of countries, there needs to be a “level playing field,” since the time series of certain countries might be easier to predict than others. Therefore a weighting factor v c is attributed to each country c for the time series in scope of the competition. This volatility index is calculated as the inverse of the volatility of the time series calculated on its historical values. The volatility is computed as the squared root of the estimated residuals of a GARCH(1,1) model (Bollerslev 1986) fitted on the time series differenced to stationarity. For each of the three time series, the following evaluation algorithm was applied:
Letting y
ci
denote the first official release for country c and reference period i and letting

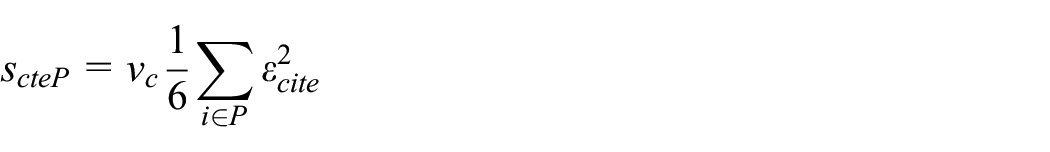
Denoting the three possible sets of consecutive six-month periods by A (September 2022–February 2023), B (October 2022–March 2023), and C (November 2022–April 2023), the country score s cteP for each six-month period P were computed for each country, entry, and team by multiplying the mean squared relative residuals of the country with the volatility score v c of that country:
If, for a given combination of c, t, and e,
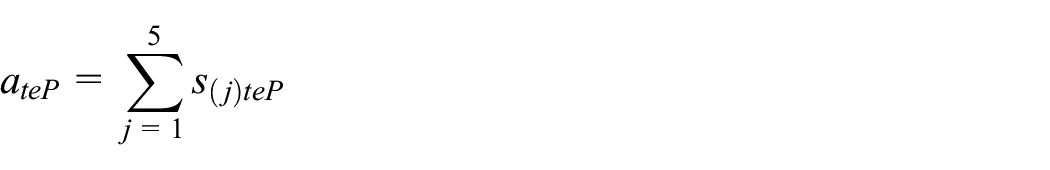
Letting s(j)teP denote the jth valid country score (when sorted in ascending order within each combination of team, entry, and period), the candidate accuracy score a teP is obtained as
It is thus not possible to “mix and match” the country scores—they do not only have to stem from the same entry e, but they also have to concern the same time period P. Still, as the five best country scores are considered, it is obvious that submitting nowcasts for more countries invariably increases the chance of a team to arrive at a better candidate accuracy score. As a result, we did observe that the majority of the teams completing the first nowcasting round submitted nowcasting values for almost all countries.
For each team t, the (overall) accuracy score is defined as the minimum score across all entries and periods
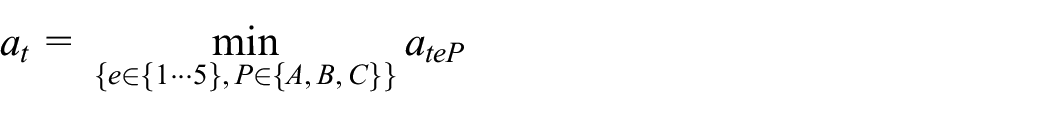
Thus, apart from the requirement that all five countries have to concern the same entry and the same time period, all combinations of entries and time periods are eligible. The rules are thus such that there is always a potential benefit for a team to submit a larger set of nowcasts. (In case resources—e.g., analytical efforts or acquisition of auxiliary data—are required for submitting a larger set, the dispersion of resources across a larger set of nowcasts could however mean that a narrower approach, investing in a “few good nowcasts,” is more advantageous than “going wide” and submitting nowcasts for all countries.)
For each competition (i.e., time series), the three teams with the best accuracy scores are awarded accuracy prizes.
For the second nowcasting round (still running at the time of submission of this manuscript), the requirement of consecutive months was dropped, and all
2.5. Reproducibility Awards
The key objective of the nowcasting competition is to identify approaches and models that can be generalized and used in the regular production of statistical indicators. Therefore, in addition to the accuracy prizes, a “reproducibility prize,” is awarded based on the potential of the approach to be reproduced and extended to European statistic production. As there is no point in reproducing models with a suboptimal performance, only teams in the top quartile with respect to their accuracy scores are eligible to compete for the reproducibility prize of a time series. Furthermore, teams vying for this prize also have to provide complete documentation, including program code, methodology and data used. Entries that are only in the running for the accuracy prizes can be of a “black box” nature (and possibly even combine different approaches over time and thus not represent a single specific method that could be deployed in statistical production). In contrast, each entry going for the reproducibility prize has to be consistent throughout the whole competition and should correspond to an algorithm that can be programmed to run on a computer.
The Reproducibility Award score has been designed as the combination of scores along the following dimensions:
Integrity (consistent use of the same approach for all monthly submissions of an entry). An adaptative approach based on the adjustment of (hyper)parameters taking contextual information into account is permissible.
Openness of the approach (low degree of dependency on external data that are not likely to be freely available for all relevant countries and time periods).
Originality of the approach (the extent to which the entry represents an improvement in relation to the state of the art).
Interpretability of the approach (the extent to which a human could understand and articulate the relationship between the approach’s predictors and its outcome).
Simplicity of the approach (predictive validity; favoring simple, comprehensible approaches over more complicated, non-linear ones).
While the accuracy scores can be automatically calculated, the reproducibility scores for each dimension are the outcome of an expert assessment by an independent evaluation panel made up of three time series analysis experts (and thereafter mechanically summed to render the overall reproducibility score). To further detail the process:
For the assessment of reproducibility, only the top quartile of all teams (with respect to their accuracy score a t ) was taken into consideration. The rationale for this limitation is twofold: (i) if an entry has an insufficient accuracy already under ideal conditions, there is no interest in reproducing it (i.e., scaling it up to regular official statistics production); (ii) the workload of the evaluation panel needs to be kept manageable.
For each team t in scope the evaluation panel received all of the submitted documentation along with an evaluation sheet for its most accurate entry (i.e., the one generating a t ). The evaluators assessed teams in an anonymous way (not knowing the names of team members). The assessment of each member of the panel and their justification of attributed scores was attached to the report with overall results of the competition.
For each criterion i, the top entry of each team t was evaluated by all three evaluators, with each evaluator j assigning a score r ijt between 0 and 5, the score 5 being the best possible score.
Thereafter, the score for criterion i was obtained as r i•t = ⅓(r i 1t + r i 2t + r i 3t). Teams t for which r i•t < 2.5 for any criterion i were considered ineligible and thus eliminated.
The final reproducibility score of each eligible team was calculated by taking the sum r••t = r1•t + r2•t + r3•t + r4•t + r5•t . Teams t for which r••t < 15 were considered ineligible and thus eliminated.
The one eligible team with the top reproducibility score was then awarded the reproducibility prize. (In cases where none of the teams turns out to be eligible, no reproducibility prize was awarded.)
2.6. Prizes and Intellectual Property Rights
The accuracy prizes amount to 3,000, 2,000, and 1,000 EUR (for the first, second, and third team for each time series), while the reproducibility prize is 5,000 EUR per time series. Cumulatively, a team ranking first for both categories for all three time series of a nowcasting round could thus win 24,000 EUR per nowcasting round. While these pecuniary awards are deemed to be attractive to participants it is at the same time clear that they would not necessarily cover the costs that a private or public entity might have to invest in order to develop a model (and thereafter run it for six months in a row).
The issue of insufficient cost coverage was realized already at the design stage (Eurostat 2020), and for this reason, a solution was designed to also attract participants that would like to demonstrate their prowess while retaining the opportunity to sell their solutions on the market. Thus, teams that only wish to showcase their solutions without “giving it away” do have the option to only compete for the accuracy awards, in which case they retain their intellectual property rights to their entries. On the other hand, teams that go for the reproducibility awards have to license the use of their entries. This is the rationale for the higher prize in that category.
2.7. Outreach
To make the possibility to compete for the nowcasting awards known to as wide an audience as possible, there were various outreach and promotion activities, including news articles on the Eurostat website, regular posts on social media—and perhaps most importantly, direct e-mails to hundreds if not thousands of ESS stakeholders, universities, research institutes and individual researchers, encouraging them to spread the word (and possibly sign up themselves).
As discussed in Subsection 3.1 below, this massive promotion appears to have borne fruit, in the sense that around eighty teams signed up for each round of the nowcasting awards. However, one of the motivations for having a nowcasting awards program (as opposed to a one-shot competition) was that this would lead to a progressively increasing number of participants due to the increased awareness of the nowcasting awards in the research and innovation community. This effect does not seem to have materialized—or if it has, then it may have been counterbalanced by teams only competing once due to the efforts required for setting up and maintaining a high-quality nowcasting model for at least six months.
3. Team Activity
3.1. Level of Participation
The first round of competitions (in the field of business statistics) was launched in July 2022 with the final deadline for registration and submission of the results in November. In total eighty-two teams comprising 144 individuals registered for the three competitions (PPI, PVI, tourism). However, as can be seen from the left-hand part of Figure 1, the “conversion rate” (proceeding from registering to actually making submissions) was low, with only thirty-six teams actively participating in one or more of the three competitions (with most of the teams registering thus ultimately not proceeding to make any submission at all). This was further compounded by attrition, with only nineteen teams making it to the very end by fulfilling the requirement of six consecutive monthly submissions in the period between September 2022 and April 2023.
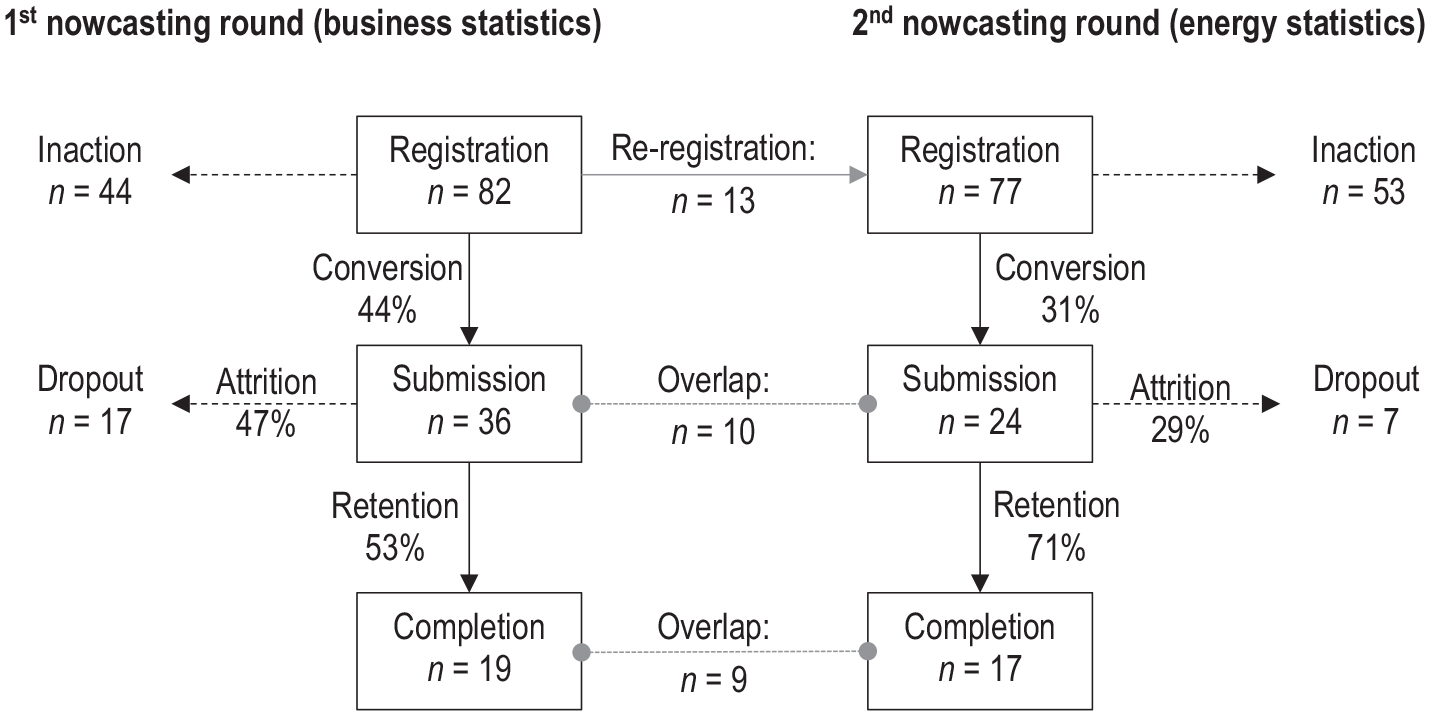
Level of participation in the first two rounds of the European Statistics Awards for Nowcasting.
Out of the nineteen teams completing the first round, the participation in the PPI, PVI, and tourism competitions was 17, 16, and 16 teams respectively. It is thus evident that there is an overlap, with most teams (thirteen) making complete submissions for all three competitions. (Three teams completed two out of the three competitions and the other three teams completed one of the three competitions.) Thus, teams that do participate often see synergies in submitting for all three competitions.
Teams wishing to compete for the reproducibility award had to compile a considerably more elaborate description. For the first round, there were nine such descriptions submitted for PPI, ten for PVI and nine for tourism.
The second round of competitions was launched in June 2023, with teams being able to submit nowcasts for the reference months of September 2023 through April 2024. At the time of submission of this manuscript, there were seventy-seven teams registered comprising 105 individuals. As can be seen from the right-hand part of Figure 1, the conversion rate was considerably lower, with only twenty-four teams making at least one submission in this round. On the other hand, the retention rate was considerably higher than in the first round, thus resulting in seventeen teams ultimately making it to the end of the competition. Largely, the same pattern (of submission for all three competitions) was observed in the second round. One driver for the high retention rate might be the fact that teams that previously already saw the entire competition through during the first round are likely to also see the second round through (hence the overlap of nine teams completing both rounds—representing more than two-thirds of the thirteen teams having re-registered).
3.2. Auxiliary Data Used
The first round of the nowcasting competition is quite rich in terms of the variety of auxiliary data used. Table 1 gives an overview of the auxiliary data used by the top-ranking teams. As the textual descriptions differ considerably in structure and terminology, the table should only be considered to be indicative of the general patterns of the data used. In many cases, the use of auxiliary information, mostly available as open data, tends to be efficient for nowcasting. The compilation of a broad range of economic indicators (Eurostat, OECD …) provides a comprehensive overview of the economic situation in the European Union. For price indicators, the use of almost instantaneous data such as stock prices, exchange rates, and other financial indicators is useful in predicting economic trends and identifying potential risks. Along the same lines, Google Trends data were used to capture the most recent trends and shifts in (consumer) behavior and can serve as a predictor for sudden changes. For the tourism indicator, the use of mobility data (including data on mobility restrictions as well as Google Trends data on relevant searches) can be noted.
Indicative Overview of the Auxiliary Data Used by the Top-Ranking Teams in the First Nowcasting Round. The Use of Historical Values of the Time Series Itself Is Considered to Be a Given and Hence Not Reported Separately.
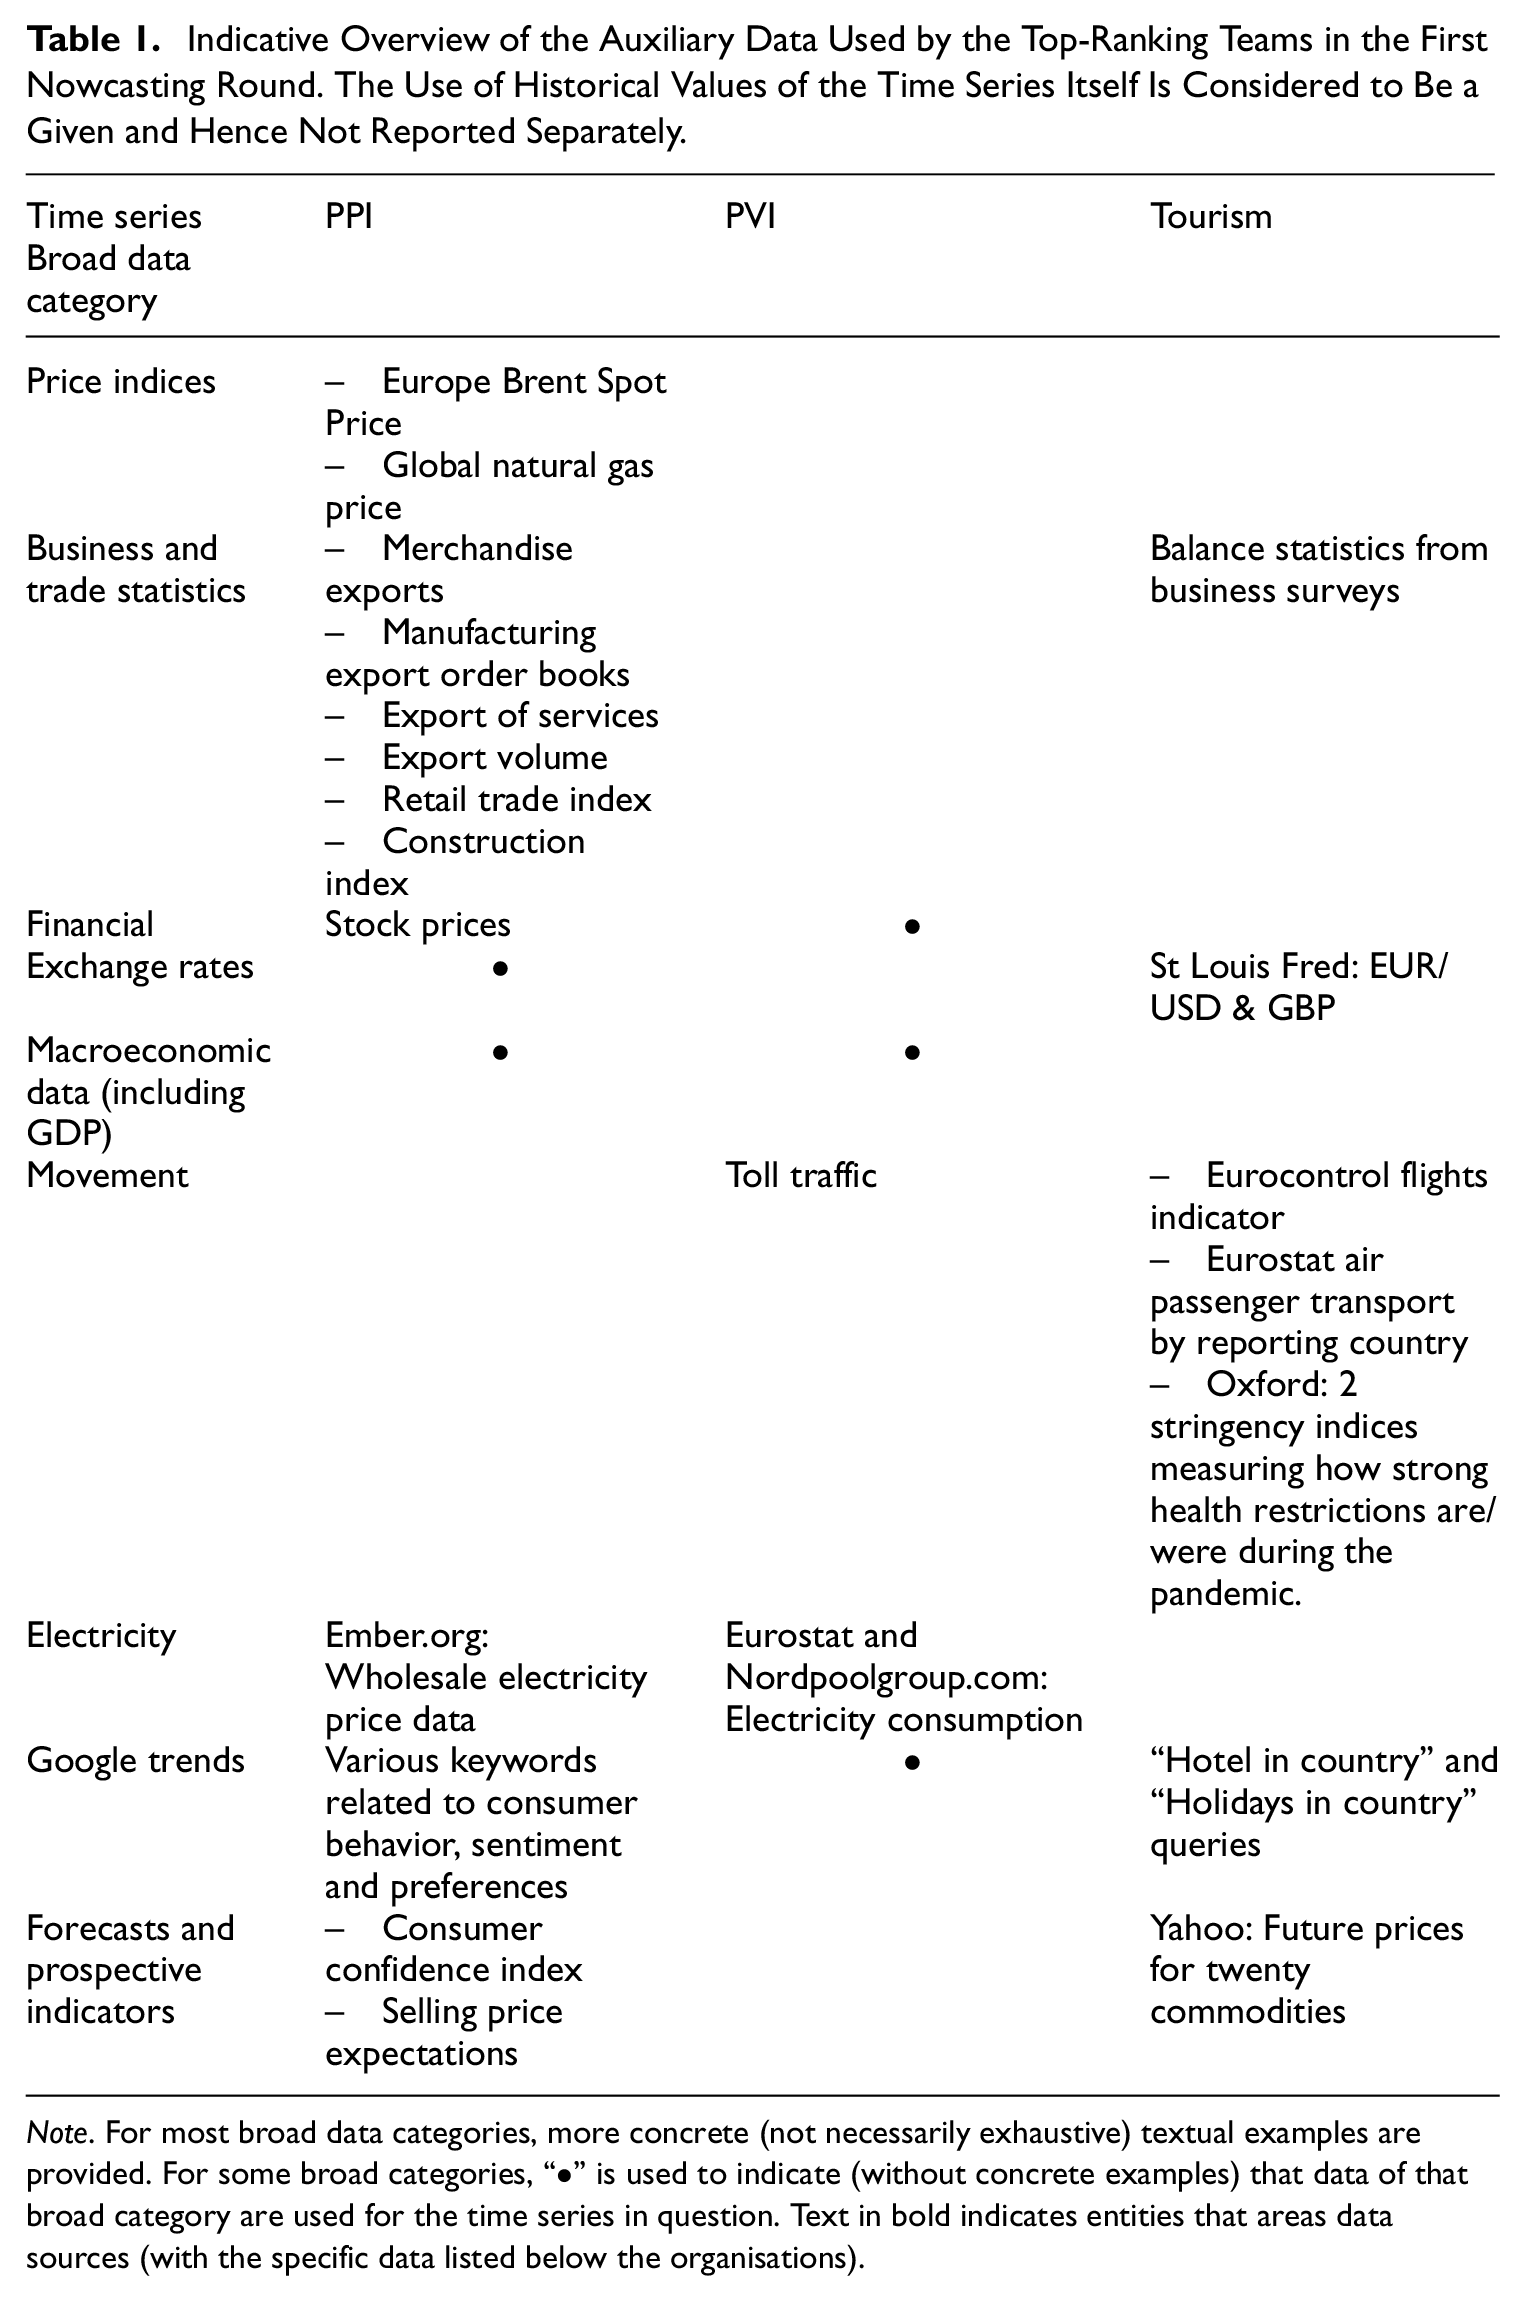
Note. For most broad data categories, more concrete (not necessarily exhaustive) textual examples are provided. For some broad categories, “•” is used to indicate (without concrete examples) that data of that broad category are used for the time series in question. Text in bold indicates entities that areas data sources (with the specific data listed below the organisations).
3.3. Models and Estimation Strategy
As is the case for auxiliary data, there is also quite some diversity regarding the nowcasting models used. In the below summary, we do not attempt to assess the performance of the approaches used or to establish an overall ranking of methods used for nowcasting. The main reason is that this will require a systematic approach benchmarking their accuracy performance across all countries leveling out the differences in country selection strategy of the competing teams—and, as further discussed in Subsection 4.3 below, there are quite some issues with the volatility index that was foreseen to achieve this level playing field. It is nonetheless interesting to establish an overview of the models and the data used by the top-ranking teams. The summary in Table 2 features a number of standard econometric approaches such as Seasonal and Trend decomposition using Loess (STLM; see Cleveland et al. 1990), ARIMA/RegARIMA, TRAMO/SEATS, and X13 models, or nonparametric approaches like ETS (Error, Trend, Seasonality) combined with grid estimation in hyper-parameter space.
Indicative Overview of the Models Used by the Top-Ranking Teams in the First Nowcasting Round.
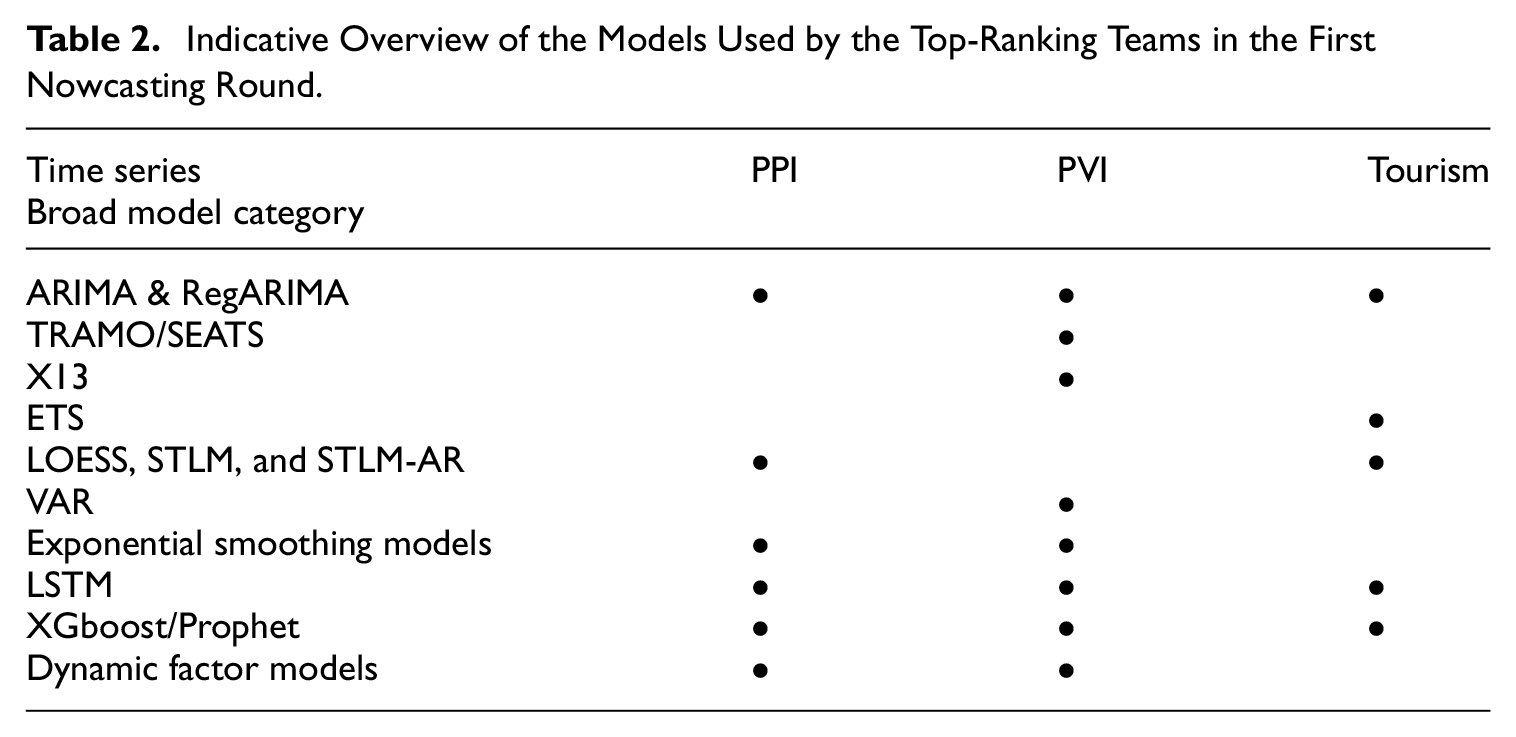
The next cluster of models involve traditional machine learning approaches (Prophet [Taylor and Letham 2018], XBoosts, Gradient) and more advanced approaches based on neural networks such as a Long Short-Term Memory (LSTM) networks (Hochreiter and Schmidhuber 1997). Some competitors also refer to the use of ensemble models where the estimator is obtained by averaging the nowcasted values obtained through different approaches. Some teams made use of the abundance of auxiliary information gathered by them by applying methods based on dimensionality reduction such as dynamic factor models (Forni et al. 2000) and used the computing power available nowadays to fine-tune hyperparameters under constraints—for example, by means of the Elastic Net (Zou and Hastie 2005).
In their reproducibility submissions, some competitors note the impossibility (given the time constraints of the competition) to pursue the opportunity to improve their performance further by fine-tuning the approach (e.g., concerning the selection of variables).
4. Results
The first nowcasting round has now run its course, with the winners of all prizes publicly announced (Eurostat 2024b). In this section, we will take a closer look at the performance of the teams.
4.1. Precision
For reasons further outlined in Subsection 4.3 below, we focus the presentation in this section on the unweighted residuals (thus disregarding the volatility index). Moreover, to allow straightforward comparisons, only entries covering all eligible countries are taken into account (as shown in Subsection 4.2 below, this is still a sizable portion of all entries).
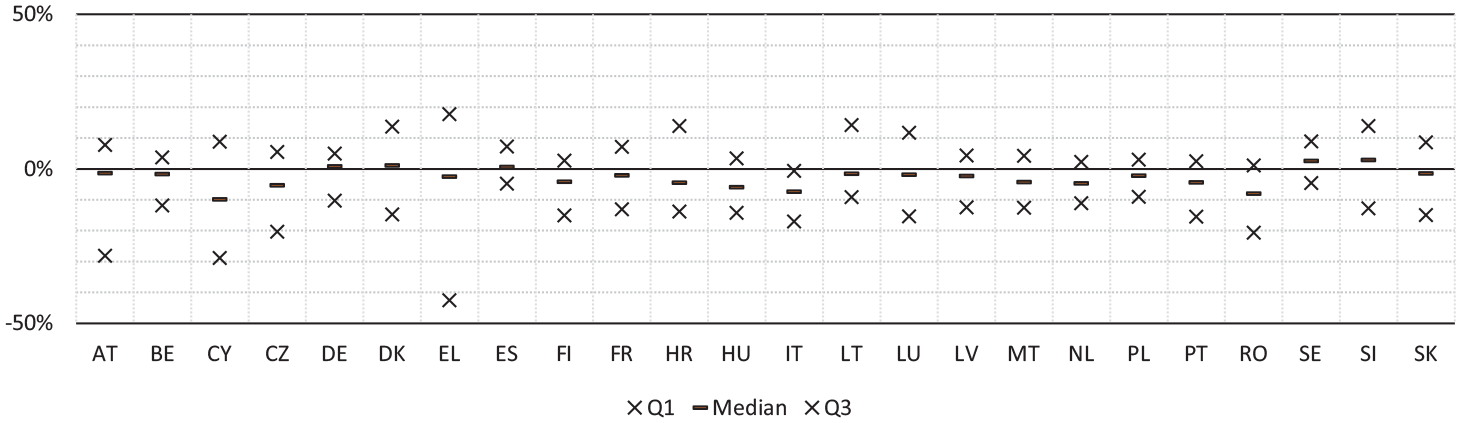
As can be seen from Figure 2, the relative precision of the nowcasts mainly (in more than 50% of the cases for most countries) stayed within 10%, with Bulgaria and Ireland being notable outliers.
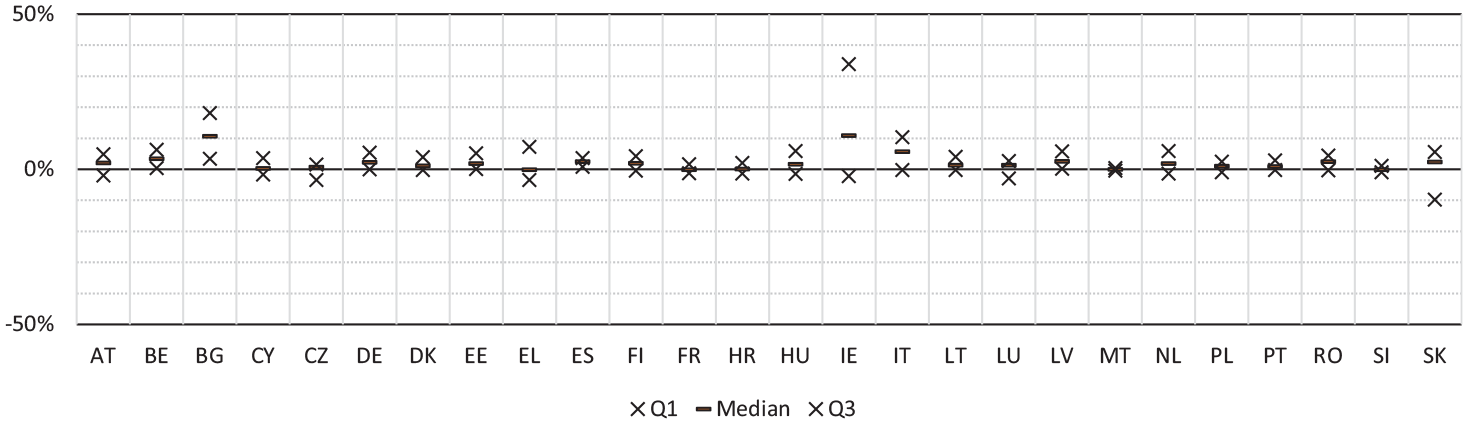
Quantiles (across all months and all entries) of the relative residuals for the PPI time series (limited to entries covering all eligible countries).
For PVI, we can see from Figure 3 that there are no “extreme” countries; the median nowcasts are invariably within 10 percentage points of the true value.
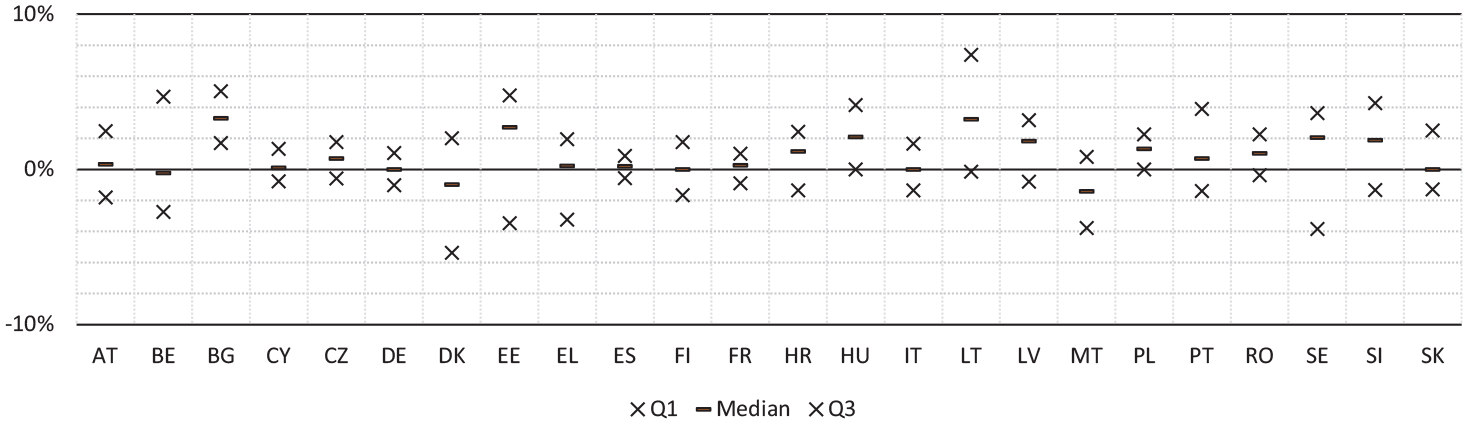
Quantiles (across all months and all entries) of the relative residuals for the PVI time series (limited to entries covering all countries).
From Figure 4, it appears that the monthly tourism statistics are the hardest to nowcast, with the interquartile spans frequently falling more than 10% from the first published official tourism statistics.
Quantiles (across all months and all entries) of the relative residuals for the tourism time series (limited to entries covering all countries).
4.2. Effect of Taking the Top Five Country Scores
As indicated from the horizontal distribution in Figure 5, teams followed essentially two approaches:
submitting nowcasts for five to ten countries (i.e., not many more than the minimum number (five) of countries required)
submitting nowcasts for all (or nearly all) countries.
Figure 5 also illustrates the effect of a hypothetical rule change: taking the average country score (across all countries) into account (instead of only the five best country scores). As could be seen from the diagram, this would have considerably improved the ranking of some of the teams having submitted nowcasts for fewer countries. It could be argued that the rules applied favor teams using methods with a high variability across countries in performance—if they submit nowcasts for all countries, their entries would come out ahead of entries with a similar, but more consistent (across countries) level of performance.
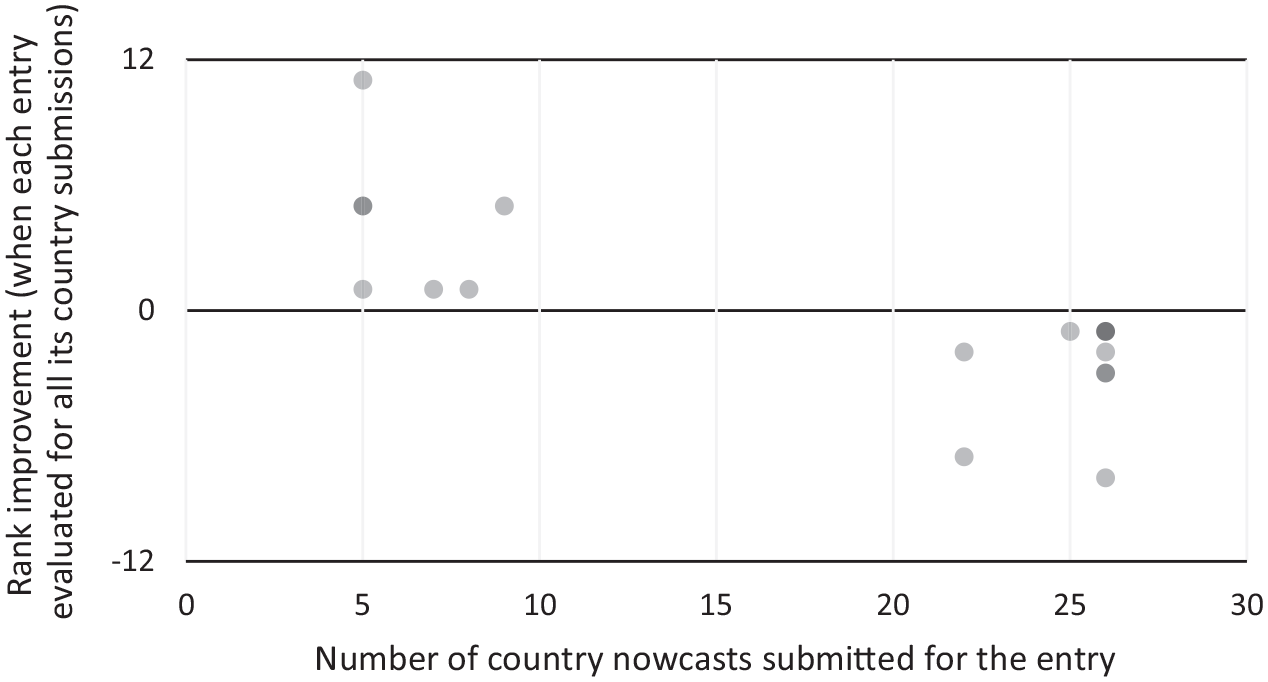
Change (improvement) in rank in case in case all country scores for PPI are taken into account (instead of only the five top country scores). Darker dots indicate multiple teams.
4.3. Assessment of the Volatility Index
As noted in Subsection 2.4, the volatility index v c was established as a means to achieve a level playing field for teams submitting nowcasts for different sets of countries. However, as can be seen from Figure 6, the empirical volatility is only very weakly linked to the volatility index (whereas one would have expected a strong negative correlation). Simply put, countries which were assumed to be “hard” were not much harder to nowcast than the average country—and vice versa. Thus, the GARCH model applied did not sufficiently capture the “residual volatility” of the historical time series. When comparing the left-hand panel of the figure to the two other panels, it can be seen from the slope that the relationship is marginally weaker for PVI and tourism. A reasonable hypothesis might therefore be that (considering that PVI and tourism both are likely to have more pronounced seasonal patterns than PPI) the choice of a GARCH (1,1) model (which does not take seasonality into account) was highly unfortunate. This is because countries with a marked seasonal pattern would come out as more volatile than others—but given that stable seasonal patterns are easy to predict, this should not result in any residual volatility.
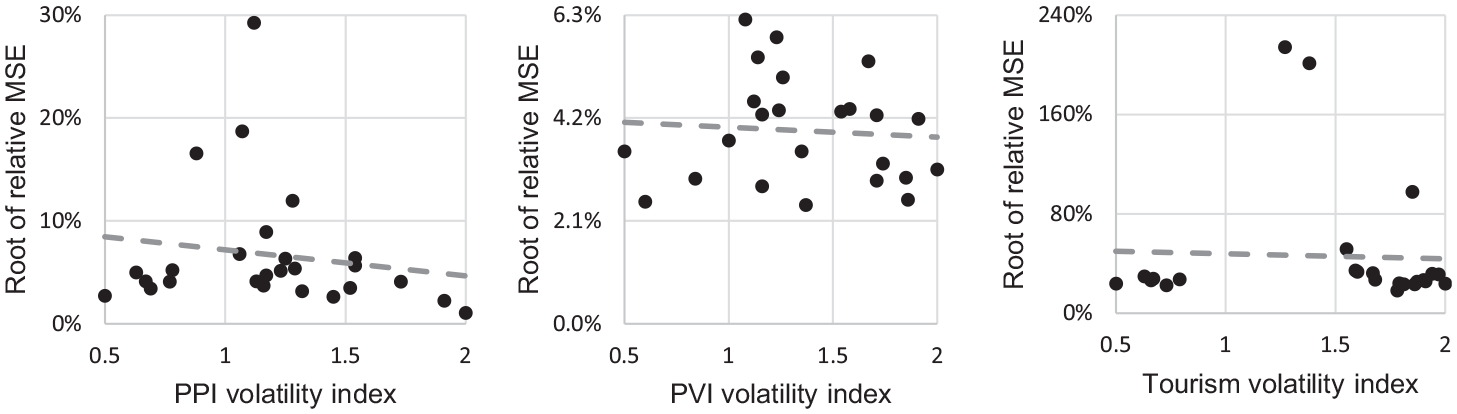
Empirical volatility versus the volatility index for the three business statistics time series.
4.4. Assessment of the Reproducibility Scoring Method
The reproducibility awards evaluation provided valuable insights on the most successful approaches. Despite the additional burden, a total of nine teams (two for PPI, three for PVI, four for tourism) out of the twelve teams (four for each competition) that scored in the top quartile submitted the detailed documentation, code, and sample datasets required to compete for the reproducibility awards. In two cases (Hopp 2023; Schneeberger and Burri 2024), the teams have even made fully developed open-source solutions available on GitHub.
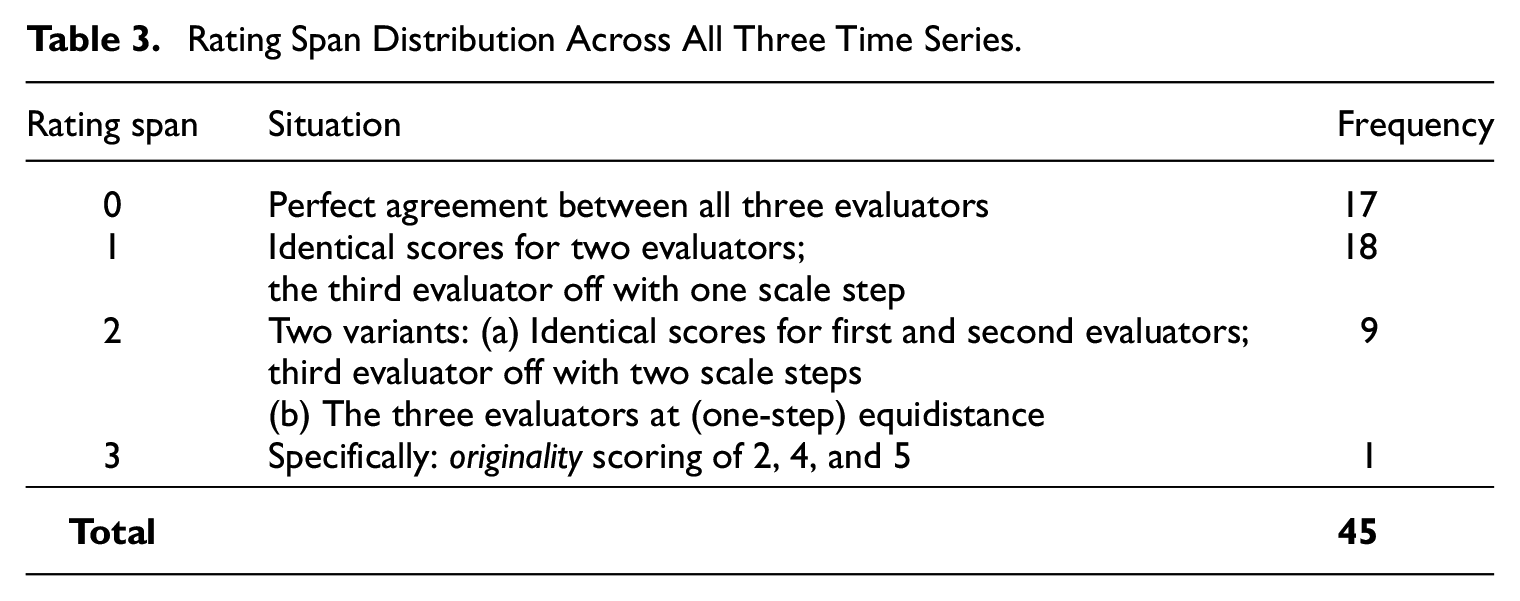
For each time series k, we define (expanding the notation of Subsection 2.5) the rating span for each combination of criterion i and team t as

With nine teams and five reproducibility criteria, there are a total of forty-five such spans across all the forty-five time series. As can be seen from Table 3, there was perfect agreement between all three evaluators (i.e., a span of zero) in seventeen out of these cases. In an additional eighteen cases, there was agreement between two out of three evaluators (i.e., a span of one). In one-fifth of the cases, the spread was somewhat larger (with a span of two). There was only a single case of a major rating discrepancy (with a span of three). For that very specific instance, the evaluators had different takes on how a traditional (RegARIMA) model with an innovative use of external regressors should be assessed (i.e., whether to primarily assess the model as such, yielding a low rating—or the non-traditional data, which yields a high rating). The calculated values of Cohen’s weighted kappa for the three evaluator pairs are 52%, 56%, and 58%, thus indicating a moderate inter-rater agreement. It could be argued that a quadratic weighting should be applied, as differences of one scale step could be considered nearly negligible. With a coarse 5-step scale, it would more or less be expected for an “underlying score in the middle” (close to e.g., 4½) to be rated lower (four in this example) by some evaluators and higher (five in this example) by some. A quadratic weighting would render kappa values within one percentage point of 70% in all three cases.
Rating Span Distribution Across All Three Time Series.
The five reproducibility criteria were established to be essentially orthogonal to each other—each criterion thus making its own distinct contribution to the overall score, while not contradicting other criteria. However, as can be seen from the left-hand panel of Figure 7, the scores for interpretability and simplicity criteria are strongly related. This could be taken to mean that simplicity is a sub-element of interpretability (if a model is simple, it is almost by definition interpretable, whereas one could conceive of complex yet interpretable models).
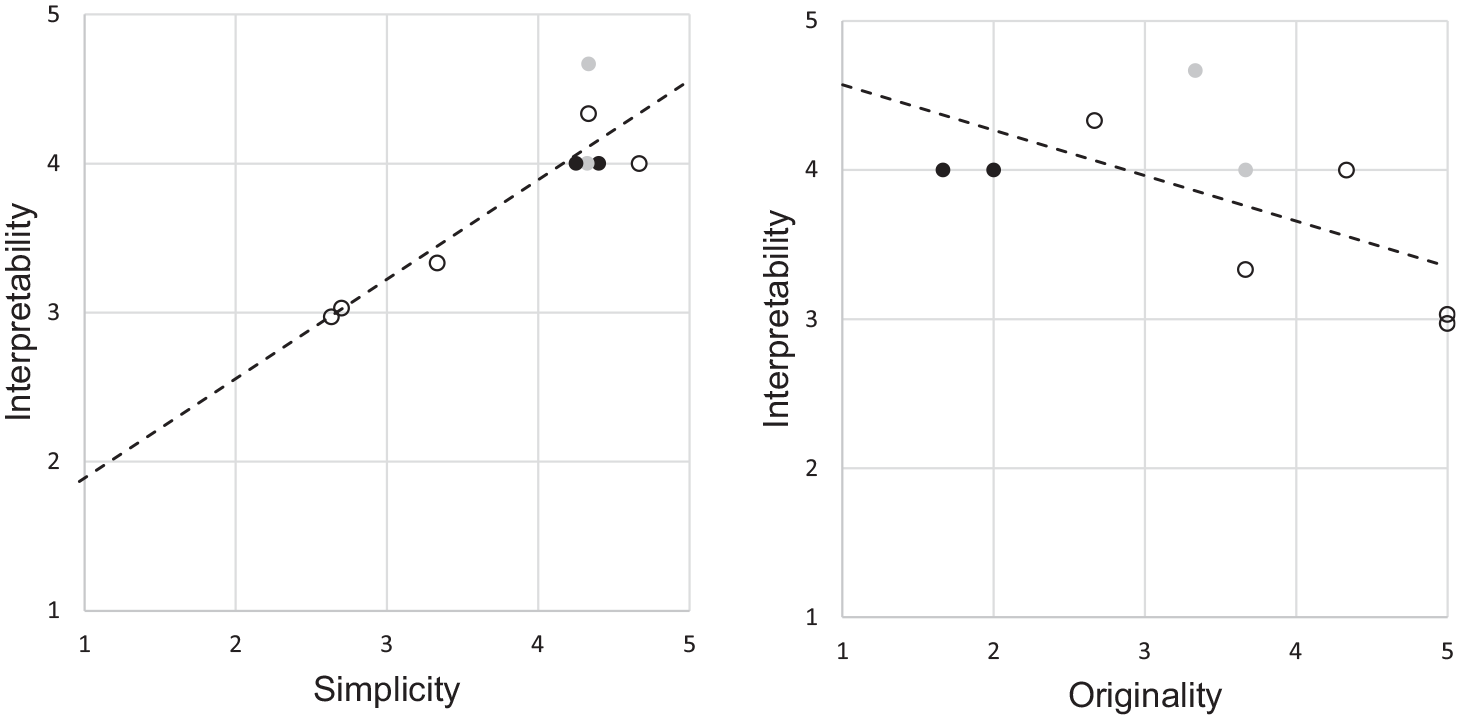
Distribution of the scores (averages across all three evaluators) of the interpretability, simplicity, and originality criteria for all nine entries being eligible for evaluation. Black dots indicate teams eliminated due to insufficient originality. For completeness, gray dots indicate teams eliminated due to insufficient integrity (although integrity is not among the criteria displayed above). Slight offsets have been introduced for dots that overlap completely.
Conversely, the originality criterion seems to be negatively correlated with the two aforementioned criteria, as can be seen from the right-hand panel of Figure 7. In retrospect, this should not have come as a surprise, as more non-traditional methods (of the “machine learning/artificial intelligence” variety) are typically of a “black box” nature. Thus, the more “original” a method is, the harder it may be to interpret. This thus makes it hard (albeit not downright impossible) for a team to simultaneously score high for both interpretability and originality. The cut-offs for the individual criteria thus render it likely for teams scoring very well on interpretability (or simplicity) being eliminated due to its low originality score (or vice versa). As can be seen from the black dots of Figure 7, this risk has materialized in practice—ultimately resulting in the reproducibility prize not being awarded for PVI, as is evident in the presentation by Eurostat (2024b).
5. Discussion
5.1. Exploitation of the Results
As demonstrated in Subsection 3.3, the European Statistics Awards for Nowcasting have proven to serve as a tool to obtain new ideas for nowcasting and to engage with data scientists outside of statistical offices. At the same time, it does not appear to be possible to directly deploy the winning entries in official statistics production, given their uneven performance across countries. Still, the novelty of some of the approaches (and their good documentation, along with the code provided) motivates that they are tested in real production settings to evaluate their performance and robustness at scale and benchmark them against requirements such as those of the European statistics code of practice (Eurostat 2017).
Importantly, and in contrast to many other similar initiatives, the Eurostat production units concerned have been closely involved in ensuring that top-line indicators where users would genuinely benefit from an increased timeliness are selected among the plethora of monthly European statistics potentially in scope. Now that the first round has finished and the prizes have been awarded, the real work begins: the units concerned will review the results (including the models used). Considering the occasional large deviations, it is clear that (with the possible exception of PVI) neither of the best-ranking nowcasting methods are fit for rolling out “as is” in official statistics production, as they are apparently not fit for direct use for some of the national time series. Possibly, different nowcasting models could be used for different groups of countries, meaning that an amalgam of the best entries might turn out to be the best approach in a production setting—but altogether other fine-tuning approaches might turn out to be more suitable after a deeper analysis of the outcomes. In the end, the findings might lead to the further development of the most promising approaches into Eurostat experimental statistics (such as the various flash indicators that currently feature in the Eurostat experimental statistics hub).
5.2. Redesign of the Final Nowcasting Round in View of the Findings
The third and final round of the European Statistics Awards for nowcasting is currently being prepared for launch during the second half of 2024, with international trade in goods statistics having been selected as the topic.
Based on the experience so far, the submission and evaluation criteria have been fine-tuned in a number of ways. The first main block of changes concern the accuracy score, and aims to ensure that there is a level playing field from the outset. First, apparently ineffective compensatory measures are eliminated:
(i) the “raw” scores for each country c will be taken into account, without any volatility index v c applied.
Second, the evaluation criteria are rendered more rigid:
(ii) Each team will be required to submit monthly nowcasts for the exact same six-month period.
(iii) Each team will be required to submit nowcasts for all twenty-seven European Union Member States, with the average taken across all twenty-seven countries rendering the accuracy score.
Given the issues observed for the volatility index (see Subsection 4.3), leaving it intact appears to be a non-starter. An alternative to change (i) could have entailed carrying out a deeper investigation to identify a candidate volatility index more likely to have a strong link with empirical volatility. However, the safer option of change (iii) was chosen to achieve comparability across teams in a straightforward way.
Change (ii) also appears largely uncontroversial—the only potential drawback being a lower rate of participation, since some teams might miss the submission deadline—and in contrast to the current nowcasting round, there is no chance to “catch up” later by starting to submit nowcasts a couple of months into the competition. This drawback is however deemed to be negligible, considering that the more generous (ten months to choose among instead of eight; noncontiguous sets of reference periods allowed) provisions in the second nowcasting round have not rendered a higher level of completion (see Subsection 3.1).
There might be an advantage in allowing a team to “go narrow” (focusing on a few countries and devoting substantial resources to tailoring the nowcasts to them, using bespoke auxiliary data), as this might render an (otherwise too costly) “proof of concept” (PoC). Following the competition, approaches with favorable PoCs could be pursued further, and scaled up to all countries and tried out in a statistical production setting. Regrettably, Subsection 4.2 demonstrates that the “best five countries” approach is overly generous to entries featuring nowcasts for all (or nearly all) countries—so while entries “going narrow” are permitted, they are penalized. One could consider still allowing entries regardless of how many countries their nowcasts include by simply switching from taking the best five country scores to taking the average across all country scores (as illustrated in Figure 5). However, to avoid rewarding teams choosing “easy” countries (which was the rationale for establishing the volatility index in the first place), one would have to compensate for this—and change (i) means that such offsetting attempts are no longer being made. Therefore, change (iii) was implemented instead.
The second block of changes, driven by the findings presented in Subsection 4.4, concern the reproducibility criteria:
(iv) A new innovativity award is established, based on the previous originality criterion.
(v) The basis for the reproducibility score is limited to the integrity, interpretability, and openness criteria (with simplicity dropped and originality “moved” to the innovativity award).
Change (iv) will thus tackle the near-impossibility of simultaneously scoring high on interpretability and originality by splitting the qualitative award into two. Considering the fact that originality does not per se say anything about reproducibility, this streamlining of the reproducibility award will render it more likely that the winning approach can be deployed in official statistics production. At the same time, the innovativity award will encourage nontraditional approaches with a potential to outperform traditional ones (even when they may need considerable further efforts before becoming possible to rely upon in a regular production setting).
Given the close correlation observed between interpretability and simplicity, teams were essentially doubly awarded (or penalized) for the same aspect of their methods—and change (v) does away with this drawback.
5.3. Ideas for Future Competitions
While the number of registered teams was high, Subsection 3.1 shows that the number of teams effectively participating (by submitting nowcasts) is considerably lower. A “conversion rate” of this order of magnitude is apparently common in this type of competitions (with Silva et al. [2017] reporting 54% of newcomers taking action in open source software projects). While the current promotion surely has (together with the pecuniary awards) resulted in a high number of registrations, future competitions on nowcasting in official statistics might need even more intensive promotion efforts to get an elevated number of registered teams, as the observed conversion and retention rates seem to require the recruitment of three to four registered teams to render one team that fulfills the competition.
Academia is a large part of the target community of the European Statistics Awards for Nowcasting. Therefore, future nowcasting competitions should perhaps more closely align their schedule (including communication efforts) with the academic year. This would possibly benefit participation—and perhaps even allow the integration of competition tasks into assignments for time series courses. Conversely, considering that the first round considered reference periods from September until April, it might be interesting to also try the best entries for the summer months, given the seasonality of the time series (not the least for tourism) to see if they perform equally well during that period. However, this would clash with the former approach, since the periods of interest fall outside the academic year more or less by definition.
As discussed in Subsection 2.2, the number of competition topics is regrettably limited since the current setup requires time series that are published on a monthly basis because of the need to observe the performance of the models over a reasonably large number of time periods. This limits the selection of topics, which would be wider if quarterly (or even yearly) time series were also to be considered. However, choosing a series with a lower frequency (while maintaining the minimum number of reference periods for which nowcasts are required) would considerably lengthen the running time of the competition, which would increase the risk of teams dropping out before completing the challenge. To overcome this, one could consider changing the evaluation paradigm from “long and narrow” to something along the lines of what Qu et al. (2023) discuss, essentially going “short” (requiring nowcasts for a single reference period) but “wide” (requiring nowcasts for a wide array of sub-indicators). Thus, one would use more or less the same volume of data to evaluate performance as with a “traditional” approach—but with another “shape” (fewer time periods, more indicators). Qu et al. (2023) highlight how such an approach would lead to faster comparisons (between entries in our case) of predictive accuracy. Moreover, in a competition setting, an advantage of the cross-sectional approach would be that there would be no attrition—once a team submits for one reference period, their nowcasting task is done.
Other advantages brought up by Qu et al. (2023), such as the usefulness of this approach for singular events (such as the outbreak of the Covid-19 pandemic) would not come into play in case a single reference is chosen simply out of convenience (because it is the “next available one”). Moreover, cross-sectional evaluation would not allow any assessment of the stability of a nowcasting approach over time. Thus, although circumstances (a yearly time series) might leave an organizer of a nowcasting competition with no other option than focusing on a single reference period, certain aspects (most notably consistent performance over time) essential to a full evaluation of nowcasting performance might have to be forsaken.
5.4. Conclusions
In this article, we have demonstrated the usefulness, but also the shortcomings, of the European Statistics Awards for Nowcasting. Given the experimental nature of the European Statistics Awards Programme, part of its objective is to generate experience that the official statistics community can learn from. As illustrated in Subsection 5.2, the multi-annual nature of the program has allowed us to already implement various design changes for the last nowcasting round. Other changes (discussed in Subsection 5.3) would rather be for subsequent programs—possibly managed by other official statistics stakeholders.
As the European Statistics Awards Programme is financed by the European Commission (Eurostat), it is focused on European statistics. However, there might be an even greater potential for the use of nowcasting methods in developing countries, given the lags and data gaps that could be expected for nations with less generously resourced statistical systems. While the models developed in nowcasting competitions run in one region could of course be transplanted to countries elsewhere, their validity might be questionable in case the societal structure is fundamentally different. Moreover, even the execution of nowcasting competitions in such settings might be challenging, given the potential lack of timely ground truth data. This is nonetheless an issue worthy of consideration—albeit without any easily discernible immediate solution.
Acknowledgement
We acknowledge the indispensable scientific, technical and operational contributions by the researchers of the Department for Artificial Intelligence (AILAB) of the Jožef Stefan Insitute (JSI), Slovenia, throughout the development and execution of the European Statistics Awards Programme. Specifically, we acknowledge Dr. Erik Novak for his invaluable contributions in the preparation of the competition platform and the design, development and deployment of individual competition environments. We wish to underline that he singlehandedly developed the evaluation code, prepared the required files for publishing the competition information on the platform, and meticulously monitored the competition process, handling all technical aspects with expertise. Furthermore, Erik was responsible for organizing the competition submissions and performing the preliminary analysis, including calculating the accuracy scores of all submissions. Furthermore, we wish to acknowledge mag. Anja Polajnar for her significant contribution to the outreach efforts by co-developing the communication plan, compiling and reaching out to an enormous list of multipliers and multiplier organizations, and drafting content for articles and social media posts. We also wish to acknowledge Dr. Inna Novalija for her contribution to the definition of criteria for the evaluation of the Reproducibility Award and her contribution to the definition and mathematical implementation of the volatility assessment. In the first year of the competitions, Vesna Trenchovska played a key role by designing the logo and other visual materials for the program. The second year of competitions included contributions from Ana Fabjan, who brought her expertise to bear into the program to create logos and visual materials for the second and third competition rounds. Finally, we wish to acknowledge Dr. Polona Škraba Stanič for overseeing and managing the entire process and developing the explanatory text to accompany the competitions. Polona was also invaluable in overseeing the drafting of the competition rules, which involved extremely thorny legal issues, including but not limited to eligibility, jurisdictions and intellectual property rights. Without the relentless efforts of the AILAB JSI team, the European Statistics Awards would never have seen the light of day. We are indebted to them for their contributions to the design, development and implementation of this new approach for statistical authorities to engage with the scientific research and innovation communities in order to foster the improved timeliness of official statistics.
Footnotes
Authors’ Note
The information and views set out in this paper are those of the authors and do not necessarily reflect the official opinion of the European Commission.
Funding
The author(s) received no financial support for the research, authorship, and/or publication of this article.
Received: October 2023
Accepted: July 2024