
Abstract
Air pollution causes millions of premature deaths every year, and fugitive emissions of, e.g., methane are major causes of global warming. Correspondingly, air pollution monitoring systems are urgently needed. Mobile, autonomous monitoring can provide adaptive and higher spatial resolution compared with traditional monitoring stations and allows fast deployment and operation in adverse environments. We present a mobile robot solution for autonomous gas detection and gas distribution mapping using remote gas sensing. Our “Autonomous Remote Methane Explorer” (
Keywords
1. Introduction
The carbon gap between current emissions and the commitment in the Paris Agreement to avoid dangerous global warming is widening (Christensen and Olhoff, 2019). Consequently, it has become more challenging to keep an increase in global average temperature below 2 °C above the pre-industrial level. In 2019, the major greenhouse gases carbon dioxide (CO2) and methane (CH4) accounted for 72% and 19% of global emissions, respectively, using a 100-year Global Warming Potential basis (Olivier and Peters, 2020).
Unlike carbon dioxide, methane is extremely flammable and can form an explosive mixture with air. On the other hand, methane is a hydrocarbon that can be used as a cleaner source of energy than other fossil fuels, e.g., coal (Alvarez et al., 2012). It is also used as an ingredient to manufacture fertilizers (e.g., nitro-phosphate and calcium ammonium nitrate) and the importance of monitoring methane emissions produced by the ammonia fertilizer industry has been pointed out recently (Zhou et al., 2019). In a nutshell, methane emission monitoring is important for three reasons: (1) its climate impact, (2) the associated safety risks, and (3) its economic importance. Fossil fuel production and landfill are among the major sources of human-caused fugitive methane emissions (Forster et al., 2007; Holmgren et al., 2015), and monitoring systems are needed to reduce emissions in those areas.
A monitoring system requires sensing technologies and approaches to sample the environment and extract information about areas with increased methane concentration and the presence and location of gas sources to take necessary actions. An efficient monitoring system should also be cost-effective, easy to deploy, and flexible enough to provide adaptive sampling that takes into account previous gas measurements and changing environmental parameters.
Gas sensors can be categorized into in situ and remote sensors. In situ sensors provide local measurements of gas concentrations and, thus, require a high number of sampling points or strong prior assumptions that must be made in order to estimate dense distribution models (Fraden, 2010). In contrast, remote sensors with a large sensing range require fewer sampling configurations (Mikel et al., 2011). In our work, we use tunable diode laser absorption spectroscopy (TDLAS), which emits an optical beam with a wavelength that is tuned to an absorption band of the gas molecule of interest. It returns spatially unresolved integral concentrations along the line of sight. TDLAS is very selective and generally responds to its target gas only, even in the presence of multiple airborne substances.
In an area in which a gas leak is suspected, a human operator could carry a remote gas sensor and walk through the area to perform the gas inspection. However, there are a number of problems with this approach: (1) it can be a dangerous task due to the presence of explosive or toxic gases; (2) it is a laborious and tedious work for a human operator to perform systematic sampling; and (3) without having the necessary tools of analysis to localize the gas measurements accurately or to build a gas distribution model, it is difficult to understand gas emissions from the set of measurements. On the other hand, a robot carrying a remote gas sensor can perform these tasks comprehensively and repeatedly. The robot can be equipped with methods to estimate gas distributions and hotspot areas accurately, for example, using gas tomography – a procedure to estimate the spatial distribution of gas concentrations from a set of integral gas measurements. The gas tomographic approach can model gas distributions in contained gas sources as well as complex gas plumes of freely escaping gas. In addition to detailed analysis and estimation of hotspot areas, the reconstructed gas distribution can also be used to quantify leak flux, which is difficult for a human operator looking at the integral measurements only.
In this article, we focus on a mobile robotic system with remote gas sensing and the capability of performing autonomous gas operations. Accordingly, we call this system Autonomous Remote Methane Explorer (
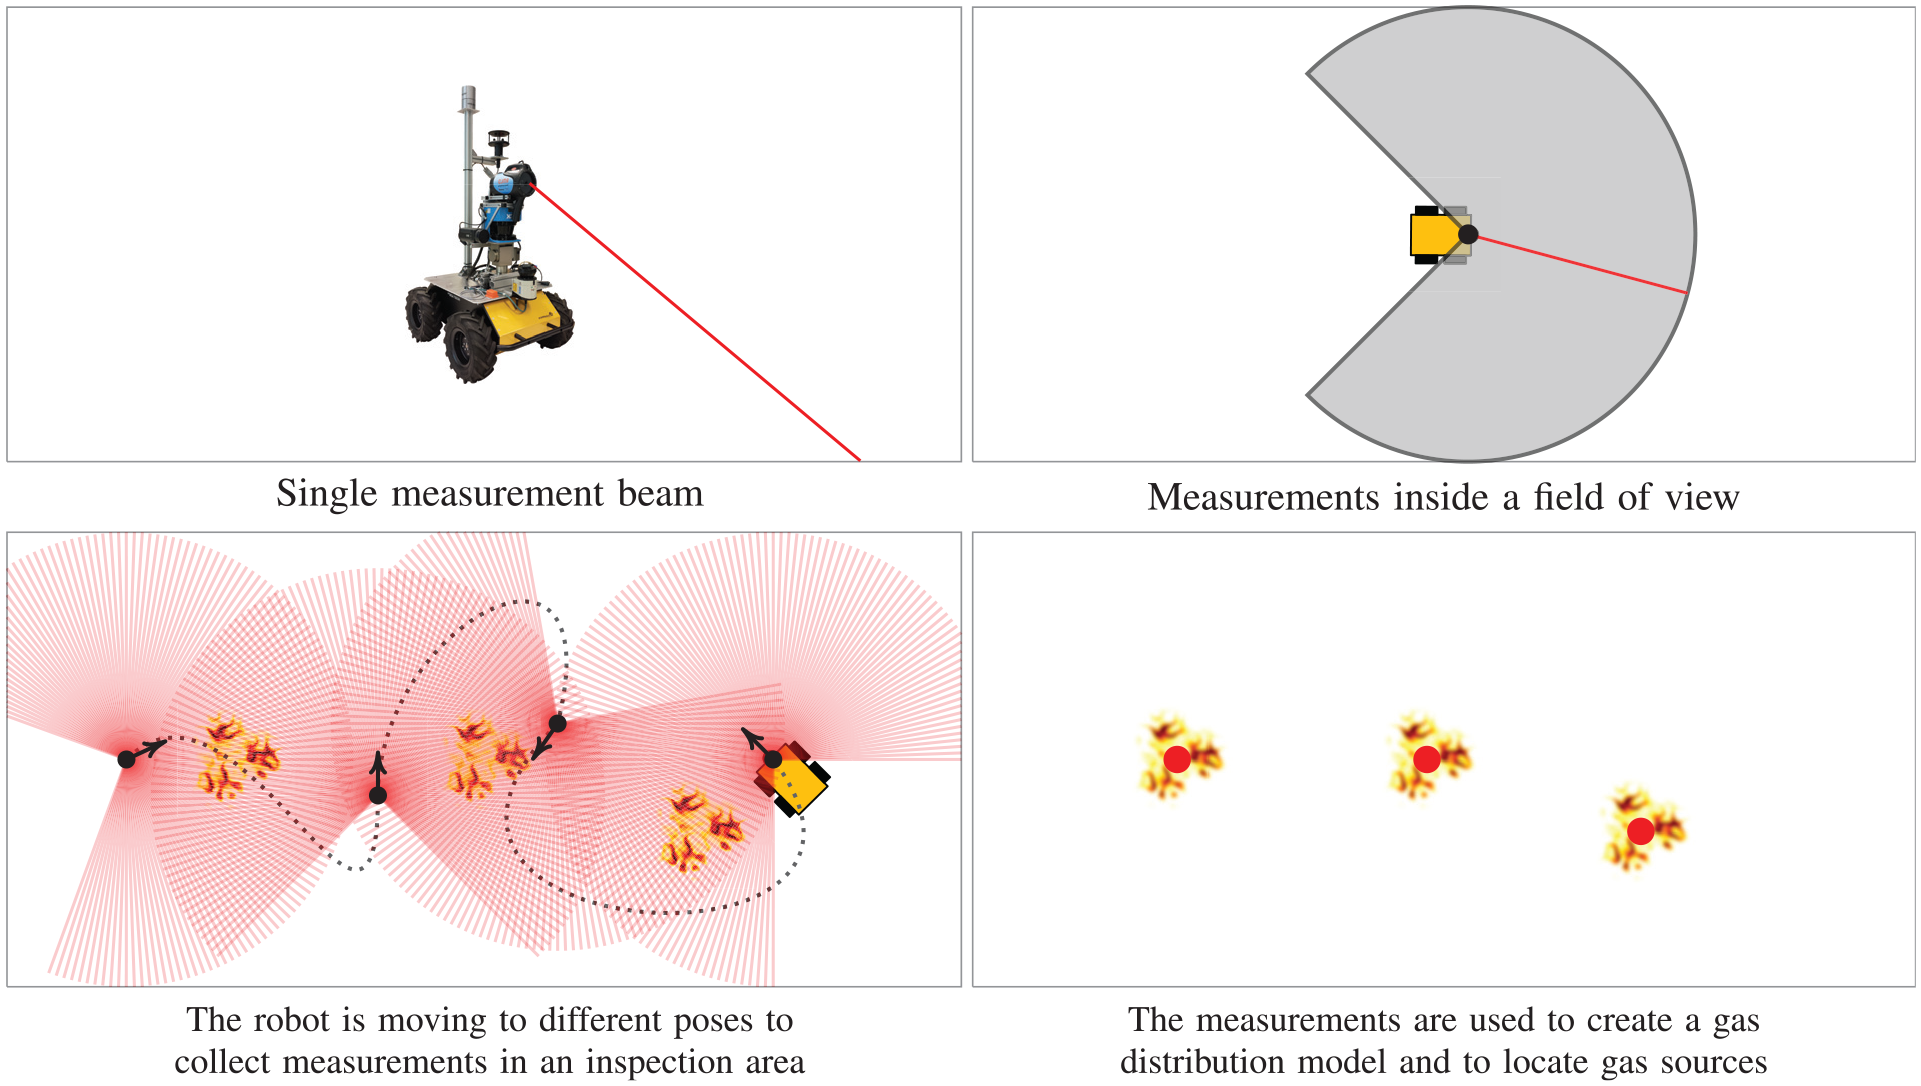
Illustration of the Autonomous Remote Methane Explorer (
The advantages of flexible sensor placement carried out by mobile robots come with new challenges, however. These challenges include (1) a need to accurately locate the measurements as the sensor is carried along by the mobile platform, (2) to navigate the sensor between different sampling locations, (3) measurement strategies are needed to sample the environment efficiently, for example with minimum operational time, (4) that the overall robotic solution must be applicable not only in small scale test environments, but also in large-scale, complex environments.
To address these challenges, we equip our robot with commercially available sensors and existing algorithms that enable it to localize and move autonomously between different sensing locations in the environment. To allow for fully autonomous operation, we developed and implemented optimization-based sensor planning algorithms that decide sensing configurations for the detection of high-concentration areas, and an accurate estimation of gas distributions using a detailed tomographic reconstruction in the gas detection areas. All components were selected or developed for real-world operation, and the system was validated in large, complex, real-world environments.
Our work is guided by two research questions.
In line with these overarching research questions, the major contributions of this work are as follows.
We are proposing
We have designed and implemented sensor planning algorithms that select optimal sensing configurations for remote gas inspection. For the gas detection task, we solve a full sensing coverage problem in two phases, which we have reported previously in Arain et al. (2015a): first, to find a near-optimal solution for a minimal set of sampling poses and then to solve a traveling salesman problem (TSP) using existing approaches (Applegate et al., 2006) to find the shortest traveling distance between the selected sampling poses. Upon detection of hotspots, we set out to perform detailed gas tomography for accurate gas distribution mapping. Our sensor planning algorithm for gas mapping finds informative sampling poses of overlapping sensing coverage with different viewpoints to accurately reconstruct the gas distribution. The initial version of this algorithm is presented in Arain et al. (2016) and fundamentally improved in this article: a new procedure is developed for the estimation of the areas of interest (hotspots); improved multi-criteria weights for candidate measurement configurations; and the optimization problem is formulated to select a minimal set of measurement configurations for the desired reconstruction quality.
A straightforward approach for gas inspection, which we used in our previous work (Arain et al., 2016), is to carry out two subsequent robotic tours, one for the initial gas detection and the second for gas distribution mapping (two-tour mission strategy,
Autonomous gas inspection has certain advantages over manual operation: performing a long-term task is a boring and tedious job for a human operator; deciding optimal sensing configurations in a complex environment is difficult; telepresence may add additional difficulties when the operation has to be performed in a dangerous area. We evaluate the performance of our autonomous remote sensing system against the strategies of human experts teleoperating the robot. The human experts who participated are experienced in developing gas-sensing systems, building gas maps, and conducting field experiments.
We introduced the evaluation of autonomous gas-sensing systems against human experts for the first time in Arain et al. (2016). However, in those experiments, only one human expert participated who had to decide all the sensing configurations for a single robotic tour of gas distribution mapping in advance, i.e., without having access to updated gas maps during the inspection. Selecting sensing poses for a human operator is a method of teleoperating a robot. Teleoperation experiments have also been performed for gas source localization in Gongora and Gonzalez-Jimenez (2019). However, the experiments were conducted by inexperienced operators using a mobile robot with in situ gas sensors and visual feedback, and no comparison with an autonomous system was performed. In this article, we have developed a user interface that facilitates human experts to decide one sensing configuration at a time. The operation can be visualized (in our experiments without live streaming of a camera so that the gas sources cannot be recognized in the video), and the human experts can inspect intermediate tomographic reconstructions to estimate gas source locations and determine the next sensing pose.
The experimental evaluation is carried out to investigate the following: (1) as a proof of concept of
We further bring gas-sensing mobile robots from environment sizes that require about half an hour of operation to large-scale, complex environments that require several hours of operation. To the best of the authors’ knowledge, autonomous gas-sensing robots have not previously been tested at such a scale. The important limiting factors for large-scale operations are sensing range and finding optimal sampling configurations in large search spaces. In
2. Related work
An environmental monitoring system (EMS) is used to sample atmospheric variables of interest to observe, study, and derive knowledge about the environment. A common approach is to use a stationary sensor network for pollution monitoring (Barrenetxea et al., 2008; Prud'homme et al., 2013; Tsujita et al., 2005), ventilation characterization (Sherman, 1990), and measurement of atmospheric gas concentrations (Somov et al., 2012, 2011; Zhou et al., 2009). Mobile robots in environmental monitoring were introduced in 2000 (Guccione et al., 2000; Whitcomb, 2000), and a more recent example of pollution monitoring and ventilation characterization with mobile robots and stationary networks can be found in Hernandez Bennetts (2019); Hernandez Bennetts et al. (2016).
Emission of greenhouse gases is a critical environmental aspect (Solomon et al., 2010) and, correspondingly, airborne chemical sensing of greenhouse gases is an important EMS application of mobile robots. The inspection tasks of a gas-sensing mobile robot can include gas detection, gas discrimination in a mixture of gasses, gas quantification, gas distribution mapping, and gas source localization (Hernandez Bennetts, 2015). The use of drones is one possible approach to the problem (Golston et al., 2018; Neumann et al., 2019; Oberle et al., 2019; Yang et al., 2018). Drones have better mobility than most ground robots and can be easily deployed in open environments. In comparison, the mobility of ground vehicles is affected by difficult terrain. However, the operation time of drones is typically much shorter than that of ground robots, which limits their usability to perform detailed gas tomography in large areas or makes it necessary to deploy swarms of drones. We are interested in relatively long time operations and want to build high-resolution GDMs in large areas for detailed analysis. Moreover, we assume that the gas, if present, can be detected near the ground level. This assumption applies to many real-world applications: for instance, methane leaks on a landfill necessarily occur close to the ground.
Traditionally, in situ gas sensors are considered for gas-sensing applications of mobile robots, for example, for statistical gas modeling (Hernandez Bennetts et al., 2011; Li et al., 2016; Lilienthal et al., 2009; Monroy et al., 2016) and searching for gas sources (Albertson et al., 2016; Monroy et al., 2018; Moraud and Martinez, 2010; Von Fischer et al., 2017; Zhang et al., 2015). Recent developments in gas-sensing technologies have made it possible to use remote gas sensors on mobile robots with certain advantages. We consider an actuated remote gas sensor to sample a large area inside a field of view, without being visited by the robot. In the following discussion, we compare our proposed solution with the other ground robot-based remote gas-sensing solutions.
Mobile robots equipped with a remote gas sensor have been reported for gas leak detection (Baetz et al., 2009; Kroll et al., 2009), gas distribution mapping using a tomographic algorithm (Hernandez Bennetts et al., 2013), and combined remote gas sensing with thermal imaging for gas leak detection in Soldan et al. (2014). The systems described by Baetz et al. (2009), Soldan et al. (2014), and Kroll et al. (2009) use the same remote gas-sensing technology along with a mobile robot as we do in
We consider optical beams projected along the horizontal plane for ground-level gas detection. This means the beams are not necessarily reflected at the leak points, and they can travel a considerable distance after the leak points. Therefore, instead of using a tri-max window to locate the leak along a vertical plane (Bonow and Kroll, 2013), we perform gas tomography (Price et al., 2001) to accurately model the concentration distribution in a 2D environment, along the horizontal plane. Moreover, we do not assume predefined sensing configurations for gas inspection as in Soldan et al. (2014). Instead, we let the robot decide sensing configurations.
The initial concept of our current robotic solution was introduced in Hernandez Bennetts et al. (2014), evolved through Arain et al. (2015a) and Arain et al. (2016), and into the complete autonomous inspection that we present and evaluate in this article. We first introduced measurement planning for a mobile robot equipped with a remote gas sensor (Arain et al., 2015b). We have designed different sensor planning algorithms to enable the robot to select near-optimal sensing configurations for the inspection tasks of gas detection and gas distribution mapping.
We cast gas detection as a full sensing coverage problem. If we approximate the sensing coverage of an actuated remote gas sensor with a camera-like field of view, then several related sensor placement approaches can be found in the areas of known problems: art gallery problem (Lee and Lin, 1986), view planning problem (Scott, 2009), set covering problem (Erdem and Sclaroff, 2006), covering salesman problem (Golden et al., 2012), or traveling view planning problem (Wang et al., 2007a,b). Further detail on related work and our sensor planning algorithm for gas detection can be found in Arain et al. (2015a).
The task of gas distribution modeling using gas tomography requires to sample the area of interest with an overlapping sensing coverage of different viewpoints (Byer and Shepp, 1979). We have presented an initial version of our sensor planning algorithm for gas distribution mapping in Arain et al. (2016), which we believe is the only available sensor placement approach for gas distribution mapping using gas tomography. In this article, we make fundamental changes in the algorithm: we develop a new procedure for the estimation of hotspots; use new results for the evaluation of sensing geometries (Arain et al., 2017); improve multi-criteria weights for candidate measurement configurations; formulate the optimization problem to select a minimal set of measurement configurations for the desired reconstruction quality.
Another contribution in this article is a new one-tour mission strategy (
3. Autonomous Remote Methane Explorer
This section describes the system in detail and an implementation of
3.1. System design and assumptions
We use a mobile robot equipped with a remote gas sensor to perform gas inspection tasks. A drone or ground robot can carry a remote gas sensor to map the environment along the ground. A drone with a downwards pointing remote gas sensor (Oberle et al., 2019; Yang et al., 2018) can fly over the area to collect integral measurements along the vertical axis, as illustrated in Figure 2(a). However, this approach will provide only sparse, effectively point measurements with a significant risk of missing small gas patches. High-resolution gas mapping thus becomes even more challenging in addition to the short operation time of drones.
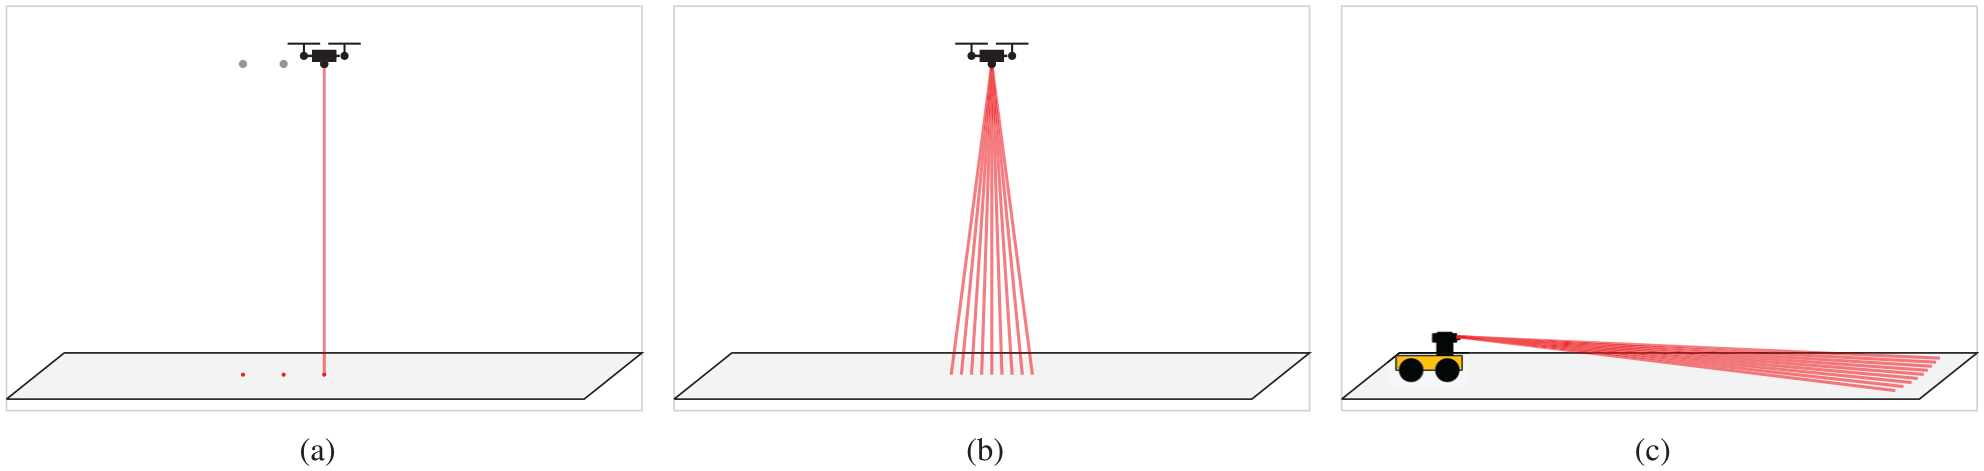
Illustration of ground-level remote gas inspection with aerial and ground robots. (a) A drone equipped with a remote gas sensor that vertically projects optical beams. The line-integral measurements may be considered as point measurements on the ground, and the area can be mapped without the need for gas tomography (e.g., Oberle et al., 2019; Yang et al., 2018). However, only a single measurement is collected at a sampling position. Therefore, the robot has to densely sample the area for high-resolution gas mapping and needs to make sure that small sources do not remain undetected, which can be challenging owing to the short operational time of drones. (b) An alternative option is to actuate the remote gas sensor on the drone to collect a higher number of integral measurements at a single measurement position (e.g., Neumann et al., 2019). In this way, the necessary number of configurations at which the drone takes measurements can be reduced; however, a high number of measurements of different ground-track lengths are to be collected to cover the area inside a field of view. (c) A ground robot with an actuated remote gas sensor to collect integral measurements along the horizontal plane, presented in this article. The optical beam projected along the horizontal plane can detect freely escaping gas along its path. This means the area inside a larger field of view can be sampled with a smaller number of measurements.
The downwards pointing remote gas sensor on a drone can be actuated to project optical beams in different directions in a field of view (Neumann et al., 2019) (see Figure 2(b)). Thus, the necessary number of configurations at which the drone takes measurements to cover the area can be reduced. In that case, a high number of optical beams of different ground-track lengths need to be projected at each sampling point to cover the area inside the field of view for high-resolution gas mapping. The maximum sensing range along the horizontal plane will also be reduced as the sensor is elevated using a drone.
Instead, we propose to use a ground robot with an actuated remote gas sensor to perform gas tomography, as shown in Figure 2(c). The optical beam projected along the horizontal plane can detect freely escaping gas along its path. In this way, a larger area inside the field of view can be covered than by a drone operating at a higher altitude, and the necessary number of measurement configurations can be further reduced. If, on the other hand, we consider an actuated remote gas sensor on a drone that can also be placed near ground level and can perform gas sampling by projecting optical beams along the horizontal plane, the approach described in our article is equally applicable and using a drone instead of a ground robot would only introduce disadvantages due to the shorter operation time and downwash interference with gas distributions.
As we target applications of ground-level gas sensing, detection of low concentrations from small leak points at, for example, a landfill site is more probable with a ground robot than a drone owing to dense area coverage for the same number of measurements inside a field of view. We thus consider in this article a ground robot carrying an actuated remote gas sensor to perform hours of operation in large environments. The conceptual diagram of
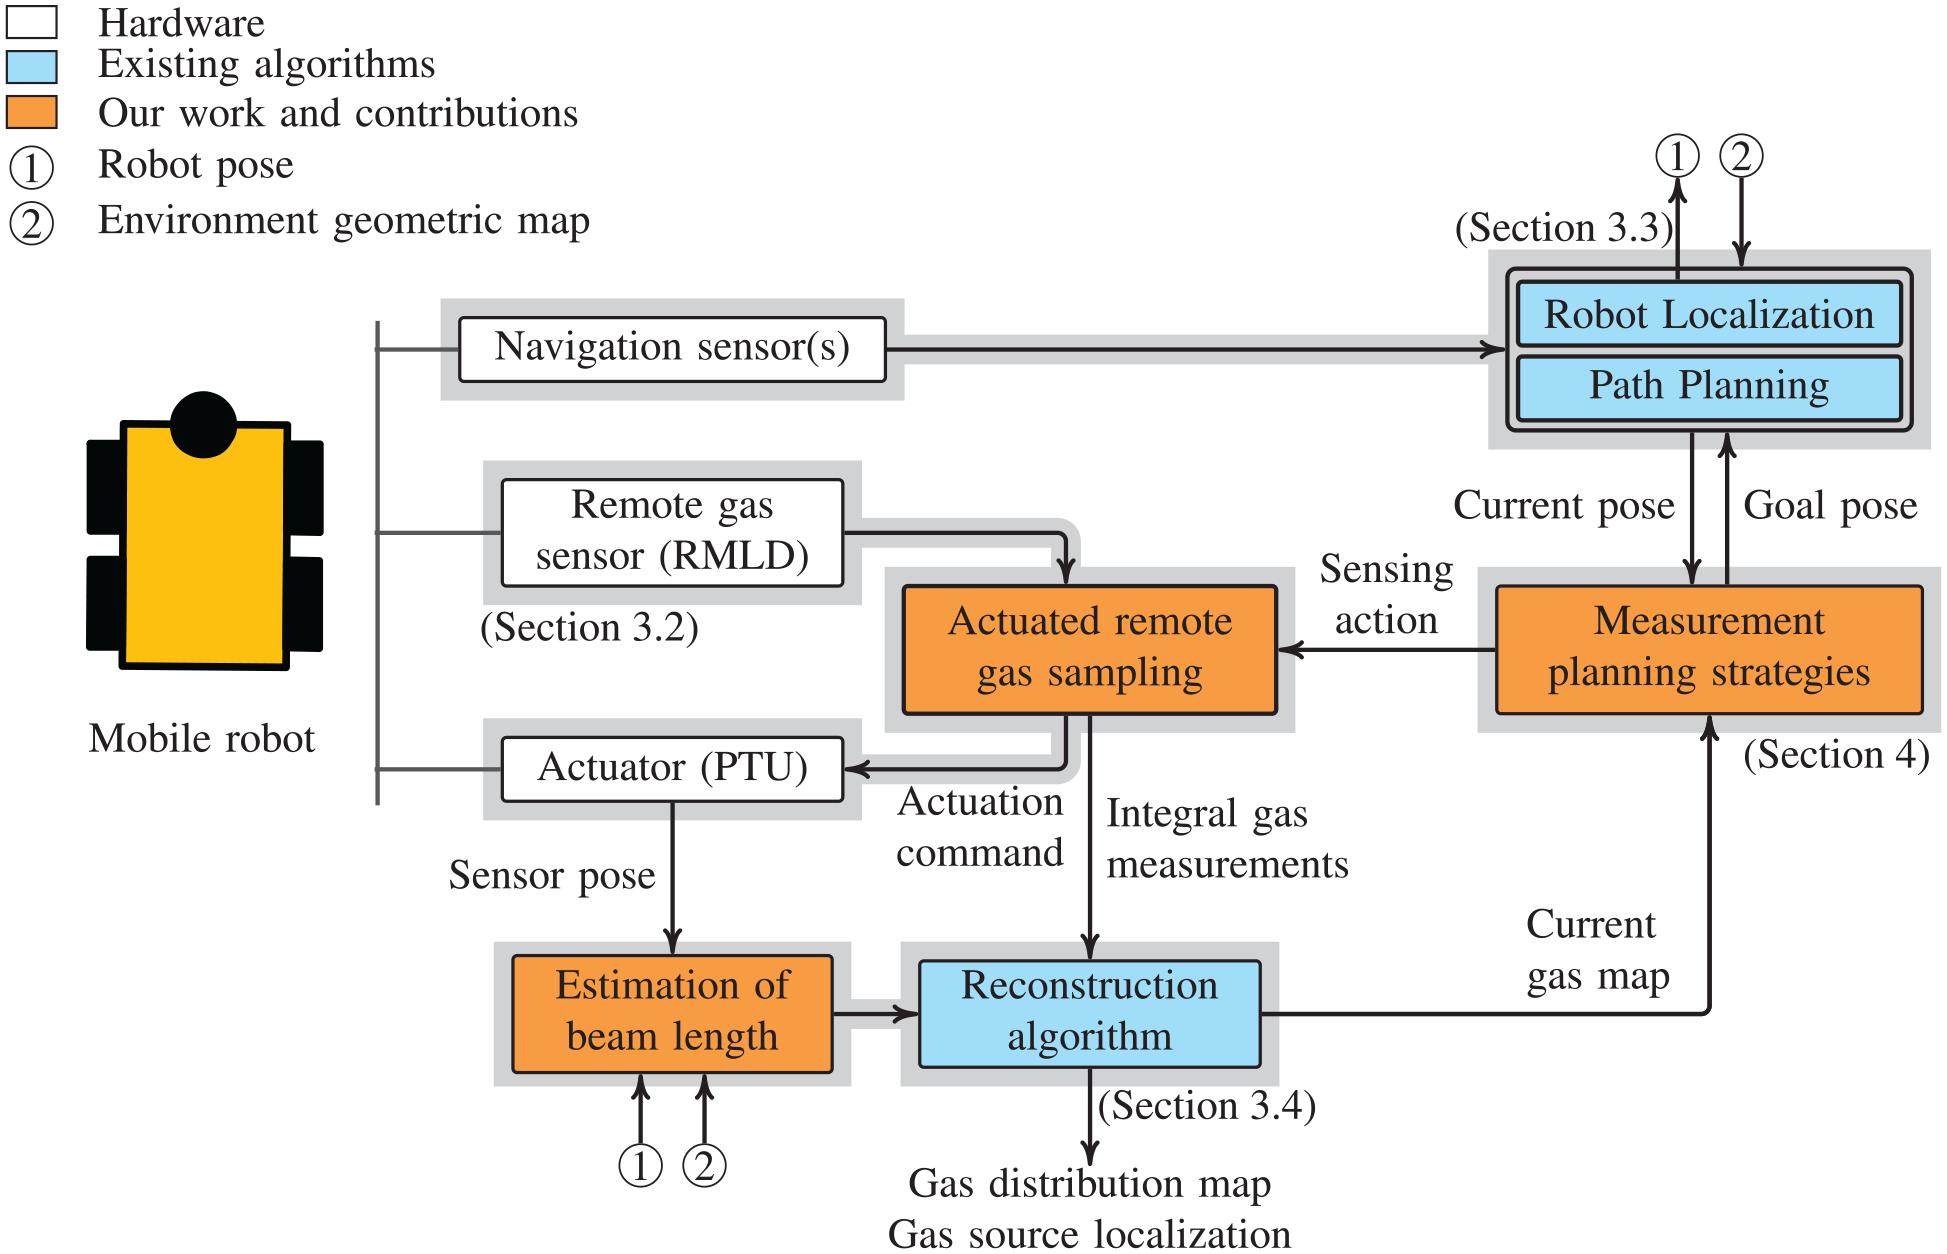
A conceptual diagram of the
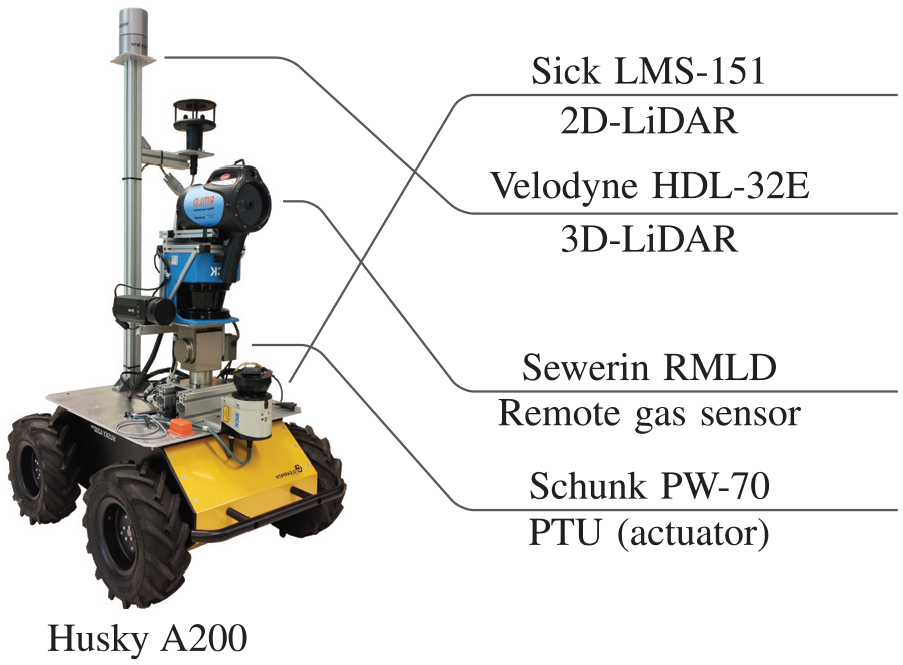
Hardware of the
The remote gas sensor is actuated to collect gas measurements within a defined field of view, near ground level. Moreover, the environment in which gas inspection is to be carried out is expected to be a flat surface with or without obstacles, which allows the movement of a ground vehicle robot. To simplify the problem and make it tractable, we assume that the measurements are collected at discrete poses, disregarding the possibility to collect gas measurements while the robot moves from one sensing pose to the next due to possible localization errors of the projected optical beams. We also assume that the robot can localize itself and plan an obstacle-free path between goal poses in the area. Since the remote gas sensor provides spatially unresolved integral measurements with no information about the length of the projected optical beams, we also assume that a geometric map of the environment can be used to estimate the beam lengths using, for example, a ray-casting technique. In this way, the localized integral gas measurements can be used as an input to a tomographic reconstruction algorithm to build a GDM and to localize the gas sources.
An important problem is to decide where the robot should sample the environment. Teleoperation can be performed by a human operator sitting outside the inspection area and deciding the sampling poses for the robot. However, it is a difficult yet dull job for an operator to efficiently plan the next sampling pose(s) based on, for example, all the collected measurements and a given map of the environment. To allow for completely autonomous missions, we present and evaluate sensor planning algorithms that aim at optimizing performance criteria for gas detection and gas distribution mapping while minimizing the number of measurements and the total distance traveled. Moreover, to efficiently complete the gas inspection in large environments, we design mission strategies above the sensor planning algorithms to decide, using all information available at a particular time, when to perform which inspection task.
3.2. Actuated remote gas sampling
We consider gas inspection with remote gas sensors, which can acquire integral concentration measurements by calculating the interaction of gaseous particles and electromagnetic energy emitted from an artificial source (active sensors). Absorption spectroscopy (Mikel et al., 2011) is a well-known principle behind most active sensors. Among different absorption spectroscopy technologies, TDLAS sensors are very specific to a target gas. They are accurate, relatively lightweight, and do not require frequent maintenance (Mikel et al., 2011).
In our design of
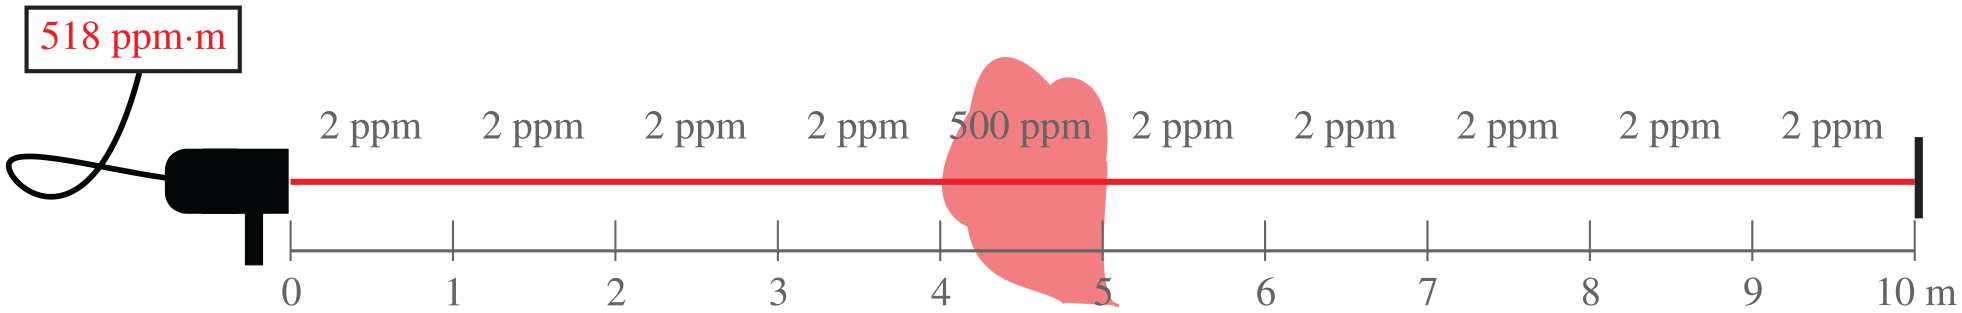
Illustration of integral measurement with the RMLD. The sensor projects an optical beam to measure a 518 ppm·m integral concentration, of which 500 ppm·m is due to the gas source and 18 ppm·m is due to the background concentration. It should be noted that (1) the sensor indicates only spatially unresolved integral measurements that do not include information about a gas source location or, generally, the concentration distribution along the beam, and (2) the sensor that we use does not report the actual length of the optical beam. Thus, the concentration distribution has to be estimated from a set of measurements using tomographic reconstruction, which requires determining the length of the optical beams.
Using a remote gas sensor poses certain challenges, however. The RMLD, for example, neither provides information about the concentration distribution along the reflected beam, nor the length of the beam. We assume that the robot has access to an environment map, which can be used with the localized RMLD pose to estimate the beam length using ray-casting. The problem of estimating the concentration distribution from localized integral measurements (tomographic reconstruction) is discussed in Section 3.4.
The onboard remote sensor in
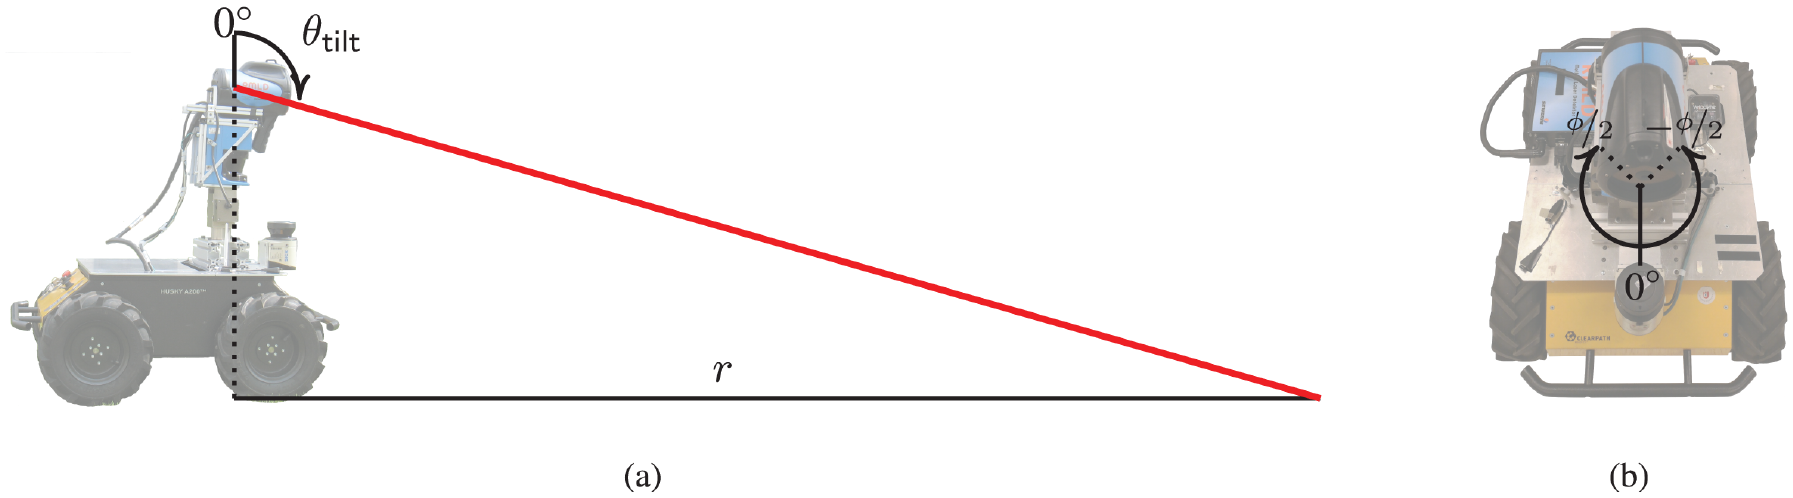
(a) The remote sensor (RMLD) is rotated along the tilt axis of the PTU, and the projected optical beam is reflected after hitting the ground. The length of an optical beam r is the distance between the origin of the beam and the point of reflection. (b) A sensing sweep is performed by rotating the sensor along the pan axis of the PTU for the given angle of view
3.3. Robot navigation
The robot is required to move autonomously between selected sensing configurations. Thus,
A commonly used environment representation is the occupancy grid map (OGM), which models the occupancy in a grid of binary random variables. In our implementation, we maintain an OGM using the approach of Grisetti et al. (2007), and we use a 2D robot navigation stack (Marder-Eppstein et al., 2010) for path planning.
The robot needs to localize itself to follow the planned path. In the experimental setup of
3.4. Reconstruction of gas distribution
While the area is being inspected, the collected integral measurements are processed to create GDMs during or at the end of the operation. We perform a tomographic reconstruction on the measurements to generate a GDM, which is a spatial representation of gas concentration distribution in a grid. As the RMLD reports integral measurements with no information about the length of the beam, we localized the optical beam using the estimated robot pose and environment map.
The least-squares approach presented in Hernandez Bennetts et al. (2014) is used for tomographic reconstruction. The algorithm to estimate the gas concentration in a grid is framed as a convex optimization problem. The input to the algorithm is the set of localized integral measurements, which are collected with the remote gas sensor and the corresponding optical beam of each measurement is localized using the sensor pose (for the initial position) and ray-casting on the environment grid map (for the end position of the optical beam). The generated GDM is further used to locate gas sources. An example of the reconstruction process is shown in Figure 7.
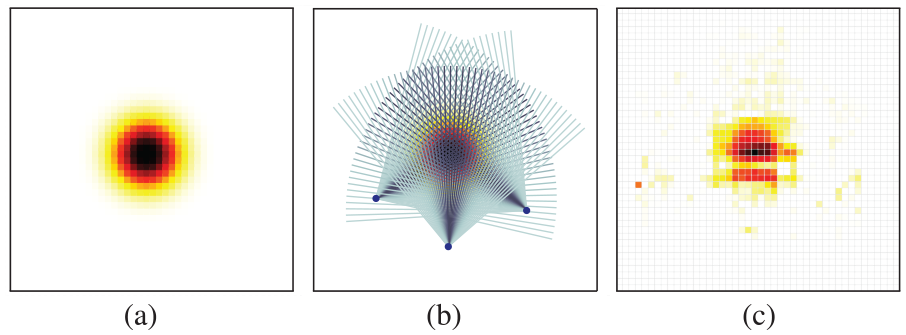
(a) An artificial gas distribution, generated in simulation to perform gas tomography. The yellow-to-dark squares indicate low-to-high concentrations in an unobstructed environment. (b) Optical beams are projected from three different configurations around the gas source to collect integral measurements. (c) The resultant reconstructed GDM is the estimated gas concentration in a grid, obtained by applying the tomographic algorithm in Hernandez Bennetts et al. (2014). The reconstruction quality is highly dependent on the number of configurations and cross angles between their optical beams.
4. Measurement planning for autonomous inspection
In an inspection mission, the robot needs to follow sampling poses that are either indicated by a human operator or a result of sensor planning algorithms. In the latter case, efficient algorithms are required to decide sensor placement. We consider the following tasks in a gas inspection mission: (1) gas detection, to sample the environment for initial detection of gas; (2) gas distribution mapping, to sample the environment for accurate modeling of gas concentration distribution; and (3) gas source localization, to estimate the location of gas sources, which we approach by using the generated GDM. In this section, we present our main contributions in measurement planning to bring complete autonomy into
Further discussion is divided into three parts: the first part describes our assumptions, simplifications, and formulation of the measurement planning problem for the gas inspection missions; the second part is about our sensor planning algorithms that generate individual sensor placement solutions for the inspection tasks of gas detection and gas distribution mapping. We do not separately cast a sensor planning problem for gas source localization, but we use the generated GDM to estimate gas source locations; the last part describes our mission strategies to perform inspection tasks of gas detection and gas distribution mapping collectively and efficiently.
4.1. Problem formulation
We represent the environment in which the inspection mission is to be performed as a 2D Cartesian grid of occupied and unoccupied cells and formulate the problem of deciding sampling poses as a sensor placement problem. Occupied cells contain an obstacle and are considered (1) not traversable by the robot, and (2) to reflect the optical beam of the sensor before it can reach any other obstacle, typically the ground. This assumption may not strictly hold as the area corresponding to an occupied cell of a grid map may not be completely occupied in the real world. Thus, some occupied cells can be traversed by the robot, and for some, the optical beam of the sensor can pass through. However, the assumption that an occupied cell reflects the optical beam of the remote gas sensor is conservative for the validity of a measurement plan (as it may only lead to measure some of the cells, usually a small fraction, more often than necessary), and a fine grid map (cell size smaller than the robot length) will typically realistically capture the possibilities of sensor placement in the environment.
4.1.1. Sensing configuration
A sensing configuration corresponding to sampling the environment over a certain area by using an actuated remote gas sensor is defined as follows.
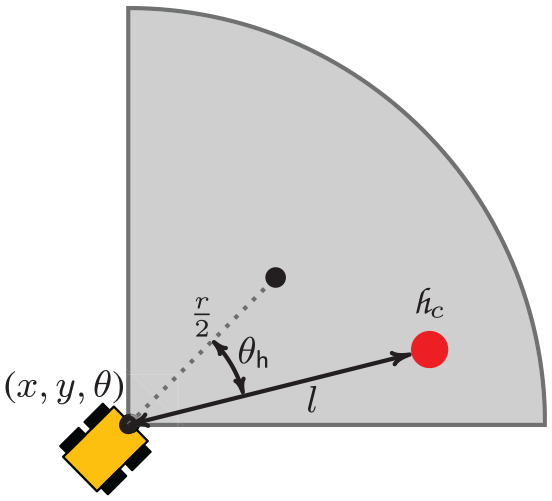
A sensing configuration c is a prescribed sampling routine to cover a certain area with the actuated RMLD: a sensing configuration placed at pose (x, y,
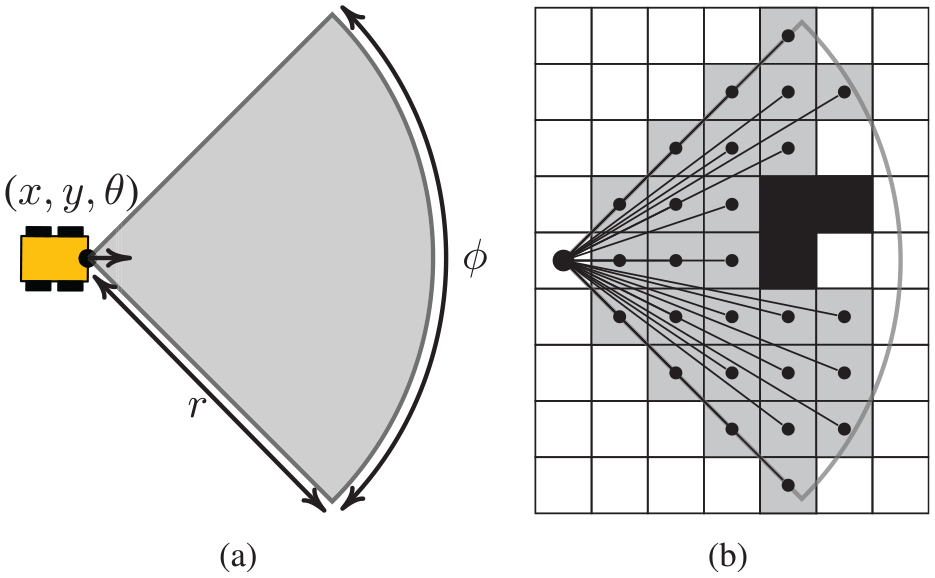
(a) A sensing configuration is a prescribed sampling routine. It can cover a selectable field of view (
A candidate sensing configuration
4.1.2. Sensing coverage
Owing to obstructions, not all the cells in the circular sector (
The optical beam of the sensor is of a conic shape and spreads out with increasing distance to its origin. In this way, the beam interacts with a larger cross-section of gaseous substance with increasing distance. A human operator inspecting the area is recommended to keep the RMLD sensor at a certain distance from the target, e.g., when searching for a point leak at a gas meter so that the beam footprint provides a large enough area coverage (Sewerin, 2015). A minimum distance requirement could be considered in the computation of sensing coverage. However, in our experiments, we did not observe problems with the detection of gas in close-by cells. This is probably because
4.1.3. Measurement plan
We define a measurement plan as a sequence of sensing configurations.
A measurement plan
A measurement plan is computed for an inspection task of either gas detection or gas distribution mapping. The plan is required to provide a particular type of sensing coverage, either in terms of total observation of the environment, or an overlapping sensing coverage in particular areas. There are two types of operational costs associated with a measurement plan: a sensing cost, which is determined as the number of sensing configurations to be executed and the cost of each sensing configuration; and a traveling cost, which is associated with the length of the path required for the robot to travel. An optimal measurement plan provides the desired sensing coverage for an inspection task with the lowest operational cost. The overall problem of minimal operational cost can be viewed as a combination of two NP-hard problems: the art gallery problem for minimal sensing cost (Lee and Lin, 1986) and the TSP (Applegate et al., 2006) for the minimal traveling path. Thus, minimizing the sensing and traveling costs at the same time is computationally intractable for realistic environments. We solve the problem in two steps: first, to find a minimal set of configurations for the desired sensing coverage and, then, the shortest traveling path among the selected configurations. In this fashion, a near-optimal solution can be found quickly, which we refer to as an efficient measurement plan.
We cast gas detection as an exploration task, in which gas patches are to be detected by selecting sensing configurations such that full coverage is provided. A measurement plan for gas detection is denoted as
4.2. Sensor planning for inspection tasks
In this section, we provide details of our sensing planning algorithms to generate efficient measurement plans for gas detection (
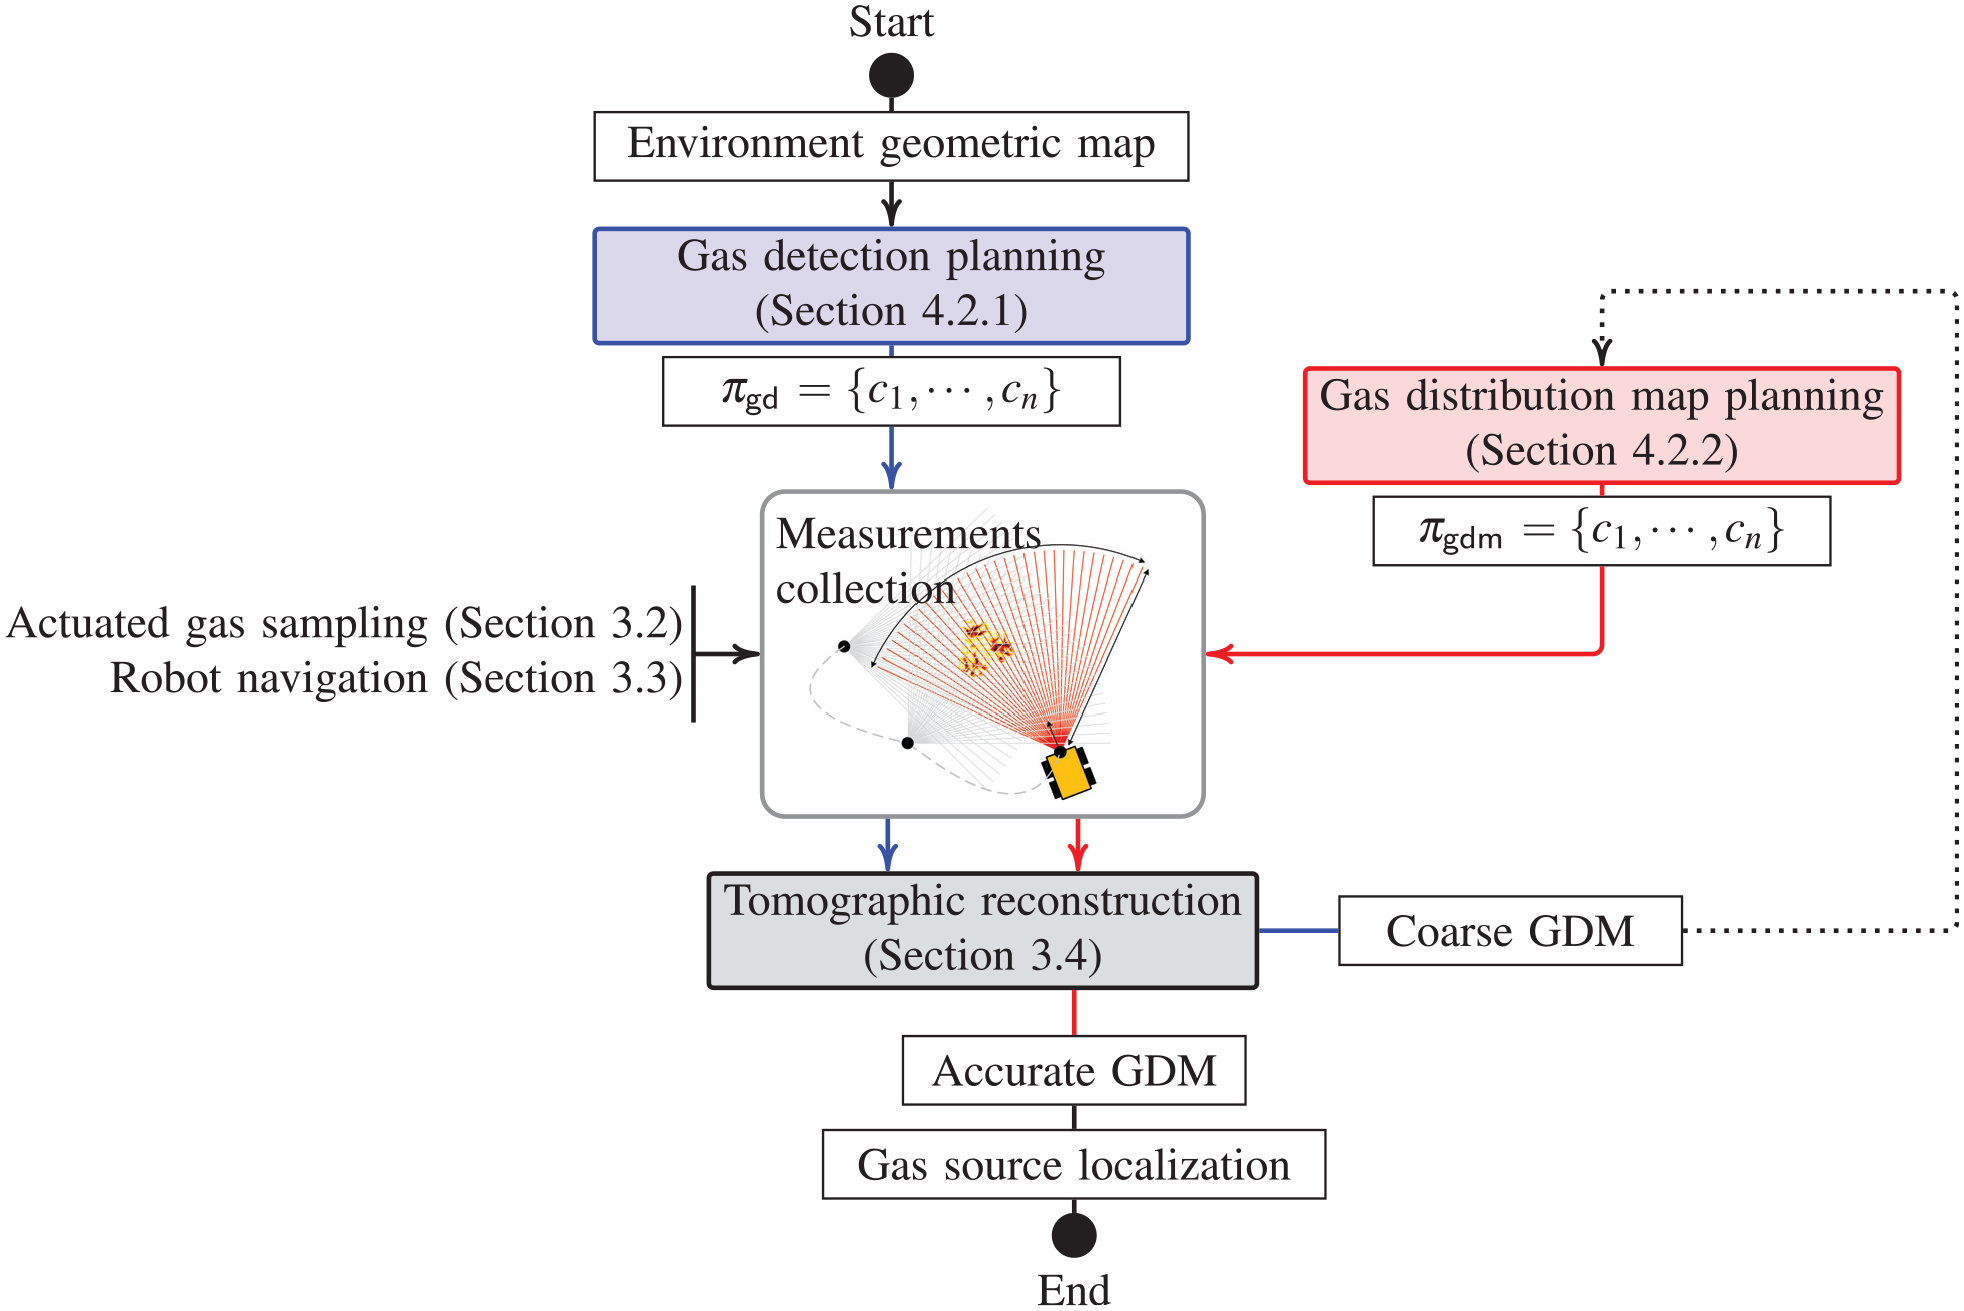
A block diagram of sensor planning for the inspection tasks. First, a gas detection plan (
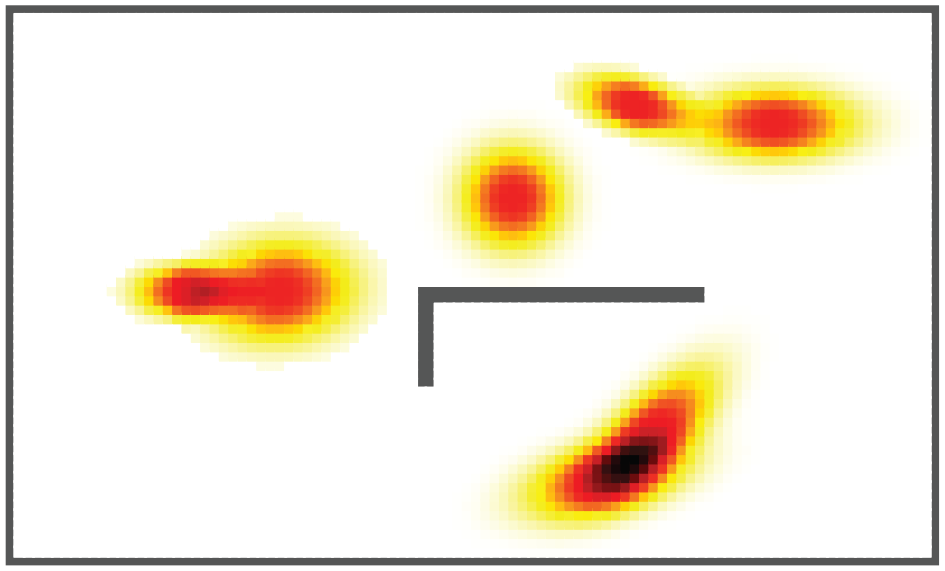
A sample environment with the simulated gas distribution. The environment with obstacles represents realistic scenarios, such as an indoor area with walls. The visibility of the environment requires viewing from different locations. Artificial time-invariant Gaussian-shaped local gas distributions are chosen to be challenging for gas mapping. The five gas sources with different concentrations create different gas distributions of regular and irregular shapes; the hotspot areas are in close vicinity and far apart; gas accumulation effects are also captured. This gas distribution example is used in the text to illustrate different sensor planning steps.
4.2.1. Gas detection planning
We previously proposed an efficient sensor planning algorithm for gas detection (Arain et al., 2015a,b) that generates a measurement plan (
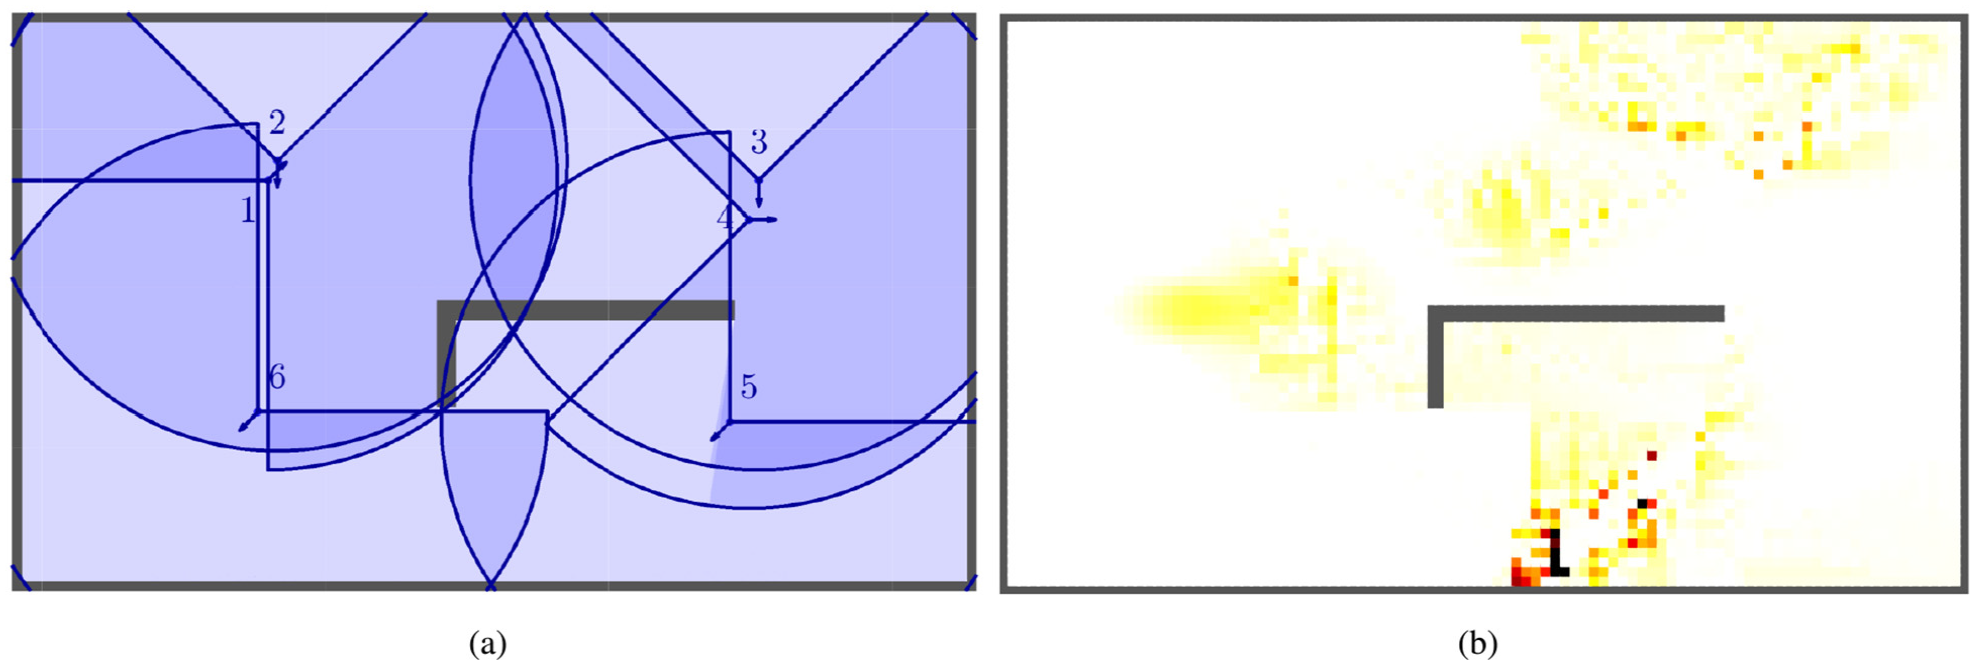
(a) A sensor planning solution for gas detection in the sample environment (Figure 10). The selected configurations are marked with their pose, field of view, and sequence to visit. (b) The coarse gas map obtained from the measurements collected during the gas detection process.
4.2.2. Gas distribution mapping planning
Intuitively, to create an accurate GDM, the areas of interest (hotspots) need to be sampled at viewpoints that provide a strongly overlapping sensing coverage. This can be done with randomly selected sampling poses as in Hernandez Bennetts et al. (2014), but that is not a very efficient approach. We need to study: (1) how to estimate the areas of interest or hotspots as accurately as possible from the coarse GDM; (2) to understand which arrangements of sensing configurations offer a higher-quality reconstruction of gas distributions; and (3) how to plan sensing configurations accordingly. In the following sections, we describe our contributions to these topics, which are summarized in Figure 12 (an extension of Figure 9 for GDM planning).
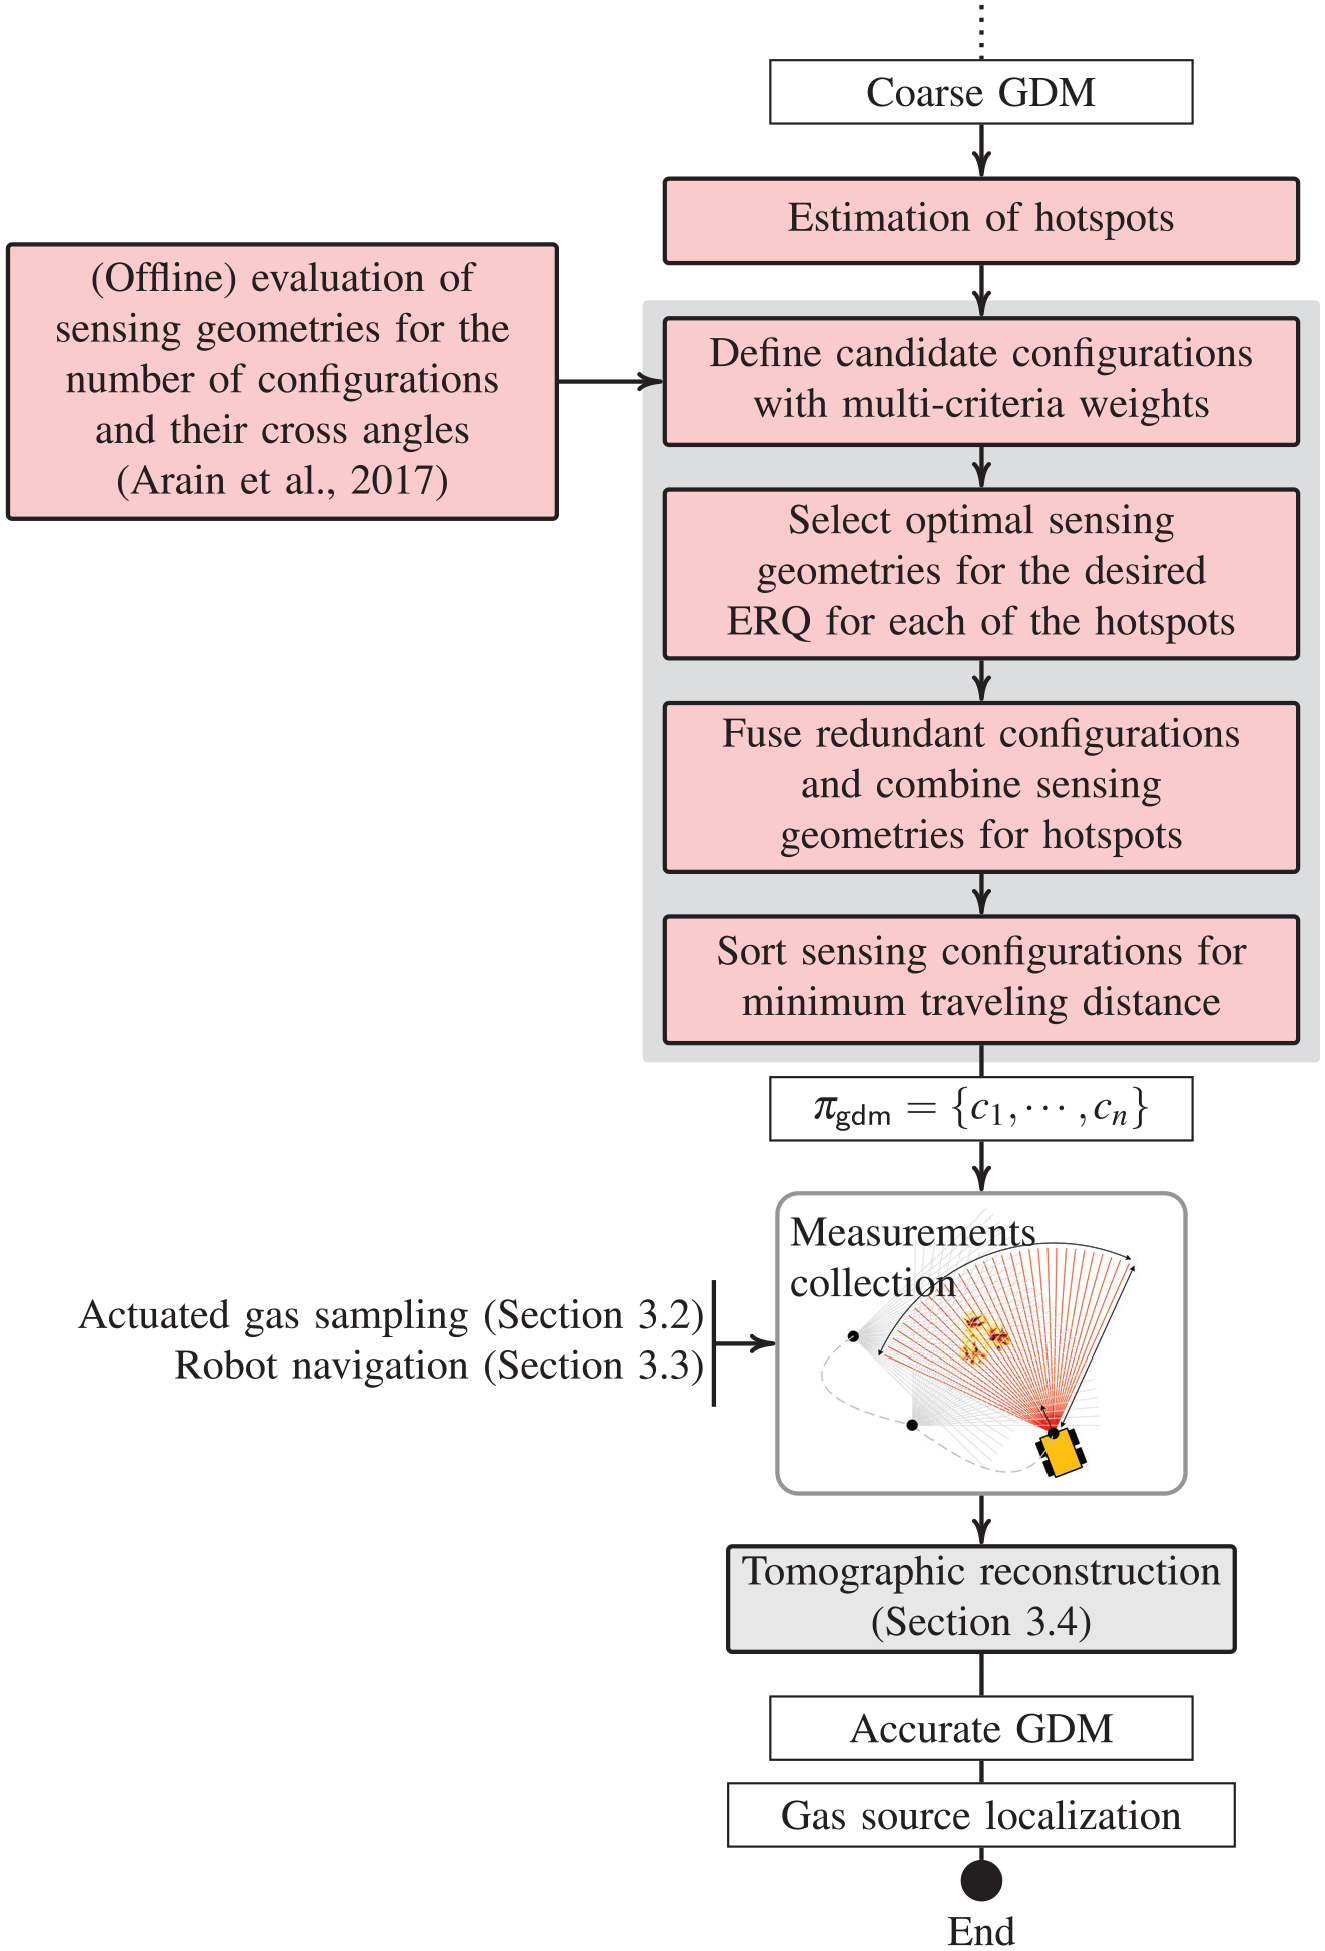
Overview block diagram of sensor planning for gas distribution mapping (Section 4.2.2). A coarse GDM from gas detection is used to estimate hotspots where detailed gas tomography is desired for accurate reconstruction of gas distributions. To understand which sensing geometries (arrangements of sensing configurations) offer better reconstruction quality than others, an evaluation was carried out in offline fashion. The outcomes of the evaluation are used to plan optimal sensing geometries for each of the estimated hotspots. For the sensor planning, candidate configurations with multi-criteria weights are defined and an optimal sensing geometry is selected individually for each of the hotspots. Then all the geometries are fused to find a global sensing planning solution (
Estimation of hotspots
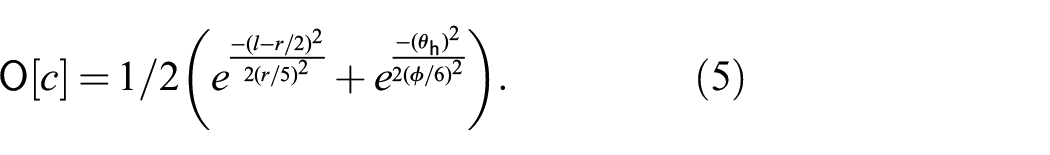
We define a hotspot as follows.
A hotspot is an area of interest for the suspected gas sources, where a detailed tomographic reconstruction is desired. The center of the estimated hotspot is denoted with
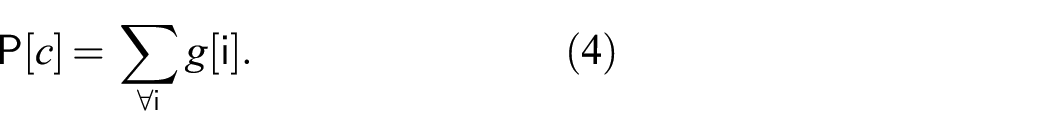
The hotspot estimation algorithm is defined as the following. First, all non-zero concentration estimates are grouped/clustered in connected components based on their distance to define the distinct hotspot areas that require a closer look. Next, for each hotspot area, its center is determined around which overlapping sensing configurations are planned. We have developed a divide-and-combine procedure to estimate the hotspots. Figure 13 shows an example of estimating the hotspots from the coarse GDM in Figure 11(b).
In the divide phase, the regions that contain non-zero concentration distribution are divided based on their geometric layout. First, the disjoint regions are identified using agglomerative clustering (Khan and Luo, 2005), see Figure 13(b). Then, to ensure that all the disjoint regions can be covered with the given sensing range, regions that are too large are sub-divided. The sub-division is performed iteratively such that any region of length l larger than the sensing range r is divided into equal parts of
In the combine phase, weighted-mean points of the concentration distribution in the identified regions are computed (Figure 13(d)). The sum of all the weights
To perform an accurate tomographic reconstruction for gas distribution mapping, the overlapping sensing coverage needs to be focused on the high concentration spots, which are approximated by the weighted mean points. The high-concentration spots of two or more regions close to each other can be combined for a single sensor placement solution. Therefore, in an iterative fashion, pair-wise weighted-mean points closer than half of the sensing range are replaced by their center of mass, starting with the shortest distance (Figure 13(e)). In the final step, the weighted-mean points that belong to the regions of very low-concentration distribution are discarded. This can be decided based on the concentration weights of mean points and the total gas concentration in the corresponding region (Figure 13(f)). One straightforward option for the concentration weights is setting a fixed threshold value. However, when the environment is populated with an increasing number of gas sources, then a fixed threshold can discard true estimations owing to the normalization of region weights in (1). Thus, in our implementation, we set the weight threshold to
A step-wise illustration of the estimation of hotspots from a coarse tomographic reconstruction of the GDM in Figure 11(b). (a) Only grid cells with non-zero gas concentrations are considered. (b) Disjoint regions are identified by agglomerative clustering. (c) The regions are subdivided based on the given sensing range using k-means clustering. (d) Concentration weighted-mean points, shown as red circles, are estimated in each of the regions. (e) Mean points closer than half of the sensing range are combined, and 14 weighted-mean points are fused into 7 points. (f) Weighted-mean points that correspond to too low concentrations are removed (blue circle). The remaining 6 weighted-mean points in
In our previous work (Arain et al., 2016), hotspots were defined as the disjoint regions of non-zero concentrations (see Figure 13(b)), and center locations
Evaluation of sensing geometries
We define a sensing geometry as follows.
A spatial arrangement of sensing configurations used for tomographic reconstruction.
To plan sensing configurations for accurate gas distribution mapping of hotspots, we need to know which sensing geometries are linked to better reconstruction results. To understand how different sensing geometries affect the reconstruction quality, we performed a simulation evaluation for a single hotspot of different gas distributions (Arain et al., 2017). We used a computational fluid dynamics (CFD)-based gas dispersal simulation setup (Fan et al., 2017) to generate different realistic gas distributions. To investigate sensing geometries, we evaluated: (1) how the number of overlapping configurations affects the quality of the reconstruction; and (2) what are the preferred cross angles between the optical beams of the configurations. For the evaluation of sensing geometries, a different number of configurations (
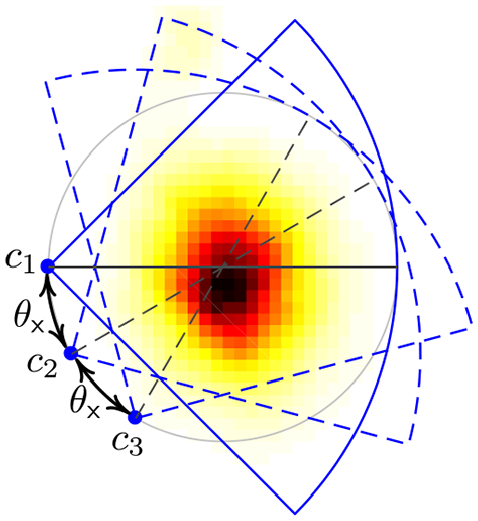
An instance of a
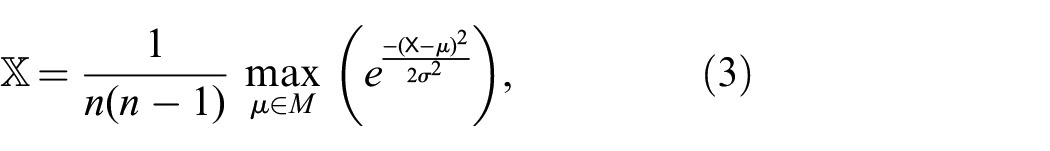
For preferred sensing geometries, we define an expected reconstruction quality (ERQ) as follows.
The ERQ is inversely proportional to the reconstruction error, i.e., the error between the true and the reconstructed distributions.
The ERQ is expressed as an expectation value because, in many cases, the exact reconstruction error is hard to determine owing to a lack of ground-truth, for example, with freely discharging gas. In a gas inspection task, it is important to know gas concentration magnitudes and their spatial distributions. The ERQ captures two reconstruction errors: (1) the global error of the spatial reconstruction, computed as nearness (Todd and Ramachandran, 1994); and (2) the divergence of the probability density function (PDF) of the ground-truth and the reconstructed concentration map, computed as the Jensen–Shannon divergence (JS-div) (Lin, 1991). The ERQ is computed as an average of feature scaling for Nearness and JS-div in the range of
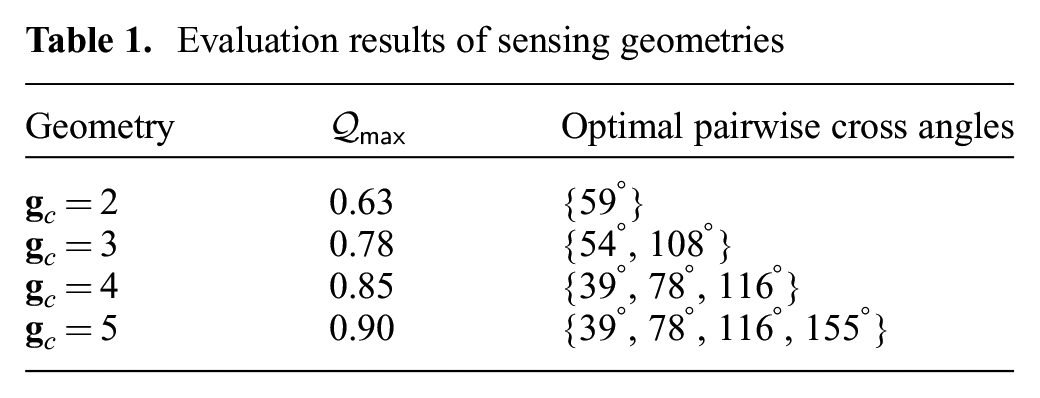
Evaluation results of sensing geometries
Sensor placement problem
With the estimated hotspots and the knowledge about preferable sensing geometries obtained in the study described in the previous section, the next step of sensor planning for GDM is to select an optimal sensing geometry that maximizes the ERQ for a given number of sensing configurations. In general, the sensor placement problem for gas distribution mapping is hard. We note here that the evaluation for sensing geometries presented in Arain et al. (2017) is limited: it was (1) carried out in simulation analyzing only about 0.4 million sensing geometries, (2) only a single hotspot with a limited amount of different gas distributions was considered, and (3) only sensing geometries with
We approach sensor planning for gas distribution mapping in two steps. First, optimal sensing geometries according to the desired ERQ are selected for each of the hotspots, individually. After that, all the selected geometries for the hotspots are fused into one global geometry to generate an overall measurement plan for high-quality tomographic reconstruction of the gas distributions. In the following sections, we describe: (1) how multi-criteria weights are defined for candidate sensing configurations; (2) how the optimal sensing geometries for the reconstruction of hotspots are selected; (3) how the sensing geometries for all hotspots are fused to obtain the final measurement plan (
Multi-criteria weights for candidate configurations
The evaluation of preferable sensing geometries considered configurations aligned along a concentric circle around the actual hotspot center. However, in real-world environments with geometric constraints, it is not always possible that the configurations with the desired pairwise cross angles can be placed at all. We now also consider all candidate configurations that can cover the hotspot center, not only candidate configurations on a concentric circle around the hotspot center, as we did in the evaluation of sensing geometries. This means each candidate configuration can provide sensing coverage to the concentration distribution around different hotspots. We, therefore, formulate the sensor planning problem allowing for deviations from the preferred cross angles and from on-concentric-circle configurations to find the closest feasible approximation to preferred sensing configurations.
To select configurations that optimize multiple criteria, we define a unit interval gain

where
For preferred cross angles between sensing configurations, a pair-wise unit interval gain
whereas
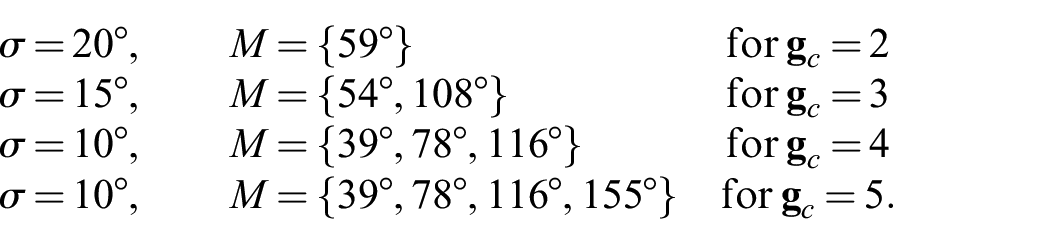
In (3), n is the number of configurations to be selected and
Pair-wise cross angles gain
Although
The persistent coverage describes the geometric placement of a configuration concerning the hotspot. In particular, the field of view (
The persistent coverage for a configuration is defined by the offset in the placement and orientation relative to
For the given proportional and persistent gains

Here we use the min–max normalized parameter
In our previous work (Arain et al., 2016), only a count of cells covered by a candidate configuration, which contain gas concentration above a set threshold, was considered for the sensing coverage index. Consequently, entirely different gas distributions covered by two configurations could still be assigned the same coverage indices. The new approach computes a more useful sensing coverage index taking into account the concentration distribution covered and the geometric arrangement of the configurations around the hotspot. The evaluation for the parameter selection presented later in this discussion demonstrates that proportional and newly introduced persistent coverages are important criteria for improving reconstruction quality.
In addition to the cross angles and sensing coverage, we also consider traveling distance gain
Finally,

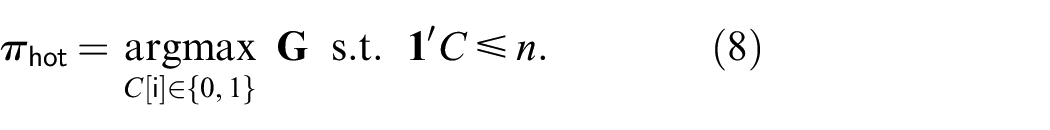
In (7), C is a column vector, which contains binary decision variables representing if a given candidate sensing configuration is selected (value 1) or not (value 0). The parameters
Optimal sensing geometries for hotspots
For a sensing geometry to be selected for a hotspot, candidate configurations are defined on the grid map, oriented towards
The obtained
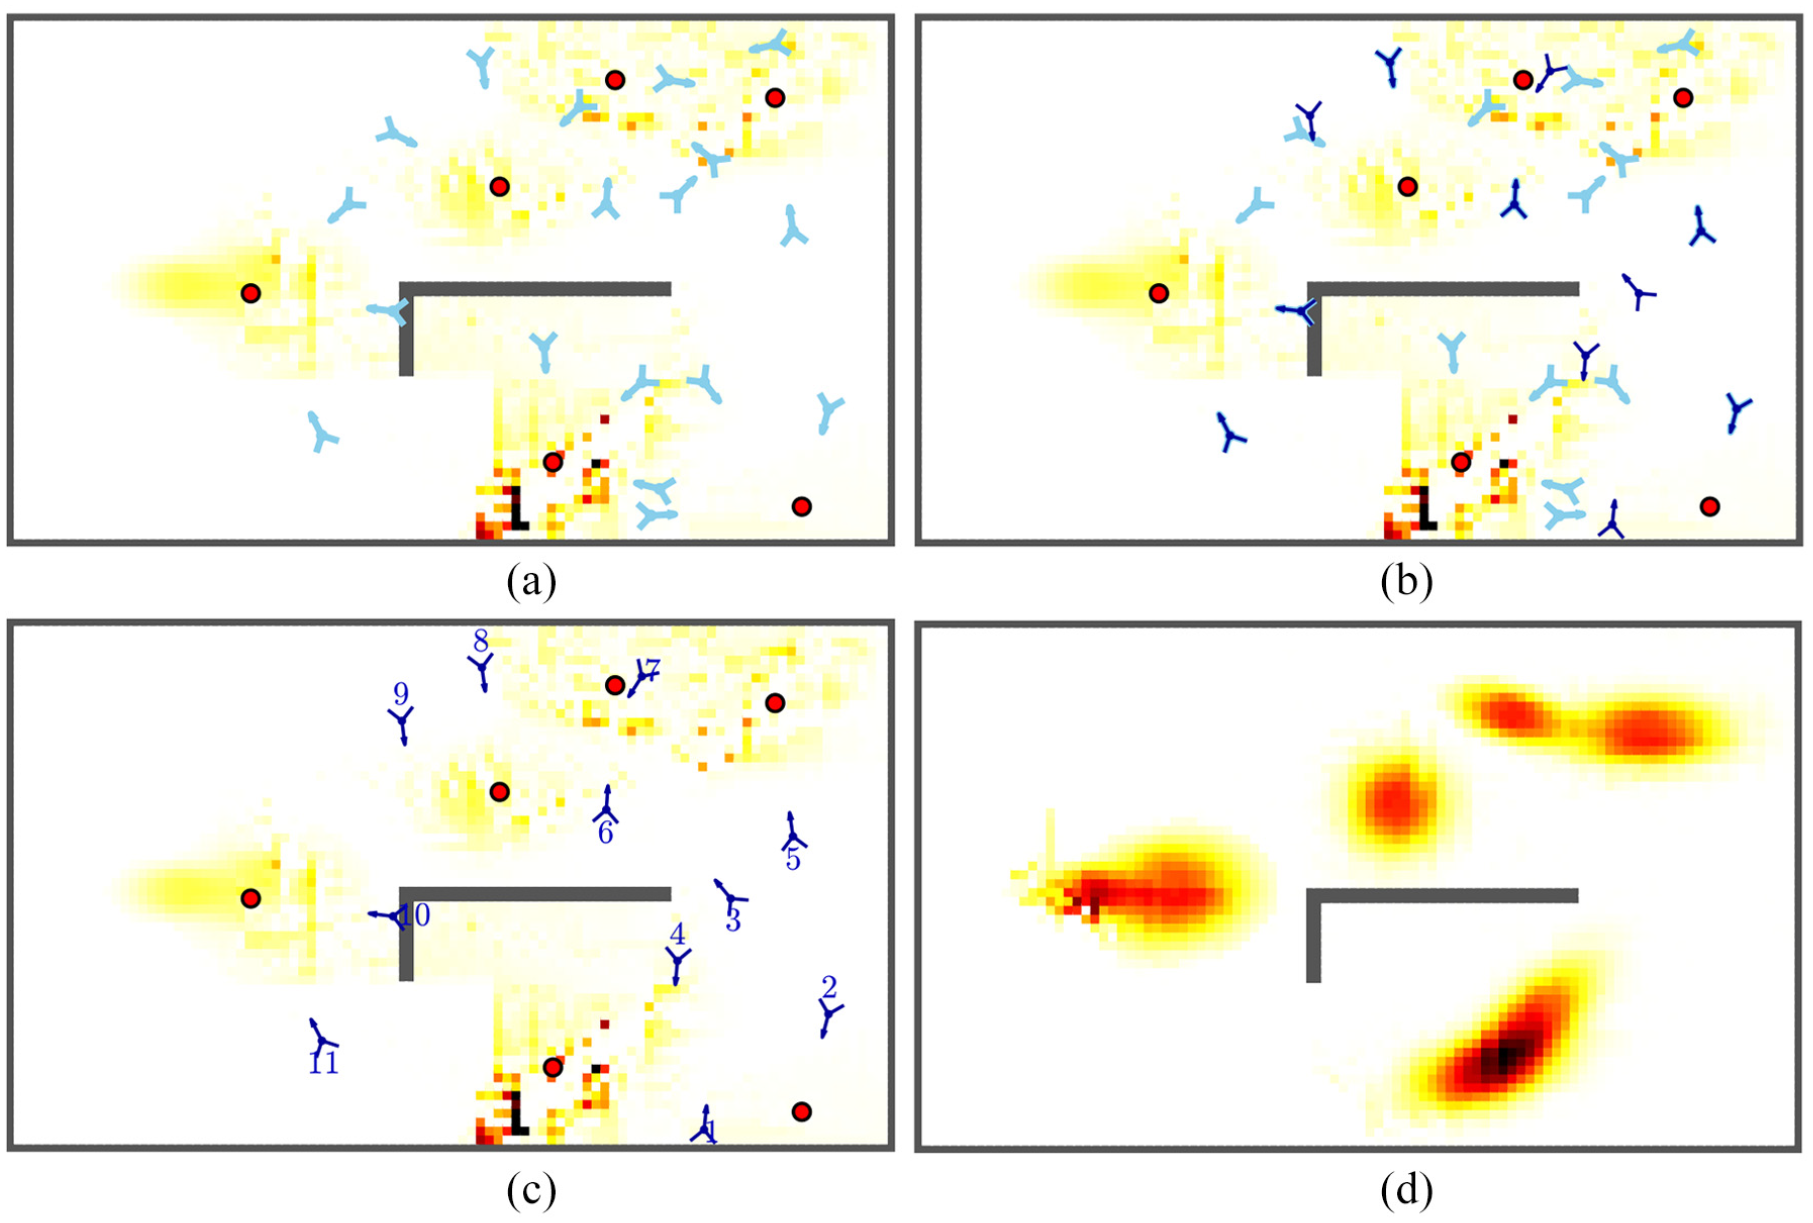
Sensor planning for gas distribution mapping in the areas of estimated hotspots in Figure 13. (a) The configurations in the optimal sensing geometries selected for each of the hotspots are shown in light blue. (b) In the fusion of sensing geometries for hotspots, redundant configurations are replaced with new configurations. Here, a total of 18 configurations in the sensing geometries for hotspots are reduced to 11 configurations, shown with dark-blue markers. (c) The selected configurations are sorted so that the traveling distance is minimized. The result is the measurement plan for gas distribution mapping. (d) The measurements are collected by executing the plan, and the GDM is created. Comparing this reconstruction with the ground-truth in Figure 10 shows that the obtained GDM is a very good estimate of the actual gas distribution.
Fusion of the sensing geometries for hotspots
The individually selected sensing geometries for each of the hotspots are now fused to obtain a global measurement plan. Straightforwardly selecting the union of all the configurations of the selected sensing geometries is a simple but not fully efficient approach: if two or more hotspots are close to each other (closer than twice the sensing range), some of the configurations in one sensing geometry can be very similar to configurations in the other sensing geometry. In such a case, a pair of redundant configurations can be replaced with a new configuration by keeping the desired ERQ of the corresponding hotspots. The candidate configurations for the replacement of redundant configurations are defined with orientations towards the geometric mean directions of the hotspots corresponding to the redundant configurations.
A list
Figure 17(b) is the fusion of the sensing geometries for hotspots in Figure 17(a). For the given

Figure 17(c) shows the measurement plan for gas distribution mapping in the sample environment. The final GDM created after collecting gas measurements is shown in Figure 17(d), which is very similar to the simulated ground-truth distribution in Figure 10.
Parameter selection for multi-criteria weights
Simulated experiments were conducted to find the optimal values of the parameters,
For the selection of parameters, simulations were performed in different layouts with artificial gas sources modeled as time-invariant Gaussian-shaped gas distributions. Note that, unlike in the evaluation of sensing geometries (Arain et al., 2017), we do not use CFD-based gas dispersal simulation here.
The parameters
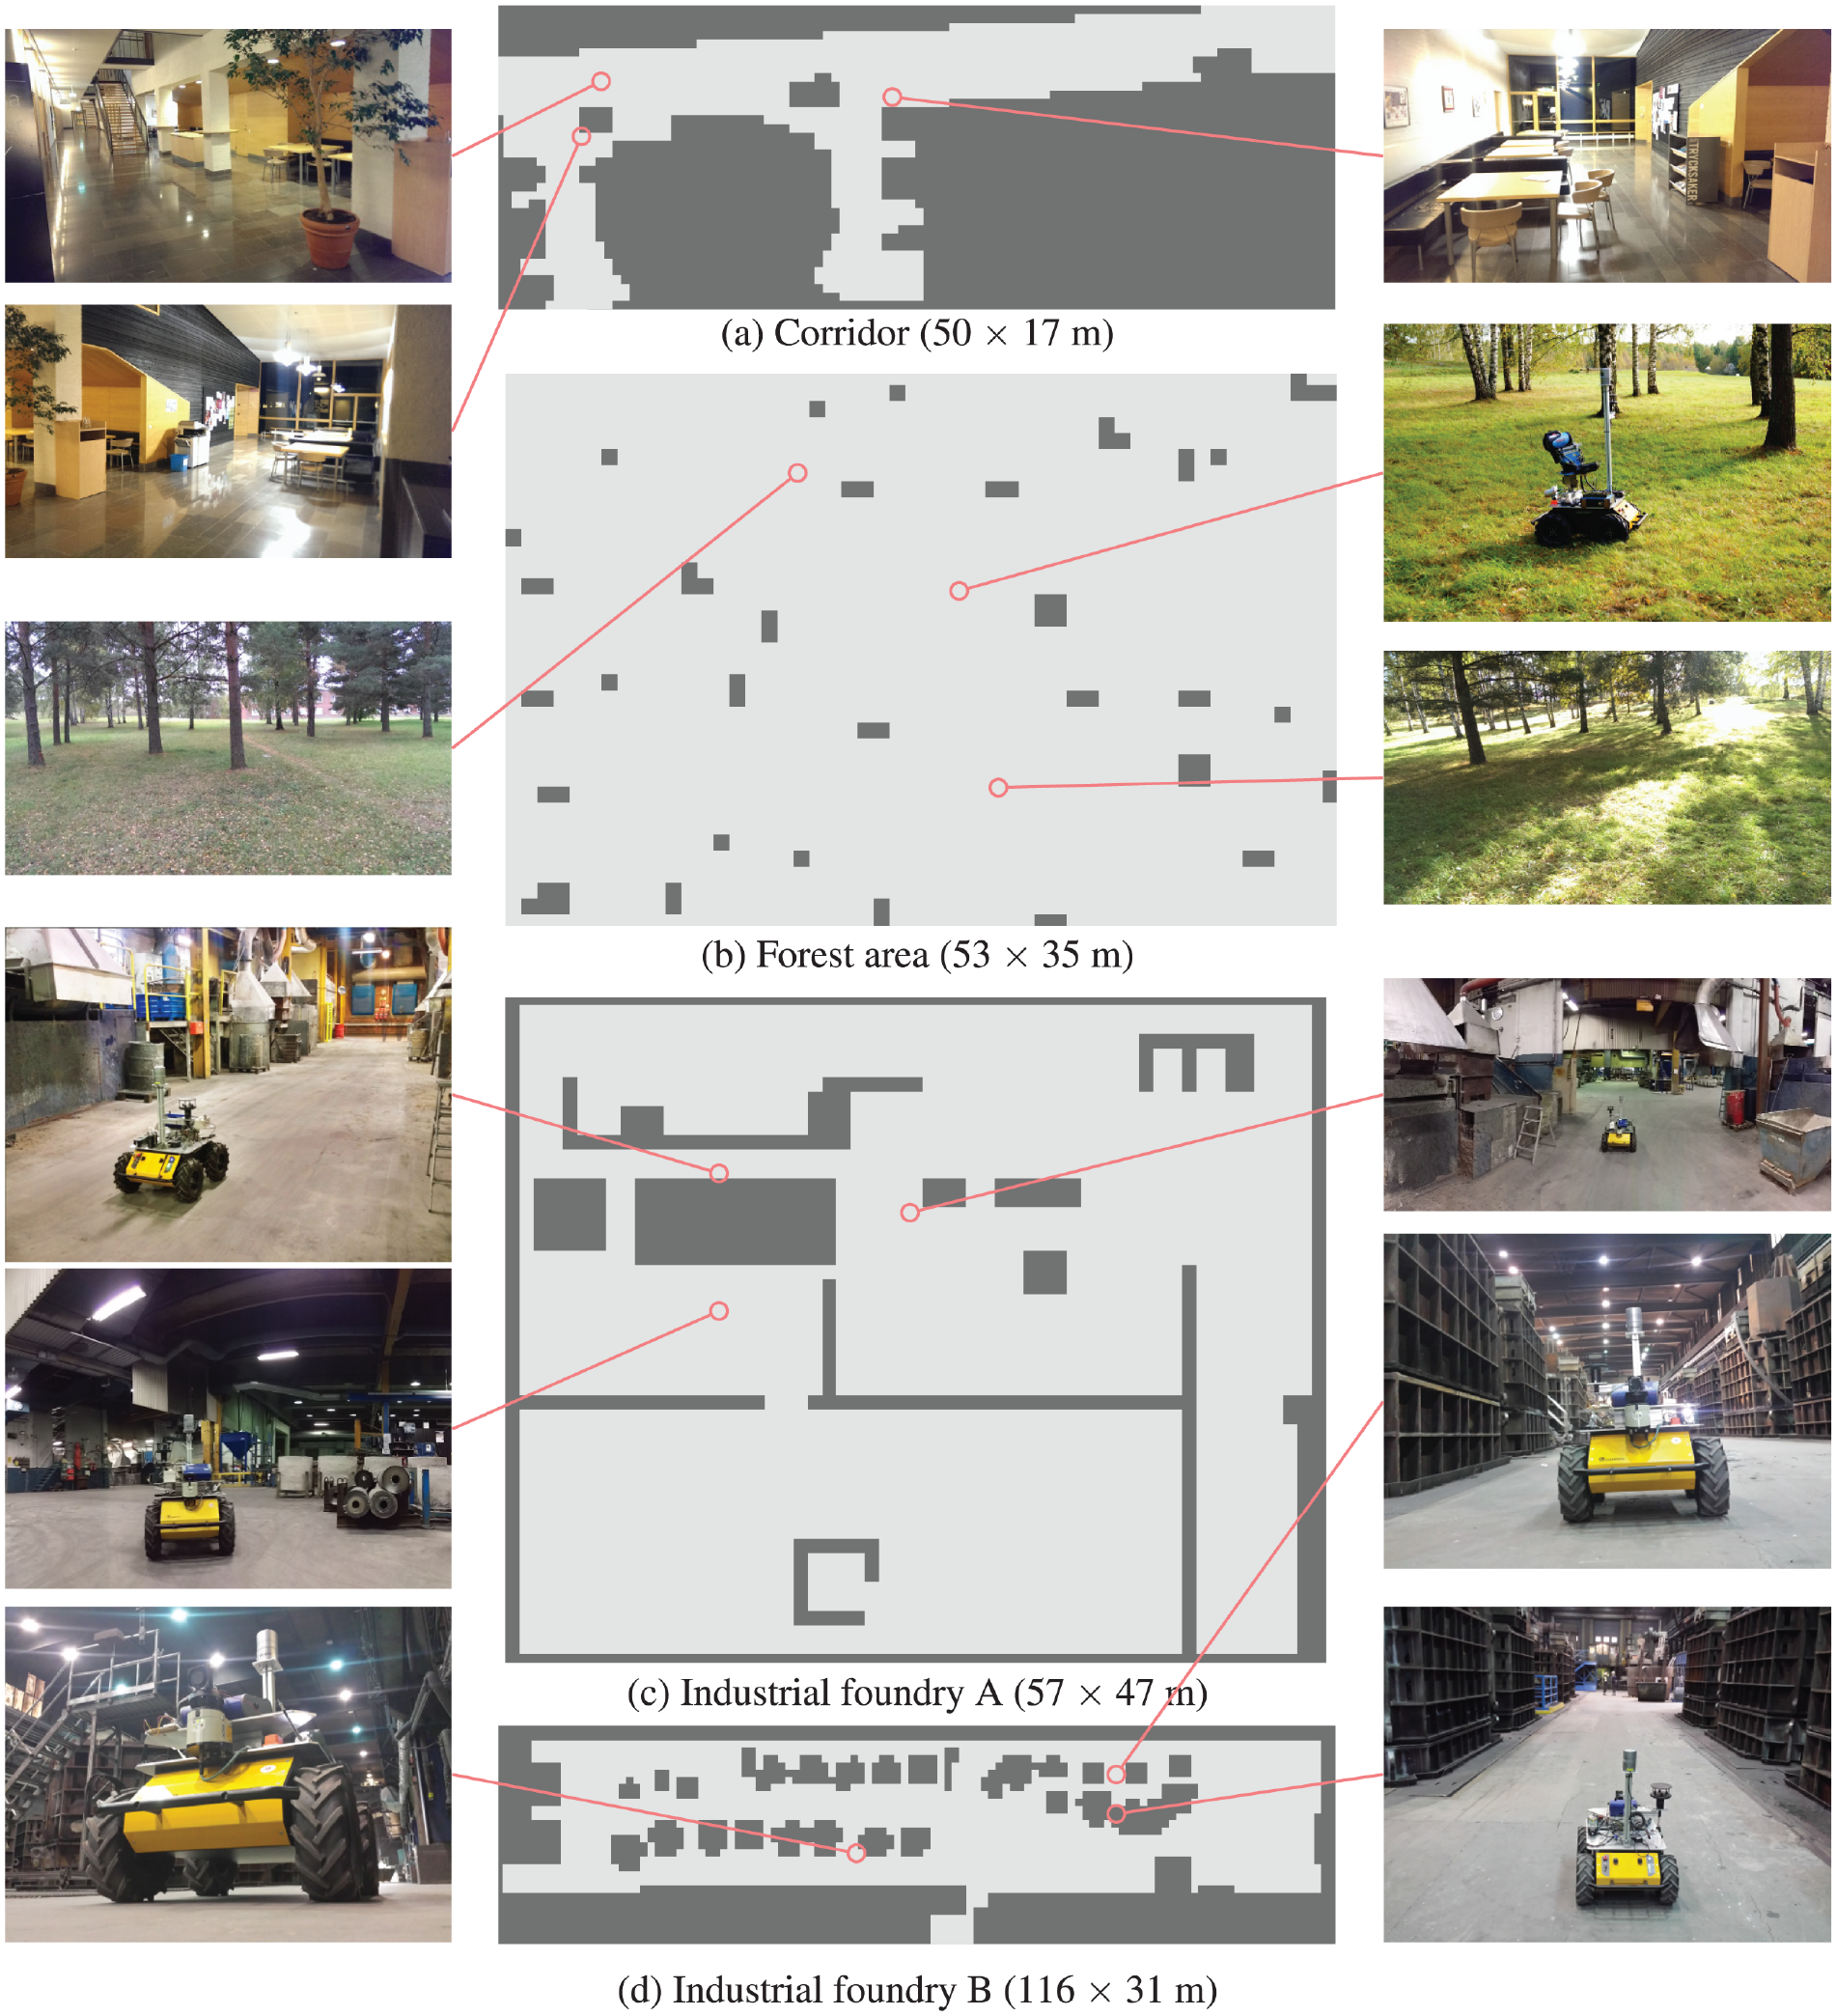
The left and the right column show target real-world environments, in which we previously conducted different mobile robot olfaction experiments. In this article, the geometric maps created in the previous work are used in a simulation for the selection of the optimal values of the parameters
4.3. Inspection mission strategies
The sensor planning algorithms for gas inspection tasks generate individual measurement plans for gas detection and gas distribution mapping. In particular, for a mission in large environments, both inspection tasks need to be performed efficiently as a whole. Thus, we need strategies that decide when to perform each task to complete the inspection mission most efficiently.
We define a mission strategy as a decision-making strategy for measurement collection. We consider specifically the combined inspection tasks of gas detection and gas distribution in a gas inspection mission.
To carry out an autonomous inspection in large environments, we compare two mission strategies: (1) collect measurements in two subsequent robotic tours, one for gas detection and the other for gas distribution mapping (
Block diagram of our one-tour mission strategy
4.3.1. One-tour inspection mission strategy
The overall procedure of
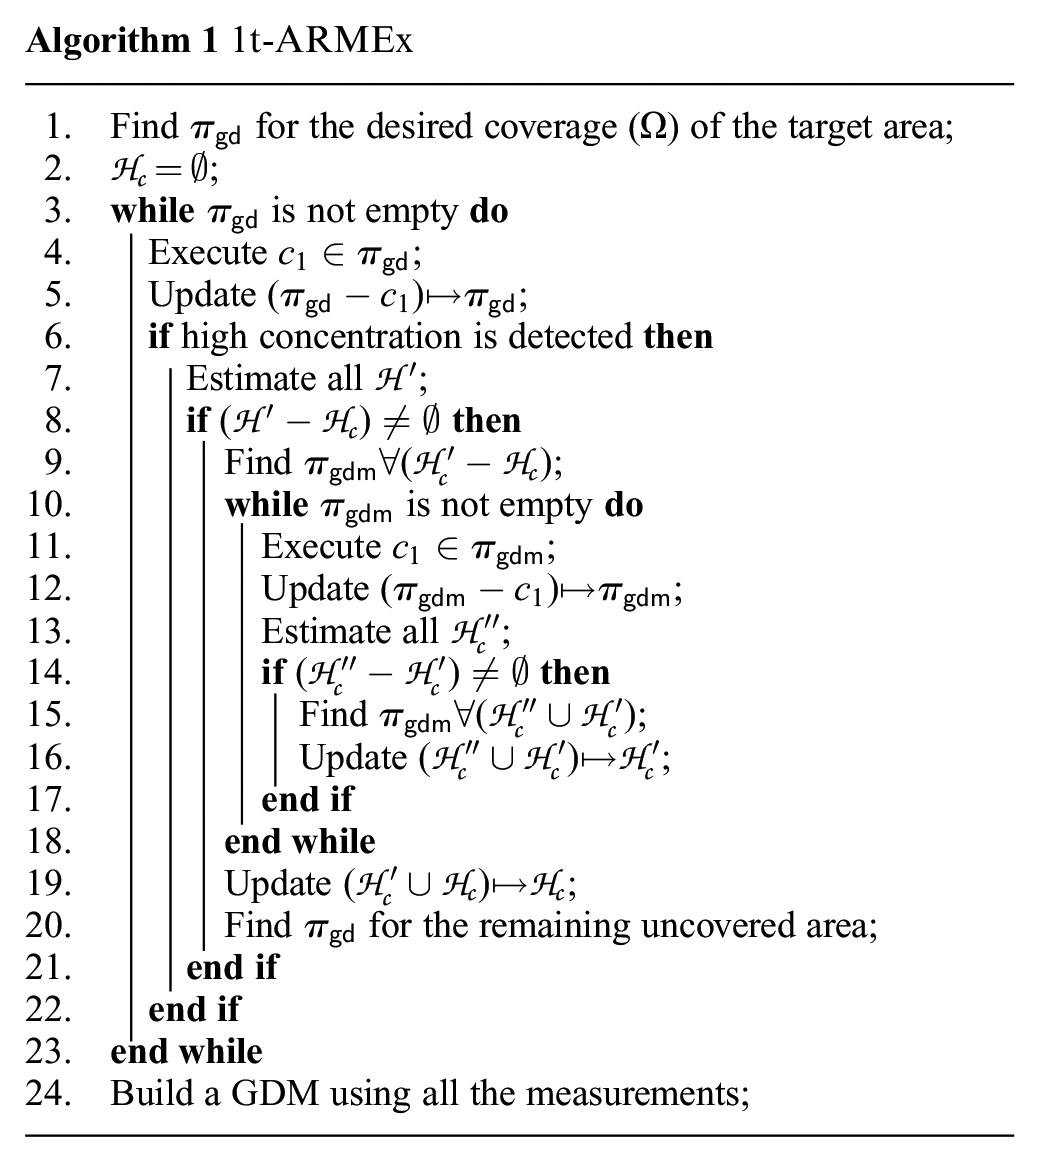
In situations where the speed of execution is very important, setting the value of
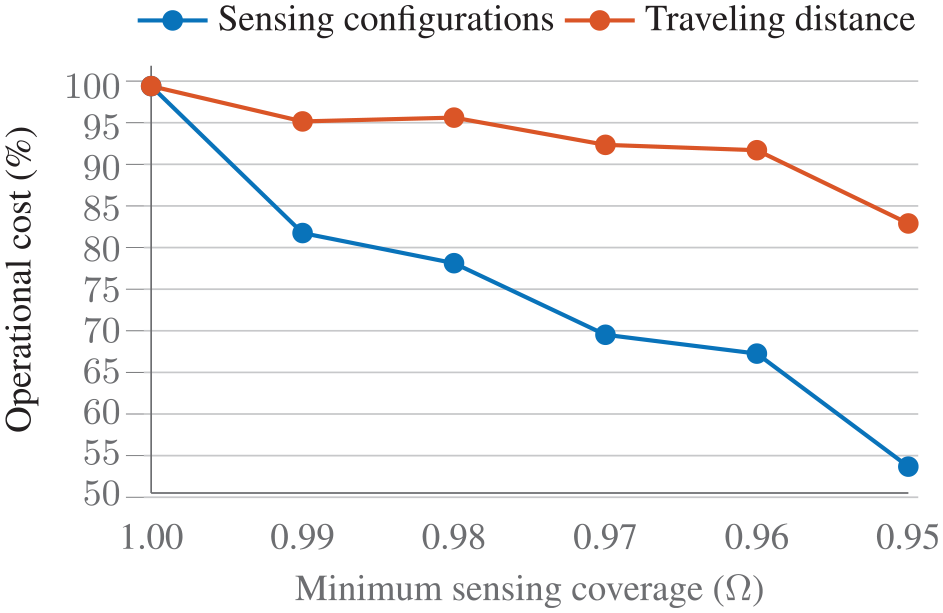
Simulation evaluation for the parameter of minimum desired sensing coverage (
The risk of missing a gas source is proportional to (
The gas detection plan for
The main loop of the algorithm is to update and execute the measurement plans based on the magnitude of detected integral concentration and the estimated hotspots. Line 4 in Algorithm 1 is to execute the first configuration in
5. Experimental evaluation
We designed an experimental setup to address the second research question by comparing the autonomy of
5.1. Robotic platform
Our prototype implementation of
5.2. Environment and geometric map
We conducted experiments in a large indoor environment of about
5.3. Gas sources
The
A gas column of about 1 m height and 0.1 m width was built using three bottles (Figure 21). In the experiments, 25 gas columns were used to construct 8 different gas sources: 3 columns in each of the 7 gas sources and 4 columns in one of the gas sources.
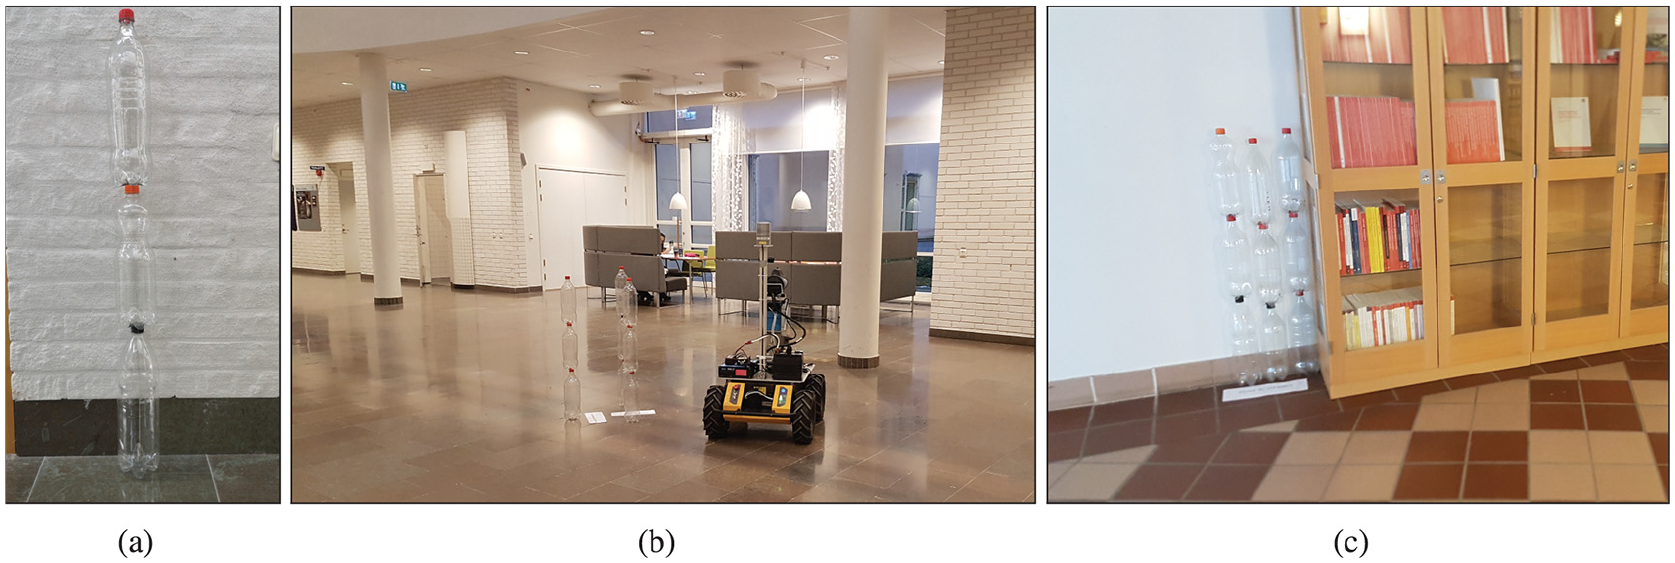
Gas sources for the experiments: (a) gas columns were built using transparent gas bottles filled with methane; (b) and (c) the gas sources used were made of three or four gas columns. They were placed at different locations in the environment.
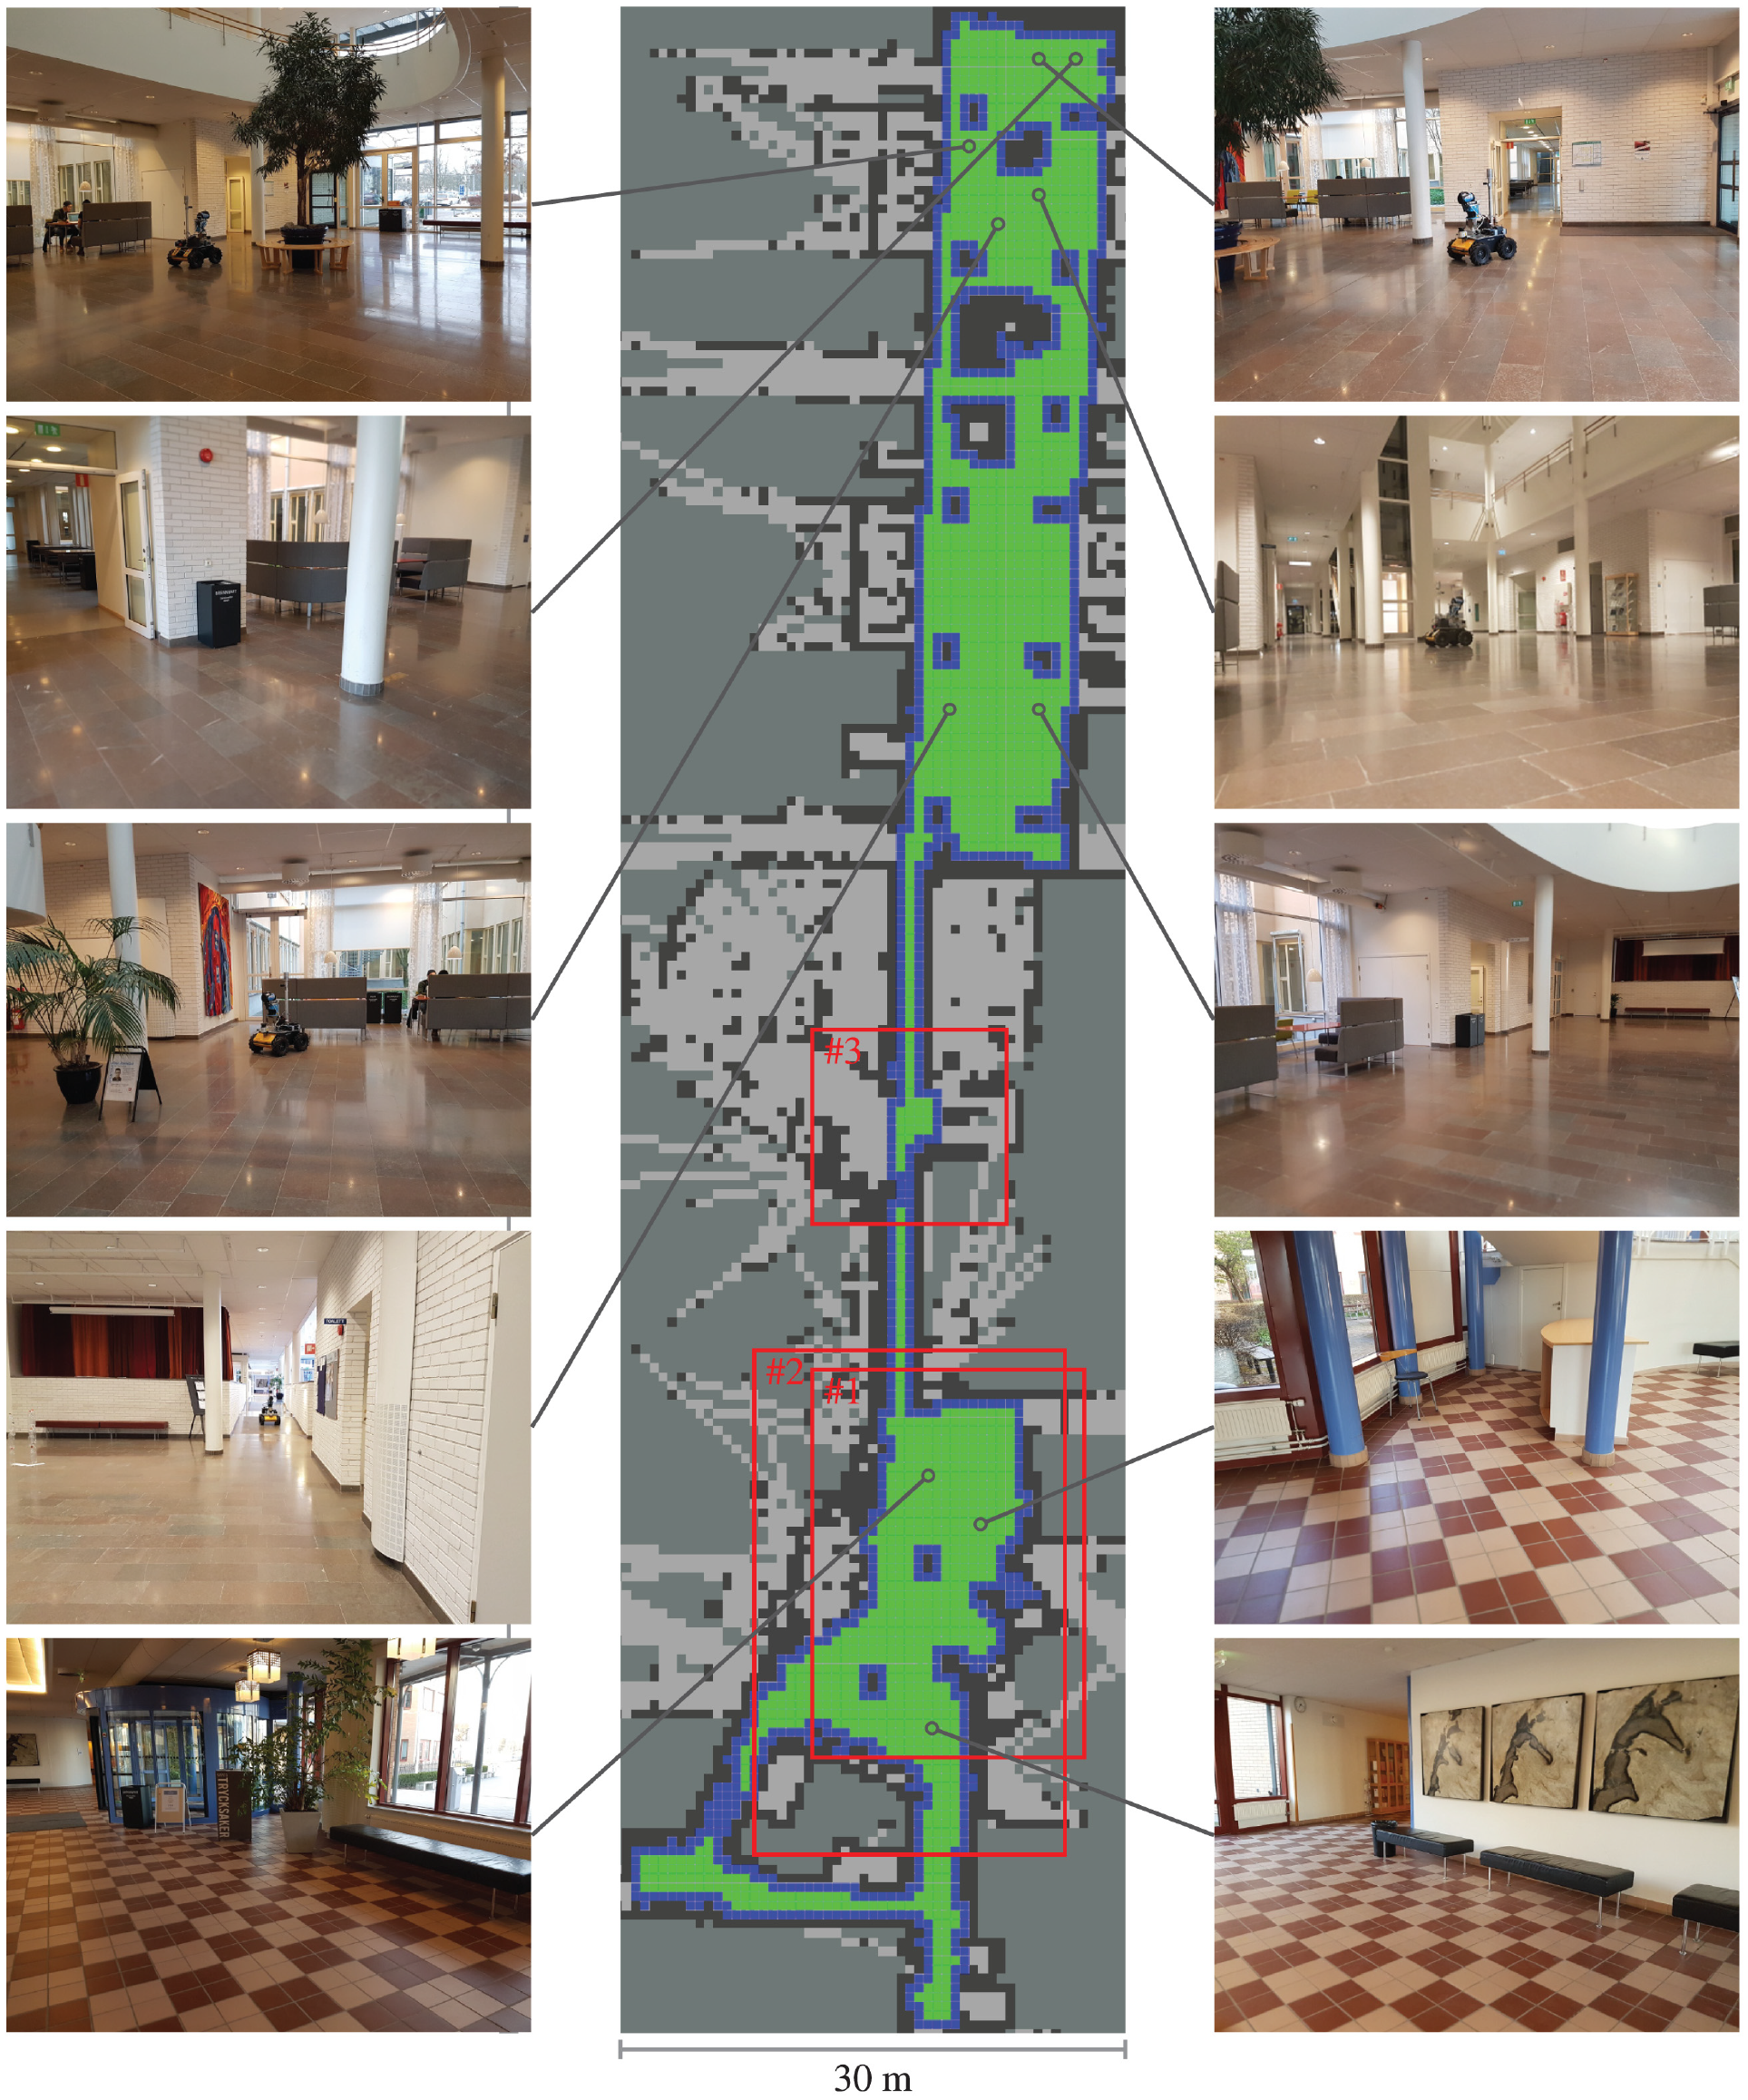
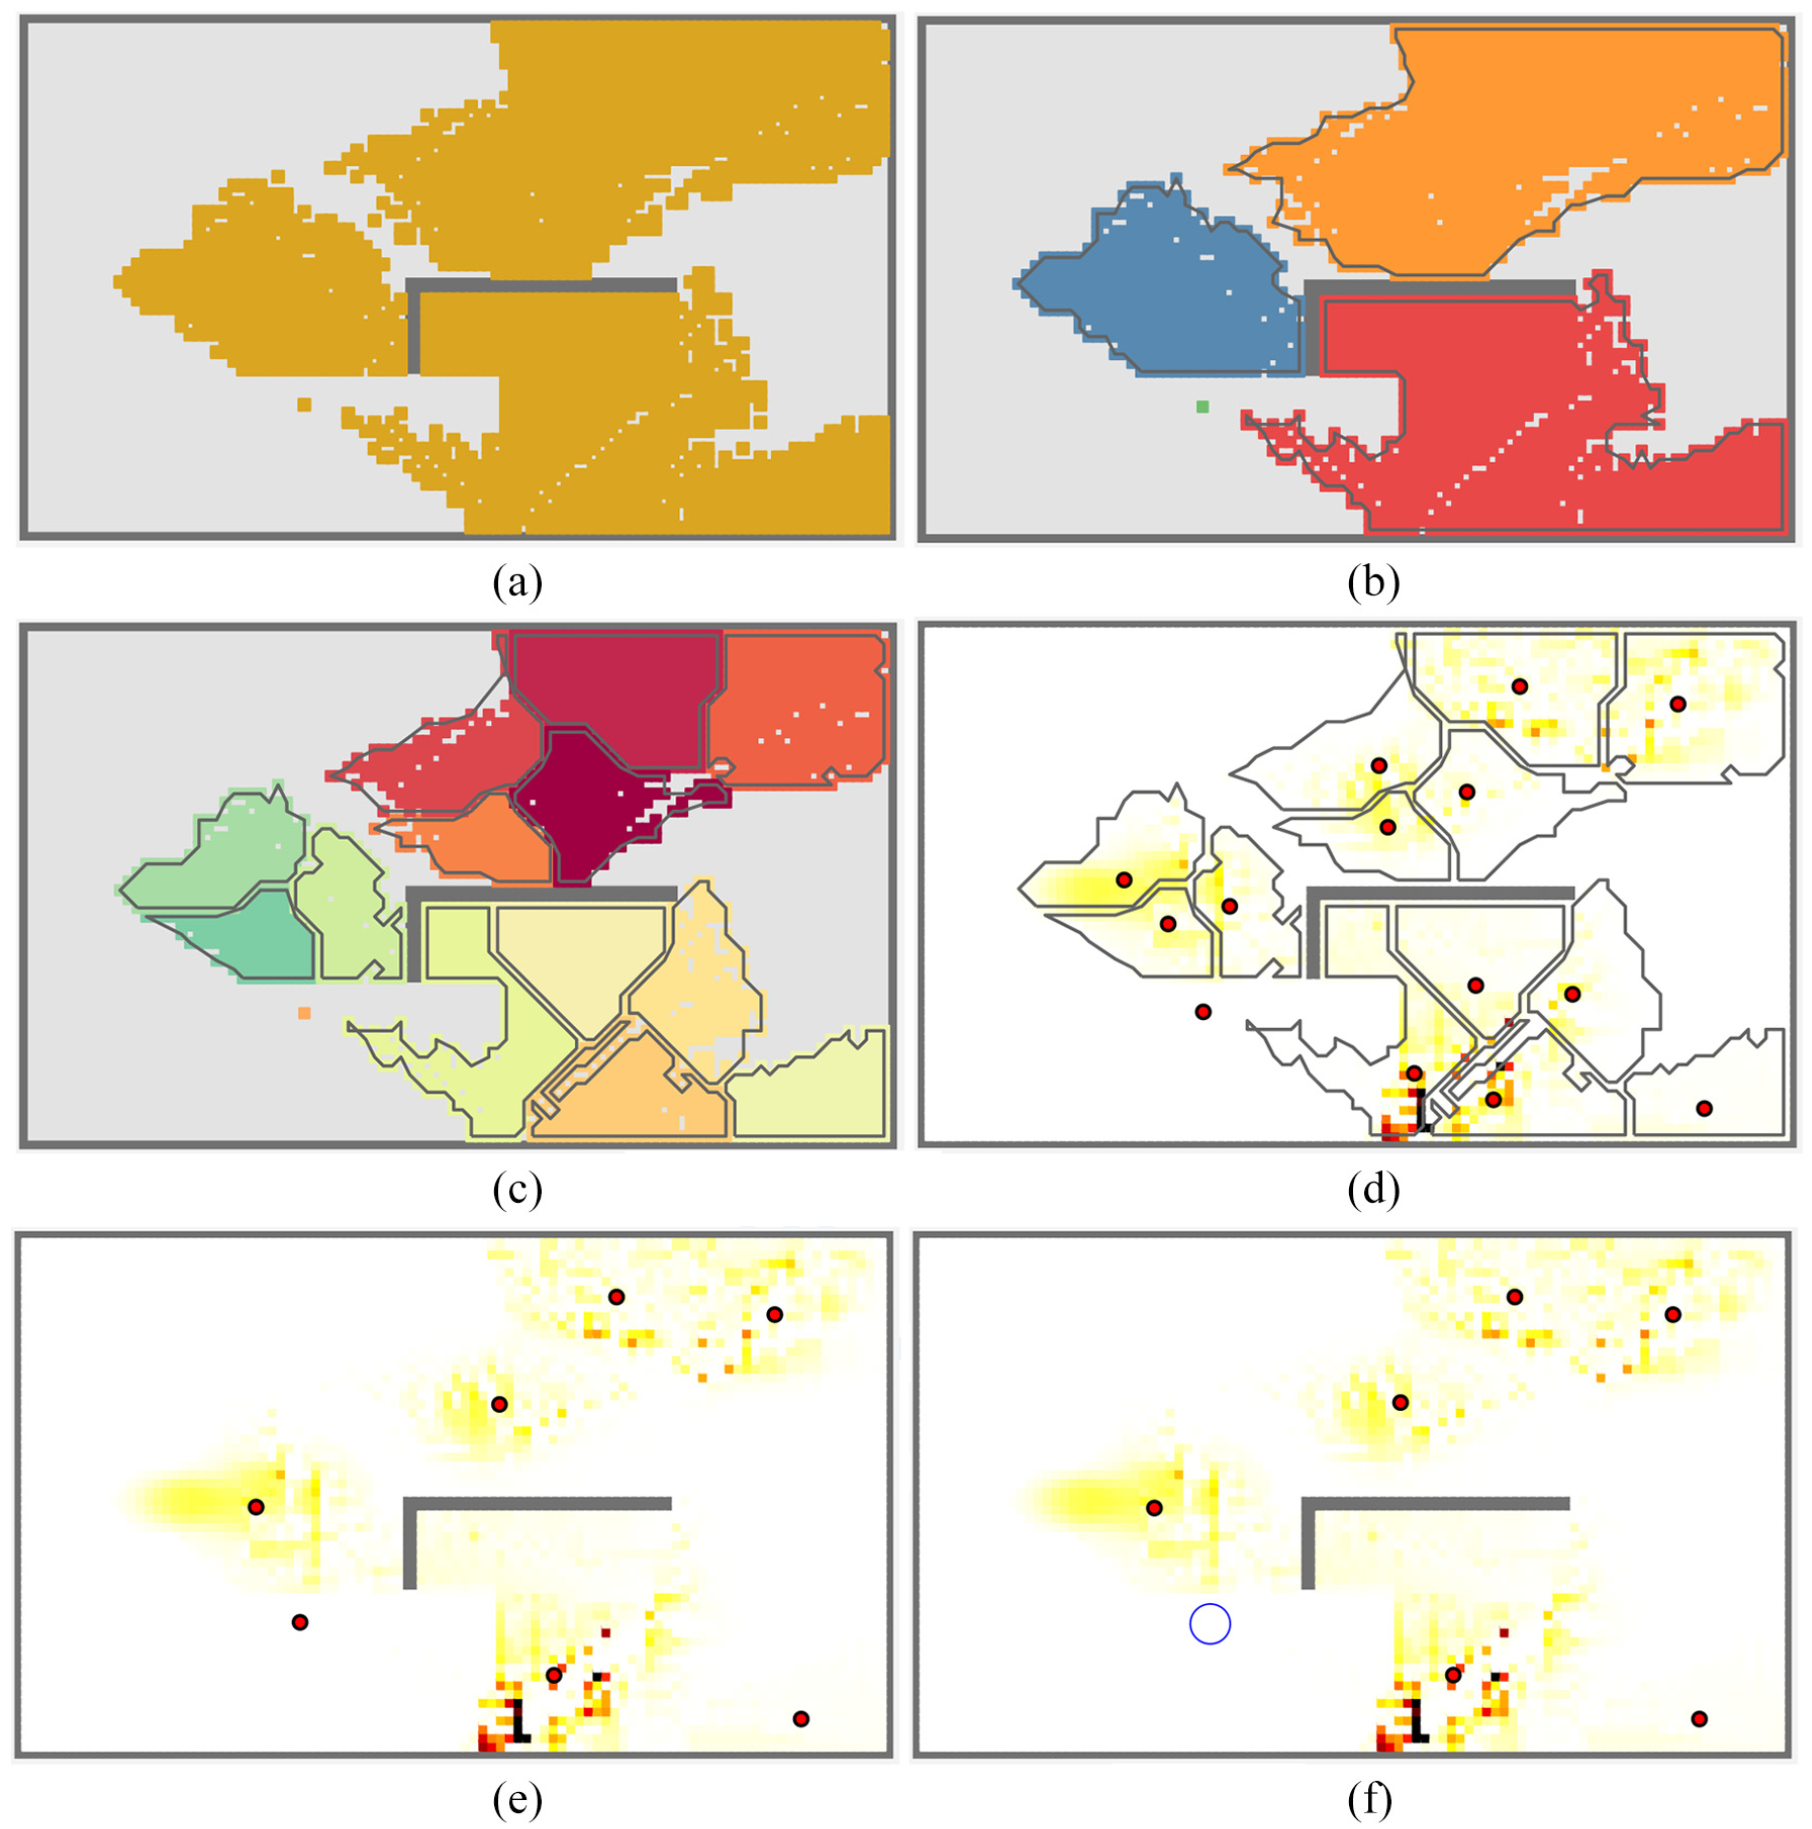
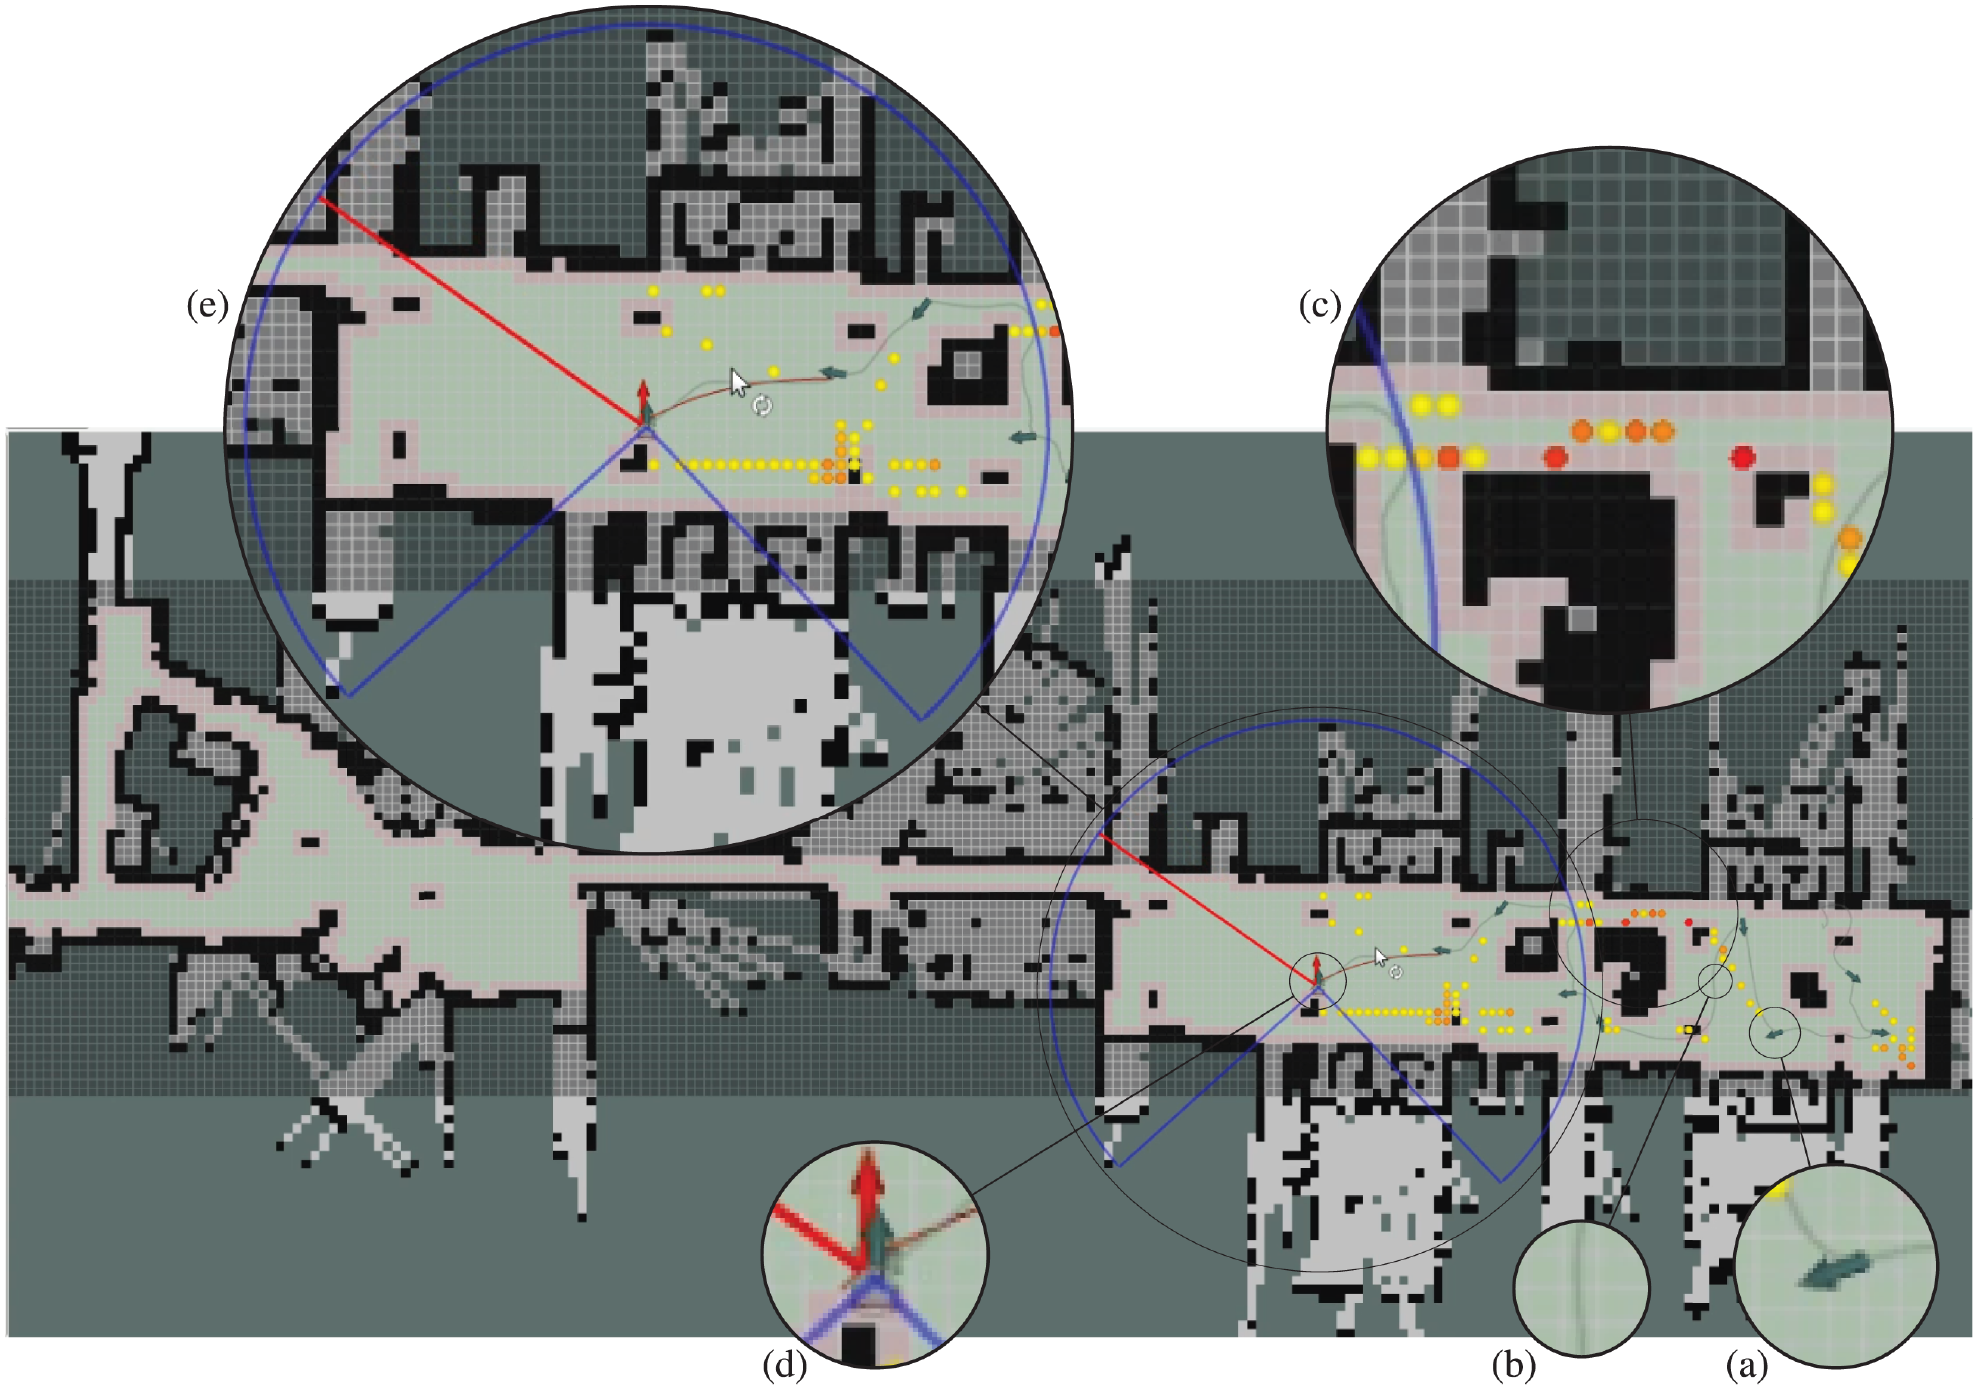
The experimental environment. The central column shows the environmental map, and the left and the right columns show views from different environment locations. A 0.5 m cell size Cartesian grid map is placed over the OGM. The area under the green and blue cells of the Cartesian map is for the gas inspection. The green cells are reachable by the robot and are considered as candidates for sensor placement. The blue cells are not reachable by the robot owing to its size and, therefore, are not permitted for sensor placement. Three particularly interesting areas are marked with rectangles and corresponding solutions are shown in Figure 29.
5.4. Experimental runs
We performed six experiments by placing gas sources at different locations in the environment. In each of the experiments, an autonomous mission was completed using our two mission strategies: (1) two-tour strategy in which gas detection and gas distribution mapping tasks are performed in two subsequent robotic tours, which we refer to
Four experts performed six experiments: two of them performed two experiments each, and two performed one experiment each. It is very difficult to carry out these experiments with a sufficiently large representation of human operators. We rather chose a highly biased group of participants who are expected to fare best on the inspection tasks. The selected human experts have a research background in the field of mobile robot olfaction. They were familiar with the mapping algorithm, the sensing principle, and even the adaptive sensor planning methods described in this article before they carried out the experiment. The results of the human experts are thus supposed to give an idea of the best performance that human operators are capable of.
5.5. User interface for human experts
The human experts were provided with a remote control station with a user interface to decide where the robot should perform measurements, see Figure 23. The interface displays the robot model localized in the environment map, including the actuated remote gas sensor. The expert can interactively select a goal pose for the desired sensing configuration based on the intermediate reconstruction map computed using all measurements collected so far. The sampling process is visualized by displaying the optical beams in the circular sector of the field of view. This cycle continues until the expert decides to terminate the gas inspection mission.
The user interface designed for operators to conduct the monitoring task. A snapshot taken during an experiment performed by one of the experts is shown. In the environment map, the sampling process started from the right side and progressed toward the left. Displayed are: (a) the robot poses of the executed configurations as gray arrows; (b) the path followed by the robot between the configurations as a gray line; (c) the reconstructed GDM as yellow-to-red bubbles of low-to-high concentrations; (d) the expert’s decided pose for the current configuration as a red arrow; (e) the circular sector (
In the experiments, the experts were provided with no prior information about the placement of gas sources. There was no camera picture available for the operators, the displayed maps on the interface was the only information to locate the gas sources. The control station connected through a wireless network was located outside the monitoring area to prevent the user from seeing the actual location of the gas columns.
5.6. Quantitative evaluation
All the mission strategies were evaluated quantitatively, using the following criteria: (1) the number of sensing configurations; (2) the total distance traveled by the robot; (3) the total sensing coverage; and (4) the reconstruction quality of the generated GDMs. The first two quantitative criteria are about the solution costs and the last two are about the generated solution quality.
5.6.1. Solution costs
The results for the first two criteria are shown in Figure 24. For the number of sensing configurations (Figure 24(a)), the one-tour strategy provided the most economical solutions. It used the least sensing configurations in five out of six experiments, and only in one experiment did it consume one configuration more than human experts. As expected, the two-tour strategy was the most expensive owing to executing independent robotic tours for gas detection and gas distribution mapping. The human experts used more configurations than the one-tour strategy to complete the inspection mission in three experiments. The average results of all the six experiments are summarized in Table 2, which indicates that, on average, the number of configurations selected by the two-tour strategy and human experts was 16.3 and 2.7 higher than the one-tour strategy. Thus, our one-tour adaptive mission strategy outperformed the two-tour and the human expert strategies in terms of solution cost for the number of sensing configurations.
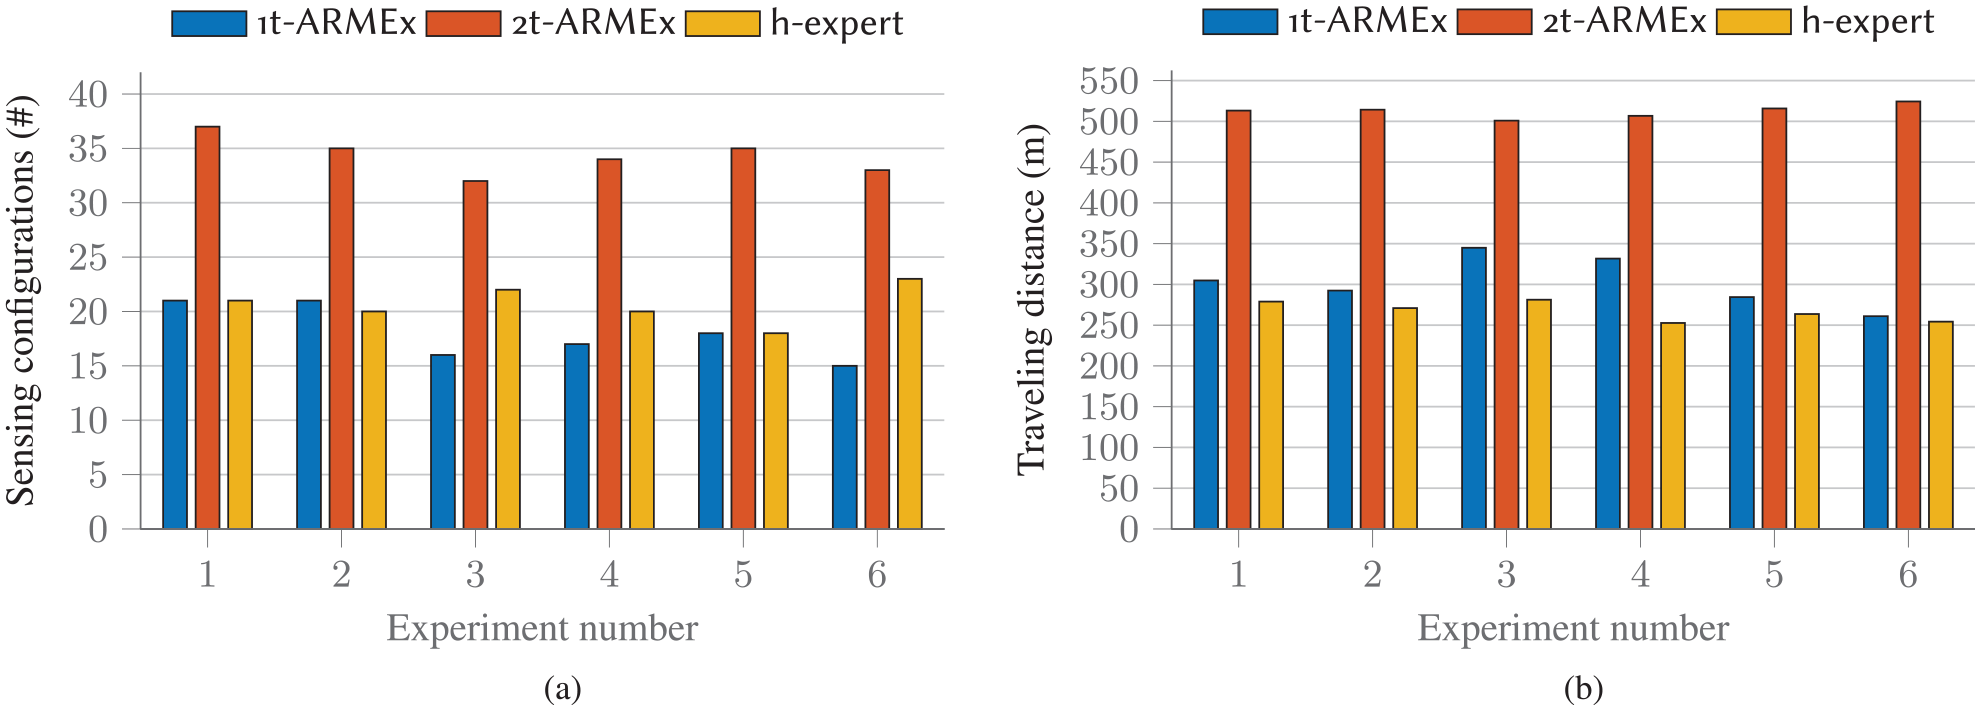
Solution costs for the experiments performed by the autonomous system using one-tour (
Quantitative comparison between the one-tour strategy (
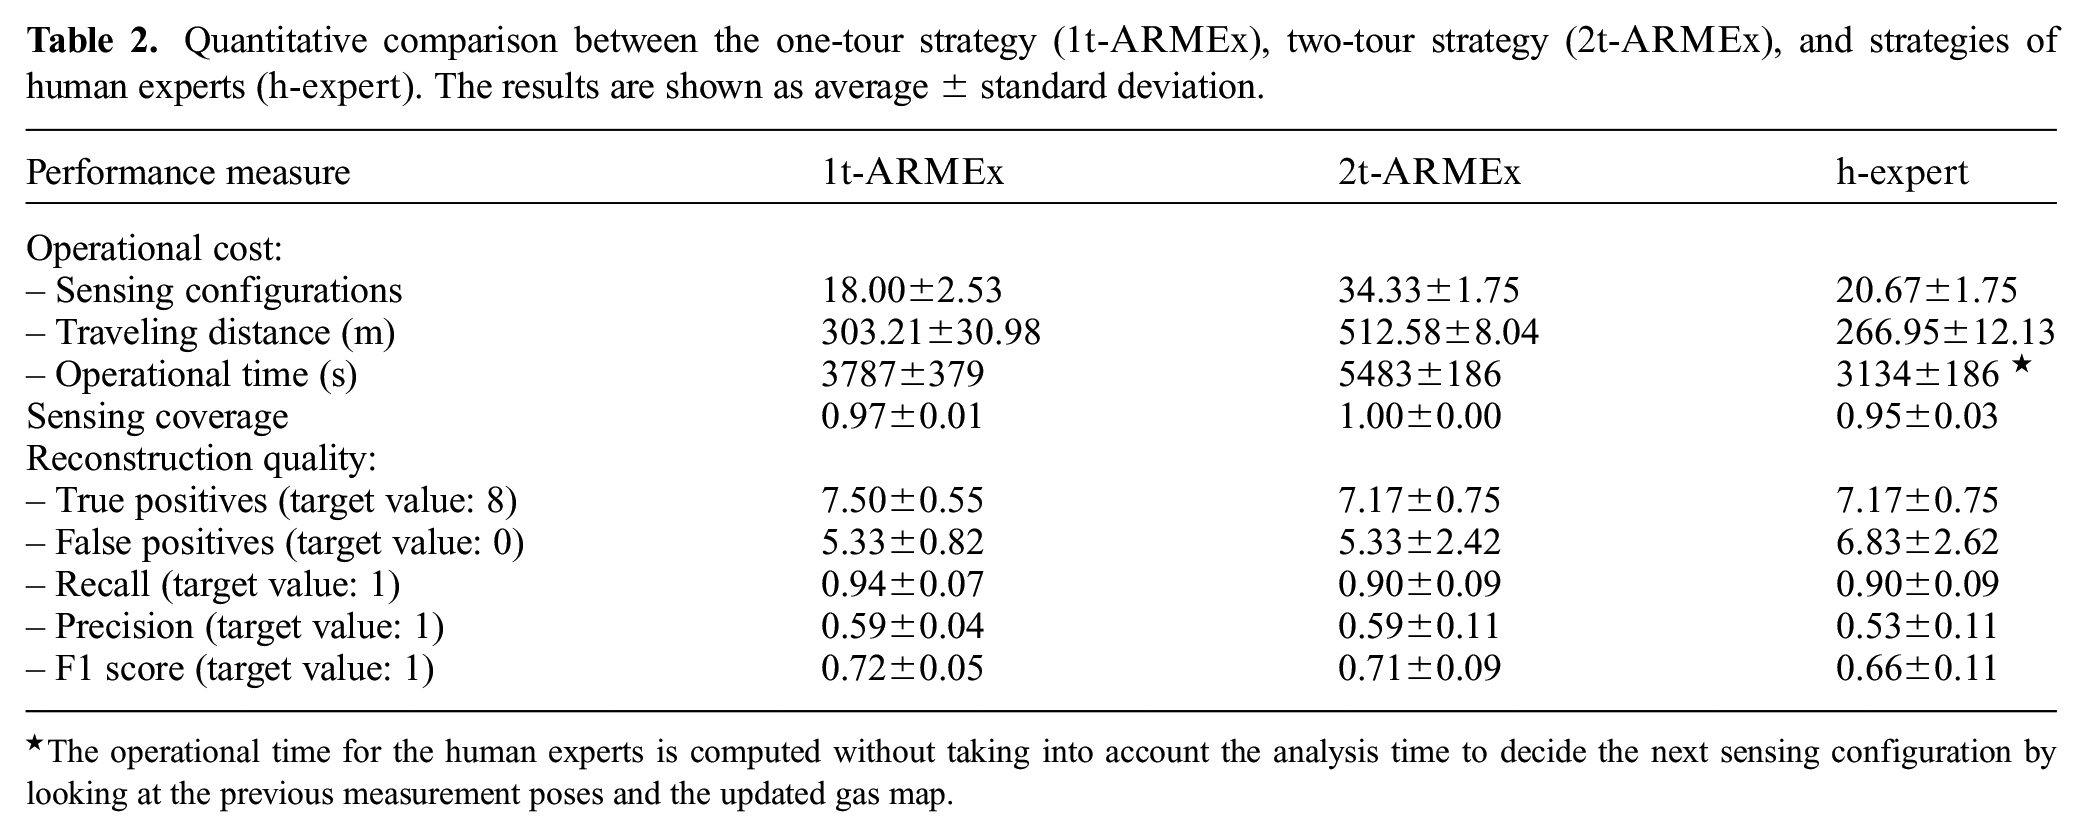
The operational time for the human experts is computed without taking into account the analysis time to decide the next sensing configuration by looking at the previous measurement poses and the updated gas map.
For the solution cost of traveling distance (Figure 24(b)), the two-tour was the most expensive strategy as, on average, the robot had to travel 512 m to visit the selected configurations for an experiment, compared with 303 m for the one-tour and 267 m for human experts. The two-tour was that expensive owing to the same reason as mentioned for the number of sensing configurations, i.e., two robotic tours are to be executed instead of one for the other two strategies. However, for the traveling distance, the one-tour strategy was slightly more expensive than the strategies of human experts.
The operational time for the autonomous strategies can be computed from the above information of the total number of selected configurations and 100 s sensing time of each configuration, and the total path distance traveled by the robot and a maximum speed of 0.25 m/s, as described earlier in Section 5.1. For the one-tour strategy, 18 selected configurations cost 1,800 s for sensing, and 303.21 m of path distance cost approximately 1,213 s for traveling. The average computation time to replan gas mapping each time a new hotspot is detected or for gas detection after an accurate gas tomography is performed in the area is approximately 774 s. This results in an average operation time of 3,787 s (about 1 hour and 3 minutes). Similarly, the average operational time for
For a simplistic theoretical comparison with an in situ sensor, we assume a Roomba-like robot that has to visit each grid cell of the map without any requirement of necessary pause to collect gas samples (in reality an in situ sensor would require tens of seconds for response and recovery time, for example, a metal-oxide sensor). We computed the total path distance of 3,212 m by solving a TSP. This would require about 12,848 s (about 3 hours and 34 minutes) of operational time. Thus, a gas inspection performed with remote gas sensing using the one-tour strategy is about three times as fast and using the two-tour strategy is about twice as fast as in situ sensing.
5.6.2. Solution quality
For the solution quality of total sensing coverage (Figure 25), the gas detection tours of the two-tour strategy were planned for 100% sensing coverage. The minimum desired coverage for the one-tour strategy was set to 95%, and the human experts were not explicitly instructed to cover the whole area, but to create an accurate gas map to locate the gas sources. On average, the sensing coverage provided by one-tour, two-tour, and human expert was 97%, 100%, and 95% of full coverage. It is worth noting that the one-tour strategy selects the least configurations and provides higher sensing coverage than the strategy of human experts. Thus, it can be concluded that the one-tour strategy selects better sensor placement than that of human experts.
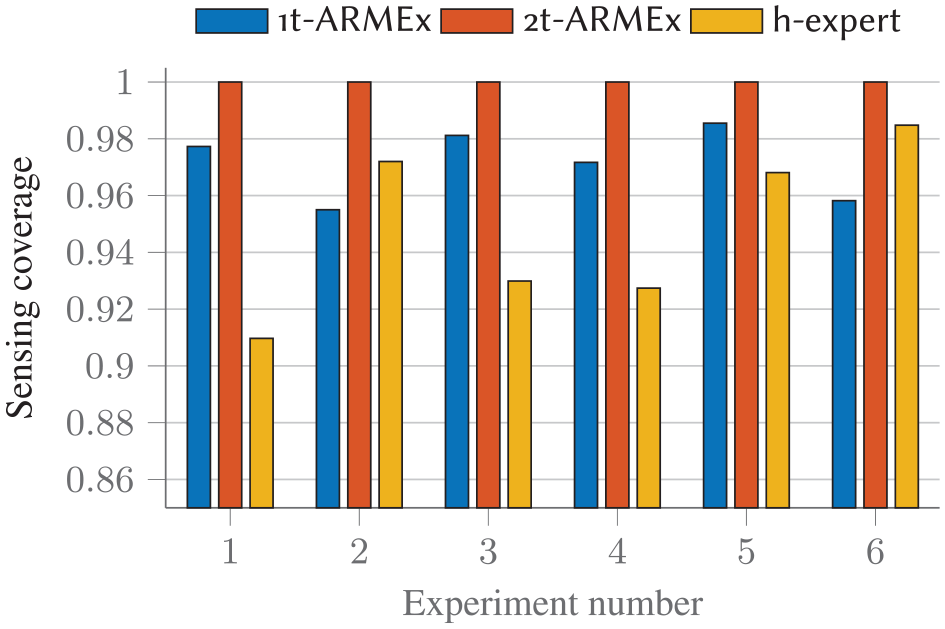
Sensing coverage achieved with the autonomous system using one-tour
The reconstruction quality of different experimental runs is evaluated on account of a comparison between the estimated gas sources from the maps and the true gas sources placed in the field. In freely escaping gas, the highest concentrations are not always at the source locations, for example, due to accumulation effects. In that case, the variance map of gas distributions often provides better estimates of the source locations (Hernandez Bennetts et al., 2014). In this article, we use mean GDMs owing to contained gas sources. The variance map does not produce much information because only a small variance can be expected around the sources, compared with high mean concentrations at the source locations. Therefore, we use the mean gas maps with the estimated hotspots at the high-concentration peaks to source locations.
The gas sources are estimated in a similar fashion as the hotspots in Section 4. Among the estimated gas sources, we find true positives that correctly indicate gas sources and false positives that incorrectly indicate gas sources. The gas tomography reconstruction could well result in multiple gas patches around the source locations. We consider all the estimated peaks within 3 m obstacle-free distance as a true positive, and the rest of the estimations are false positives. Figure 26(a) shows one of the reconstruction maps with true and false positives as well as the locations of true gas sources.
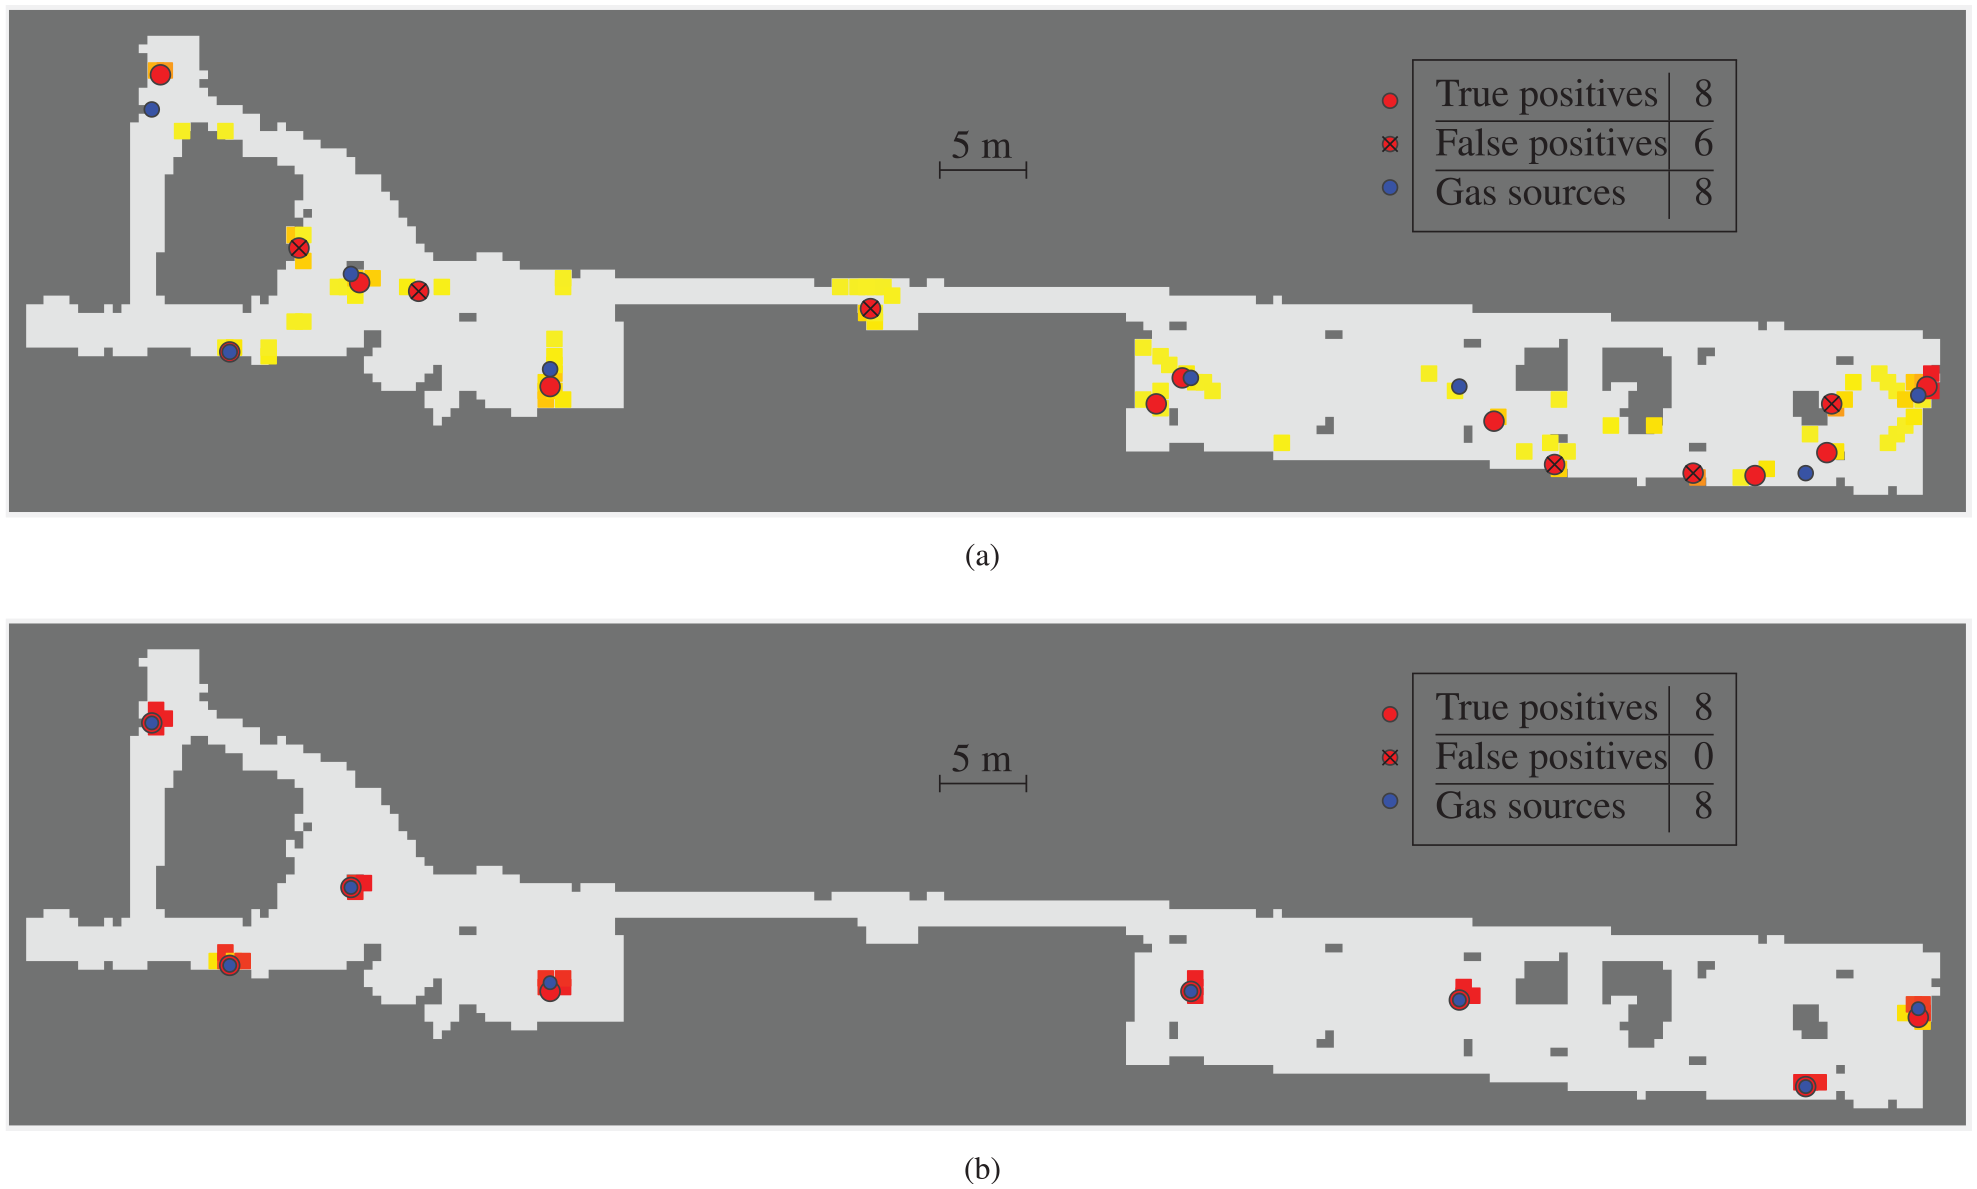
A selected gas distribution reconstruction from our experiments. True and false gas source estimates and actual source locations are shown. (a) A real-world experimental result where all the sources are located. A high number of false positives are also reported. (b) The corresponding simulation result for the real-world experiment where all the gas sources are estimated with zero false positives.
To measure the performances of different strategies for the estimation of gas sources, precision and recall are computed. Precision is the proportion of true positives of gas sources among true and false positives, and recall is the proportion of true positives among all the gas sources (Lewis, 1991). To combine both measures, we used the F1 score (Chinchor, 1992).
Figure 27 shows the number of true and false positives, precision, recall, and the F1 score for all the experiments, and the average results along with standard deviation are provided in Table 2. The target values in Figure 27 are: 8 in Figure 27(a), 0 in Figure 27(b), and 1 in Figure 27(c)-(e). The one-tour adaptive strategy has consistently performed better than the other strategies as it has the smallest standard deviation and the highest F1 score.
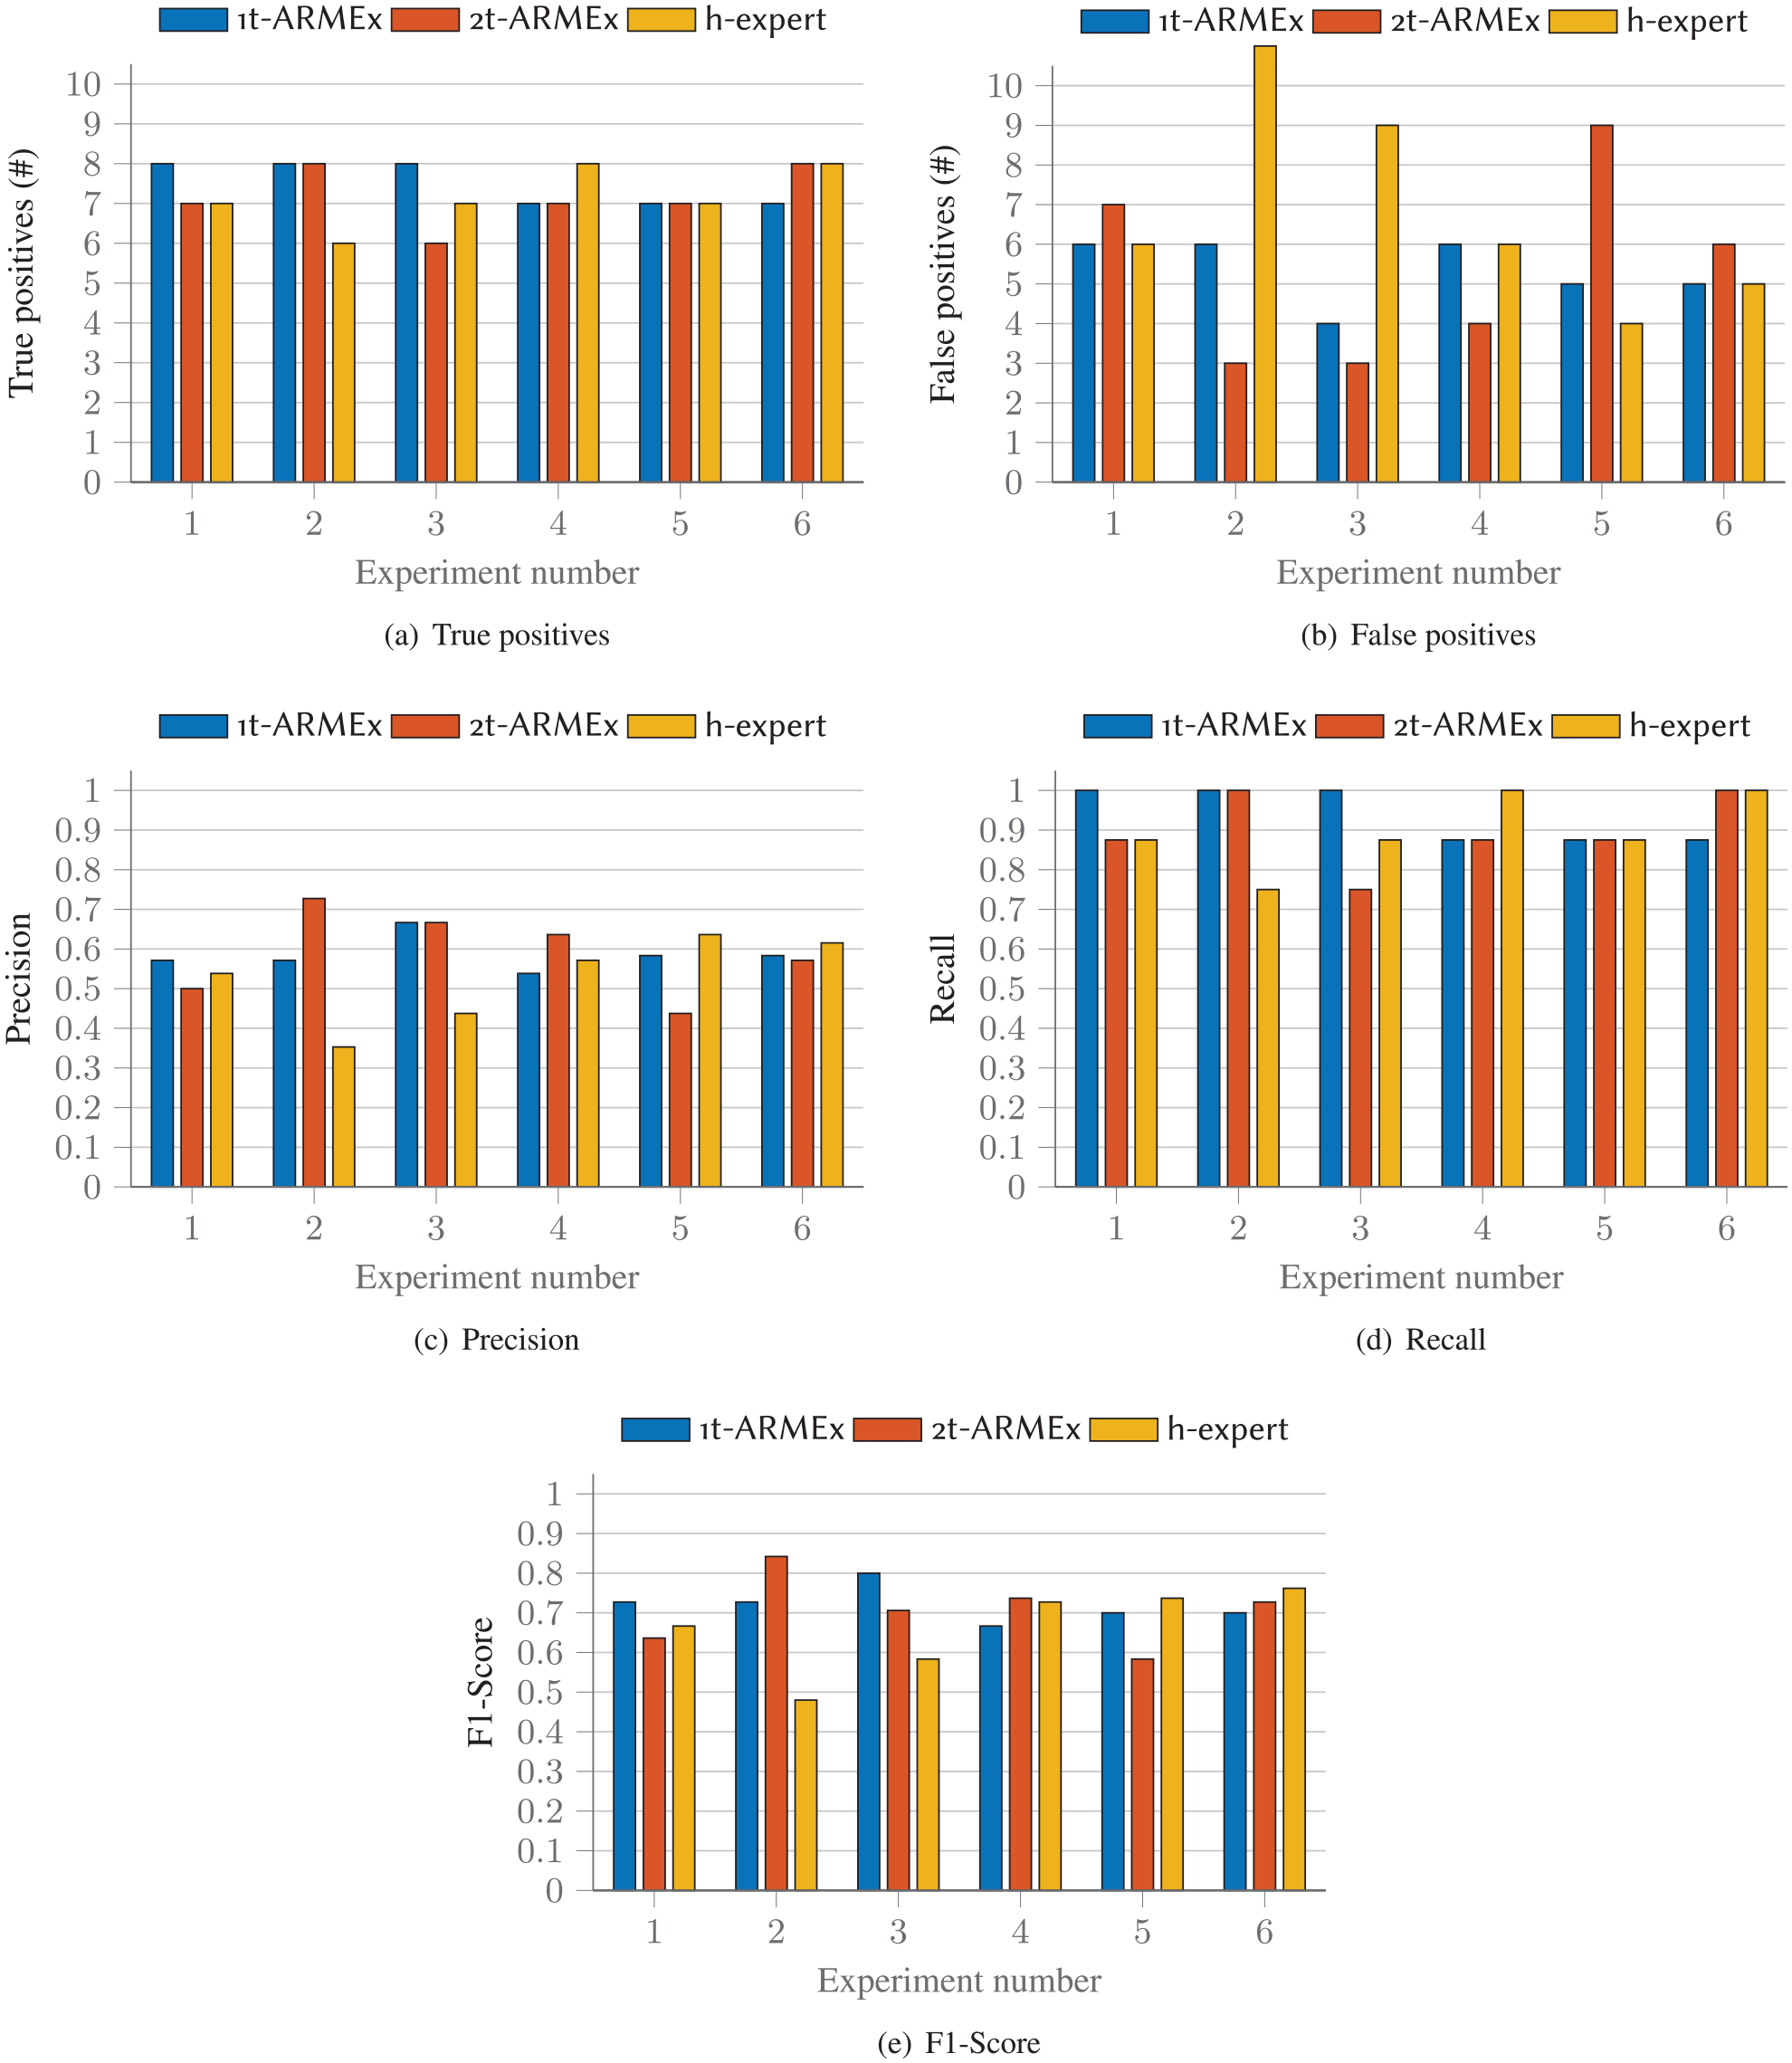
The reconstruction quality of each experiment. The results are presented as true positives, false positives, precision, recall, and F1 score. The experiments were performed by the autonomous system using one-tour (
5.7. Shortcomings and limitations
It should be noted that in all the experiments, the gas sources are estimated with a high number of false positives. This happened since the resultant GDMs contained disjoint high-concentration patches around the gas sources. These misclassifications are the result of different issues that can occur at the same time: (1) robot localization errors; (2) an inaccurate calculation of the length of the sensor beams; (3) imprecisions in the reconstruction algorithm; (4) non-uniform gas distributions in the gas columns can lead to inaccurate reconstructions when the optical beam is hitting neck of the bottle; (5) faulty readings because the beams are not properly reflected owing to the shape and material of the reflective surface; (6) waste bins located in the field sometimes also report gas concentration. The first three issues are system-related problems, and the last three occur owing to the realistic experimental conditions.
Robot localization errors propagate into inaccurate localization of the projected beams, and thus the resultant reconstruction quality is compromised. As the remote gas sensor can report only the integral concentration and cannot estimate the beam length, we compute the beam length by using the sensor pose and casting a ray on a 0.05 m cell size geometric map of the environment. However, even small localization errors can introduce high inaccuracies in the computation of beam lengths, especially when they are close to edges or non-perpendicular surfaces. In some of the areas, localization error of more than a meter was noted, although this was only a few times.
Moreover, the 2D geometric map used to compute the beam length is an approximate representation of the environment. When creating the OGM, the occupied space in 2 m height is directly projected to the ground. As the experiment environment contains stairs and plants, an optical beam can reach a gas source that is occluded on the map. This will result in an inaccurate estimation of the beam length.
Another system-related issue was the reconstruction algorithm itself. The algorithm is formulated as least-square optimization that decomposes the integral gas measurements into a grid map. Grid cells on the edge of the field of view of a sensing configuration that are crossed by a single, short beam segment might generate a high-concentration estimate that counts a false positive, see Figure 28.
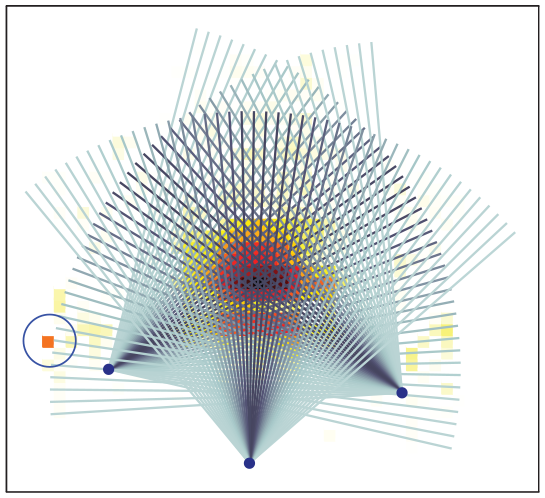
Projected optical beams to collect integral measurements are shown over the reconstructed GDM in Figure 7(c). The reconstruction algorithm (Hernandez Bennetts et al., 2014) has closely decomposed the integral measurements among the grid cells covered by the sensing configurations. However, the algorithm has estimated a high concentration in a cell on the edge of the field of view, crossed by a single, short beam segment. This can lead to a false positive when localizing the gas source.
To verify that the real-world issues mentioned previously have a significant influence on the results, we conducted simulation experiments in the same environment using the same layouts of gas sources. In the simulation, all gas sources were correctly located with zero false positives. The estimated gas sources in a simulation experiment corresponding to the real-world experiment in Figure 26(a) is shown in Figure 26(b).
In our experiments, the proposed system is not evaluated with freely discharging gas. We use a tomographic reconstruction algorithm (Hernandez Bennetts et al., 2014) that aims to capture the statistical properties of gas distributions. The least-squares algorithm decomposes the collected integral measurements by estimating the mean and variance of the gas distribution in a grid. The measurements for the algorithm are assumed to be generated by a stationary random process. As long as this assumption holds and there are sufficiently many informative samples available, this process should be captured by the reconstruction algorithm. In our previous work, we have demonstrated gas distribution mapping with our gas tomography algorithm with contained methane sources (Arain et al., 2016) as well as freely discharging methane sources (Hernandez Bennetts et al., 2014). As long as the reconstruction algorithm can capture gas distributions of freely discharging gas, the sensor planning will also work. Other than for safety reasons, we chose contained gas sources for our evaluation in order to have ground-truth information to evaluate the map quality. We chose a complex indoor environment instead of an outdoor area because it poses more challenges to select suitable sampling configurations if the robot cannot just go to the optimal configurations like in an open environment.
5.8. Qualitative evaluation
Now we assess the selected configurations qualitatively. As the sensor placement for gas distribution mapping depends upon the estimated hotspots, the two-tour strategy has a distinct advantage of using prior global information in the form of a coarse gas map, created after the full sensing coverage is provided. Thus, hotspot estimates tend to be better, especially in a static environment where the confined gas sources are placed at fixed locations. In contrast, the one-tour strategy can use only local coarse maps to compute measurement plans for gas distribution mapping. These coarse maps are created after each step during the inspection. However, the one-tour strategy (and also human experts) can adopt changes in the environment as the next sensing configuration is selected based on the previous reconstructions.
The human experts found it difficult to select optimal sensing configurations, as, in general, they seem to look for less-complex paths and did not find some sophisticated sensor placements that could have provided better coverage. On the other hand, configurations selected by the one-tour strategy provide better cross angles and sensing coverage, which are the key factors in the reconstruction quality.
Among the experts, the balance between exploration and exploitation was one of the main differences. For example, two experts used 20 configurations in 2 different experiments, resulting in a sensing coverage of 0.97 and 0.93, to successfully localize 6 and 8 gas sources. This means, Expert 1(a) explored more areas for gas detection, and Expert 2(a) better mapped the high-concentration areas to locate the gas sources. In the other two experiments, Expert 1(b) used 18 and Expert 2(b) used 23 configurations for nearly the same sensing coverage. They localized 7 and 8 gas sources, which means Expert 2(b) used 5 additional configurations for gas mapping. The experts who did two experiments utilized 1 and 2 fewer configurations in their second experiments; however, the reconstruction quality for Expert 1(c) was improved, and for Expert 2(c) it was decreased. They did their second experiment without the evaluation of their first experiment.
A comparison of the solution quality in the highlighted areas in Figure 22 is shown in Figure 29. Figure 29(a) and (b) is an example where the expert places a relatively high number of configurations, and Figure 29(c) and (d) is an example where the plan of the human expert does not have sufficient overlapping sensing coverage. This comparison indicates that it is difficult for a human to be consistent and decide the optimal sensor placement based on multiple factors. In another case, when the robot was placed close to an obstacle, and a gas source was detected between the robot and the obstacle, the human expert decided only a single sensor placement and did not choose an unnecessary additional configuration to obtain nearly the same reconstruction quality. On the other hand, the one-tour strategy selected two configurations (Figure 29(e) and (f)).
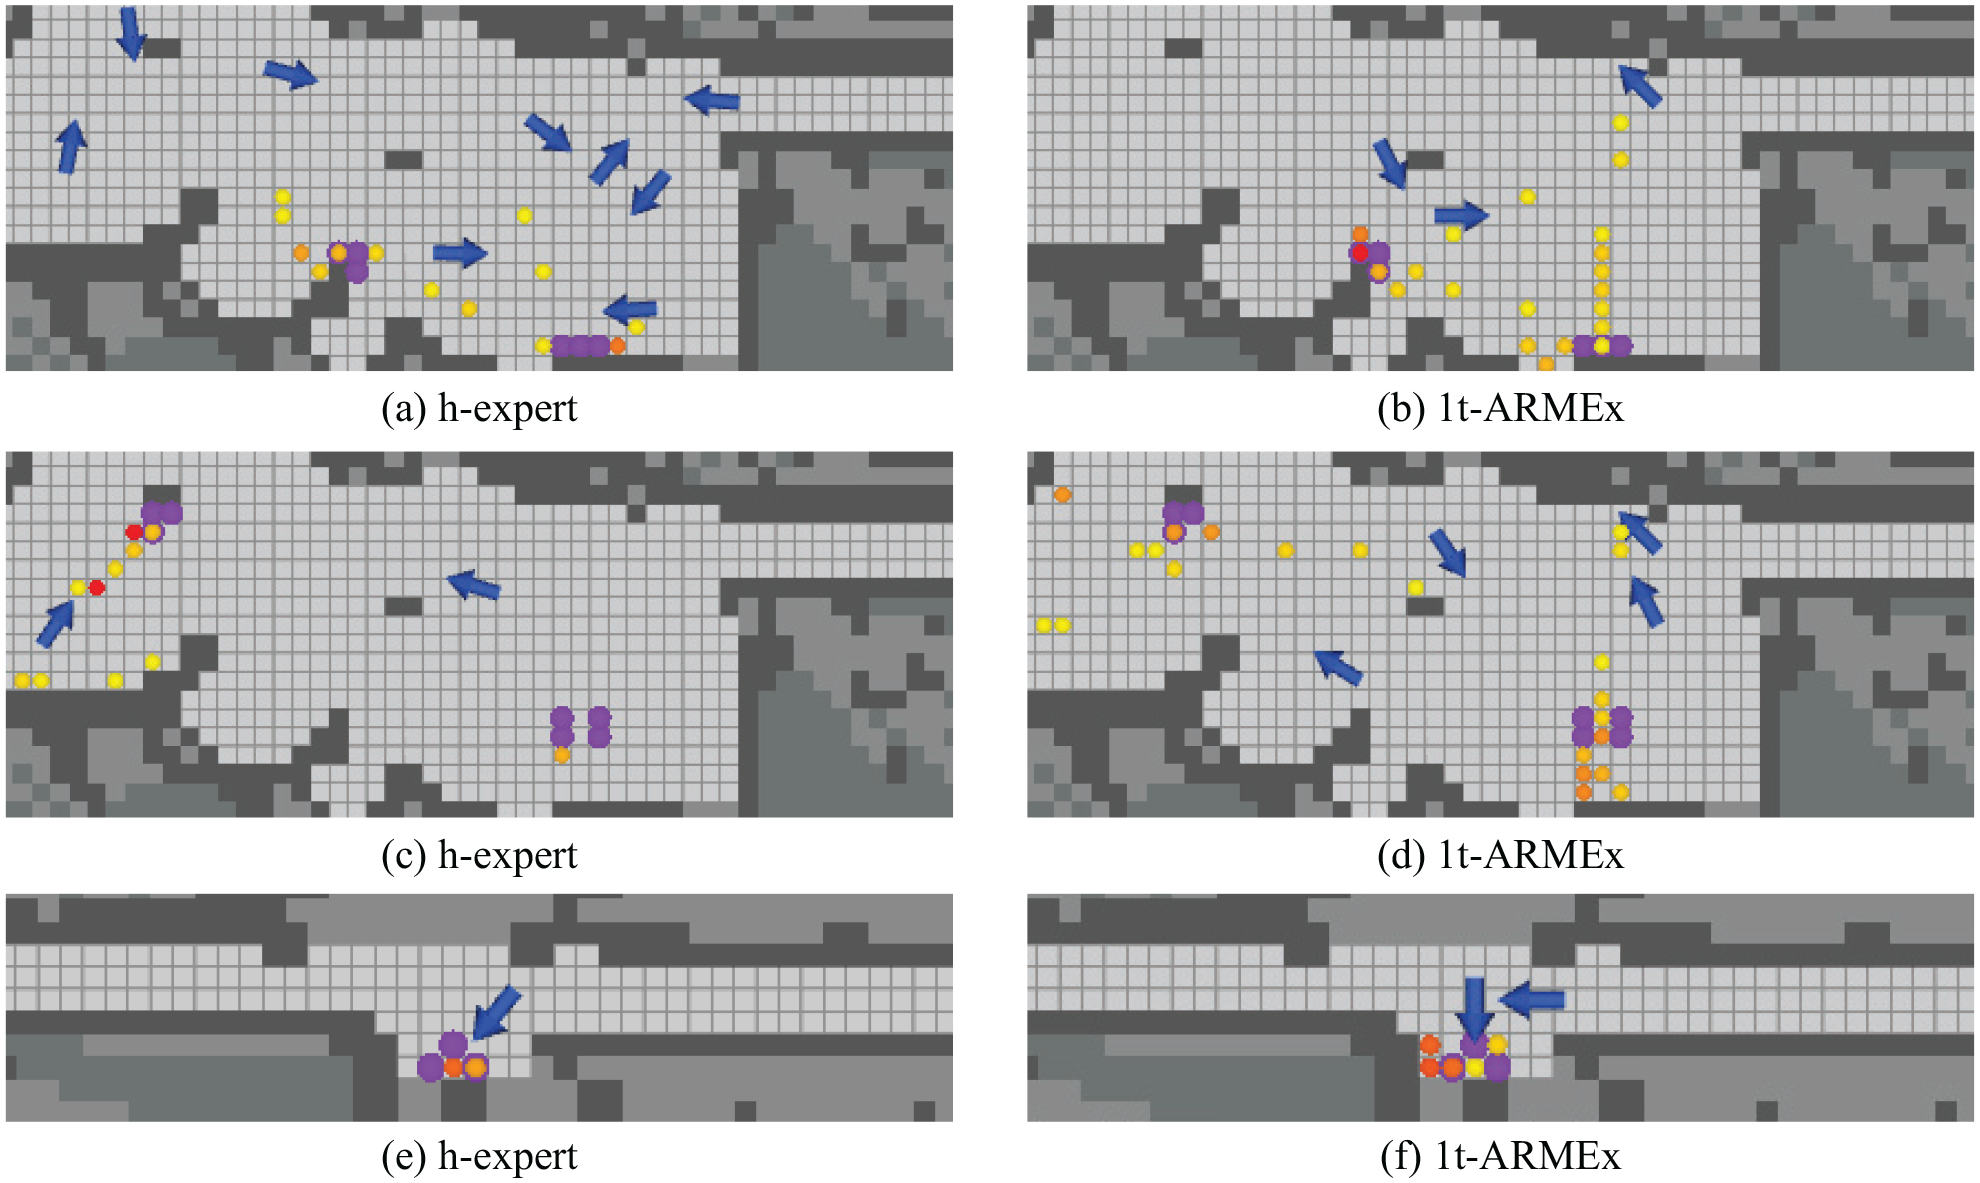
Comparison of sensor placement decided by human experts (
To summarize the quantitative and qualitative assessments, the one-tour strategy proposed in this article provides the best reconstruction quality with the lowest variance and uses the fewest configurations. Common feedback from the experts who performed the experiments is that deciding an optimal sensor placement for a human is difficult. For example, it is hard to decide a measurement pose while looking at the current gas map, the previous measurement poses, and estimating the area that can be covered. We make autonomous gas inspection possible with a few assumptions: (1) geometric map of the environment is available; (2) measurements are collected at discrete poses; (3) the inspection environment is a nearly flat surface; and (4) there is enough time to carry out the gas sampling. Our autonomous measurement strategies are strong contributions to sample the environment efficiently and accurately with a remote gas-sensing mobile robot, which was not possible previously. Moreover, enabling autonomous gas detection and gas distribution mapping means that many hazardous applications can now be considered that otherwise would require humans to be in dangerous areas, such as disaster situations.
6. Conclusions
Greenhouse gas emissions are a major cause of global warming, and vigilant monitoring is required to locate high-concentration areas and analyze fugitive emissions. A remote gas sensor carried by a mobile robot provides the possibility for adaptive gas inspection in large environments. We propose an Autonomous Remote Methane Explorer (
The major contributions of this article are as follows. (1) We have presented an autonomous robotic solution for gas inspection missions with an actuated remote gas sensor. We have developed sensor planning algorithms that aim at optimizing performance criteria for gas detection and gas distribution mapping while minimizing the number of measurements and the total traveling distance. In a layer above the sensor planning algorithms, we have designed a mission strategy to efficiently sample the environment for combined inspection tasks of gas detection and gas distribution mapping. Our one-tour adaptive strategy (
We believe that this work is a major step to bring mobile robot olfaction systems into practical applications in large environments. Our proposed system can further be improved to increase its reliability. In remote gas sensing, accurate robot localization is important because, in addition to the incorrect estimation of the sensor pose itself, the localization error can further propagate in the beam length calculation and, consequently, in the decomposition of integral measurements. Uncertainties in the robot pose can be considered in the process of gas mapping (Lilienthal et al., 2007) to overcome the effects of the localization error.
Footnotes
Funding
The author(s) disclosed receipt of the following financial support for the research, authorship, and/or publication of this article: This work was funded in part by the EU H2020 project SmokeBot (grant number ICT-23-2014 645101). The authors would also like to acknowledge SURVEYOR (Vinnova, project number 2017-05468), which was carried out within the Strategic Innovation Program STRIM, a joint venture of Vinnova, Formas, and Energy Agency (Sweden). In addition, the authors would like to acknowledge the project RAISE (KK-S project number 20130196).