
Abstract
The Barnes Foundation is a traditional art collection and it is one of a kind as for the assorted hanging of the paintings. The sophisticated wall compositions by Albert Barnes were created as a tool for art education, and they have not been altered since 1951. Today, we are interested whether Barnes’ taste withstood the test of time. We asked participants in an online study to create their own hangings on five of the original gallery walls, and also tested whether beholders are able to identify a missing painting from a selection of suitable alternatives. Results show that Barnes’ motifs are reproduced by a significant number of participants and that experts produce more Barnes-like displays than naive participants. We conclude that Albert Barnes based his choices at least to some degree on universally valid visual aspects that are still understood today, especially by people trained in the visual domain.
Keywords
Introduction
Is there something like a gold standard for good wall compositions when arranging paintings in museums or art galleries? Art collector and businessman Albert C. Barnes (1872-1951) would have answered this question clearly in the affirmative. He is the founder of the world-famous Barnes Foundation, located in Philadelphia, Pennsylvania. Barnes spent much of his lifetime building and curating his art collection and from the beginning, he understood the Barnes Foundation as an educational institution on art appreciation and aesthetic philosophy. To this aim, he positioned paintings and objects next to each other not based on their history or art period, but on subjective perceivable connection between their individual light, colors, and lines (Dolkart & Lucy, 2012). Barnes himself stated that “[l]iving with and studying good paintings offers greater interest, variety, and satisfaction than any other pleasure known to man.” At the same time, he pointed out that “[a]ppreciation of works of art requires organized effort and systematic study. Art appreciation can no more be absorbed by aimless wandering in galleries than can surgery be learned by casual visits to a hospital.” (The Complex History of the Barnes Foundation, n.d.). This special significance is also emphasized by a statement of Violette de Mazia, who was working at the Barnes for more than 60 years (from 1926 until 1987), becoming Vice-President and Director of the Barnes collection after Barnes’ death. In response to criticism that the Barnes did not meet conventional museum practices, she replied that the Barnes Foundation “selects and assembles its materials primarily according to their ability to foster understanding of objective investigation and to help in demonstrating the principles of aesthetics” (De Mazia, 1983, p.2). In his will, Barnes stipulated that none of his collected artworks and objects was ever to leave the collection (not even temporary), and no objects would be added, modified, or even moved after his death (Kiely, 2022). Consequently, although the collection of artworks has been relocated to a new building in 2012, the hanging and, therefore, the juxtaposition of the paintings and other objects has not been altered for the past 70 years (Anderson, 2013). Beginning in 2017, the collection was digitally reproduced and it is now fully available online (at collection.barnesfoundation.org/you’ll find photos of the full walls by clicking on a painting, and then on the tab “ensemble.”). The online collection still emphasizes not only the individual artworks but their exact location and context in the physical collection. The availability of high-quality photos of all paintings and wall hangings from the Barnes collection offers great potential for conducting experimental research allowing for an empirical investigation of Barnes’ principles of aesthetics.
To the best of our knowledge, there is only little systematic empirical research done on wall composition in art galleries and museums. An experiment in the Austrian Gallery Belvedere took advantage of the rearrangement of the permanent exhibition in 2018 and found a deepened visitors’ engagement with the artworks, while art form preferences and interest in specific artworks remained robust (Reitstätter et al., 2020). In another quasiexperimental study within the Albertina Museum in Vienna, Specker et al. (2022) demonstrated the relevance and impact of the curatorial narrative around artworks. Highlighting the deviance of certain styles made museum visitors judge artworks as more influential. In a recent eye-tracking experiment, Krukar and Dalton (2020) found that participants’ attention and their memory of artworks is affected by the visual properties of the exhibition space. Another study by Pelowski and colleagues systematically investigated the effect of gallery lighting and found only small effects of different lighting conditions on abstract and representational artworks (Pelowski et al., 2019). The aim of the present study is to add to that body of research by doing a case study of the exhibition space of the Barnes Foundation. We want to answer the question whether Barnes’ sophisticated wall compositions still meet the taste of 21st century laypeople and experts.
To address this question, we applied two methods already introduced by Gustav Theodor Fechner (1801-1887), the father of empirical aesthetics, in his seminal book Vorschule der Ästhetik (Fechner, 1876). In total, Fechner proposed three methods: The method of use (What is the common factor in aesthetic objects of everyday life?), the method of choice (Given a selection of objects: which option is selected to be of the highest aesthetic appeal?), and the method of production (What do subjects produce when asked to create something that is aesthetically appealing?). All of them have been used in empirical research throughout the past 150 years to investigate aesthetic principles such as the golden section (e.g., Green, 1995), visual balance (e.g., Jahanian et al., 2015), curvature (e.g., Palumbo & Bertamini, 2016), and photographic cropping (e.g., McManus et al., 2011A) among others. However, the production method has been used relatively rarely until now. Some work has been done, for instance, by Westphal-Fitch et al. (2012) and Hübner & Thömmes (2019).
By applying Fechner's method of production and his method of choice, we address the following specific questions. In Experiment 1, we use the method of production and let both naive and expert participants create hangings using the original paintings and the original wall space for five different walls from the Barnes’ exhibition space. In Experiment 2, the same participants are asked to find the original painting from a selection of five alternatives (method of choice) to complete 20 different walls where the central painting has been masked out. The results of both experiments are analyzed with an additional focus on the effect of expertise. In doing so, we provide a comparison of naive participants and experts in the field of art and design in how well they recognize and reproduce Barnes’ original idea of wall hangings in the Barnes Museum.
Experiment 1—Method of Production
Methods
Encountering the collection, we identified three main motifs behind Barnes’ hanging that are present on almost all the walls he designed. First, there is a clear focus on one central painting that is the apparent centerpiece of the wall. Sometimes it is vertically paired with a smaller painting hanging directly above or below. We call these paintings
Second, an apparent symmetrical arrangement of the paintings catches the eye, where horizontally aligned pairs opposite of each other share a similar size, and many times even similar content and coloration. There are up to four such pairs on the walls used for our analyses. We encode these pairs including their original location in the left versus right visual field of the observer:
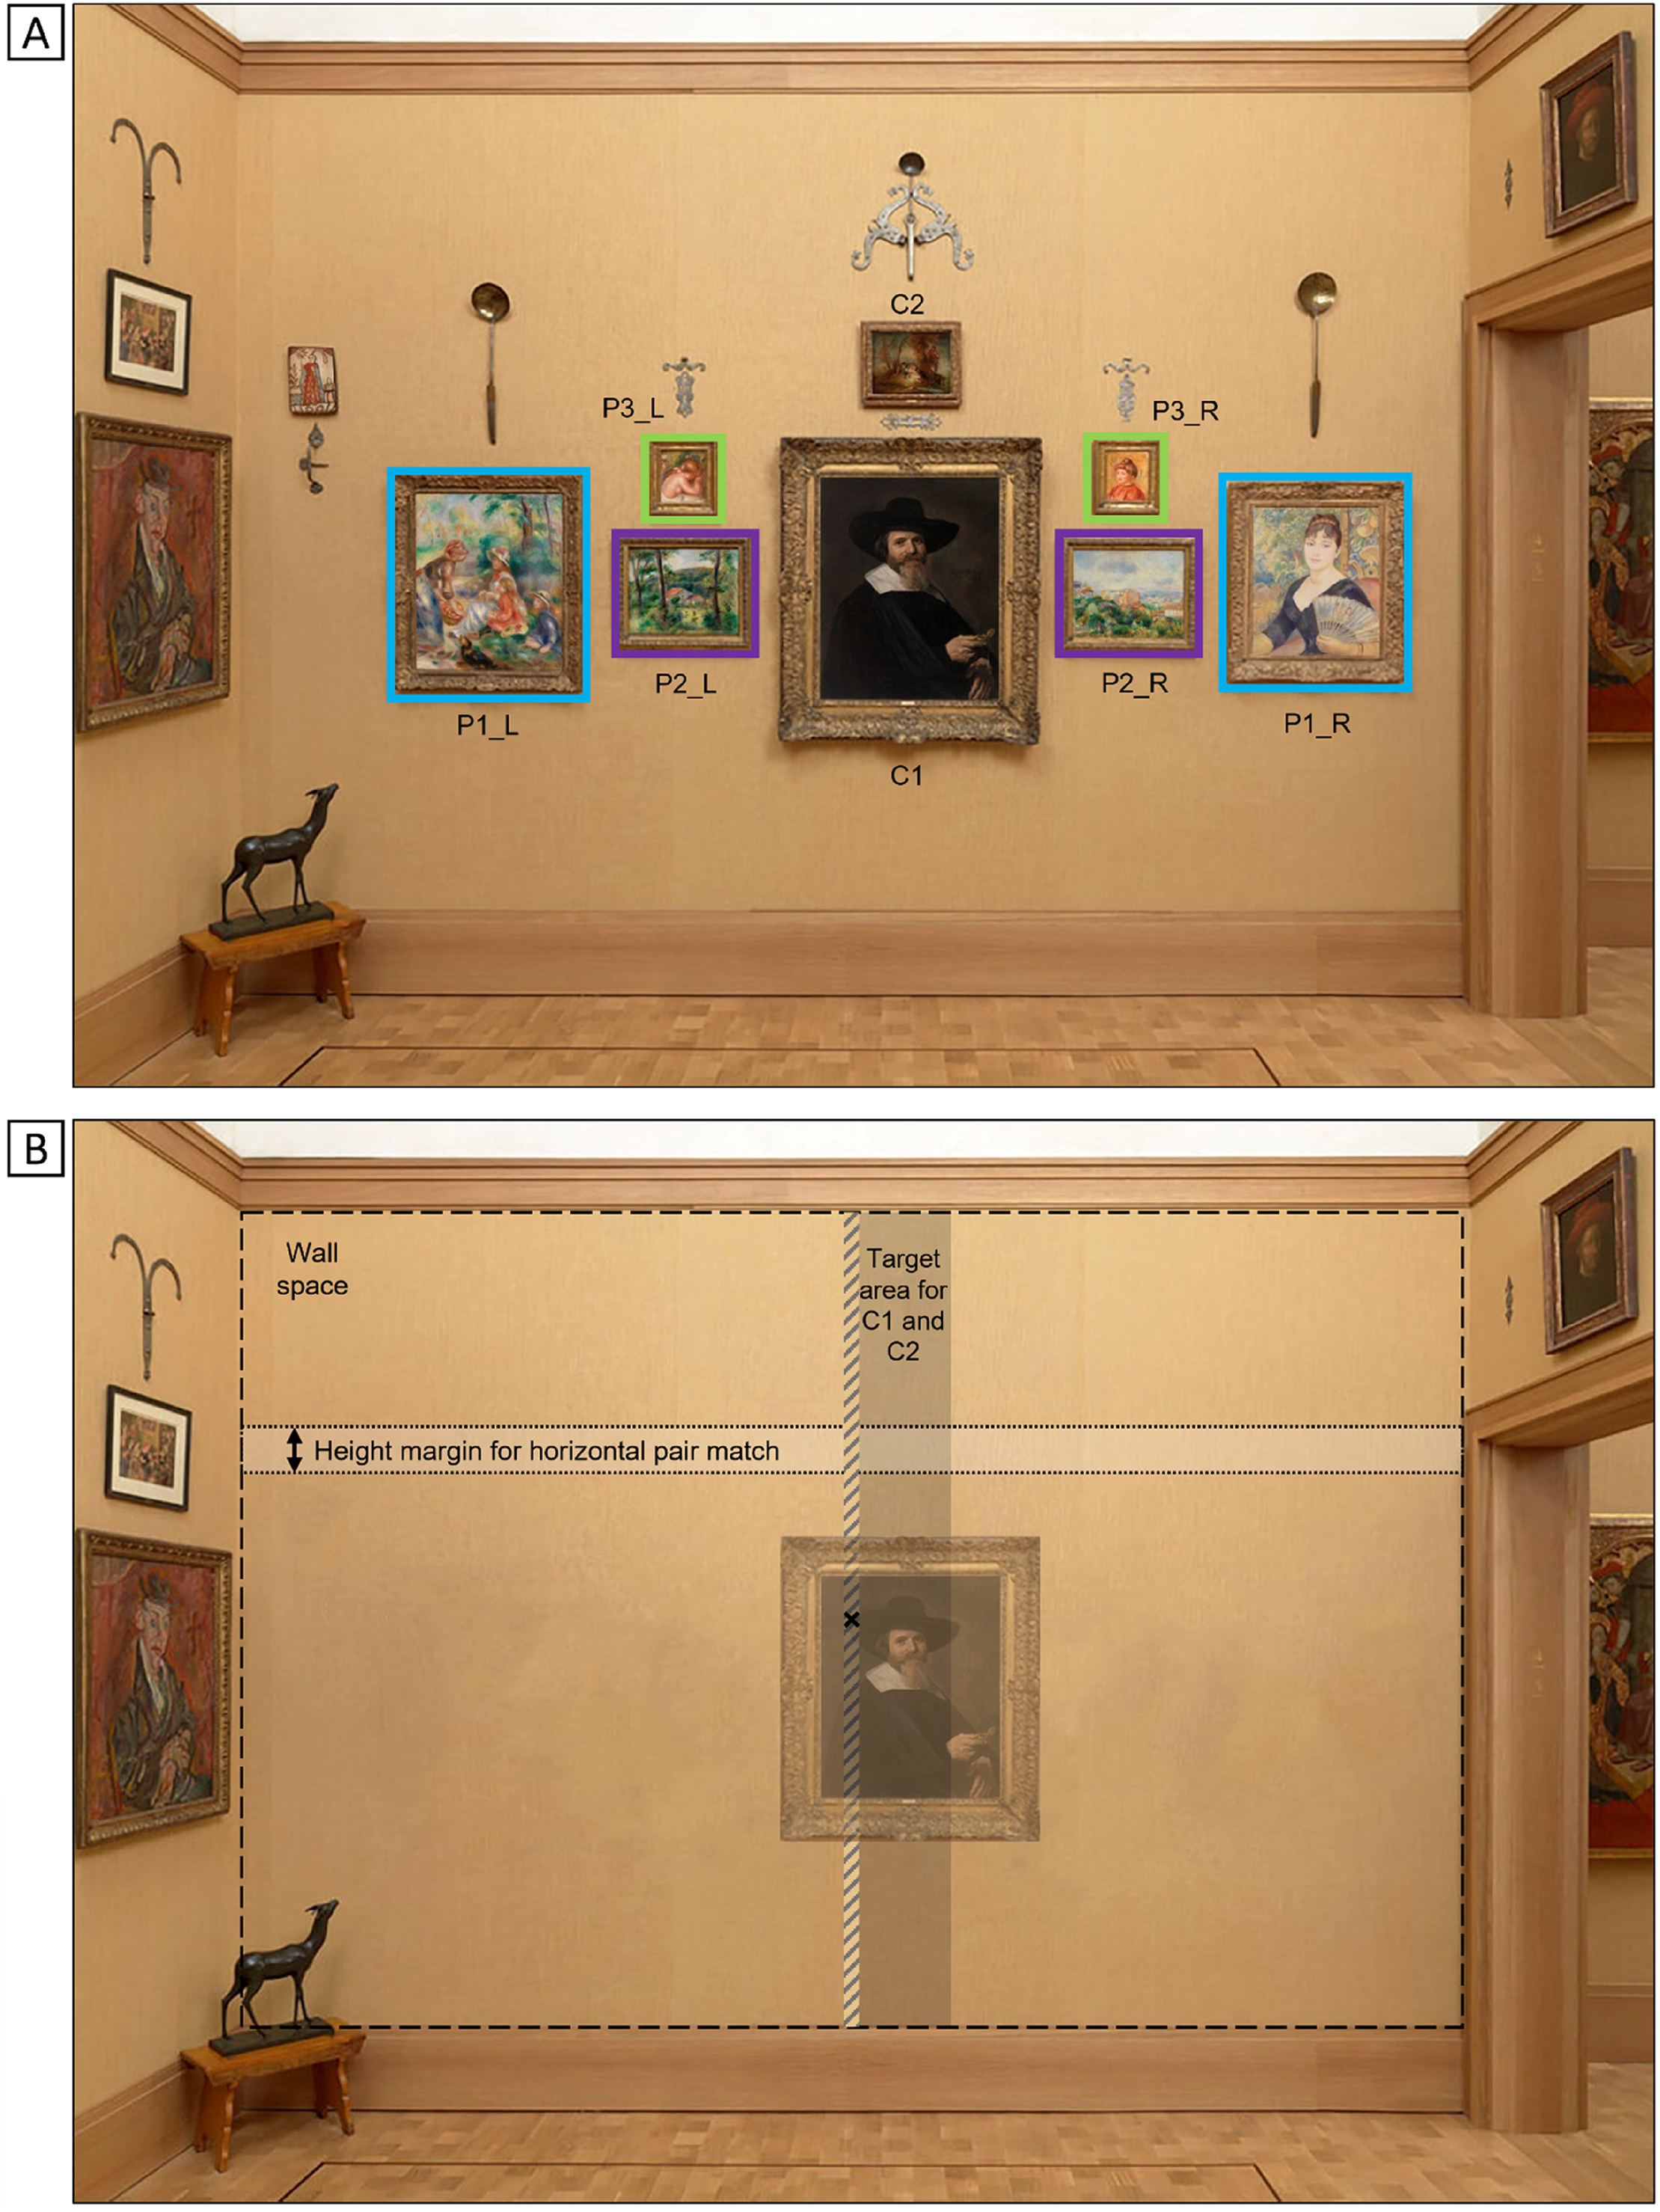
Barnes’ motifs and definition target areas for H1 and H2. (A) Barnes’ central paintings are referred to as C1 and C2, respectively. Pairs of paintings are marked with colored framing, left and right positioning is encoded (referred to as P1-L, P1-R, etc.). (B) The dashed line indicates the wall space within the photo. Within this wall space, we defined a target area for the central paintings (shaded area) that was set ±30 pixels around the original position of the geometrical center of C1 and had to include the physical center of the wall space (this was the case for 4 out of 5 walls). For the depicted wall (Room 5, East Wall), Barnes’ central paintings were moved slightly to the right, due to the placement of the deer sculpture, one small painting and some metalwork on the left-hand side. That is why we shifted the target area by 10 pixels to the left (hatched area) to include the physical center of the wall space (black cross). The bright area indicates the height margin, where we defined pair matches of original pairs as being placed on a horizontal axis within ±15 pixels of each other. Note that the vertical position on the wall did not play a role here. For all calculations, the location of a painting is encoded by the x- and y-coordinate of its physical center on the wall space.
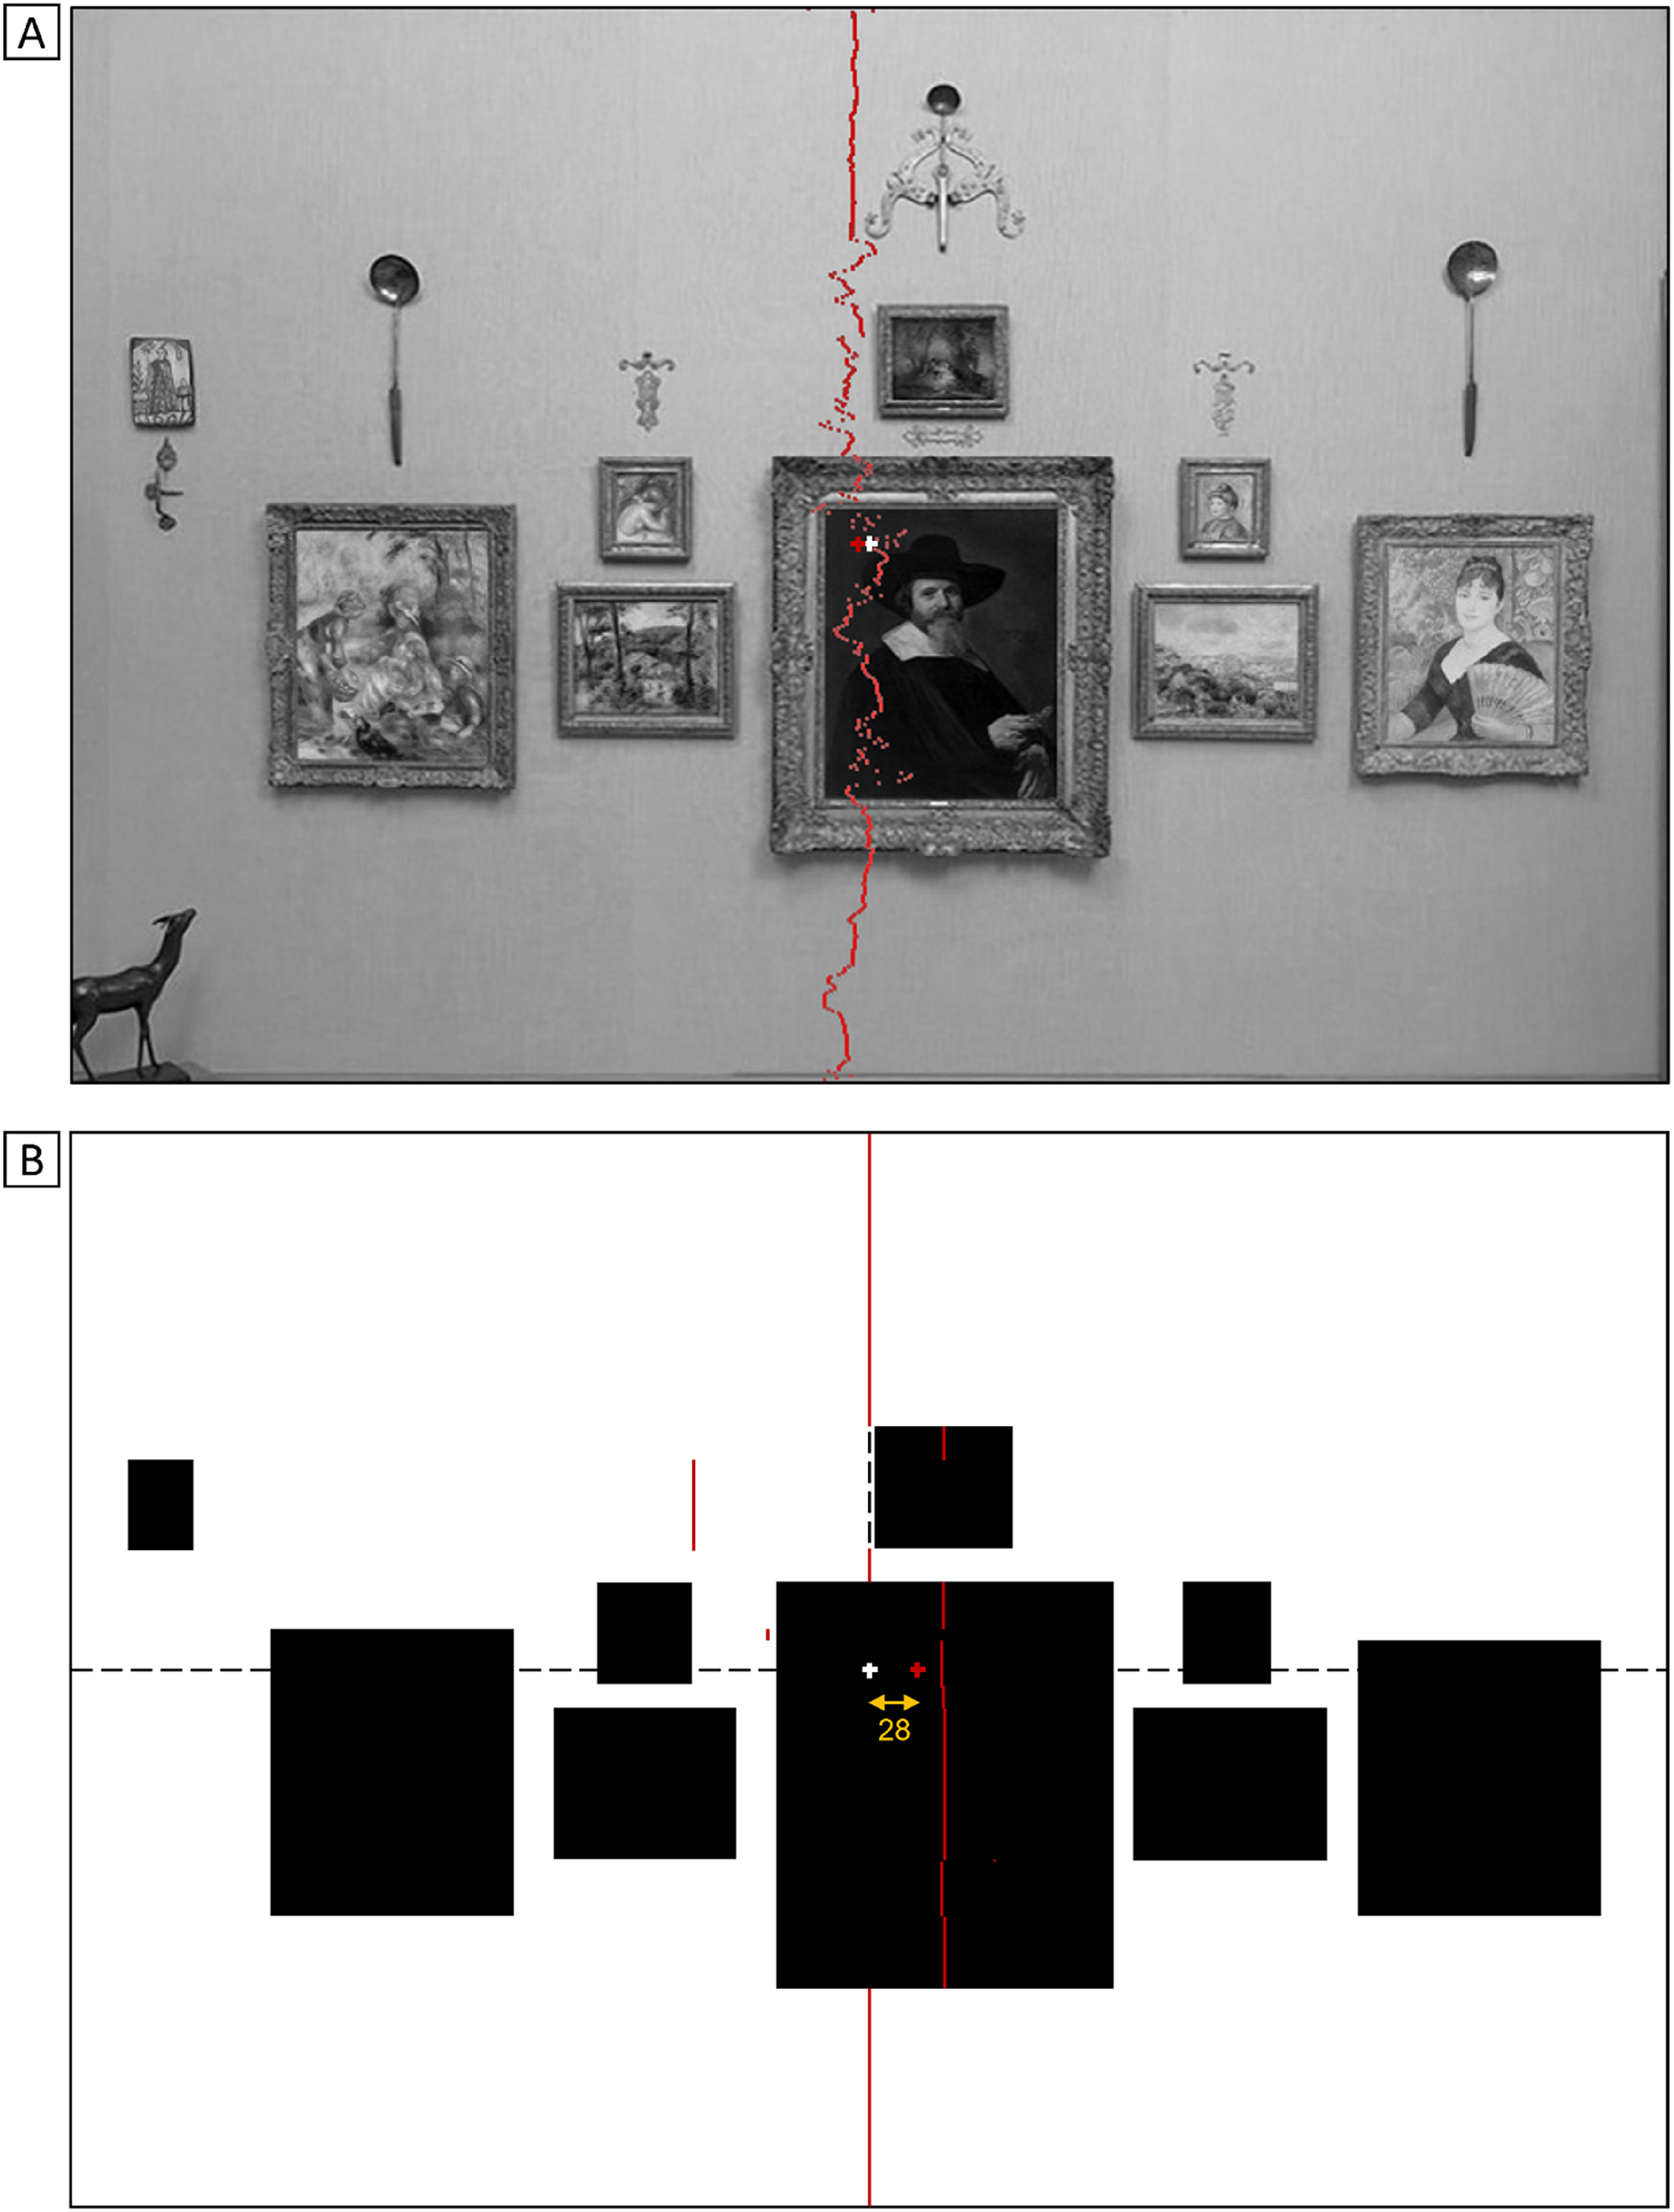
Luminance-based Center of Mass (CoM) for the left-right dimension. The red line indicates the CoM per pixel row. Darker pixels are considered heavier than lighter pixels and their relative location in the image plays a role in analogy with a seesaw. (A) When computing the CoM for the original photo, the measure is very sensitive to the luminance of the wall itself. Therefore, the CoM (red cross) lies very close to the physical center of the wall space (white cross). (B) Computation for a black and white version of the wall space with paintings as weight on a neutral background is better suited to capture the visual weight of the paintings on the wall. The yellow arrow indicates the horizontal distance score (D) between the CoM and the physical midline (the distance here is 28 pixels). The D score is used as a measure for left-right balance.
Based on these observations, we deduced three hypotheses that we wanted to test using a method of production task (Experiment 1) where participants could move all paintings freely on the wall and compose their own hanging for five different ensembles. The task in the online experiment was to design a hanging that participants found beautiful, harmonious, and aesthetically pleasing.
H1: Participants place Barnes’ centerpiece in the center of the wall. H2A: Participants place Barnes’ pairs on a horizontal axis. H2B: The recognized pairs retain their position (left vs. right). H3: The overall wall composition is well balanced toward the midline.
Figure 1b visualizes target areas for H1 and H2A. In Supplemental Material, Figure S1 areas of interest are also illustrated for the remaining four walls from Experiment 1.
Stimuli
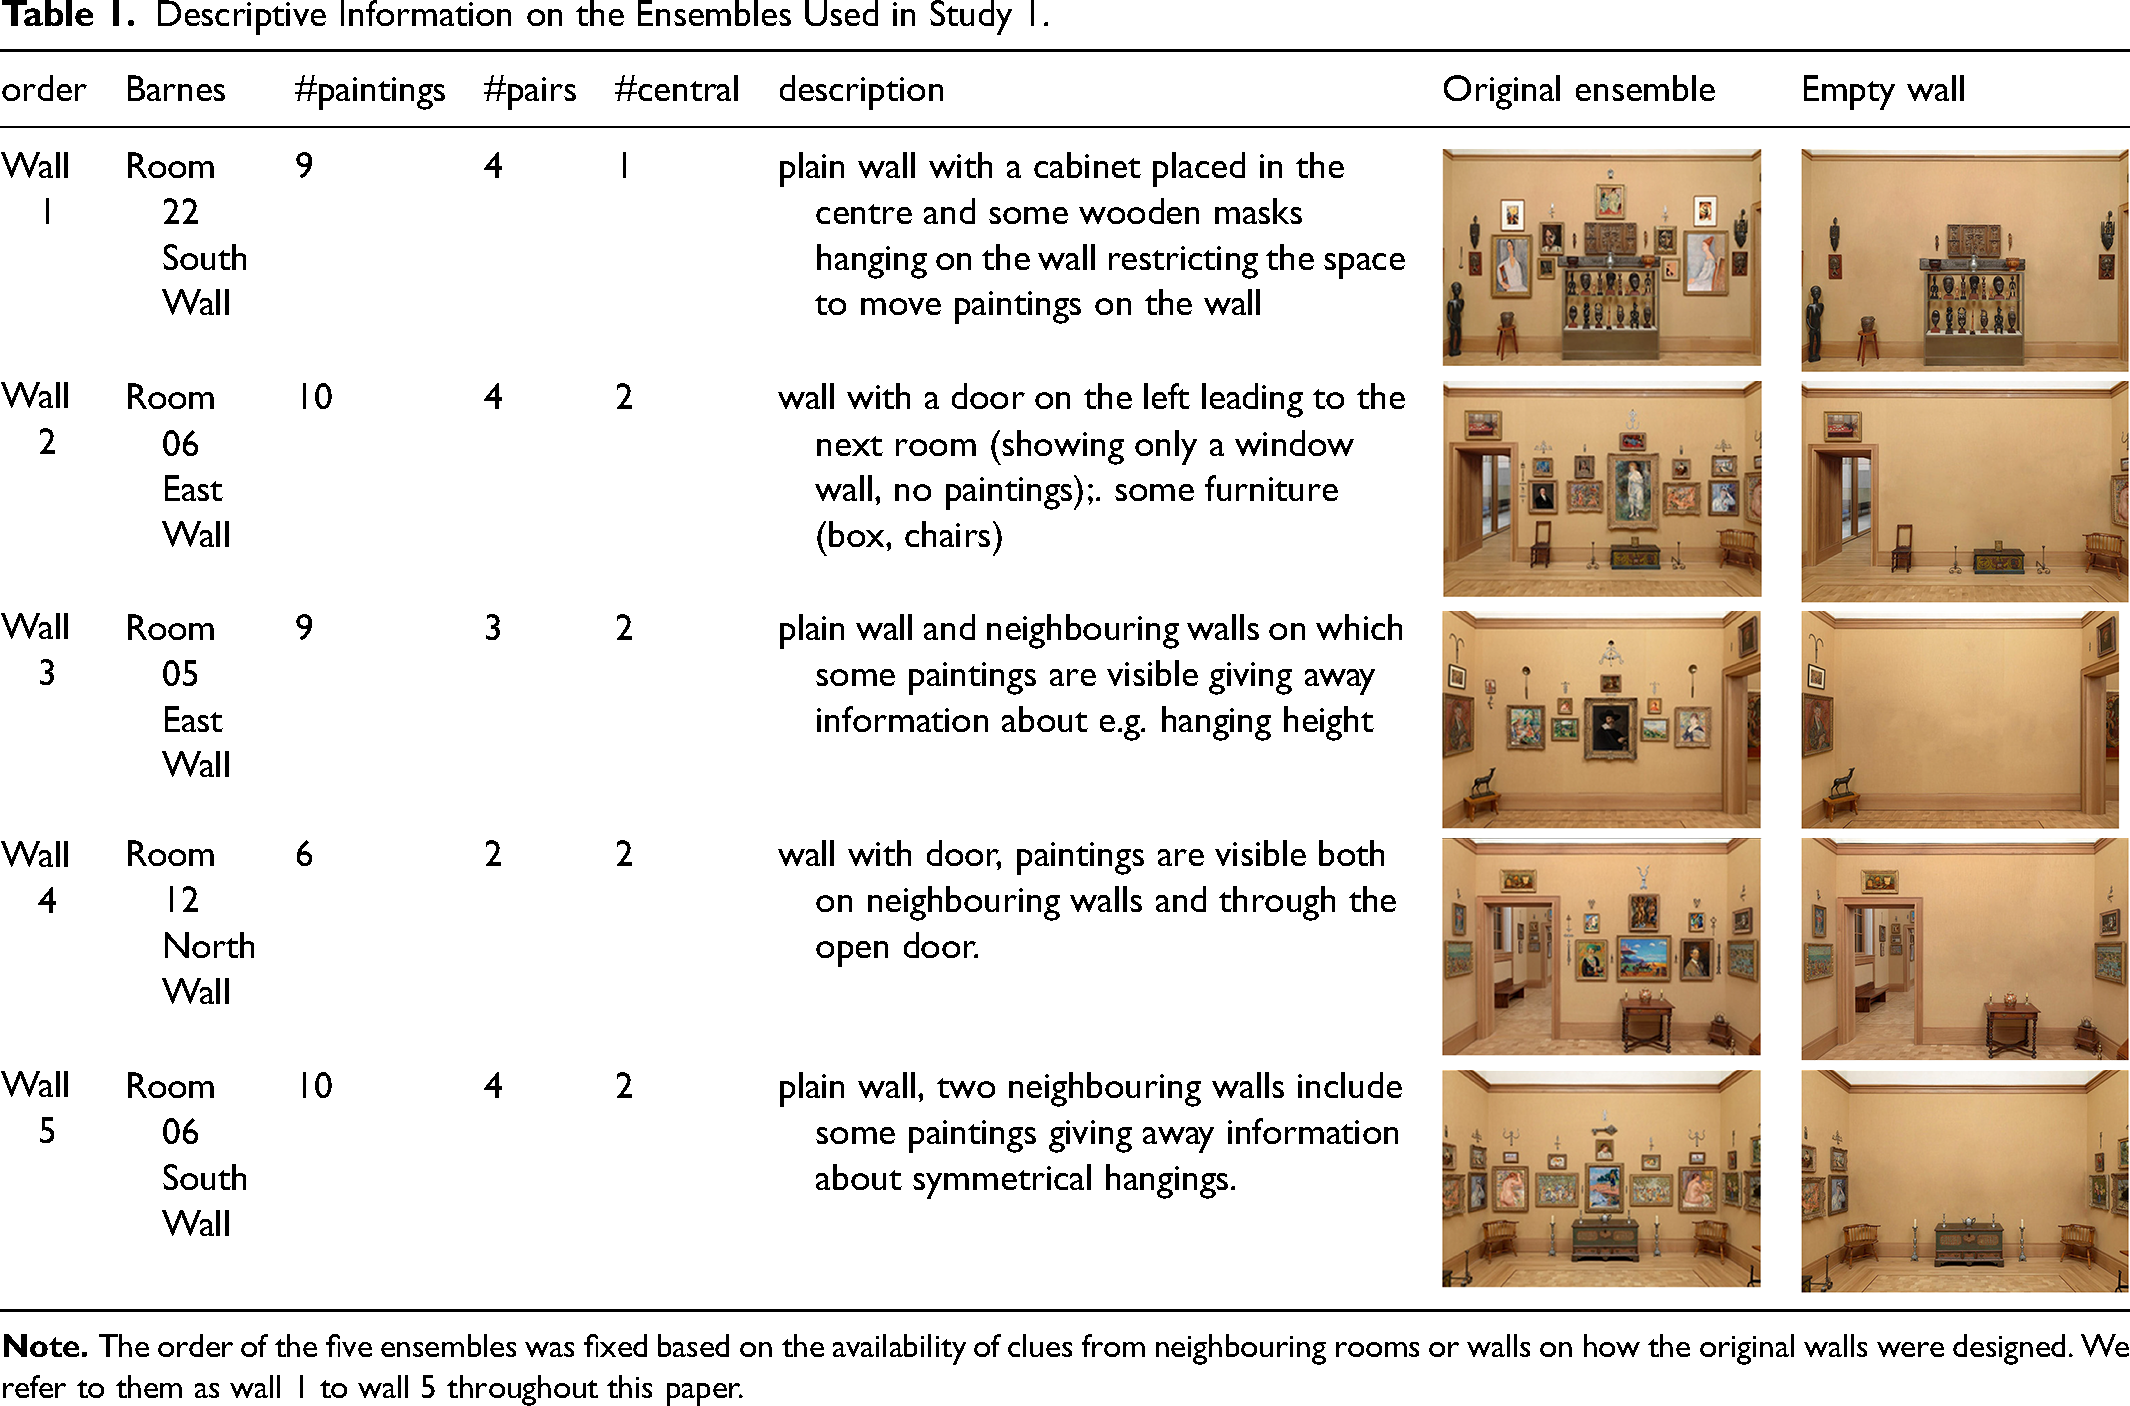
The whole collection and exhibition space is digitalized and freely accessible via the Barnes’ website collection. barnesfoundation.org/. The museum includes 89 walls with a total of 1010 paintings. The online collection includes high-resolution digital replications of all artworks, as well as professional photographs of the complete walls taken from a central location without distortion. These full wall images are called “ensembles” on the Barnes’ website and throughout this paper. For Experiment 1, we selected five such ensembles that we considered representative for the general appearance of the museum. Table 1 sums up characteristics of these five walls. Using Adobe Photoshop, we edited the original ensemble photos from the Barnes’ website to create blank walls by removing all paintings as well as metal work and other wall decorations as shown in Table 1. We then cropped out all the paintings including their original frames. To enhance image quality of the framed paintings, we used the high-resolution painting versions and fitted them into the frame. Figure 3 shows the stimuli used in experiment for one example wall. Table 1 summarizes numbers of paintings per wall, and lists wall specifics that led to our choice to present the five walls in a fixed order throughout Experiment 1.
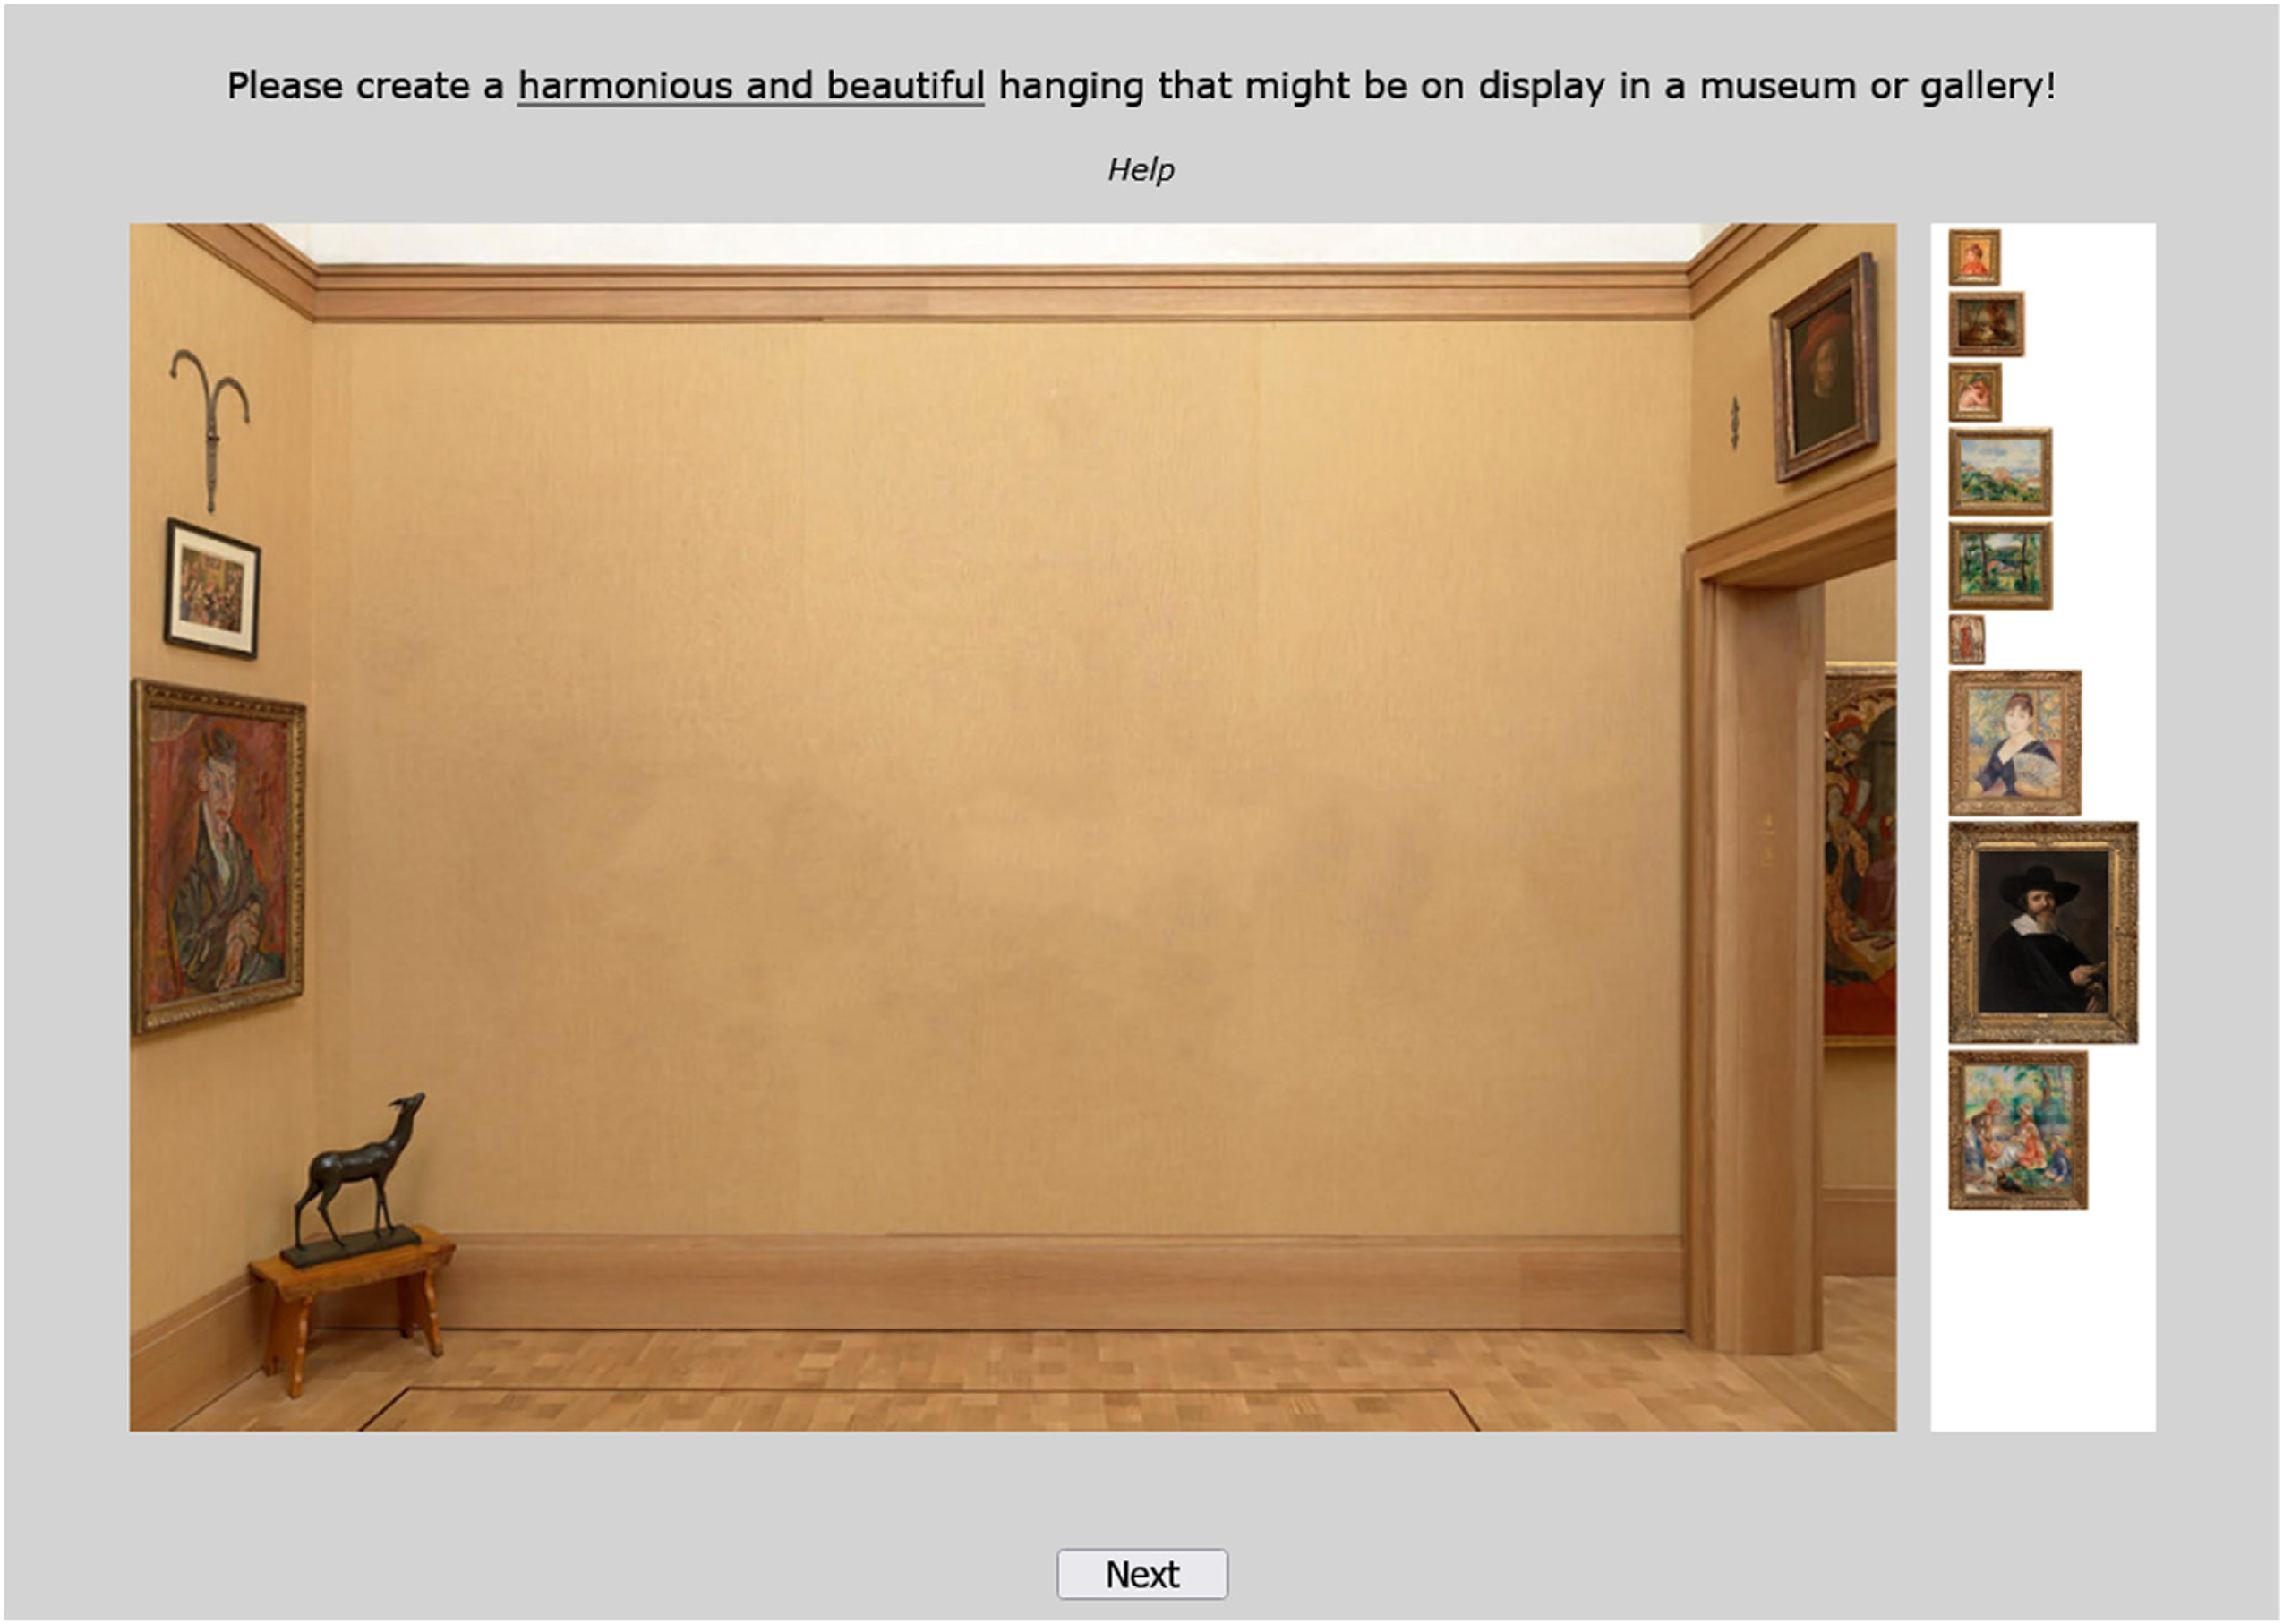
Method of production screen in the online study (Experiment 1). The paintings on the right-hand side (selection area) were presented in a randomized order. Participants could select each painting by clicking on it. It then appeared on the wall, from where it could freely be moved to any location on the wall via drag and drop. Each painting had to be selected and moved on the wall at least once. Overlapping images were not allowed. There was no time limit to complete the task.
Descriptive Information on the Ensembles Used in Study 1.
We slightly cropped the original wall photos and resized them to a standard resolution of 1024 × 700 pixels. This standardization ensured a fixed visual angle on the screen in the online study across all walls.
Naive and Expert Participants
We recruited a total of 122 participants aged 18–58 (average age 27), 69 were female, 46 male and 7 preferred not to specify. Recruitment was done via PsyKonLabs (ORSEE, Greiner, 2015), an online recruitment system for psychological experiments at the University of Konstanz (n = 107), and additionally we asked graduates and lecturers from different art universities in Germany, as well as art historians and curators from our broader circle of acquaintances to participate as experts in our study (n = 15). To also detect participants with relevant art expertise from the PsyKonLabs sample, we included some expertise-related items at the end of the experiment (see Supplemental Material Table S1). This added 12 more experts from different art-related backgrounds, so the sample consisted of 95 naive participants with no special background or interest in visual arts and 27 experts (aged 19–41, average age 27, 22 female). We also asked whether participants have heard of the Barnes collection before to check for familiarity with the exhibition. All 122 participants negated this question.
Procedure
The online study was performed in accordance with the Declaration of Helsinki and was approved by the ethics committee of Jena University Hospital (approval number 2022-2549-Bef). Participants could choose between German and English instructions. They were asked to use a notebook or desktop computer and after giving written consent, they were instructed to set their screen to maximal luminance and adjust the zoom level of their browser window in full-screen mode for optimal display. The study consisted of two separate blocks (Experiment 1 and Experiment 2) with instructions given at the beginning of each part. After the experiment, participants filled out a demographic questionnaire and answered some additional questions about their experience with visual art and design (see Supplemental Material Table S1). The study took 30–40 min and participants were remunerated with a fixed compensation of 5 Euro and depending on their choices a bonus of up to 4 Euro. The money was sent to them as a voucher for a bookshop, or alternatively participants could choose to donate their money for refugees from Ukraine via Deutscher Caritasverband.
For Experiment 1, participants were instructed to create a harmonious and beautiful hanging that might be on display in a museum or art gallery by moving all paintings freely on the respective wall for a total of five ensembles. After selecting a picture on a menu via mouse click, the respective painting appeared in the center of the wall. Participants could then move it around as often as they liked (also after selecting the other paintings. There were no time restrictions. When participants were ready, they had to click on a “next” button to get to the next ensemble. Figure 3 shows a screenshot from the original experiment. You can use the following link to view a short version of the original experiment: https://www.cogpsych.uni-konstanz.de/experiments/demos/Barnes/. The experiment code is available on request.
Results
H1: Participants place Barnes’ centerpiece in the center of the wall.
The histograms in Figure 4 illustrate the horizontal positioning of C1 across all participants for all five ensembles used in Experiment 1. If the large central painting (C1) or the small central painting (C2) is placed within a ± 30 pixel range around the original horizontal position, the trial is counted as a center match. For wall 3, the area of interest is shifted to the left by 10 pixels to also include the physical center of the wall space as is true for all other ensembles (see Figure 1b for a detailed description). The relative share of this area of interest of total wall space is used as a random baseline for the respective painting in the respective ensemble. Taken together, the main central painting (C1) is placed in the center of the wall in 49.51% of cases. The average random baseline is at 10.78%, so participants placed C1 significantly more frequently in a central location (two-tailed one-proportion Z-test, Z = 30.84, p < .001). The smaller central painting (C2) is placed in the center in 19.67% of cases, which is also significantly more frequent than the random baseline at 10.06% (Z = 7.06, p < .001). Looking at the five ensembles separately, C1 is placed in the center significantly more frequently than the random baseline would suggest for all five walls (match rates range from 39% to 58% of participants, all significant at p < .01). C2 placements are less drawn to the midline and significant central match rates are found for only two out of four ensembles. Table 2 sums up match rates for all central paintings per wall, and Figure 5a illustrates the match rates.
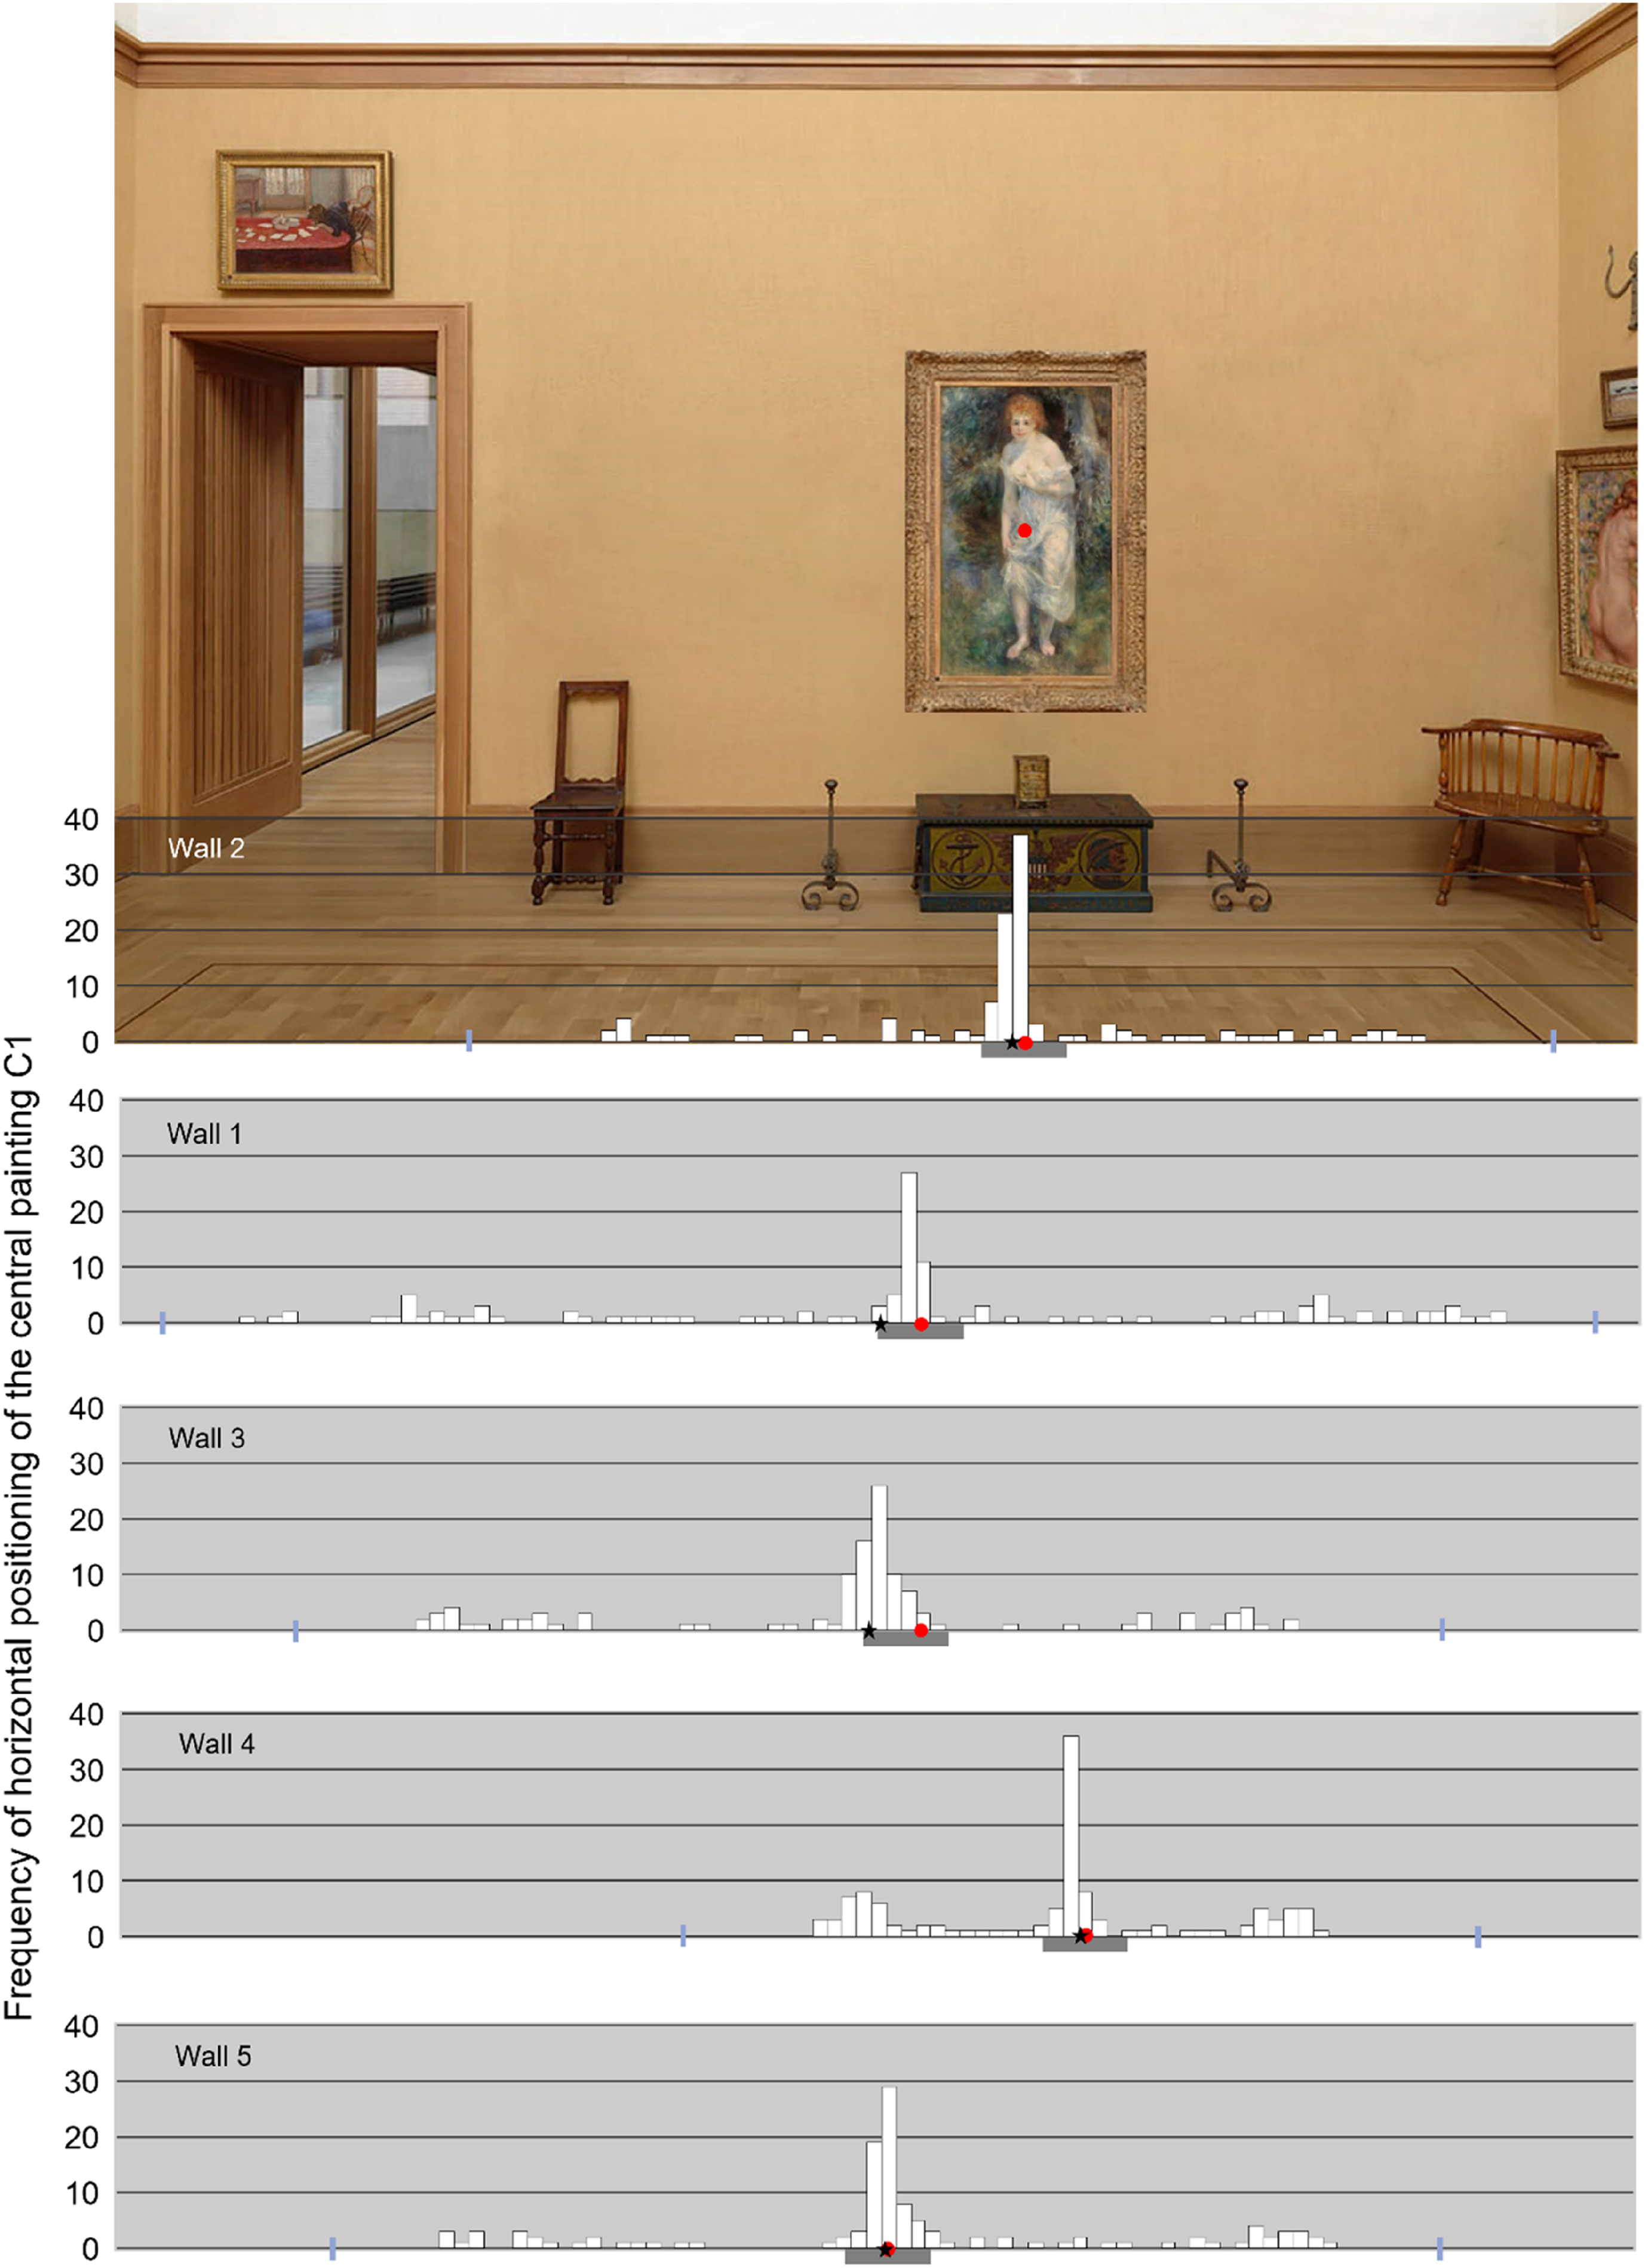
Histogram of horizontal C1 positioning across all participants. Red dots indicate the original location of C1, black stars the physical center of wall space, and the dark gray bar indicates the area of interest for C1 placements. The blue marks indicate the left and right edges of the wall space in the ensemble photo.
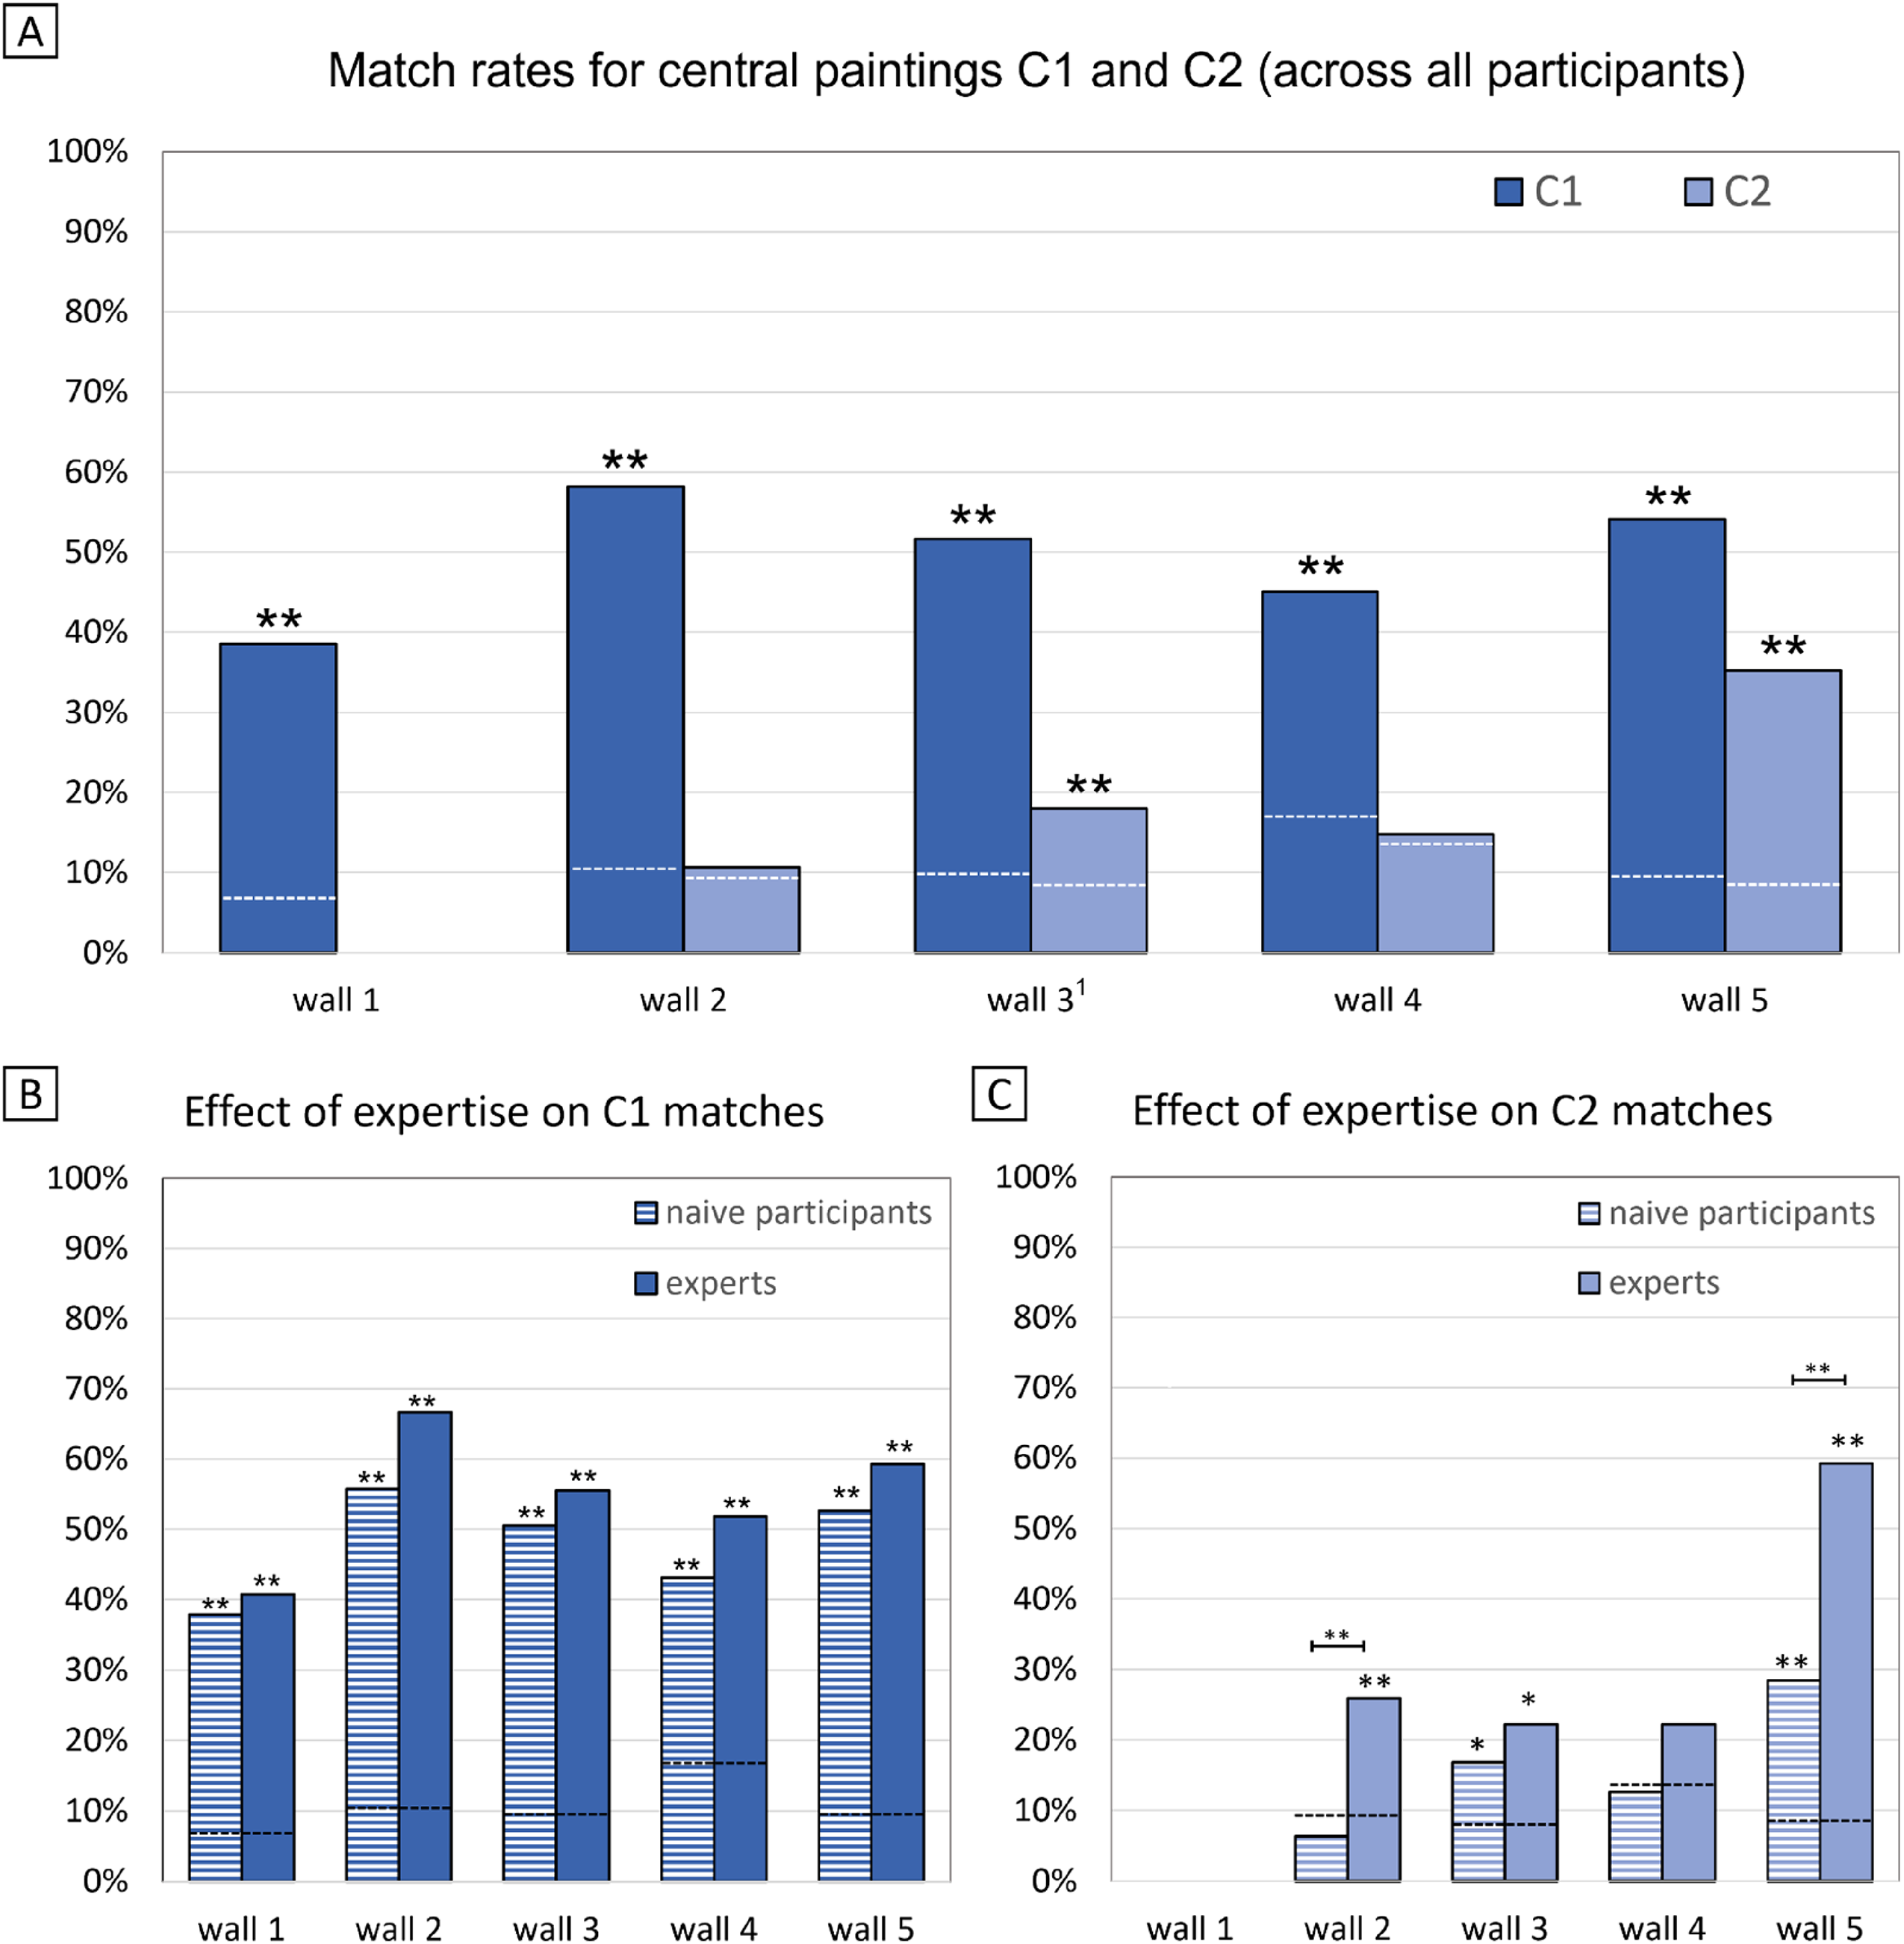
Placement matches of central paintings C1 and C2 at a position that is ±30 pixels around the original position. (A) Data across all participants. Dotted lines indicate the random baseline against which significance testing is done. (B) Effect of expertise on C1 positioning. Tendency for more central matches in the expert group across all walls. (C) Effect of expertise on C2 positioning.
Center Matches of Central Paintings C1 and C2.
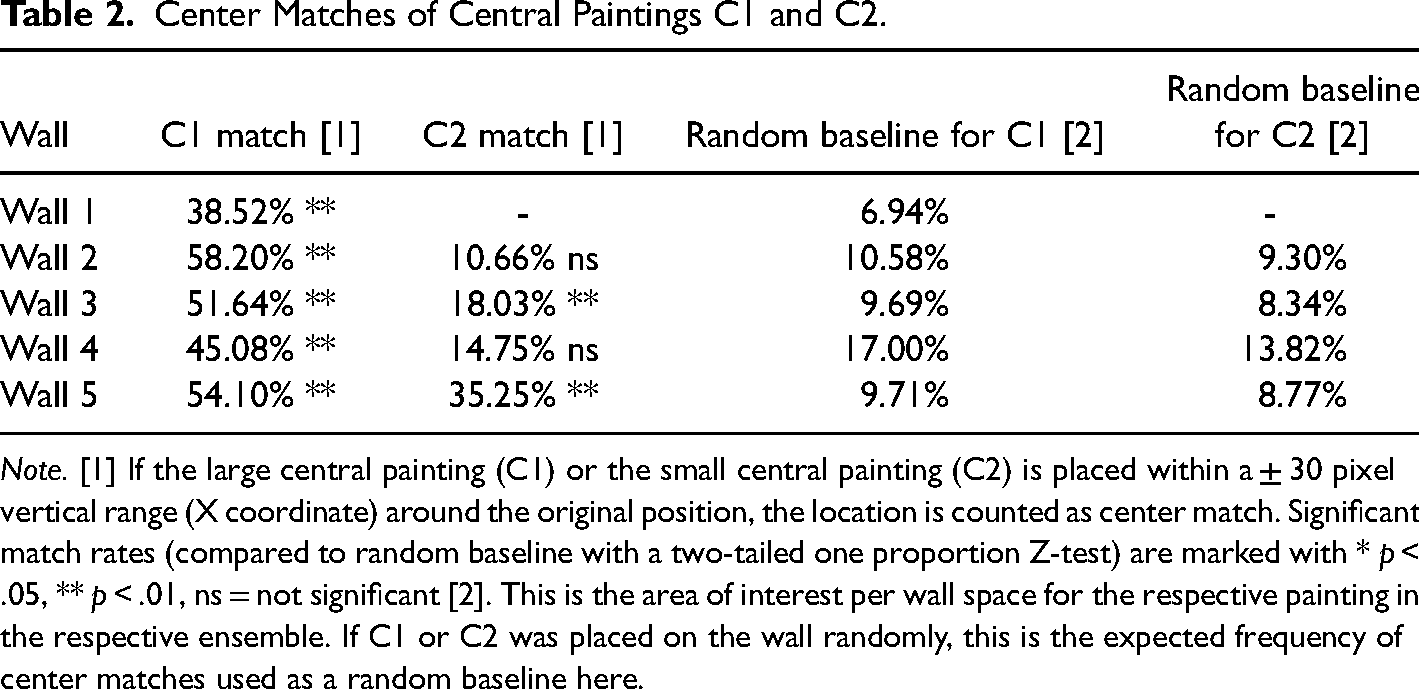
Note. [1] If the large central painting (C1) or the small central painting (C2) is placed within a ± 30 pixel vertical range (X coordinate) around the original position, the location is counted as center match. Significant match rates (compared to random baseline with a two-tailed one proportion Z-test) are marked with * p < .05, ** p < .01, ns = not significant [2]. This is the area of interest per wall space for the respective painting in the respective ensemble. If C1 or C2 was placed on the wall randomly, this is the expected frequency of center matches used as a random baseline here.
When comparing expert versus naive participants, there is a nonsignificant tendency for experts to place C1 in the center more frequently across all walls (54.82% vs. 48.00%, two-tailed two-proportion Z-Test, Z = 1.38, p = .17). There is a stronger and significant effect in C2 center matches, with experts placing C2 in the center target area more frequently than naive participants (32.41% vs. 16.05%, two-tailed two-proportion Z-test, Z = 3.26, p = .001). Looking at individual walls, a significant difference in match rates between naive participants and experts is found only for two C2 paintings (walls 3 and 5). In absolute numbers, experts have higher match rates for all C1 and all C2 paintings. These tests do not reach significance likely due to the relatively small group of experts. Figure 6b and c illustrates these results. These results support H1.
H2A: Participants place Barnes’ pairs on a horizontal axis.
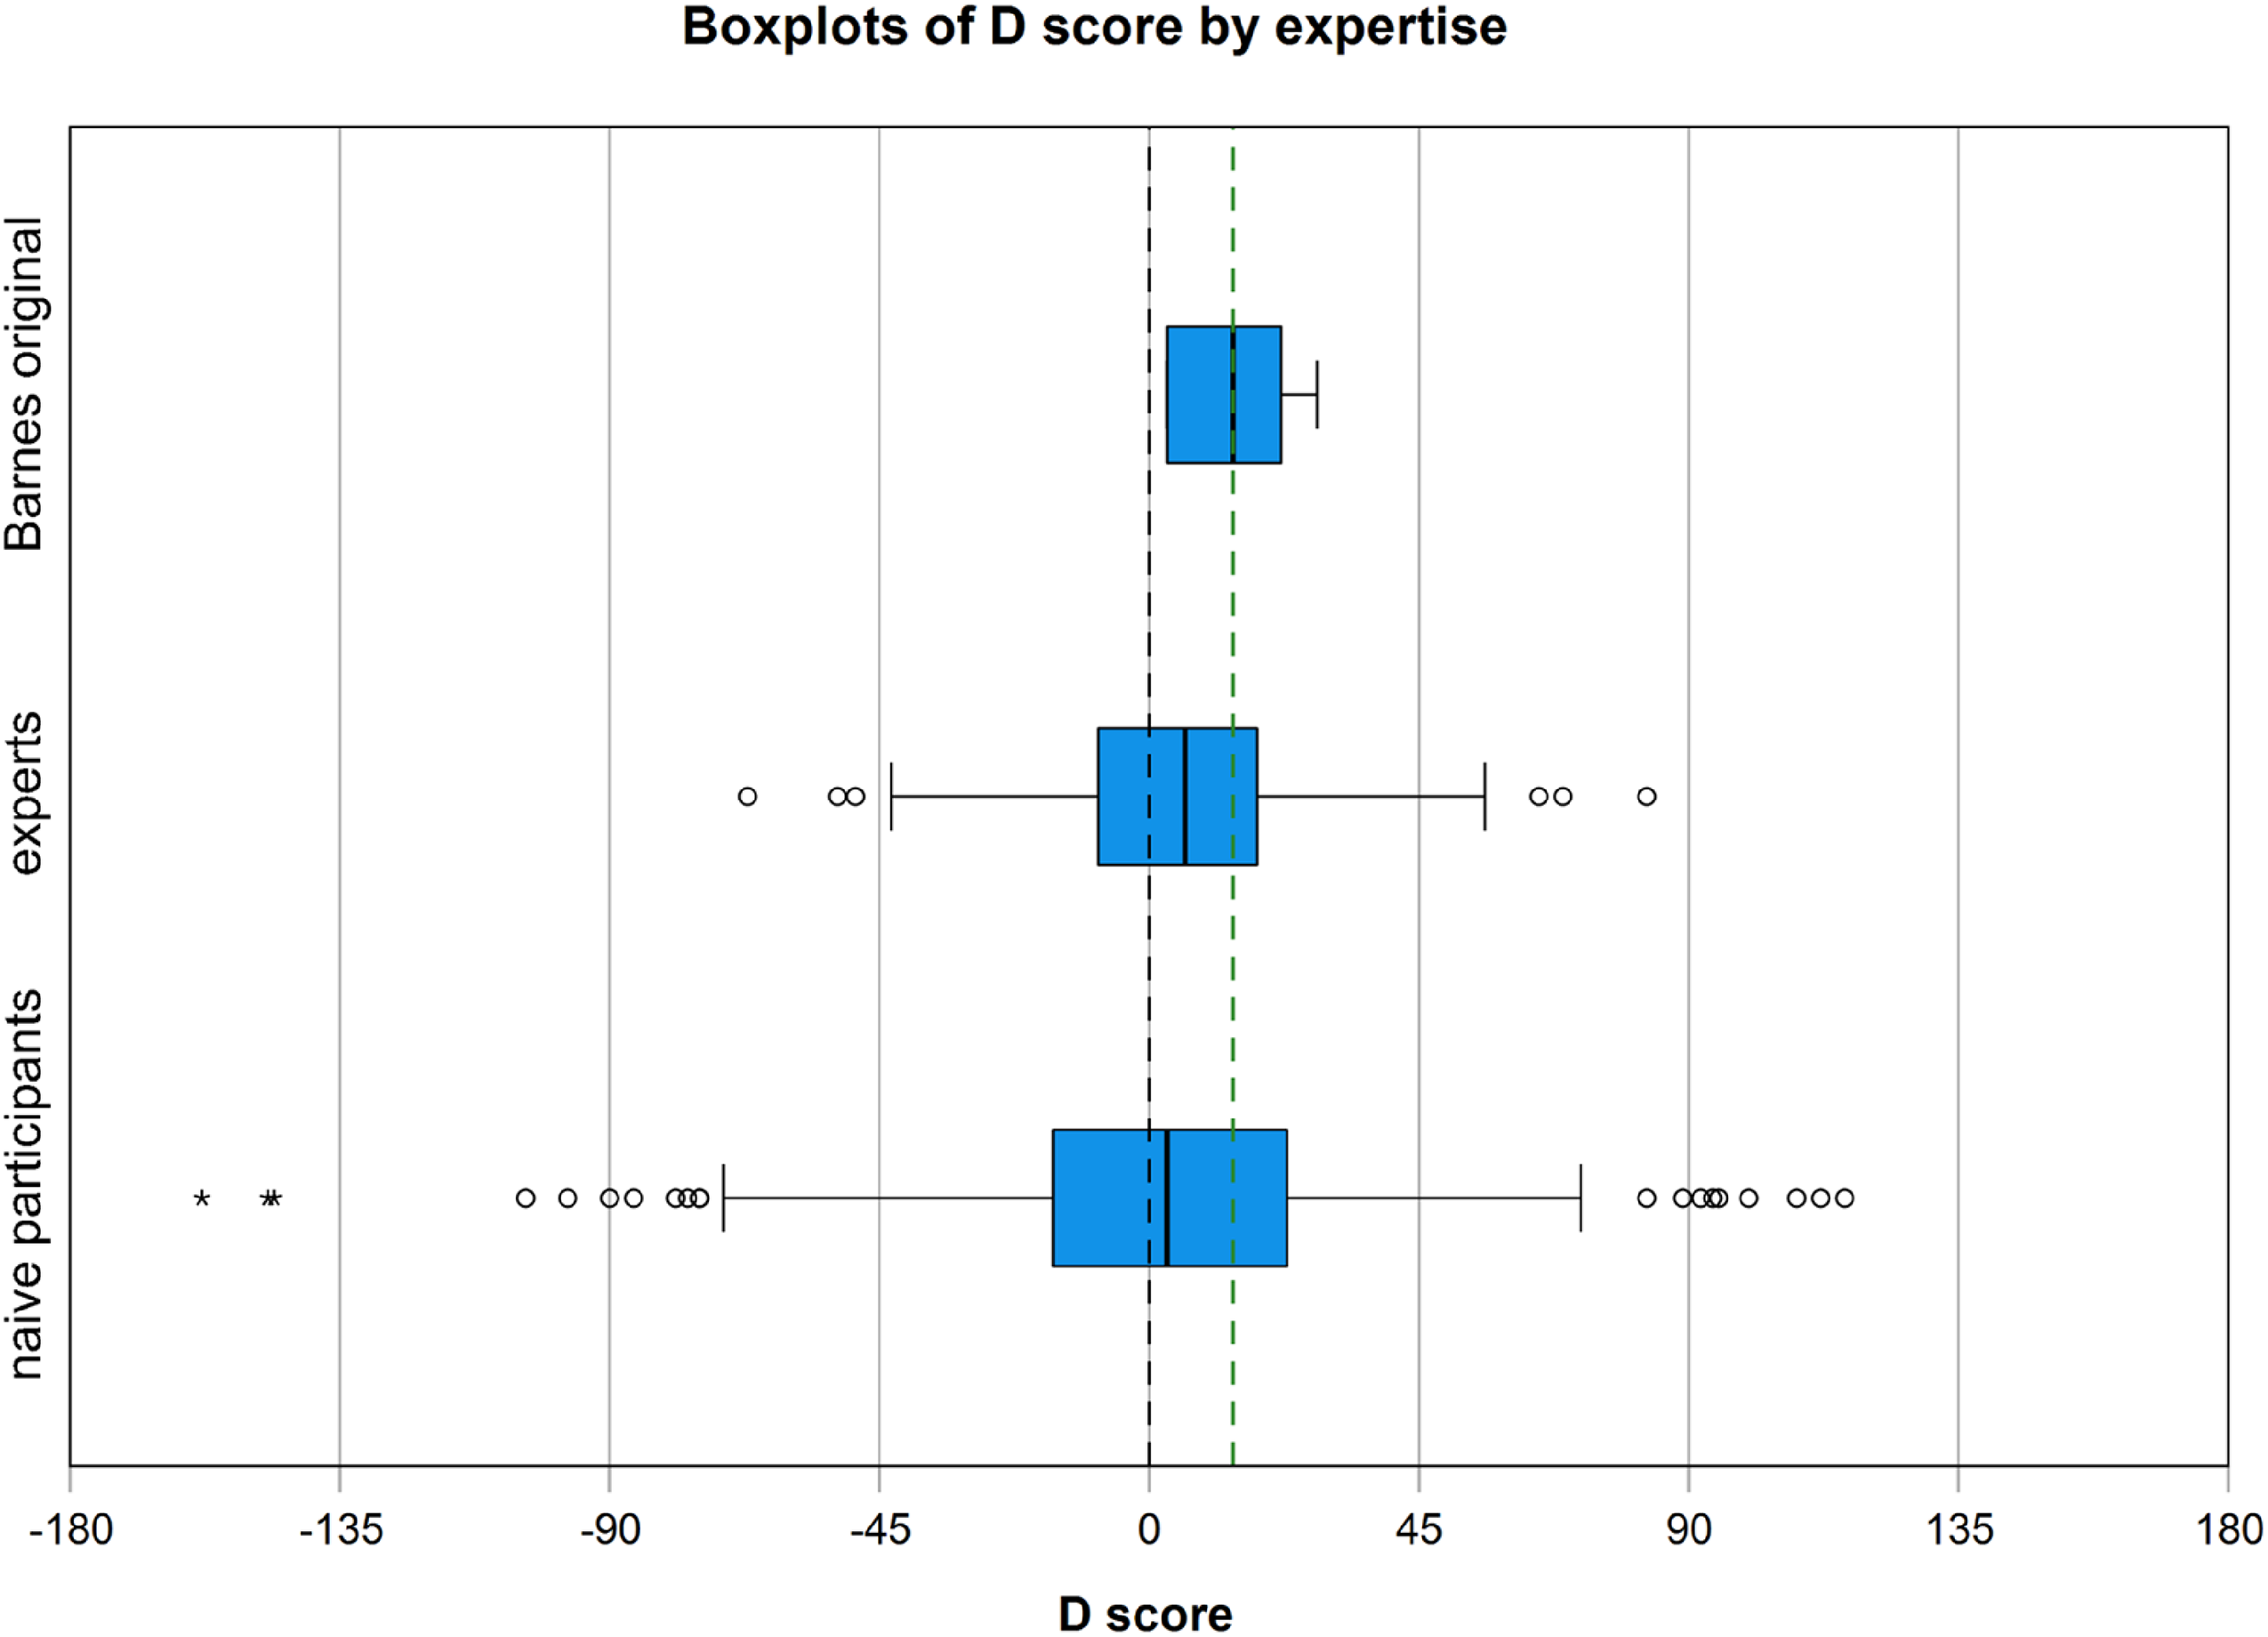
Boxplots illustrating D scores across all ensembles. The dotted black line marks the midline of the wall space. The dotted green line indicates the average D score of Barnes’ original ensembles on walls 1–5.
If both paintings of a pair are placed on a horizontal axis within a margin of 15 pixels, the pair was counted as “correctly” identified. The walls contain a total of 17 pairs (ranging from 2 to 4 per ensemble). Across all pairs, the average random baseline for placing the second painting within ±15 pixels from its partner painting within the respective wall space is 8.92% (range from 6.64% to 12.66% across all pairs). Across all participants, pairs were placed on a horizontal axis in 48.12% of cases (two-tailed one proportion Z-test, Z = 62.63, p < .001). The most frequently identified pair was matched in 80.33% of cases, the least frequently identified pair in 22.13% of cases. All 17 pairs are placed as such significantly above the random baseline. Table 3 sums up the match rates for all pairs per wall. Note that distance between paintings is not examined, and pairs that were placed diagonal or on a vertical axis are not counted here.
Proportion of Detected Pairs per Wall.
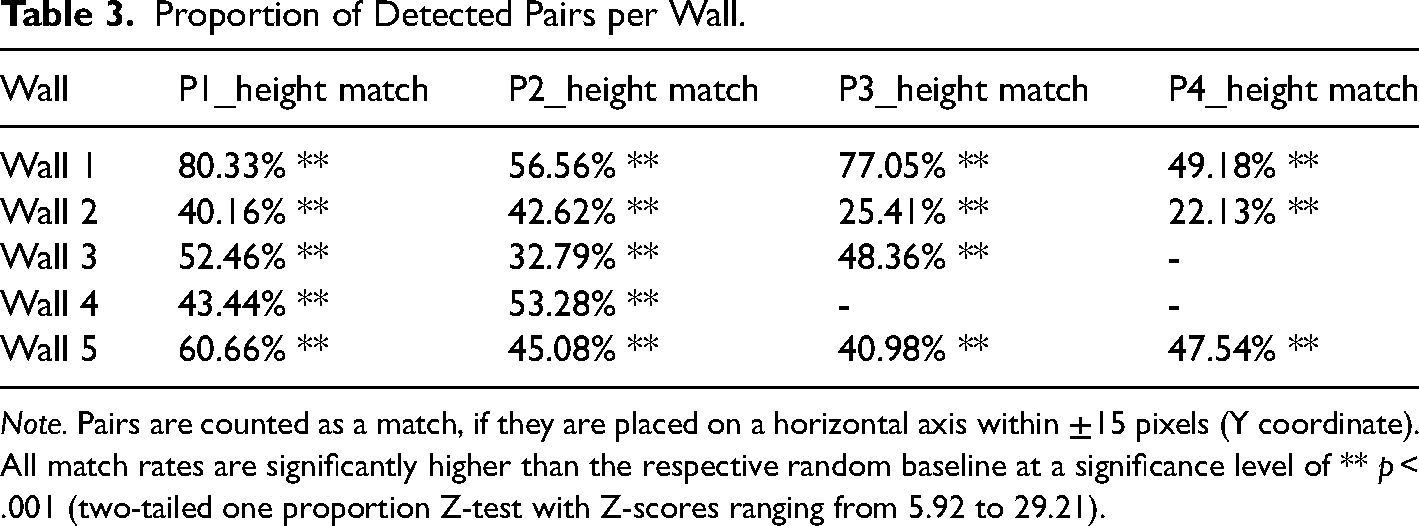
Note. Pairs are counted as a match, if they are placed on a horizontal axis within ±15 pixels (Y coordinate). All match rates are significantly higher than the respective random baseline at a significance level of ** p < .001 (two-tailed one proportion Z-test with Z-scores ranging from 5.92 to 29.21).
Experts place pairs on a horizontal axis more often than naive participants (54.68% vs. 46.25% of all cases, two-tailed two-proportion Z-test, Z = −3.143, p = .002). For two out of 17 pairs, the positive effect of expertise is significant on individual pair level. These results support H2A.
H2B: The recognized pairs retain their position (left vs. right).
Out of 998 “correctly” identified pairs that participants placed on a horizontal axis, the left-right arrangement was in accordance with Barnes’ original in 51.30% of cases (mere chance). Looking at the 17 pairs individually, only one was arranged in Barnes' original order more frequently (the large portraits on wall 1, two-tailed one proportion Z-test, Z = 3.84, p < .001) and one was placed opposite to Barnes more frequently (the nude portraits on wall 5, two-tailed one proportion Z-test, Z = −2.32, p = .02).
When looking at experts and naive participants separately, there is also no agreement with Barnes’ original left-right choices (50.62% vs. 51.52%). On an individual pair level, experts agree with Barnes left-right positioning for two out of 17 pairs (two-tailed one proportion Z-tests, Z = 2.04, p = .04; and Z = 2.18, p = .03). Naive participants agree for 1 out of 17 pairs (Z = 3.25, p = .001) and disagree with Barnes for 2 out of 17 pairs (Z = −2.13, p = .03; and Z = −2.29, p = .02). These results do not support H2B.
H3: The overall wall composition is well balanced toward the midline.
We compute the CoM that measures visual balance by analogy with a seesaw with a fulcrum at the balance center of the image. Visual weight is operationalized based on luminance with darker areas weighing more than brighter areas. For a detailed description of the CoM computation, see McManus et al. (2011B), Hübner and Fillinger (2016), or Thömmes and Hübner (2018). Importantly, here we focus on the horizontal deviation of the CoM from the physical midline to operationalize Barnes’ motif of left-right balance within his displays. We therefore subtract the x-coordinate of the CoM from the physical center of the wall space in Barnes’ ensembles to compute a distance (D) score. Perfect left-right-balance is reflected by a zero D score, negative D scores indicate an imbalance with more visual weight on the left-hand side of the wall space, positive D scores indicate relatively more dark (i.e., heavy) areas in the right half of the wall space. Figure 2 illustrates CoM and D computation.
We first investigate the CoM location of Barnes’ original ensembles for the five walls from Experiment 1. For two walls, the CoM was almost perfectly aligned with the physical center of the wall space (wall 4 and wall 5, both with a D score = 3, see Table 4 first column). For the three remaining walls, Barnes’ balance point is shifted slightly to the right, with D scores ranging from 14 to 28 pixels. Second, we computed average D scores across all participants for all five ensembles (Table 4, column 2). Comparing these D scores with Barnes’ original D scores as baseline produces significant differences in 4 out of 5 ensembles (wall 1–4, one sample t-test, two-tailed, t(121) range from 2.18 to 6.32, p < .05, Cohen's d = 0.20–0.57). Relative to Barnes’ D scores, the average D score of our participants is moved to the left on all walls.
Average Distance Scores (D) per Wall.
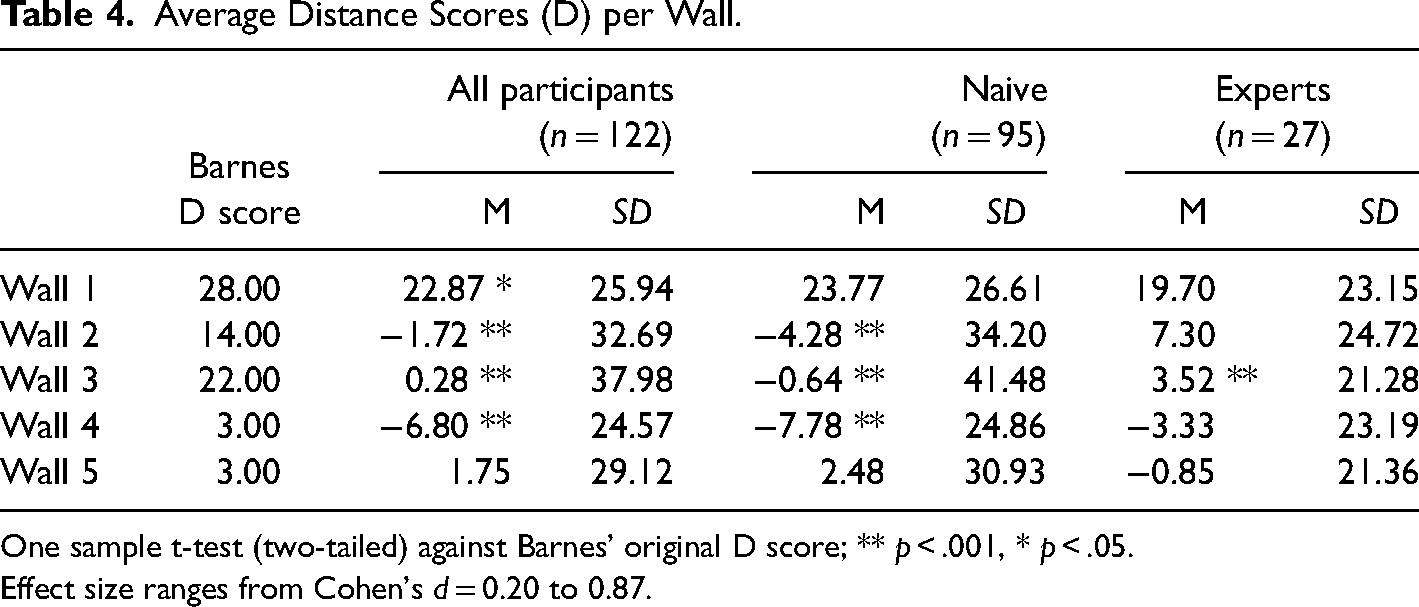
One sample t-test (two-tailed) against Barnes’ original D score; ** p < .001, * p < .05.
Effect size ranges from Cohen's d = 0.20 to 0.87.
When looking at experts and naive participants separately, average D scores are not significantly different between the two groups. In the naive group, for three out of five ensembles D scores are moved significantly toward the left relative to Barnes original hanging (Cohen's d ranges from 0.43 to 0.55). In the expert group, only one ensemble (wall 3) is balanced more toward the left (Cohen's d = 0.87). Table 4 sums up all results per wall as well as the differences based on expertise. Figure 6 illustrates aggregated data across all ensembles with boxplots of D scores across all participants. Compared to Barnes’ original walls, the average CoM of naive participants lies more toward the left, that is, closer to the center of the wall space. However, the difference is not significant (independent samples t-test, two-tailed, equal variances not assumed, p = .46). There is a tendency for experts to produce hangings slightly more similar to Barnes’ originals in terms of visual balance. Overall, there is a lot more variance in naive participants as compared to experts. The number of extreme outliers to both sides also indicates that for some participants, visual balance does not play much of a role, especially in the naive group. In total, 69% of hangings produced by naive participants versus 81% of expert hangings are balanced toward the midline of the wall space within a ± 30 pixel area around the physical center (two proportion Z-test, two-tailed, Z = 2.57, p = .01). These results support H3.
Discussion
In Experiment 1, we let participants create wall hangings in a method of production task and tested whether they apply three aesthetic motifs that are prominent in Barnes’ original displays. These motifs deal with (1) the special focus on particular paintings by placing them in the center of the wall; (2) the pairwise interplay between paintings that share a similar visual appearance and their left-right arrangement; and (3) a global balance of visual weight toward the midline of the wall space.
We found evidence to confirm the first hypothesis: Barnes’ original centerpieces are reproduced by a significant share of participants for all ensembles. For the main central painting (C1), this motif seems to be quite obvious for both experts and naive participants. For the smaller painting (C2), however, the central location is reproduced only by a small group of the naive participants. Experts on the other hand identify the central location for the smaller painting more frequently indicating that Barnes’ aesthetic motif of placing certain paintings in the center of an ensemble is understood in more detail by participants trained in the visual domain.
The pairwise arrangement of paintings is very prominent in Barnes’ original ensembles, and our results show that participants identify and apply this motif as well: Both naive and expert participants frequently reproduce Barnes’ horizontal pairs in their display. Again, the effect of expertise is significant with experts reproducing more horizontal pairs. The significant share of Barnes-like pair arrangement is especially meaningful considering the nature of the Method of Production task with almost infinite possibilities to arrange paintings on the available wall space. However, we found no evidence for agreement on left-right positioning of pairs across participants. Looking at all correctly identified pairs, the selected order on the wall is purely random. This is true for both naive and expert participants. However, this finding might be caused by limited painting resolution. This finding might be related to the observation that naive participants are often not able to discriminate between original and mirrored paintings (Blount et al., 1975). Within the ensemble photos, some paintings look very small, and content is hard to recognize. To verify that left-right-position in Barnes’ ensembles is not reproduced by present-day participants, one might need to collect more data in an experimental design where pairs of paintings are presented in a larger resolution.
Looking at visual balance as measured by the CoM, our data suggest that a distinct left-right equilibrium plays an important role for most experts (81% of their hangings) and also a majority of naive participants (69%). However, when directly comparing balance points of Barnes’ original walls with our participants, we found a systematic bias toward the left for four out of the five ensembles with today's participants creating hangings with balance points moved further to the left. This pattern might as well reflect a bias in Barnes’ original hangings that was not reproduced by our participants. In fact, on the investigated ensembles by Barnes, the centers of mass are always located slightly off the physical midline toward the right-hand side. Lastly, in applying visual balance as a motif, experts differ from naive participants. Experts on average create balanced ensembles similar to Barnes originals for four out of five walls, while naive participants recreate well-balanced compositions only for two walls. This hints in the direction of more similarity between Barnes and present-day experts with a trained eye.
Taken together, results from the method of production task underline some common ground in the production of wall hangings. Barnes’ motifs of a central piece and horizontal pairs in an overall well-balanced composition are reproduced by a significant share of participants and even more so by experts in the visual domain. The side-by-side arrangement of painting pairs was not reproduced, and left versus right positions were randomly distributed.
Experiment 2—Method of Choice
In the second part of the online study, we reduced the degrees of freedom and used Fechner's method of choice (Experiment 2). The idea here was to find out whether observers are able to detect the original painting from a selection of five suitable alternatives. Most of Barnes’ ensembles are built around one very prominent central painting (C1 in Experiment 1) that is why we decided to cut out this centerpiece and offer a range of false alternatives next to the original painting. In Supplemental Materials, Table S2 lists all ensembles and their corresponding alternatives for Experiment 2. The task of the participants was to detect the original painting and give a confidence rating (see Figure 7). Based on this data, we wanted to investigate the following hypothesis:
H4A: Participants are more likely to pick the original painting from a selection of suitable alternatives. H4B: Participants are more confident in their choices, when picking the correct painting.
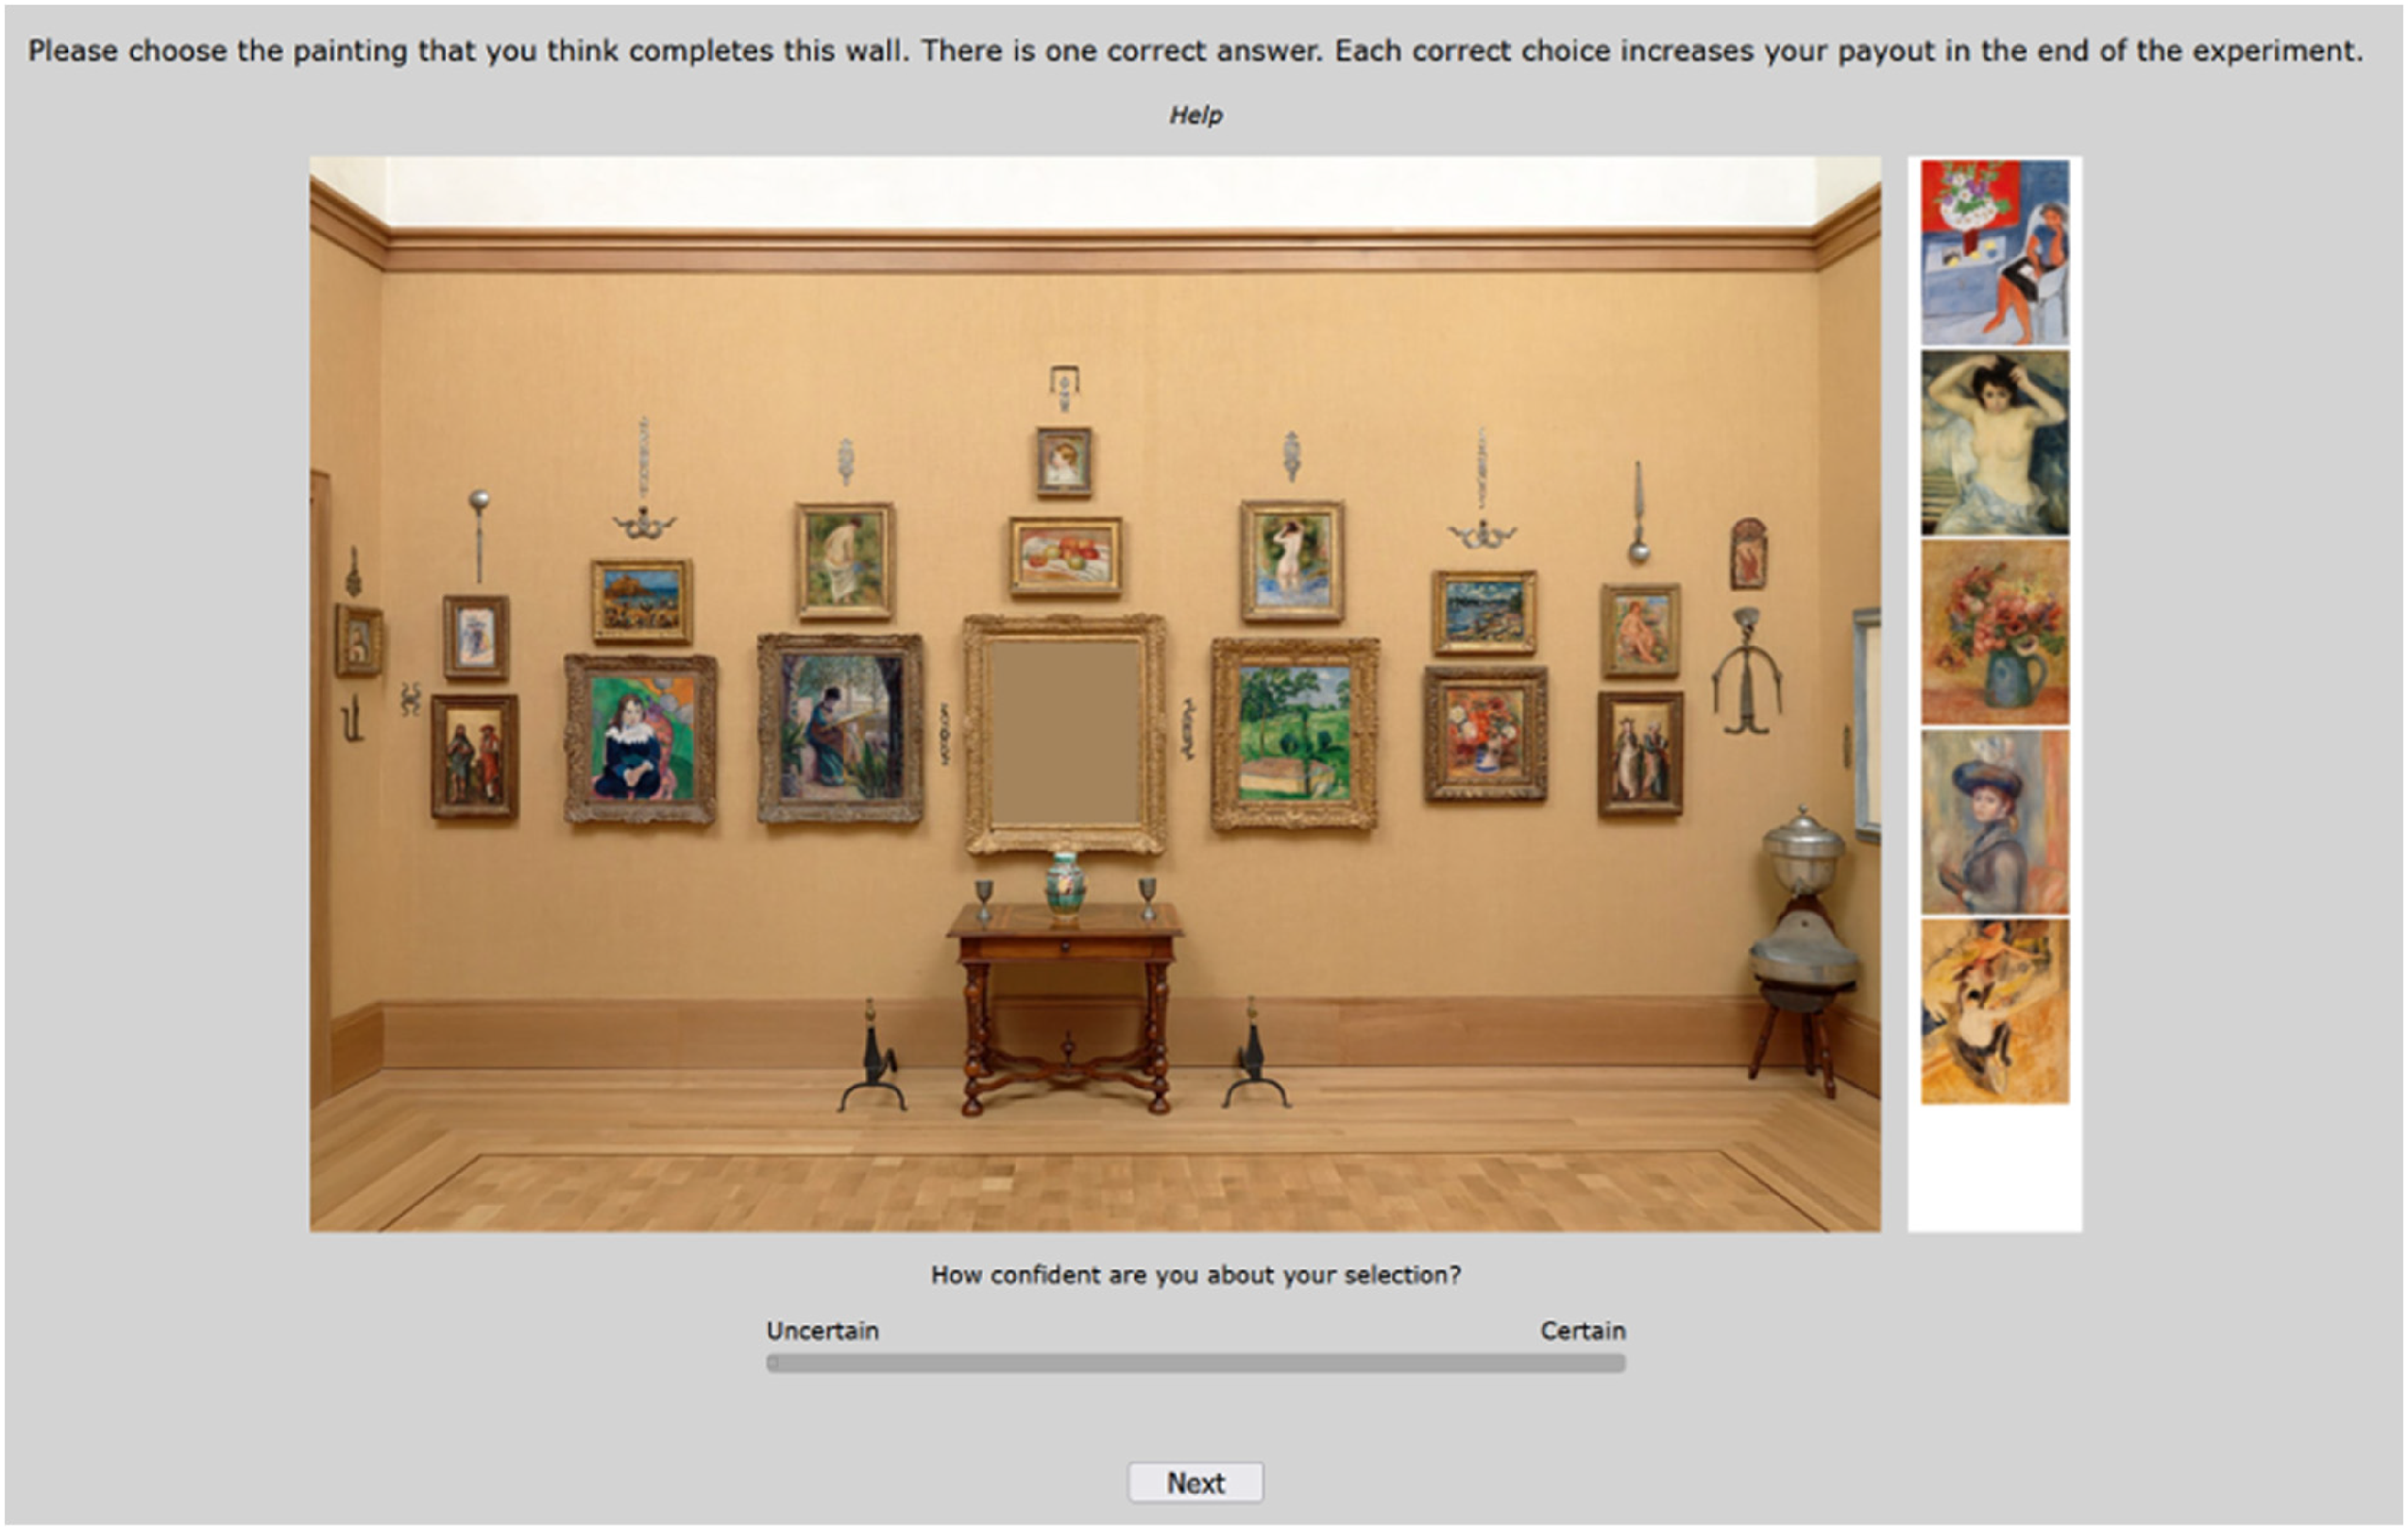
Method of choice screen in the online study (experiment 2). By clicking on the paintings in the selection area on the right-hand side, participants could swap the central painting as often as they liked. They then rated their confidence and confirmed their selection by clicking the “Next” button. The correct painting to complete this wall is the portrait by Pierre-Auguste Renoir at position 2 (see West Wall of Room 7 in the Supplemental Material Table S2).
As in Experiment 1, we also looked for effects of expertise.
Methods
Stimuli
For Experiment 2, we selected 20 ensembles including two that were already used in Experiment 1. As we wanted to offer participants five alternative paintings from the collection to choose from, we only included walls for which enough suitable paintings were available in the Barnes collection. The alternative paintings were selected based on the following criteria: First, the image ratio had to be identical with the original painting, because we kept the frame of the original painting on the wall and only swapped the painting itself as is illustrated in Figure 7. Paintings might, however, be of varying original size. Due to the high-resolution replica from the Barnes’ website, it was well possible to make small paintings look much larger within the ensemble photos presented in our experiment. Second, whenever possible we aimed for alternative paintings that hang in a central position in another ensemble. Third, we preferably chose paintings with similar content and color schemes to make the choice as difficult as possible. Fourth, we paid special attention to not include too many alternatives that stem from walls also included in the experiment, to ensure that participants could not base their choice on knowledge of other walls.
As in Experiment 1, all ensemble photos had a standardized size of 1024 × 700 pixels.
Naive and Expert Participants
Participants were the same as in Experiment 1, with some dropouts. A total of 115 participants, 26 experts and 89 naive participants, completed Experiment 2 (one expert and six naive participants dropped out).
Procedure
After participants completed the method of production task, they got instructions for the method of choice task. The ensembles and their corresponding painting selection were presented as illustrated in Figure 7, and the 20 ensembles were presented in randomized order. Also, the alternatives on the right-hand side were presented in randomized order. By clicking on one of the alternatives, participants could swap the central painting as often as they liked and had to confirm their final choice by clicking the next button. Before doing so, however, they also had to rate how confident they are with their choice on a continuous rating scale from “uncertain” to “certain” (scale range 1–100).
As an incentive to really aim for the “correct” painting, participants could earn extra money for each correctly identified painting. They received 0.20 € per correct choice, making a maximum of extra 4 € on top of the fixed compensation of 5 €.
Results
H4A: Participants are more likely to pick the original painting from a selection of suitable alternatives.
Before confirming their choice, participants swapped the central image on average six times (average swaps per participant range from 1 to 24). On an individual level, participants identified Barnes’ original painting with varying success, ranging from 2 to 15 matches out of 20 choices (M = 6.18, SD = 2.09; the random baseline is at four matches). Figure 8 illustrates the results of the forced choice task in Experiment 2 across all 115 participants for the 20 ensembles. Participants identified the original painting significantly above chance level for 9 out of 20 ensembles (green bars in Figure 8). On average, the original painting was picked in 30.91% of 2300 cases, which is above the 20% chance level (one proportion Z-test, two-tailed, Z = 13.08, p < .001). Both groups, experts and naive participants, select the correct painting significantly above the random baseline of 4 out of 20 (M_experts = 6.62 vs. M_naives = 6.06 out of 20; one proportion Z-test, two-tailed, experts: Z = 7.47, p < .001; naive participants: Z = 10.86, p < .001). There is a tendency for experts to correctly identify more paintings than the naive group; however, the difference is not significant (two proportion Z-test, two-tailed, p = .22).
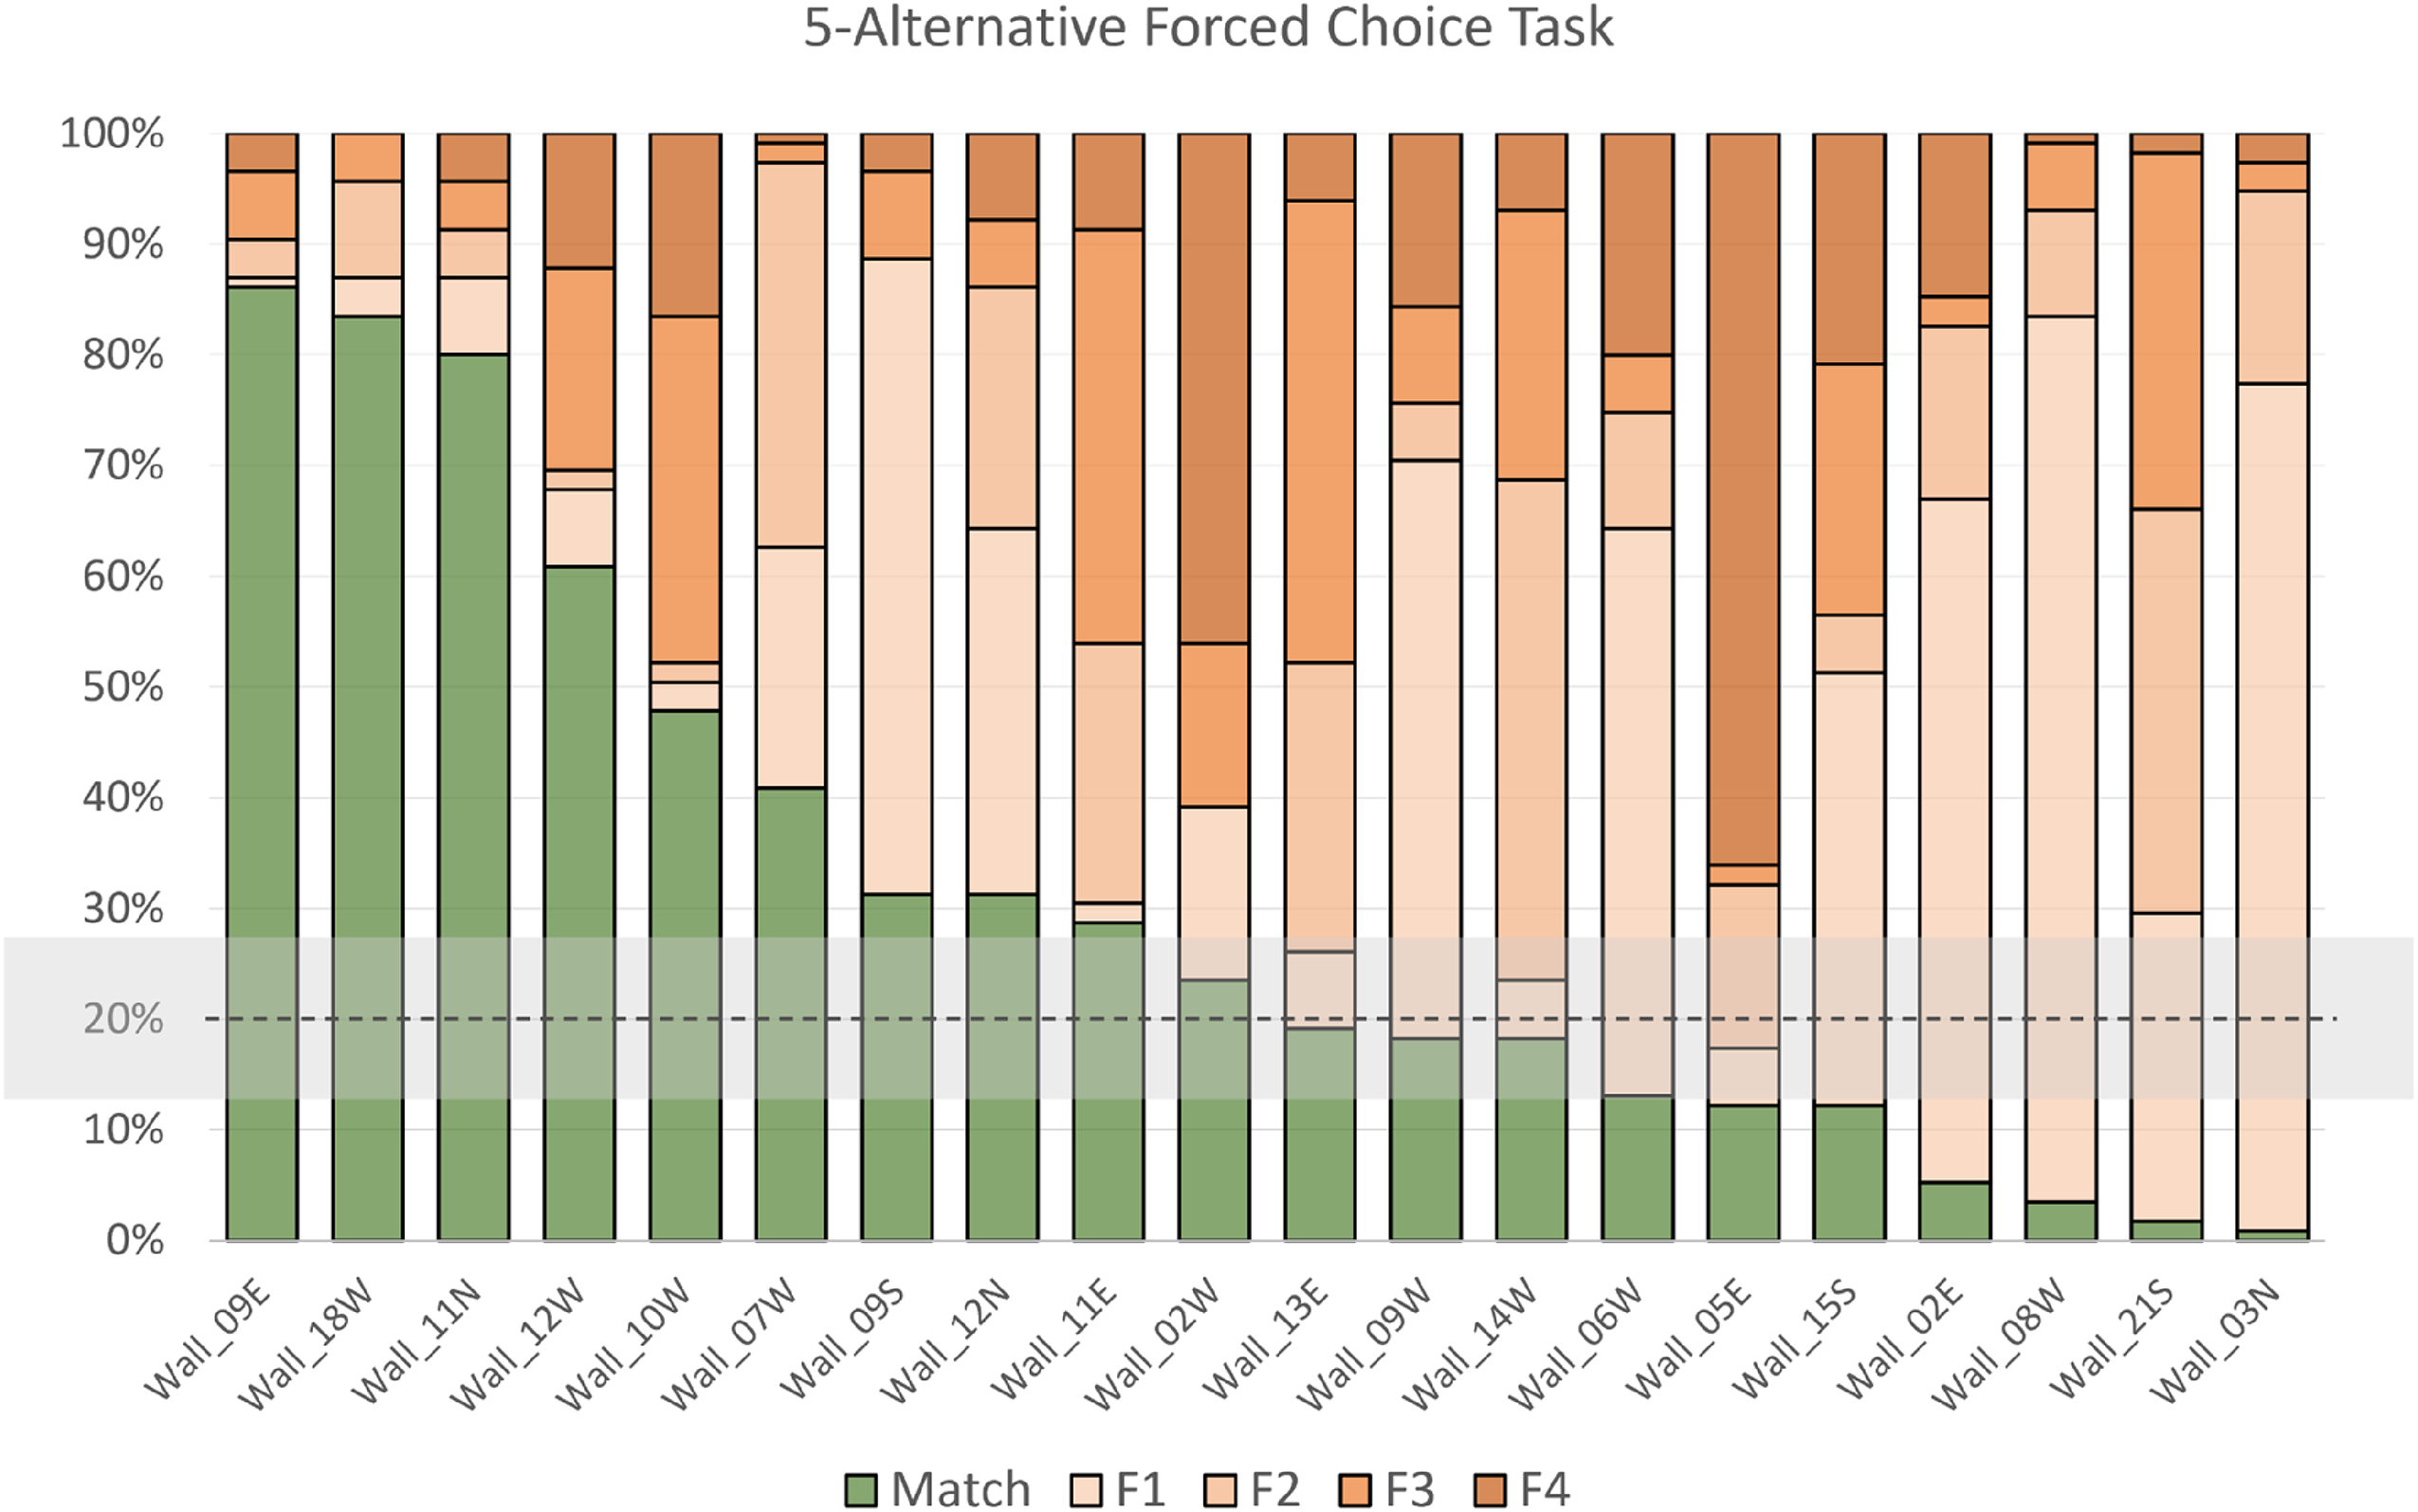
Selected paintings in the method of choice task. Green bars indicate correct choices of Barnes original painting. F1–F4 indicate false alternative paintings. Purely random selection is indicated by the dotted 20% line with the 95% confidence interval illustrated by the gray area.
Looking at the graph in Figure 8, it becomes obvious that the five alternative paintings are not selected to equal proportions. There are three general patterns in the data. (1) For three ensembles, there is one favorite painting and all other alternatives are selected significantly below chance level (i.e., <12.70%; at two-sided alpha 5%). For all of these walls, the wall favorite is also Barnes original. (2) For 11 ensembles, there is only one of the alternative paintings selected significantly above chance level (i.e., >27.30%; at two-sided alpha 5%). For all but one of these walls, the wall favorite is not Barnes original, but a false alternative. (3) For the remaining six ensembles, more than one painting was selected significantly above chance (5× two alternatives, 1× three alternatives). These results suggest that in most cases, participants agree on one wall favorite, however, for most ensembles this favorite is a false alternative.
This general pattern changes only slightly, if we look at experts only: Two more ensembles have one absolute favorite painting (1), and two fewer ensembles have more than one wall favorite (2) indicating that experts agree slightly more than naive participants with one another.
Eight of the paintings were presented as alternatives for more than one ensemble as both correct and false alternatives. Based on this data, we did an additional analysis to see whether paintings are chosen more frequently for the original ensemble as compared to a false alternative. In fact, all of the paintings were chosen more frequently on the correct wall, with an average selection rate of 43.70% on original walls versus 15.65% on false alternative walls. Figure 9 sums up the results. Looking at expert and naive participants separately, there are no systematic differences in this analysis. Central paintings are more likely to be selected for their original ensemble as compared to a false alternative ensemble.
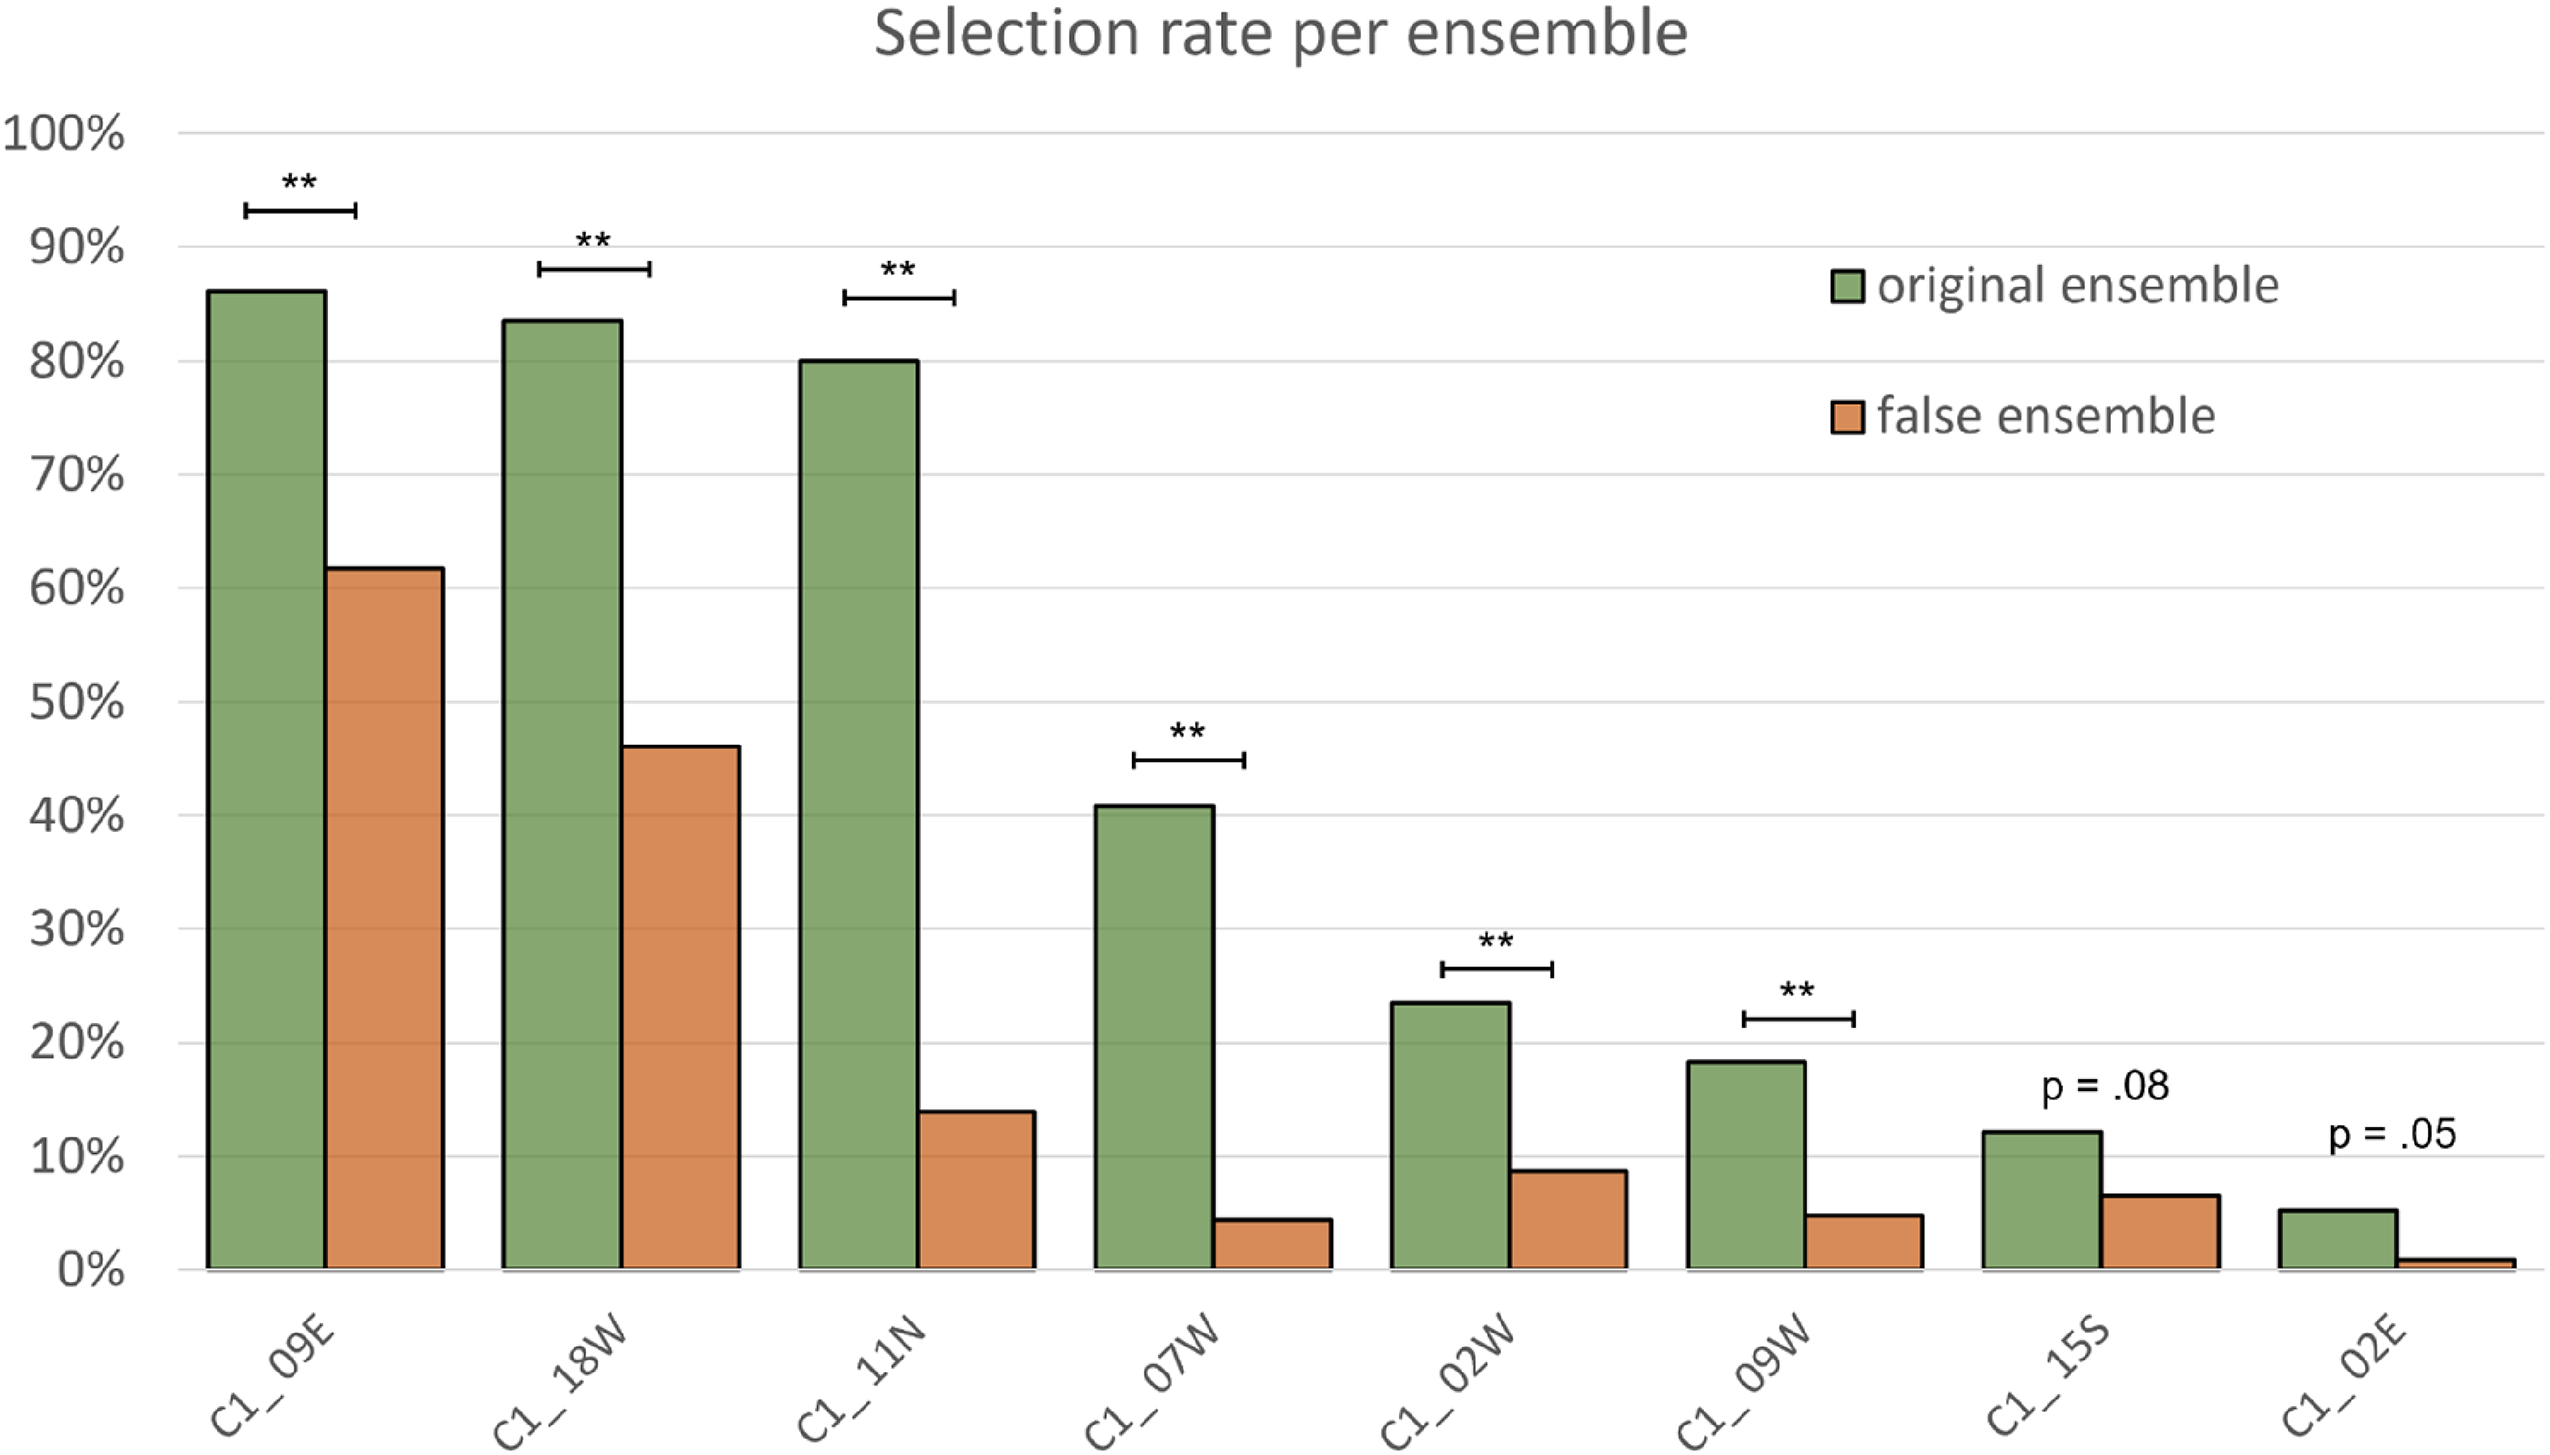
Selection rates for central paintings (C1), which were presented as both matches and false alternatives for different ensembles. Two-proportion Z-test (two-tailed), * p < .05 and ** p < .01.
Taken together, all of these results support H4A.
H4B: Participants are more confident in their choices, if picking the correct painting.
For all 20 walls, participants also rated their confidence to have correctly identified Barnes’ original painting. The average confidence across all 2300 choices was 54.14 (SD = 25.57). Scale use includes both ends of the scale (min = 1 and max = 100). The ratings are roughly normally distributed with a small cluster of ratings at the high end (5.3% of cases get ratings above 95 vs. 2.3% with low ratings 1–5). Overall, confidence levels suggest that the task is perceived as rather ambiguous. For only a very small proportion of choices, participants are highly confident to have selected the correct painting.
Computing average within subject confidence scores still reveals a wide range with a minimum score of 9.05 and a maximum score of 99.65 (M = 54.14, SD = 17.74). Experts are significantly more confident in their choices than naive participants (M = 60.33 vs. M = 52.23, independent samples t-test, two-tailed; t(2298) = 6.33, p < .001) with a Cohen's d effect size of 0.32.
Computing average confidence scores per ensemble largely reduces the overall variance (SD = 5.88) with a minimum confidence score of 44.24 for the west wall in room 6 and a maximum score of 66.03 for the north wall in room 11 (see Supplemental Material Table S2 for more information on those walls). Even for the east wall in room 9, where 86% of participants chose the correct painting, confidence ratings only reach an average score of 58.06. Absolute confidence ratings for the 20 ensembles are always slightly higher in the expert group; significant differences (independent samples t-test, two-tailed p > .05) are found for five ensembles.
We now compare confidence scores between correct and wrong choices in a within-subject analysis. We compute two confidence scores per participant, one for matches and one for mismatches. Participants are significantly more confident when choosing the correct painting versus a false alternative (Mean difference = 5.21, SD = 11.36; paired samples t-test, two-tailed; t(114) = 4.92, p < .001, Cohen's d = 0.46). The effect is stronger in experts (Mean difference = 7.49, SD = 11.79; Cohen's d = 0.64) than in naive participants (Mean difference = 4.55, SD = 11.21; Cohen's d = 0.41). These results support H4B.
Additional analyses without a-priori hypotheses:
Based on the observation that for most ensembles there are one or two obvious group favorites, we also compare confidence ratings for paintings that have been selected as the absolute group favorite versus the rest. In total, 56.17% of all choices fall onto group favorites. Again, we compute two confidence scores per participant for both cases, respectively. Individuals are significantly more confident when choosing paintings that are favorite choices across all participants (Mean difference = 8.84, SD = 9.09) versus picking rare choices (paired samples t-test, two-tailed; t(114) = 10.43, p < .001, Cohen's d = 0.97). For naive subjects, confidence ratings are higher for group favorites in the naive group (paired samples t-test, two-tailed; t(88) = 8.08, p < .001) with an effect size of Cohen's d of 0.86. In the expert group, the same pattern is present with an even stronger effect size Cohen's d of 1.19 (paired samples t-test, two-tailed; t(25) = 6.04, p < .001).
A second additional analysis deals with the original size and location of alternative paintings that were presented in part 2. Half of the 100 alternative paintings (20 ensembles × 5 alternatives) stem from the periphery of original Barnes’ ensembles, and the rest was originally placed in the center. This is confounded with painting size, as most often central paintings are much bigger than peripheral paintings. In fact, we found a significant correlation between pick rates and painting size (in m²) of Pearson r = 0.25 (p < .001). This is interesting, as of course in the online experiment, we presented smaller and bigger paintings in the same pixel dimensions. Based on this insight, we also run an analysis to compare confidence ratings for paintings that are original centerpieces versus paintings that are placed in the periphery of a wall in the original Barnes collection (see Supplemental Material for information on all paintings used as alternatives). In total, participants chose central alternatives more frequently than alternatives that stem from the periphery (61.17% of cases). When choosing a central alternative participants are more confident as compared to choosing peripheral alternatives (Mean difference = 5.04, SD = 9.21, paired samples t-test, two-tailed; t(114) = 4.71, p < .001, Cohen's d = 0.44). In the expert group, the difference is larger with an average within-subject difference of 5.21 (SD = 11.09; t(25) = 2.39, p = .02, Cohen's d = 0.47) compared to the naive group (Mean difference = 3.71, SD = 8.62; t(88) = 4.06, p < .001, Cohen's d = 0.43). Table 5 sums up effect sizes for all group comparisons.
Effect Sizes of Confidence Ratings Comparing Experts with Naive Participants, and Matches Versus False Alternatives, Group Favorites Versus Others, and Central Paintings Versus Alternatives from the Periphery of Another Ensemble.
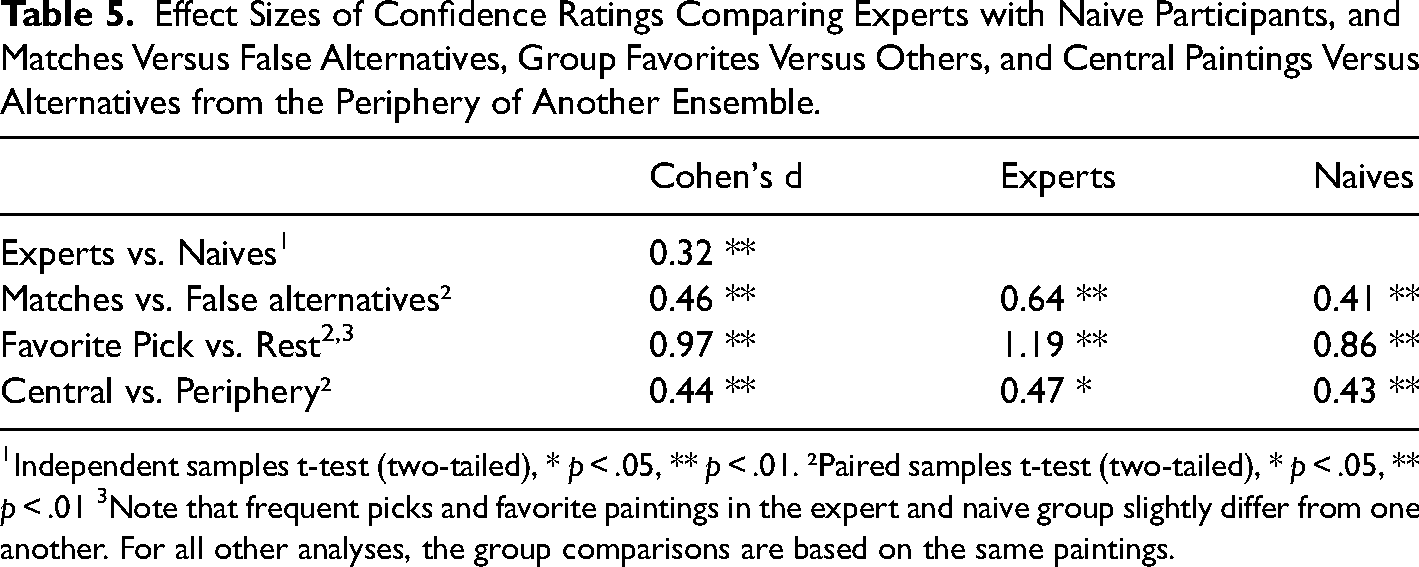
Independent samples t-test (two-tailed), * p < .05, ** p < .01. ²Paired samples t-test (two-tailed), * p < .05, ** p < .01 3Note that frequent picks and favorite paintings in the expert and naive group slightly differ from one another. For all other analyses, the group comparisons are based on the same paintings.
Discussion
In Experiment 2, we used Fechner's method of choice and asked participants to complete a wall by identifying the original painting from a selection of five alternatives. We tested whether participants were able to identify the correct painting and gave them a financial incentive by paying extra money for every correct choice. In addition, participants’ confidence ratings let us investigate whether the task of choosing Barnes’ original was perceived as straightforward or ambiguous.
Results show that participants select Barnes’ original paintings significantly above chance, with a tendency for experts to do so more frequently than naive participants. Obviously, pick rates largely depend on our selection of alternatives. We tried to make the task rather difficult and average confidence ratings far below the high end prove our efforts to be successful. Experts are generally more confident than naive participants, but still close to the center of scale range. While such medium confidence levels suggest the task to be perceived as rather ambiguous, pick rates for the five alternatives are far from being equally distributed. For most ensembles, there is one clear group favorite (with group favorite pick rates ranging from 33% to 86%, M = 56%, SD = 17%). Participants are also more confident when choosing group favorites as compared to other alternatives, the effect being twice as large as the effect for picking Barnes originals (Cohen's d of 0.97 vs. 0.46). Both effects are larger in the expert as compared to the naive group.
An interesting exploratory finding is an effect of the original location of a painting with central paintings generally being selected more confidently than paintings that Barnes put in the periphery of his wall spaces. Furthermore, central paintings that have been presented as both correct and false alternatives on different ensembles, pick rates are always higher for Barnes original ensembles.
Taken together, results from the method of choice task indicate that there is much agreement among participants even though the task itself is considered as rather difficult. Experts are generally more confident in their choices and also more successful in identifying the correct alternative as compared to naive participants.
General Discussion
The aim of the present study was to investigate whether there is an inherent truth in the visual presentation of the Barnes collection—the lifework of Albert Barnes. Do present-day participants, either naive or sophisticated in the field of visual art, reproduce similar displays in a method of production task (Experiment 1), and correctly identify original paintings in a method of choice task (Experiment 2)?
Our results indicate that there is some inherent timeless truth in the way Barnes’ designed his wall hangings. Experiment 1 showed that our participants applied some of the motifs that characterize Barnes’ gallery—even when the task itself leaves ample creative latitude. Participants implement a special focus on a central piece, pairwise arrangement of intrinsically related paintings, and a globally well-balanced composition. Results of Experiment 2 emphasize two things: First, today's participants are able to identify Barnes’ originals from a selection of suitable alternatives above chance, and, overall, they select paintings with surprisingly high agreement. Second, high agreement for wall favorites is paired with only medium confidence ratings suggesting that the task of “selecting the right painting” is perceived as ambiguous. Agreement, thus, is based on decisions that are intuitively “felt” rather than cognitively deduced.
Additionally, both experiments provide evidence for a positive effect of expertise suggesting that a trained eye is better at deciphering Barnes’ motifs. Previously, it had been shown that experts tend to be more interested in viewing artworks (Silvia, 2013), and rate artworks higher in the categories beauty and wanting (Van Paasschen et al., 2015). One might speculate that because of their interest in and appreciation of visual artworks, experts do possess a higher aesthetic sensitivity as described by Myszkowski and Zenasni (2020). This could make them also more sensitive to the underlying motifs in Barnes displays.
It is important to mention some limitations of our study. For both experiments, while keeping the scale of reproduction constant across all parts of the study, there were significant limitations in the resolution of each painting. Reducing entire museum walls to a computer screen comes with losses. Hence, all results are based on the overall appearance of the walls rather than on fine details within the individual paintings. Moreover, the analysis of visual balance in Experiment 1 is based on strongly simplified black-and-white versions of the actual displays and is thus merely dealing with painting location and size. Future research might use the so-called Mooney images (two-tone black and white conversions) that are able to capture the visual weight of content and style within the individual paintings.
Now that we found some common ground in the arrangement of paintings in museums: What are the underlying rules that both Barnes and our sample of expert and naive participants apply in designing wall hangings? The analysis of visual balance hints in the direction that formal features play an important role—independently of the content. More in-depth analyses of image features might shed light onto the formal relation of the artworks in Barnes’ ensembles, and how they affect wall composition of our participants. The Barnes collection and its online replication offers great potential to investigate the exhibition space and its aesthetic appeal both in highly controlled lab experiments and in real-world museum studies. We hope that our findings encourage future research to address more questions on exhibition design and wall arrangements of paintings in galleries and museums. Leveraging the unique display of artworks in the Barnes Foundation is one way to do so. In the spirit of Barnes himself, such research could produce valuable insights into the education and aesthetic appreciation of the fine arts.
Supplemental Material
sj-docx-1-art-10.1177_02762374241252108 - Supplemental material for Is There a Timeless Truth for Good Arrangement of Paintings in Art Galleries and Museums? An Experimental Investigation of the Barnes Collection
Supplemental material, sj-docx-1-art-10.1177_02762374241252108 for Is There a Timeless Truth for Good Arrangement of Paintings in Art Galleries and Museums? An Experimental Investigation of the Barnes Collection by Katja Thömmes, Ronald Hübner and Gregor U. Hayn-Leichsenring in Empirical Studies of the Arts
Footnotes
Acknowledgments
The authors thank Annabell Diem and Ralf Bartho for their help with preparing the stimuli for the online experiment and analyses. The authors thank Christoph Redies for discussion and expert comments on the manuscript. The authors also thank William Perthes from the Barnes collection for allowing them to reproduce photos from the Barnes’ online collection throughout this paper.
Authors’ Contribution
Conceptualization: KT and GH; Experimental design, stimulus preparation, data collection: KT; Software: RH; Data collection: KT; Data analysis and visualization: KT; Original draft preparation: KT; Manuscript review and editing: GH, RH, and KT. All authors read and agreed to the published version of the manuscript.
Data Availability Statement
Declaration of Conflicting Interests
The authors declared no potential conflicts of interest with respect to the research, authorship, and/or publication of this article.
Funding
The authors received no financial support for the research, authorship, and/or publication of this article.
Supplemental Material
Supplemental material for this article is available online.
Author Biographies
References
Supplementary Material
Please find the following supplemental material available below.
For Open Access articles published under a Creative Commons License, all supplemental material carries the same license as the article it is associated with.
For non-Open Access articles published, all supplemental material carries a non-exclusive license, and permission requests for re-use of supplemental material or any part of supplemental material shall be sent directly to the copyright owner as specified in the copyright notice associated with the article.