
Abstract
Mental imagery differs markedly between people, with research tentatively identifying three categories, namely aphantasia, mid-range imagery, and hyperphantasia. Further, aphantasia poses interesting questions as to how people with low imagery experience reading. Accordingly, we used Latent Profile Analysis (LPA) on a sample of adults (n = 287) to see what distinct imagery profiles exist empirically. Second, we tested different imagery profiles for associations with different reading enjoyment and absorption experiences. The online correlational study asked participants to complete measures including the Vividness of Visual Imagery Questionnaire (VVIQ-2), the Story World Absorption Scale, and a measure of reading enjoyment. LPAs were run to identify imagery profiles and correlations were run with reading enjoyment and absorption. Results of the LPA validate the existence of three profiles. All groups reported moderate to high enjoyment and absorption, however, significant group differences existed between the lowest and highest imagers. Future research needs to better understand what these experiential differences are and how they may or may not affect reading ability.
“Picture this’’ is a phrase so commonly used that there is both a band and a game show with the same name. This is not surprising as mental imagery, specifically visual mental imagery, is an experience often assumed to be common to all. Indeed, some even claim that it is necessary for the completion of certain everyday tasks that require an individual to assess and predict the outcome such as, fitting one object into a specific space (Moulton & Kosslyn, 2009) – or for transportation into a good story (Green & Brock, 2002). Within the past decade, however, there has been a large shift in the understanding of imagery subsequent to the identification of a subpopulation who report experiencing no mental imagery whatsoever, termed aphantasia (Zeman et al., 2015).
Research on aphantasia indicates three general groups of imagers: hyperphantasics/high imagers, phantasics/mid-range imagers, and aphantasics (Bainbridge et al., 2021; Dance et al., 2022; Zeman et al., 2015, 2020). Previously, scores on the Vividness of Visual Imagery Questionnaire (VVIQ/VVIQ-2, Marks, 1973, 1995) have been used to group subjects into one of the three aforementioned groups; however, to date these groupings have not yet been based on any sort of class analysis to validate these imagery profiles, which may ultimately lead to miscategorisation. Therefore, the primary purpose of this study is to use a Latent Profile Analysis (LPA) to validate the commonly assigned groupings of imagery based on the VVIQ and VVIQ-2 (Marks, 1973, 1995). Additionally, as mental imagery is commonly assumed to be triggered by, and used in, reading (Sadoski & Paivio, 2004; Zwaan & Radvansky, 1998), examining reading experience as a function of potential imagery profiles will provide insight into both aphantasia and reading, as well as possible interactions between the two.
Mental Imagery Research
Before discussing individual differences pertaining to the spectrum of visual mental imagery experience on which a person may fall, we first define mental imagery. Mental imagery is commonly defined as internal sensory-like representations experienced without direct external stimuli (J. Pearson et al., 2015). Mental imagery is thought to draw on or be created from prior perceptions and memories, leading to a subjective re-experiencing of a copy of the original objective stimuli, (J. Pearson et al., 2015). Controversy exists on whether mental imagery is necessarily conscious (Brogaard & Gatzia, 2017) and voluntary (J. Pearson, 2019), with mixed findings on whether involuntary imagery is preserved in those reporting no imagery (see Krempel & Monzel, 2024). However, because we are interested in people's conscious experience of reading in relation to their experience of imagery, it follows that we operationalize imagery as a conscious process. Accordingly, for the purposes of this paper, we operationalize mental imagery as the conscious experience of sensory stimuli, often in their physical absence, which likely varies within and between individuals in terms of whether imagery can be voluntarily invoked, passively experienced, or not consciously experienced at all.
It is now understood that there is a considerable range of difference as to how, if, and to what extent individuals can consciously or voluntarily experience these sensory-like representations. These individual differences have prompted the coining of terms such as aphantasia and hyperphantasia (Zeman et al., 2015), anauralia (Hinwar & Lambert, 2021), and dysikonesia (Dance et al., 2021). Although all refer to the same idea of mental sensory representations this paper uses hyperphantasia and aphantasia exclusively to discuss vividness of mental images.
Neuroscientific Approaches to Mental Imagery
An additional wave of research in the early 2000s investigates neural activity during mental imagery tasks, attempting to map areas of the brain that may be activated when mental imagery is used (Kosslyn et al., 2006; J. Pearson & Kosslyn, 2015; Pegna et al., 1997). Mental imagery through the lens of neuroimaging has also focused on understanding the areas of activation with regards to visual mental imagery so as to understand their potential link to cognitive functions (Dijkstra et al., 2019; Dijkstra et al., 2017b, 2019; D.G. Pearson et al., 2013, 2015; Winlove et al., 2018).
Generally, mental imagery is considered to be a top-down process, meaning that it can be voluntarily evoked (Dijkstra et at., 2017b; J. Pearson, 2019). However, interest in understanding the neurological processes involved remains. Some neuroscientific findings indicated that the vividness of mental imagery is connected to activity in the early visual areas (Dijkstra et al., 2019; J. Pearson et al., 2015). Dijkstra et al. (2017a) also identified fluctuations in vividness of imagery to corresponding activity across a broad network of neural areas, including the visual, parietal and frontal areas. However, a recent meta analysis (Spagna et al., 2021) suggests that the correlational relationship found between vivid mental imagery and early visual areas in the aforementioned studies is contrasted with evidence from Bartolomeo (2002) and Bartolomeo et al. (2020), who present findings that visual imagery remained intact in patients with damage to the early visual regions. Given these conflicting findings, Spagna et al. (2021) call for a reappraisal of the current neurological models of vividness of visual imagery.
Links between Mental Imagery and Reading
There has seemingly been a common assumption that mental imagery is both an ability and experience which is available to all and which is at the very least helpful and perhaps even necessary for the completion of certain cognitive tasks. One such area which often implicates mental imagery in the cognitive process is reading. Two key theories of reading comprehension, namely the Dual Coding Theory of reading (DCT) (Sadoski & Paivio, 2004) and the Situation Model of language and memory (Zwaan & Radvansky, 1998) make mention of imagery as a part of the reading process. Though neither of these theories explicitly focus on visual mental imagery and its exact role or its importance, both indicate that for some people under some conditions, imagery is a key aspect of the reading experience. Studies have shown that visualisation skill, which an individual may use more or less effectively, is a meaningful if not essential part of the reading process depending on the content (Busselle & Bilandzic, 2009), and on how the reader was instructed to approach the material (Mak et al., 2020).
For instance, De Koning & van der Schoot (2013) discuss the importance of mental imagery in reading comprehension in an extensive review of past literature and encourage educators to promote visualisation strategies as a way of improving comprehension in students. Studies which have linked mental imagery and reading have investigated how imagery can be used as a tool for promoting comprehension (De Koning & van der Schoot, 2013; Leopold et al., 2019), as well as whether mental imagery predicts reading comprehension performance (Suggate & Lenhard, 2022). There have also been links drawn between mental imagery and its relation to absorption/engagement in a story (Bilandzic & Busselle, 2008; Green & Brock, 2000; Kuijpers et al., 2014; Magyari et al., 2020; Speed et al., 2024). In addition, Mak & Willems (2021) provide a comprehensive recapitulation of past studies and reading theories and their connection to mental simulation and mental imagery. They posit that
Given recent insights into aphantasia, it seems reasonable to wonder if all of the students were in fact employing the same strategies. Some research has even analysed how certain mental imagery experiences may be more or less effectively stimulated when reading based on the sense to which it appeals (Klin & Drumm, 2010). One study, Wicken et al. (2021) noted that when reading scary texts, aphantasics have a dampened emotional and physiological response to the material. This finding suggests that the aphantasic/low-imager experience of reading may be different than that of someone who uses images as a part of their reading process. Finally, a recent study by Speed et al., (2024) found that the reported experience of reading a short story was different between aphantasics/low-imagers and those with mental imagery.
Aphantasia: Definition and Classification
In terms of understanding mental imagery and how it links to cognition, the formalisation of the definition and identification of aphantasia in individuals is significant. Aphantasia has many slightly differing definitions (Blomkvist, 2023). For instance, Zeman et al. (2015) define aphantasia as “reduced or absent visual imagery”, whereas Keogh and J. Pearson (2018) define it as an “inability to create visual images in one's mind.” Crucially, given uncertainty as to whether aphantasia is a lack of imagery or a lack of awareness of it, Nanay (2021) defines aphantasia as a lack of “conscious imagery.” As mentioned previously, there is also an ongoing debate in the field of mental imagery ability as to whether the term aphantasia should be used to describe a lack of mental imagery across all modalities/senses (Monzel et al., 2022) or if there should be additional specific terms (Dance et al., 2021; Hinwar & Lambert, 2021; Simner & Dance, 2022). Recent research indicates that aphantasia is often associated with a deficit of imagery across all senses (Dance et al., 2021). However, here we define aphantasia as the absence or severe reduction of conjuring and experiencing conscious visual images. Additionally, the term hyperphantasia also coined by Zeman et al. (2015) will be defined here as individuals possessing a high level of vivid mental imagery and enhanced conjuring and experiencing of conscious visual images.
Turning to classification and identification of aphantasia, studies have consistently relied at least in part on the self-report measure of visual imagery, namely the VVIQ or VVIQ-2 (Marks, 1973, 1995). This measure asks participants to conjure up images and rate their vividness. Based on responses, individuals are generally categorized into one of three groups: aphantasics/low-imagers, phanstasics/mid-range imagers, and hyperphantasics/high imagers (Bainbridge et al., 2021; Dance et al., 2022; Zeman et al., 2015, 2020). In a further distinction, Dance et al. (2022) identified anyone with the lowest possible score, reporting absolutely no visual imagery, as having extreme aphantasia. Additionally, Dance et al. (2022) note that the exact cutoffs of VVIQ and VVIQ-2 scores for aphantasics have varied (Bainbridge et al., 2021; Zeman et al., 2015, 2020). The scores depend on whether the VVIQ composed of 16 items or the VVIQ-2 composed of 32 items is administered. In the case of the VVIQ-2, the 16 items from the VVIQ are given twice, once with explicit instructions for the participant to keep their eyes open, and then again but with the instruction to have them close their eyes when creating the image in their mind.
In their study, Zeman et al. (2020) used the VVIQ and identified individuals scoring 16–23 out of a max score of 80 as being aphantasic, while those scoring 75–80 were classed at hyperphantasics. Additionally, Zeman et al. (2020) further divided aphantasics as having moderate (scores of 17–23) or extreme (scores of 16) aphantasia. Other studies have similarly grouped aphantasics, although the exact thresholds and subdivisions do vary slightly (Bainbridge et al., 2021; Dance et al., 2022; Zhao & Salle, 2018). These slight variations have given rise to the first purpose of this study, which is to offer further insight into the groupings of these imagery levels with the use of LPA.
Current Study
Although previous studies provide insight regarding mental imagery and reading performance (e.g., De Koning & van der Schoot, 2013; Leopold et al., 2019; Suggate & Lenhard, 2022), none of these studies make specific reference to aphantasia. The recent study by Speed et al. (2024) did investigate the aphantasic reading experience, though they did not use empirically derived imagery profiles. Generally, the lack of research into the spectrum of mental imagery and reading is unsurprising given aphantasia's recent discovery and seemingly low prevalence, yet it now presents a new way in which to approach the topic of mental imagery and its connection to reading. Returning to the DCT (Sadoski & Paivio, 2004) and the Situation Model of reading (Zwaan & Radvansky, 1998) there is now an opportunity to further investigate the experience and process of reading in individuals with different levels of mental imagery. Ultimately, an increased understanding of how mental imagery levels may influence reading experiences as well as whether there are any implications for performance will have important significance for future education policy, diagnostic tools, and even interventions.
This study aims to explore and identify possible classifications of mental imagery levels from the VVIQ-2 with the use of an LPA, and to use those classifications to investigate links between imagery and the reading experience. Previous research on aphantasia has relied on VVIQ and the VVIQ-2 responses categorised according to what seems theoretically plausible (Zeman et al., 2015), but which have not been validated using formal methods such as an LPA. LPA is a valuable tool which may be able to offer an empirical validation of the profiles, as it can be used to identify phenomena which are not directly observable but which may define a group, or as Woo et al. (2018) coined, construct-based profiles. In addition to helping construct profiles, an LPA indicates the likelihood of an individual belonging to a certain group: it focuses on the patterns found in the variables and finds similarities of answering patterns rather than just assessing final scores (Spurk et al., 2020). Therefore, we investigated how many imagery profiles would emerge. It is expected that there will be at least three profile groups, and that these profiles will correspond to the ranges generally assigned to aphantasia/low imagers, mid-range imagery, and hyperphantasia/high imagers. Further, it is predicted that these groups will generally correspond to the ranges assigned to aphantasia/low imagery, mid-range imagery, and hyperphantasia/high imagery.
Once groups are identified by the LPA, this study has a secondary interest in understanding if there would be significant differences between groups when asked to reflect on the experience of reading. Specifically, the establishment of groups from the LPA will be used to investigate how imagery ability relates to self-reported reading absorption and enjoyment. Reading was chosen because of its importance and of its supposed links to mental imagery either functionally (Green & Brock, 2000; Kuijpers et al., 2014), experientially (Speed et al., 2024) or possibly both (Mak & Willems, 2021). If reading entails, at least partly, turning text into images, then it would be expected that aphantasics would have very different experiences of reading.
Therefore, the second aim of this study is focused on the question of how visual mental imagery and the lack thereof may impact reading. It is expected that the VVIQ-2 scores will correlate with the Story World Absorption Scale (SWAS) as well as the Enjoyment of Reading Scale (ERS). It is predicted that the correlation will be strongest between the VVIQ-2 and the mental imagery subsections of the SWAS. In a similar vein, it is hypothesized that there will be group differences in responses to the SWAS and ERS scale based on the derived classes. Specifically, we expect to find that those with low imagery/aphantasia are significantly different to other imagery levels in reading absorption and enjoyment. These differences are expected to be most distinct in the subscales of mental imagery and transportation of the SWAS.
Method
Participants
Participants were drawn from 539 respondents to an online study. Four main criteria were used to select and recruit participants. The first criterion was full completion of the study, with the exception that the optional open-ended text-based responses could remain unanswered. The second was confirmation of English as a primary language. This was necessary to ensure that accurate responses were provided because of the reliance on self-reported data. The third inclusion criterion was that all participants be over the age of 18. The fourth and final criterion was that they must have completed at least one year of university-level education. This criterion for university-level study was adopted because it indicates a level of literacy attainment. Hence, along with a check on a reading difficulty diagnosis described below, this criterion was included to curtail the possibility of literacy level being a confounding factor for reading enjoyment or absorption.
Of the 539 responses, 80 responses were immediately removed as no questions had been answered. This left 459 responses, 23 of which did not meet the required education level for inclusion, and an additional 18 reported that they did not consider English to be their primary language. The remaining 418 responses were checked for completion of the VVIQ-2 and a further 131 responses were found to have incomplete sections and were therefore removed. The remaining 287 completed responses were used for data analysis.
In total, 287 complete responses which met all inclusion criteria were included in the analyses. Of these, the ages ranged from 20 to 80 years (M = 47.49, SD = 15.91). The sample consisted of 212 females, 71 males, and two non-binary individuals with an additional two choosing not to share that information. Finally, 20 participants were identified as having been diagnosed or self-identified as having some sort of reading impairment. An additional two respondents selected the option of “prefer not to say”. However, as these reading difficulties had not precluded them from pursuing higher education, they were not excluded from the sample.
Procedure
Recruitment for this online study happened over a month-long period in 2022 (June 9–July 4). Participants were invited to take part in a study investigating the relationship between mental imagery ability and reading. Therefore, special attention was paid to collecting a sample representative of the entire spectrum of imagery abilities ranging from those with no reported mental imagery (aphantasics) to those who reported vivid mental imagery (hyperphantasics). More specifically, in order to be able to study the small sub-group of people with aphantasia with a reasonable sample size, currently estimated to be around 4% of the general population (Dance et al., 2022), an attempt was made to recruit a sample with an overrepresentation of aphantasics. Accordingly, the study invitation was disseminated via the Aphantasia Network. Further, the invitation was circulated through the primary author's social media as well as through email.
The data used here was initially collected by the author through an online anonymous questionnaire, using Qualtrics software (Qualtrics, Provo, UT). The questionnaire itself was presented in the same form to each participant with no counter balancing of task order. Tasks consisted of general demographic questions, a visual imagery scale, two reading measures, and two open answer questions. The demographic questions included age, gender identity, primary language, education level. The visual imagery scale and both reading measures used Likert scales to gather responses and each are described below.
Ethical Approval was granted by the Education Department at the author's University and the approved proposal was in line with the British Psychological Society's Code of Ethics and Conduct. All data was anonymous at the point of collection. Participants were informed at the start of the questionnaire that the task would last approximately 15–20 min, although there was no limit in the amount of time they were allowed to take. Before they could begin to complete the tasks, subjects had to confirm their consent to participate. Additionally, they were asked to make sure that they were in a safe environment as half of the VVIQ-2 tasks would ask them to close their eyes while they attempted to conjure a specific visual image.
Measures
Measures consisted of demographics, visual imagery, and reading enjoyment and absorption scales. The three scales used were, the VVIQ-2 (Marks, 1973), the Story World Absorption Scale (SWAS; Kuijpers et al., 2014), and the Enjoyment of Reading Scale (ERS) from the 2009 Programme for International Student Assessment (PISA).
Visual Imagery
The VVIQ and VVIQ-2 scales (Marks, 1973, 1995), although developed long before the coining of the term aphantasia, are consistently used in research of aphantasic populations (e.g., Bainbridge et al., 2021; Dance et al., 2022; Keogh & J. Pearson, 2018; Zeman et al., 2015, 2020; Zhao & Salle, 2018). Both the VVIQ and VVIQ-2 scales ask participants to think of different scenes and then to rate the vividness of their images on a five point Likert scale, whereby: 1 = perfectly clear and as vivid as normal vision, 2 = clear and reasonably vivid, 3 = moderately clear and vivid, 4 = vague and dim, and 5 = no image at all, you only “know ‘’ that you are thinking of an object/scene. Items were later reverse coded for analysis so that lowest scores represented those with lowest imagery.
The VVIQ-2 (Marks, 1995) scale differs from the original VVIQ (Marks, 1973) as it asks participants specifically to complete the tasks once with their eyes open and once with their eyes closed. For this study, the VVIQ-2 scale was used so as to be able to investigate if there are any measurable differences in individuals with certain imagery abilities depending on whether they perform the task with their eyes open or closed. Examples of the scenes that participants are asked to imagine include participants being asked to visualise a scene such as a sunset or a person they know well
Reading Absorption
The SWAS is a reading measure made up of 18 questions which can be divided into four subsections of reading absorption (i.e., attention, transportation, emotion, and mental imagery). The first three subsections are each measured by responses to a unique group of 5 questions, while the final subsection of mental imagery is measured by responses to 3 questions. The questions for attention focused on how a reader felt when engaged with the book (e.g., “When I finish the story I am surprised to see that time has gone by so fast.”). The transportation section focused on questions which probed at how deeply a reader was engaging with and falling into the story (e.g., “When I was reading the story it sometimes seemed as if I were in the story world too.”). The emotion subsection was focused on connections made between the reader and the characters (e.g., “When I read the story I could imagine what it must be like to be in the shoes of the main character.”). Finally, the mental imagery section asked directly about how readers visualised the story (e.g., “When I was reading the story I could see the situations happening in the story played out before my eyes.”). In a departure from the usual procedure for administering the SWAS, we did not provide the participants with reference texts to first read and base their ratings on. Instead, participants were asked to reflect on their general experience when reading fiction. This was done in an effort to understand overall perceived reading experiences for fiction texts that the participants typically read without being overly influenced by specific text selections provided in the SWAS. Each of these sections was delivered as a distinct block and were presented in the same order to all participants. The Likert scale for this measure consisted of seven options (1–7): 1 (Totally Disagree), 2 (Disagree), 3 (Somewhat Disagree), 4 (Neutral), 5 (Somewhat Agree), 6 (Agree), 7 (Totally Agree). No items were reverse coded. Internal consistency was excellent, αcr = .937.
Reading Enjoyment
Finally, the ERS scale was originally taken from the 2009 Programme for International for Student Assessment (PISA) (OECD, 2012), selected as a measure of self-reported enjoyment of reading. Participants were asked to use a Likert scale (1–4) to react to different statements: 1 (Strongly Disagree), 2 (Disagree), 3 (Agree), 4 (Strongly Agree). It consists of 11 questions in total. Of the 11 statements, 5 required reverse coding for analysis as they were presented with negative language (i.e., “I read only when I have to”). Another study which used this scale (Cheema, 2018) chose to present the 6 positively worded statements as a group and then to present the 5 negatively worded statements together. For this study, positively and negatively worded statements were intermixed for presentation to avoid response bias (Spector, 1992). The internal consistency of this scale was excellent, αcr = .914.
Data Analysis
All analyses were run in SPSS (v28) and in R Statistical Software (v4.2.3; R Core Team, 2023). The data were screened, applying the inclusion criteria mentioned above. Next, data which required reverse coding were addressed and individual items were compiled into total scores. A composite score was created for the VVIQ-2, ERS, and SWAS. Additionally, composite scores were calculated for the attention, transportation, emotion, and mental imagery subsections of the SWAS. Descriptive statistics and correlation coefficients, including kurtosis and skew as well as histograms and Shapiro-Wilk tests to check for normality, were calculated.
As mentioned previously, the VVIQ-2 (Marks, 1995) is composed of 32 items, all of which are ranked equally in terms of importance when measuring imagery. Since these questions are all related to vividness of imagery, it is therefore conceivable that any profiles which are identified will be related and yet distinct (Spurk et al., 2020). The LPA was run using Mclust (Scrucca et al., 2016) to identify the best fit model and then after the best fit model was identified tidyLPA (Rosenberg et al., 2018) was used to run and graph these results. Additionally, after the LPA was run, a pattern was noted between the eyes open and eye closed conditions which necessitated further analysis through post-hoc tests. Classes were established using the LPA, and they were then used to define the groups used in further analyses. These included a Kruskal-Wallis test looking at the ERA and SWAS total scores and subsection scores.
Results
The descriptive statistics for the VVIQ-2 and reading scales were calculated and these appear in Table 1. As can be seen in Table 1, skew and kurtosis were within +/- 2, but greater than the more rigorous criterion of +/- 1. Further, a Shapiro-Wilk test confirmed that the data deviated significantly from normal, p < .001. Therefore, all tests which assume normally distributed data were run using nonparametric equivalents.
Descriptive Statistics.
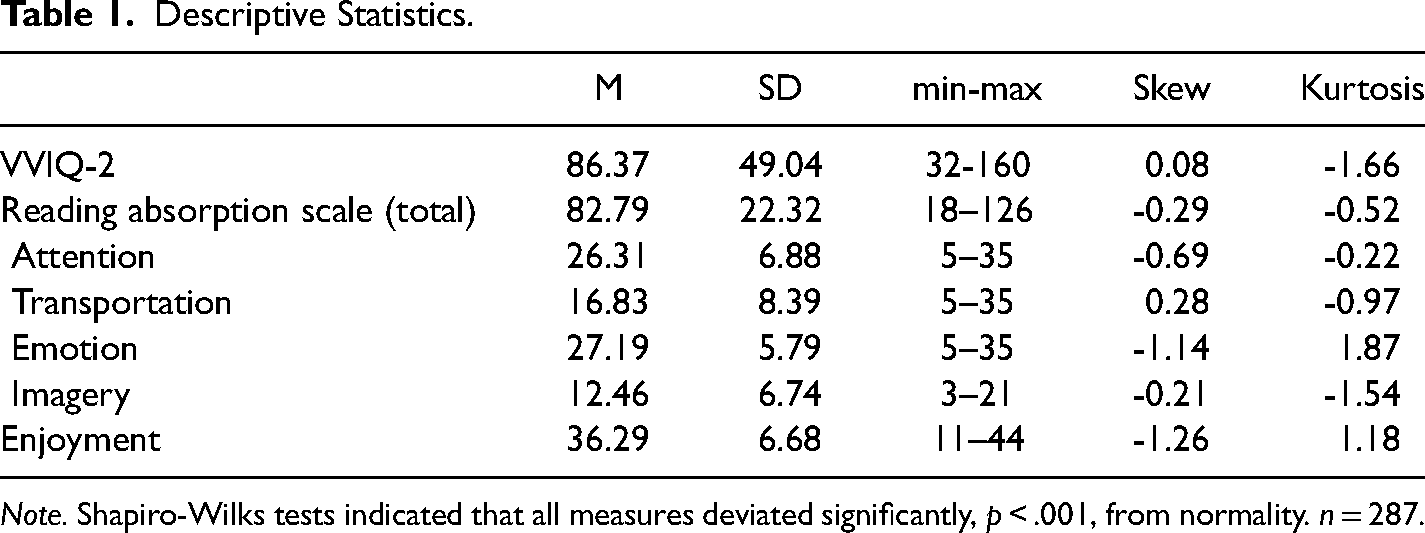
Note. Shapiro-Wilks tests indicated that all measures deviated significantly, p < .001, from normality. n = 287.
Latent Profile Analysis
Using the Mclust and tidyLPA packages in R, LPAs were run. To this end, and as depicted in Figure 1, the 14 Gaussian models of (multivariate) distribution were considered (Scrucca et al., 2016) when running the LPA with the Mclust package. From the 14 models it was determined that the best fit model would be Model 3 (EEE). The EEE model is ellipsoidal, equal volume, shape and orientation (Scrucca et al., 2016). The best possible fit models identified by the Mclust package were Model 3 profiles 9, 8, and 3. However, classes of more than 6 profiles were rejected here as the group sizes were less than 25 and therefore deemed too small to be a robust profile (Lubke & Neale, 2006). From there fit statistics for solutions of 1 to 6 profiles were considered using tidyLPA (Table 2).
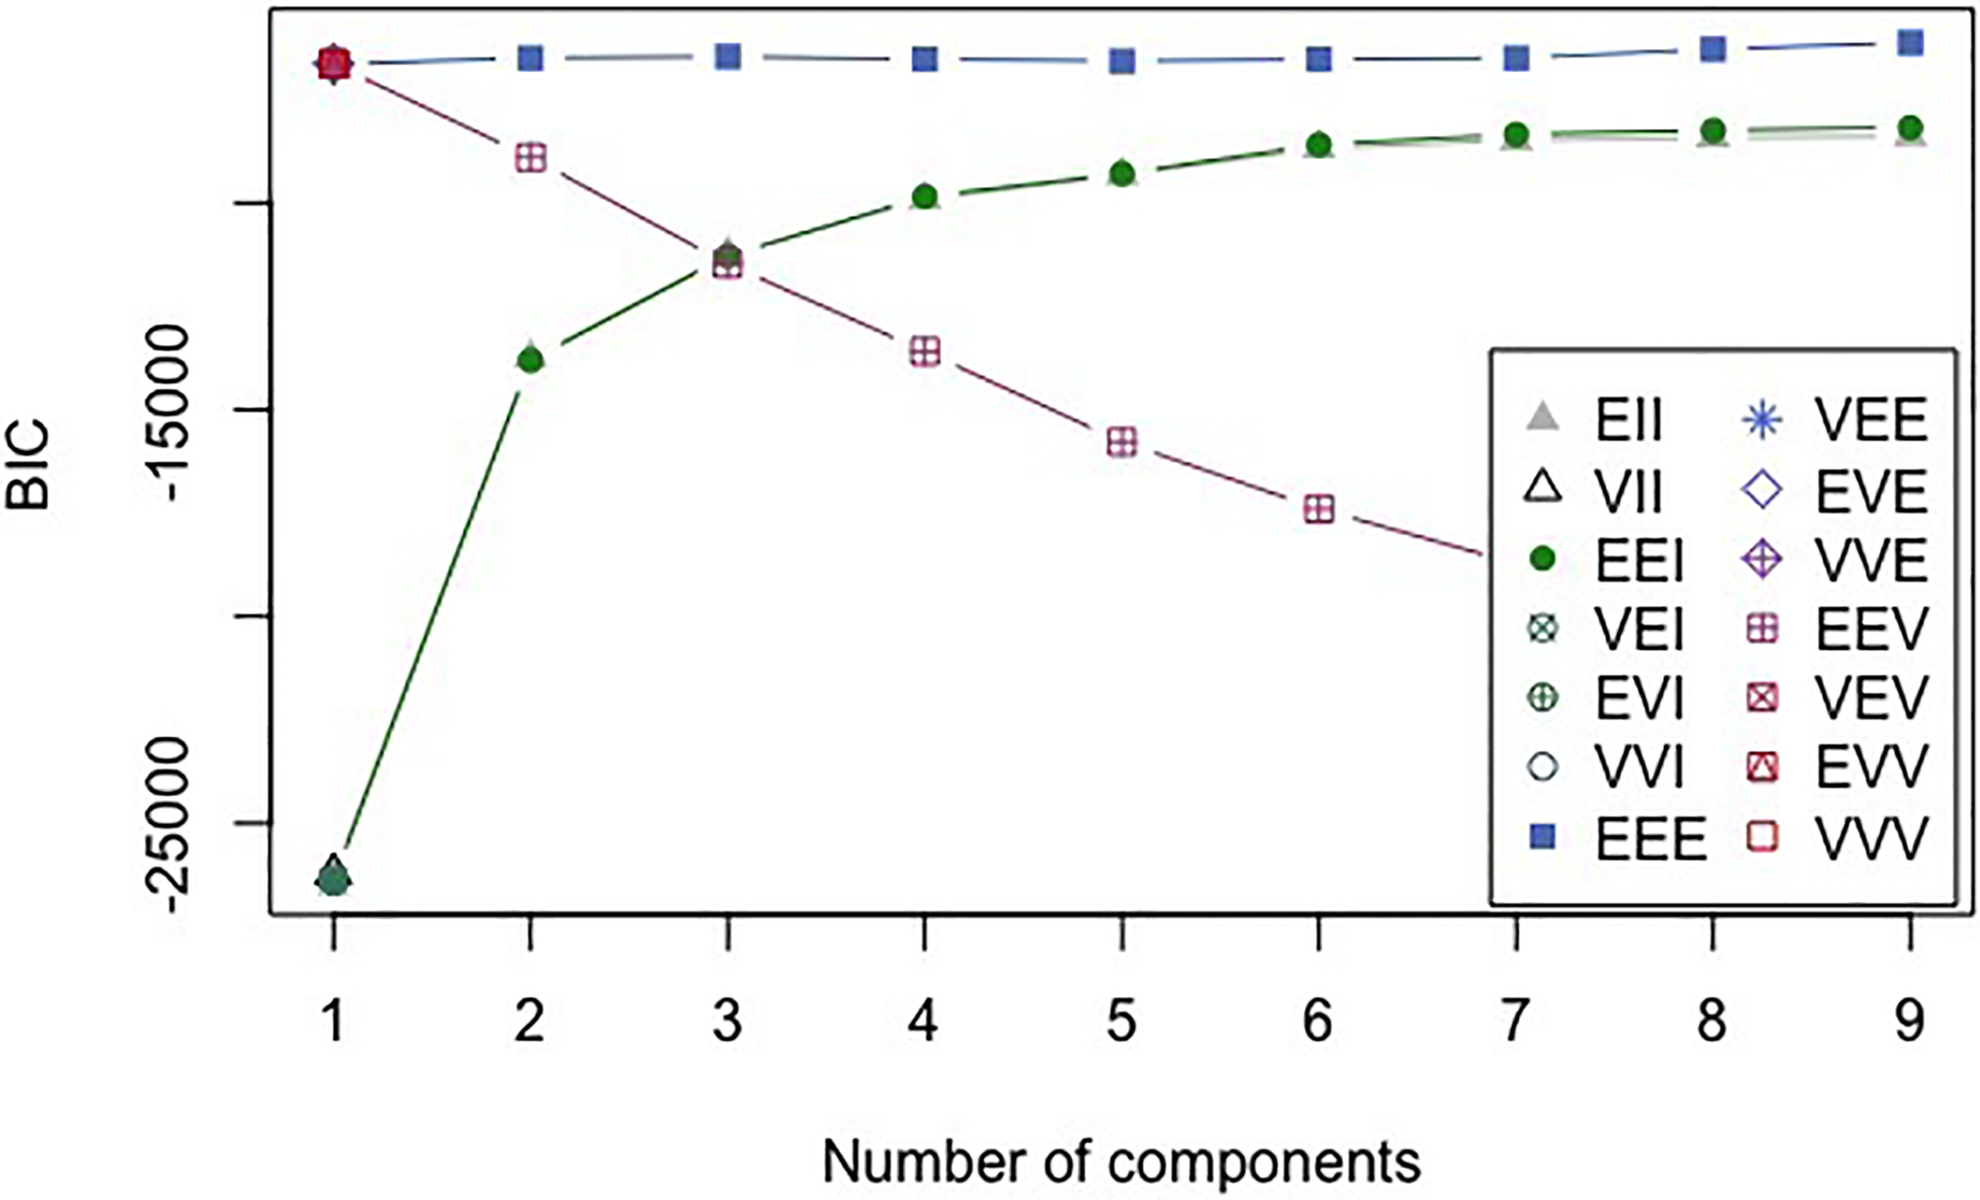
Gaussian model best fit indices of imagery profiles.
Model 3 (EEE) Indicators of Best Fit.
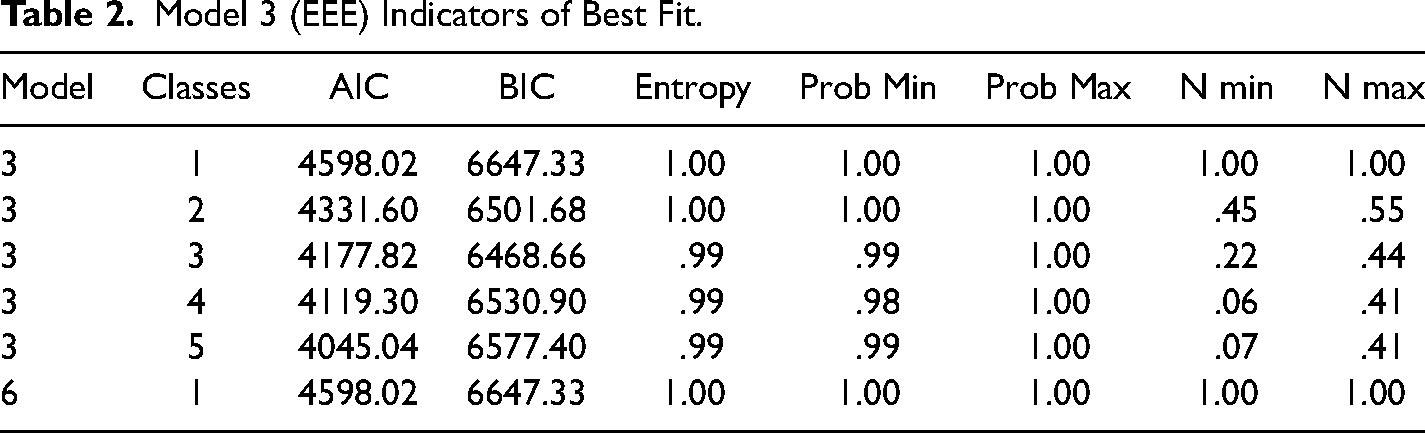
Model 3 with 3 classes was considered to be the best fit model as it had the lowest BIC value. The BIC (Bayesian information criterion) is used to indicate best fit, specifically the solution presenting the lowest value (Spurk et al., 2020). It should be noted that the BIC can underestimate the number of profiles when the sample size is small, and therefore the existence of more profiles should not be dismissed in future studies. For the current study, our choice to consider Model 3 Classes 3 was additionally strengthened by the theory of three imagery classes: hyperphantasics, phantasics, and aphantasics. Alignment with existing theory is an important factor when selecting a best fit model (Moeller et al., 2018; Spurk et al., 2020).
Having identified the preferred model it was possible to proceed with looking at the assigned profiles and their patterns of responses across the VVIQ-2. Using ggplot2 (Wickham, 2016) Figure 2 was created. Based on the LPA, there were 64 participants assigned to Class 1 (hyperphantasics/high imagers), 96 participants were assigned to Class 2 (mid-range imagers), and 127 participants were assigned to Class 3 (aphantasics/low-imagers). As is clear in Figure 2, there was a floor and ceiling effect for Classes 3 and 1 respectively. Additionally, a pattern of lower scores was observed in Class 2 when the condition of the measure changed to having participants close their eyes.
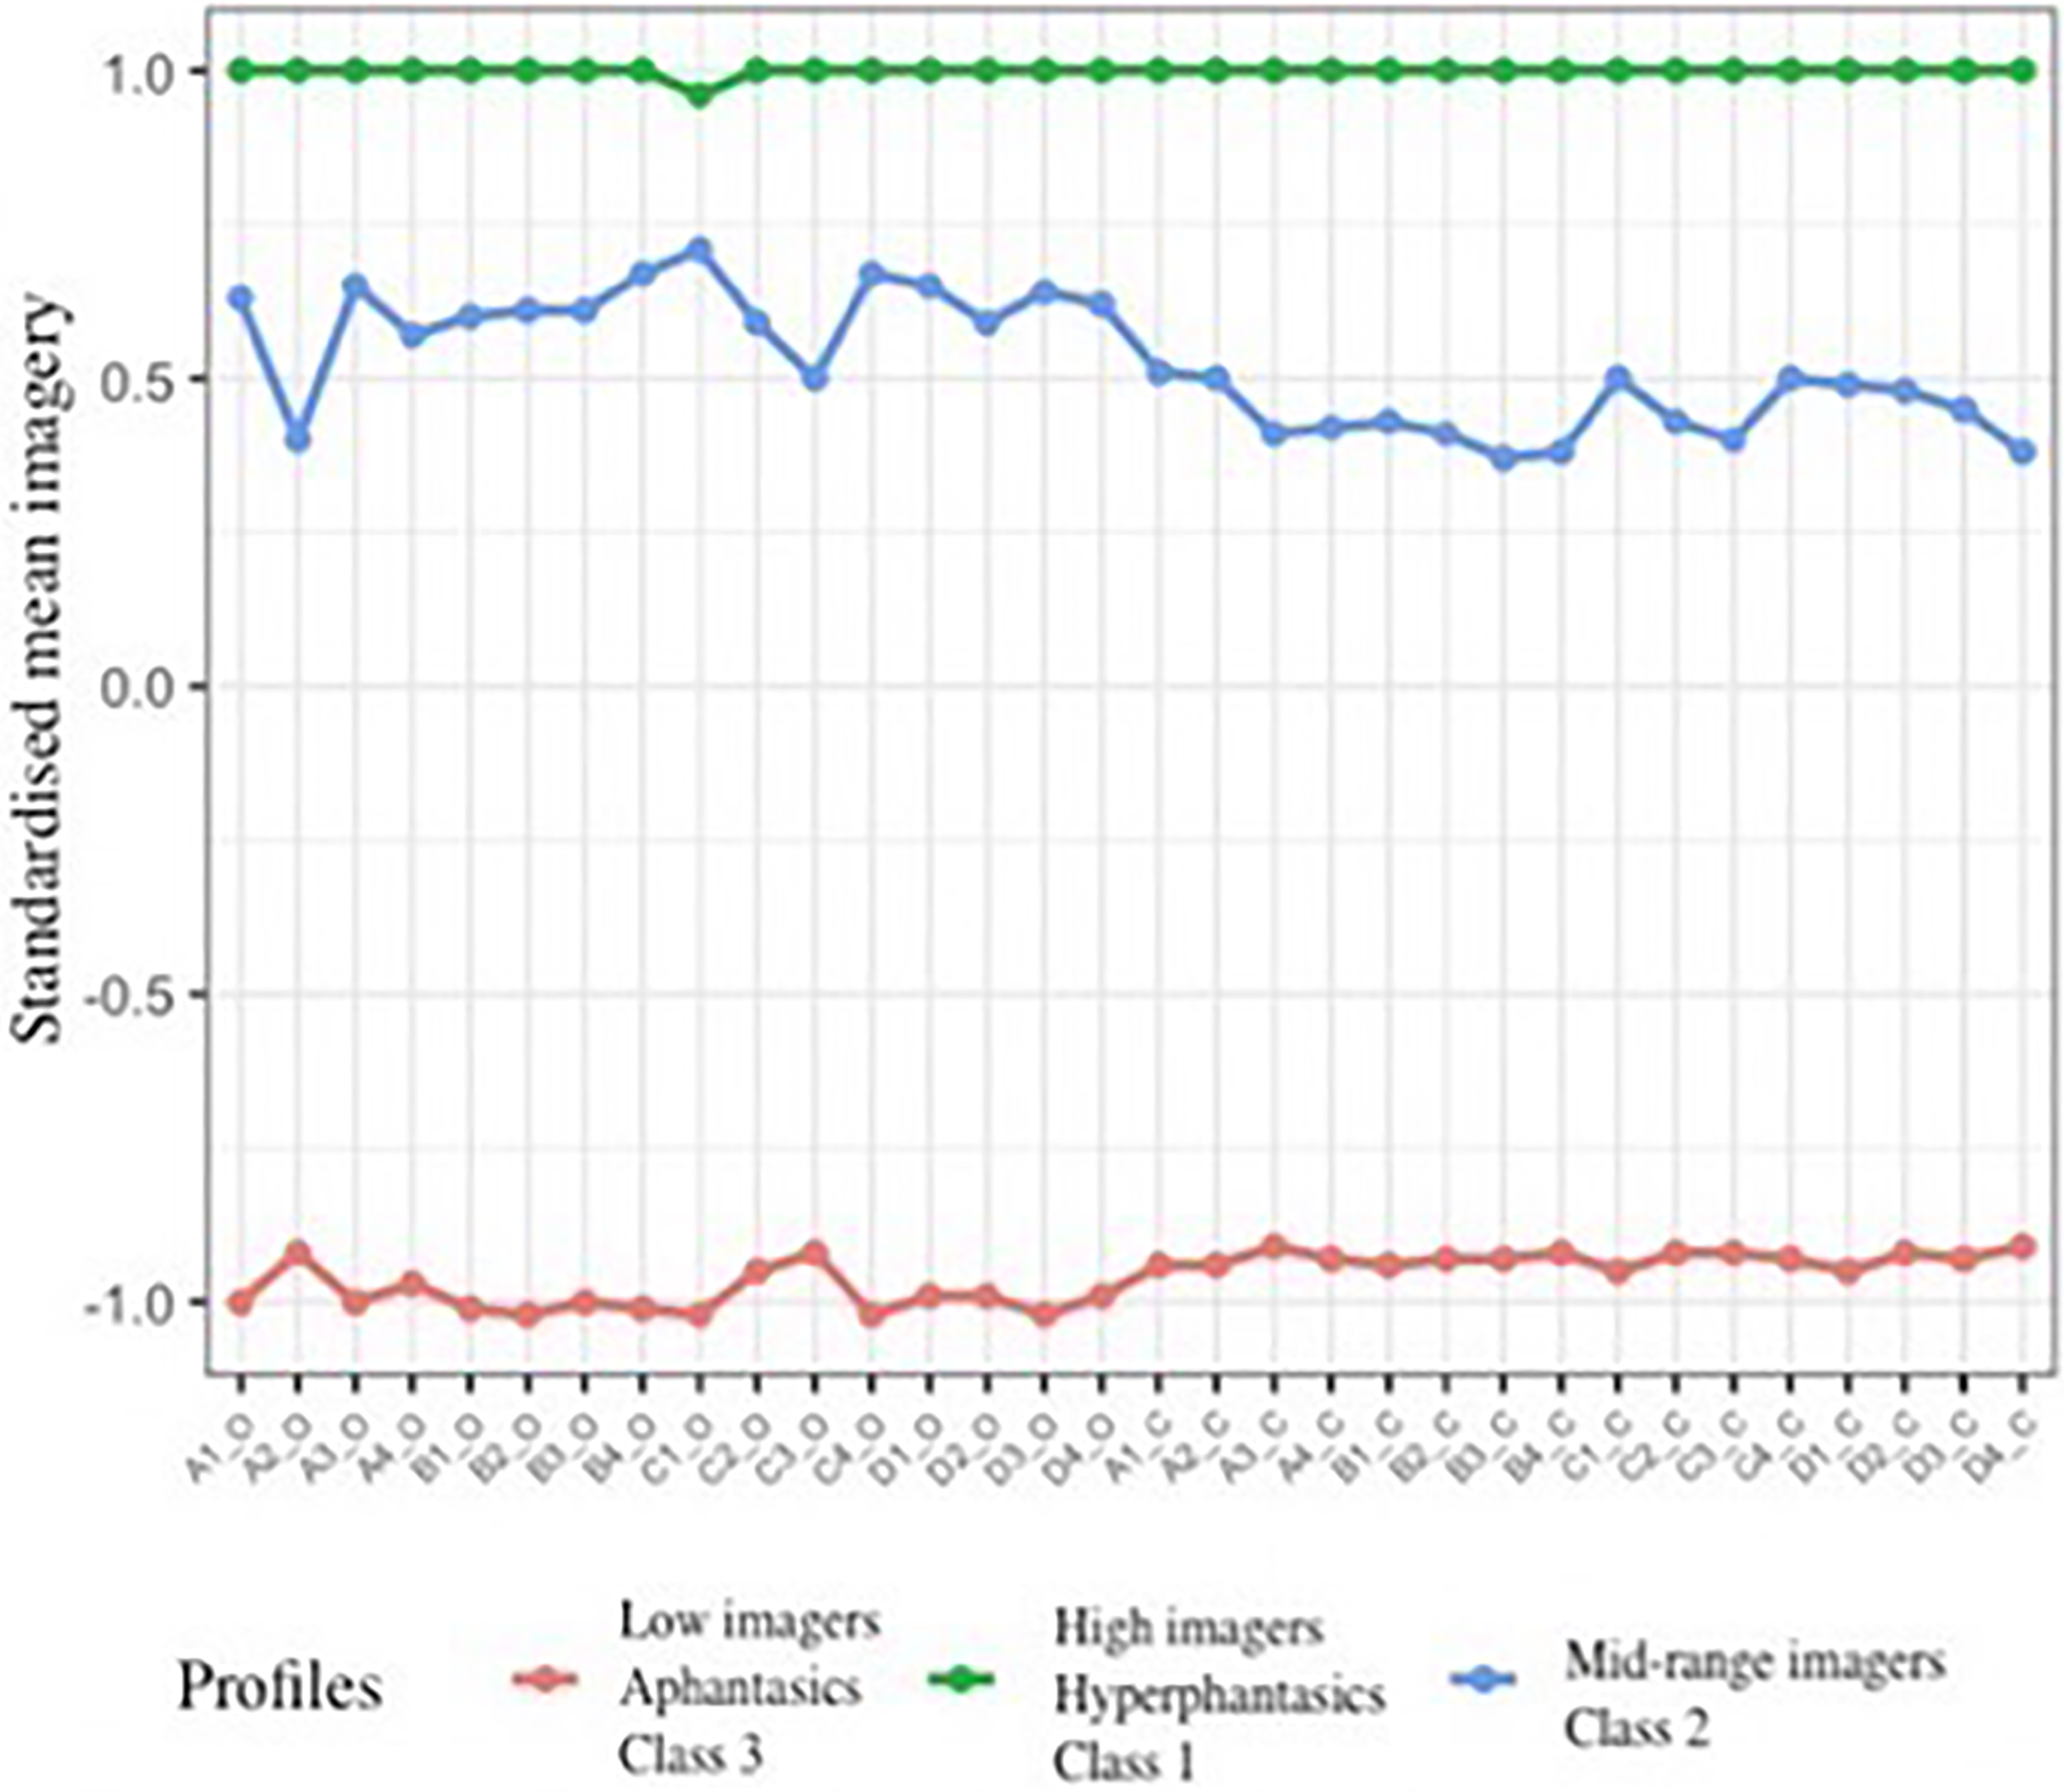
Profiles of imagery model 3 (EEE) depicting 3 profiles: high imagery (top), mid-range imagery (middle), and low imagery (bottom).
Eyes Open and Eyes Closed
Based on the observations mentioned above which indicated a possible decrease in vividness in Class 2 and an increase in Class 3 during the eyes closed condition of the VVIQ-2, post-hoc Wilcoxon signed rank tests were run to determine if there were significant within-group differences between the eyes open and closed conditions. This was achieved by running a separate test for each imagery profile. Class 1 (hyperphantasics/high imagers) showed no statistically significant difference between the eyes open and eyes closed conditions, Z = .47, p = .636. There was a statistically significant difference between the eyes open and eyes closed conditions found in Class 2 (mid-range imagers), Z = 3.94, p < .001, and Class 3 (aphantasic/low imagers), Z = 3.896, p < .001.
LPA Profiles and VVIQ-2 Scores
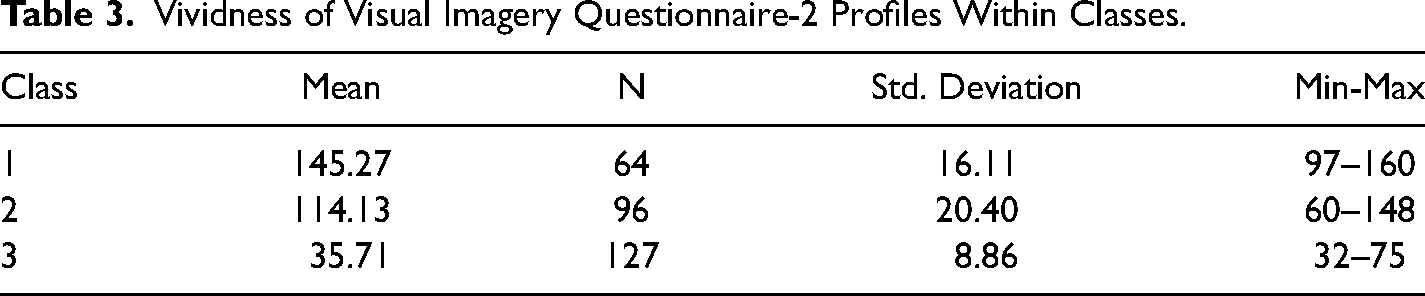
The data were then imported to SPSS, and the classes were depicted to better understand the ranges of the three classes with regards to their VVIQ-2 scores. The mean VVIQ-2 scores of each class were found with 160 being the highest possible score and 32 being the lowest possible score. Based on the LPA profiles, we calculated that the profiles of Class 1 (hyperphantasic/high imagers) and Class 3 (aphantasics/low imagers) had mean scores of 145.26 and 35.70 respectively, while Class 2 (mid-range imagers) had a score of 114.12 (Table 3). Figure 3 plots the three profiles derived using the LPA against the three categorization levels typically used in research using the VVIQ-2. As can be seen in Figure 3, the LPA derived ranges indicate that though the commonly used score ranges would accurately capture most of the groupings, there are implications that both the highest and lowest imagers may have a
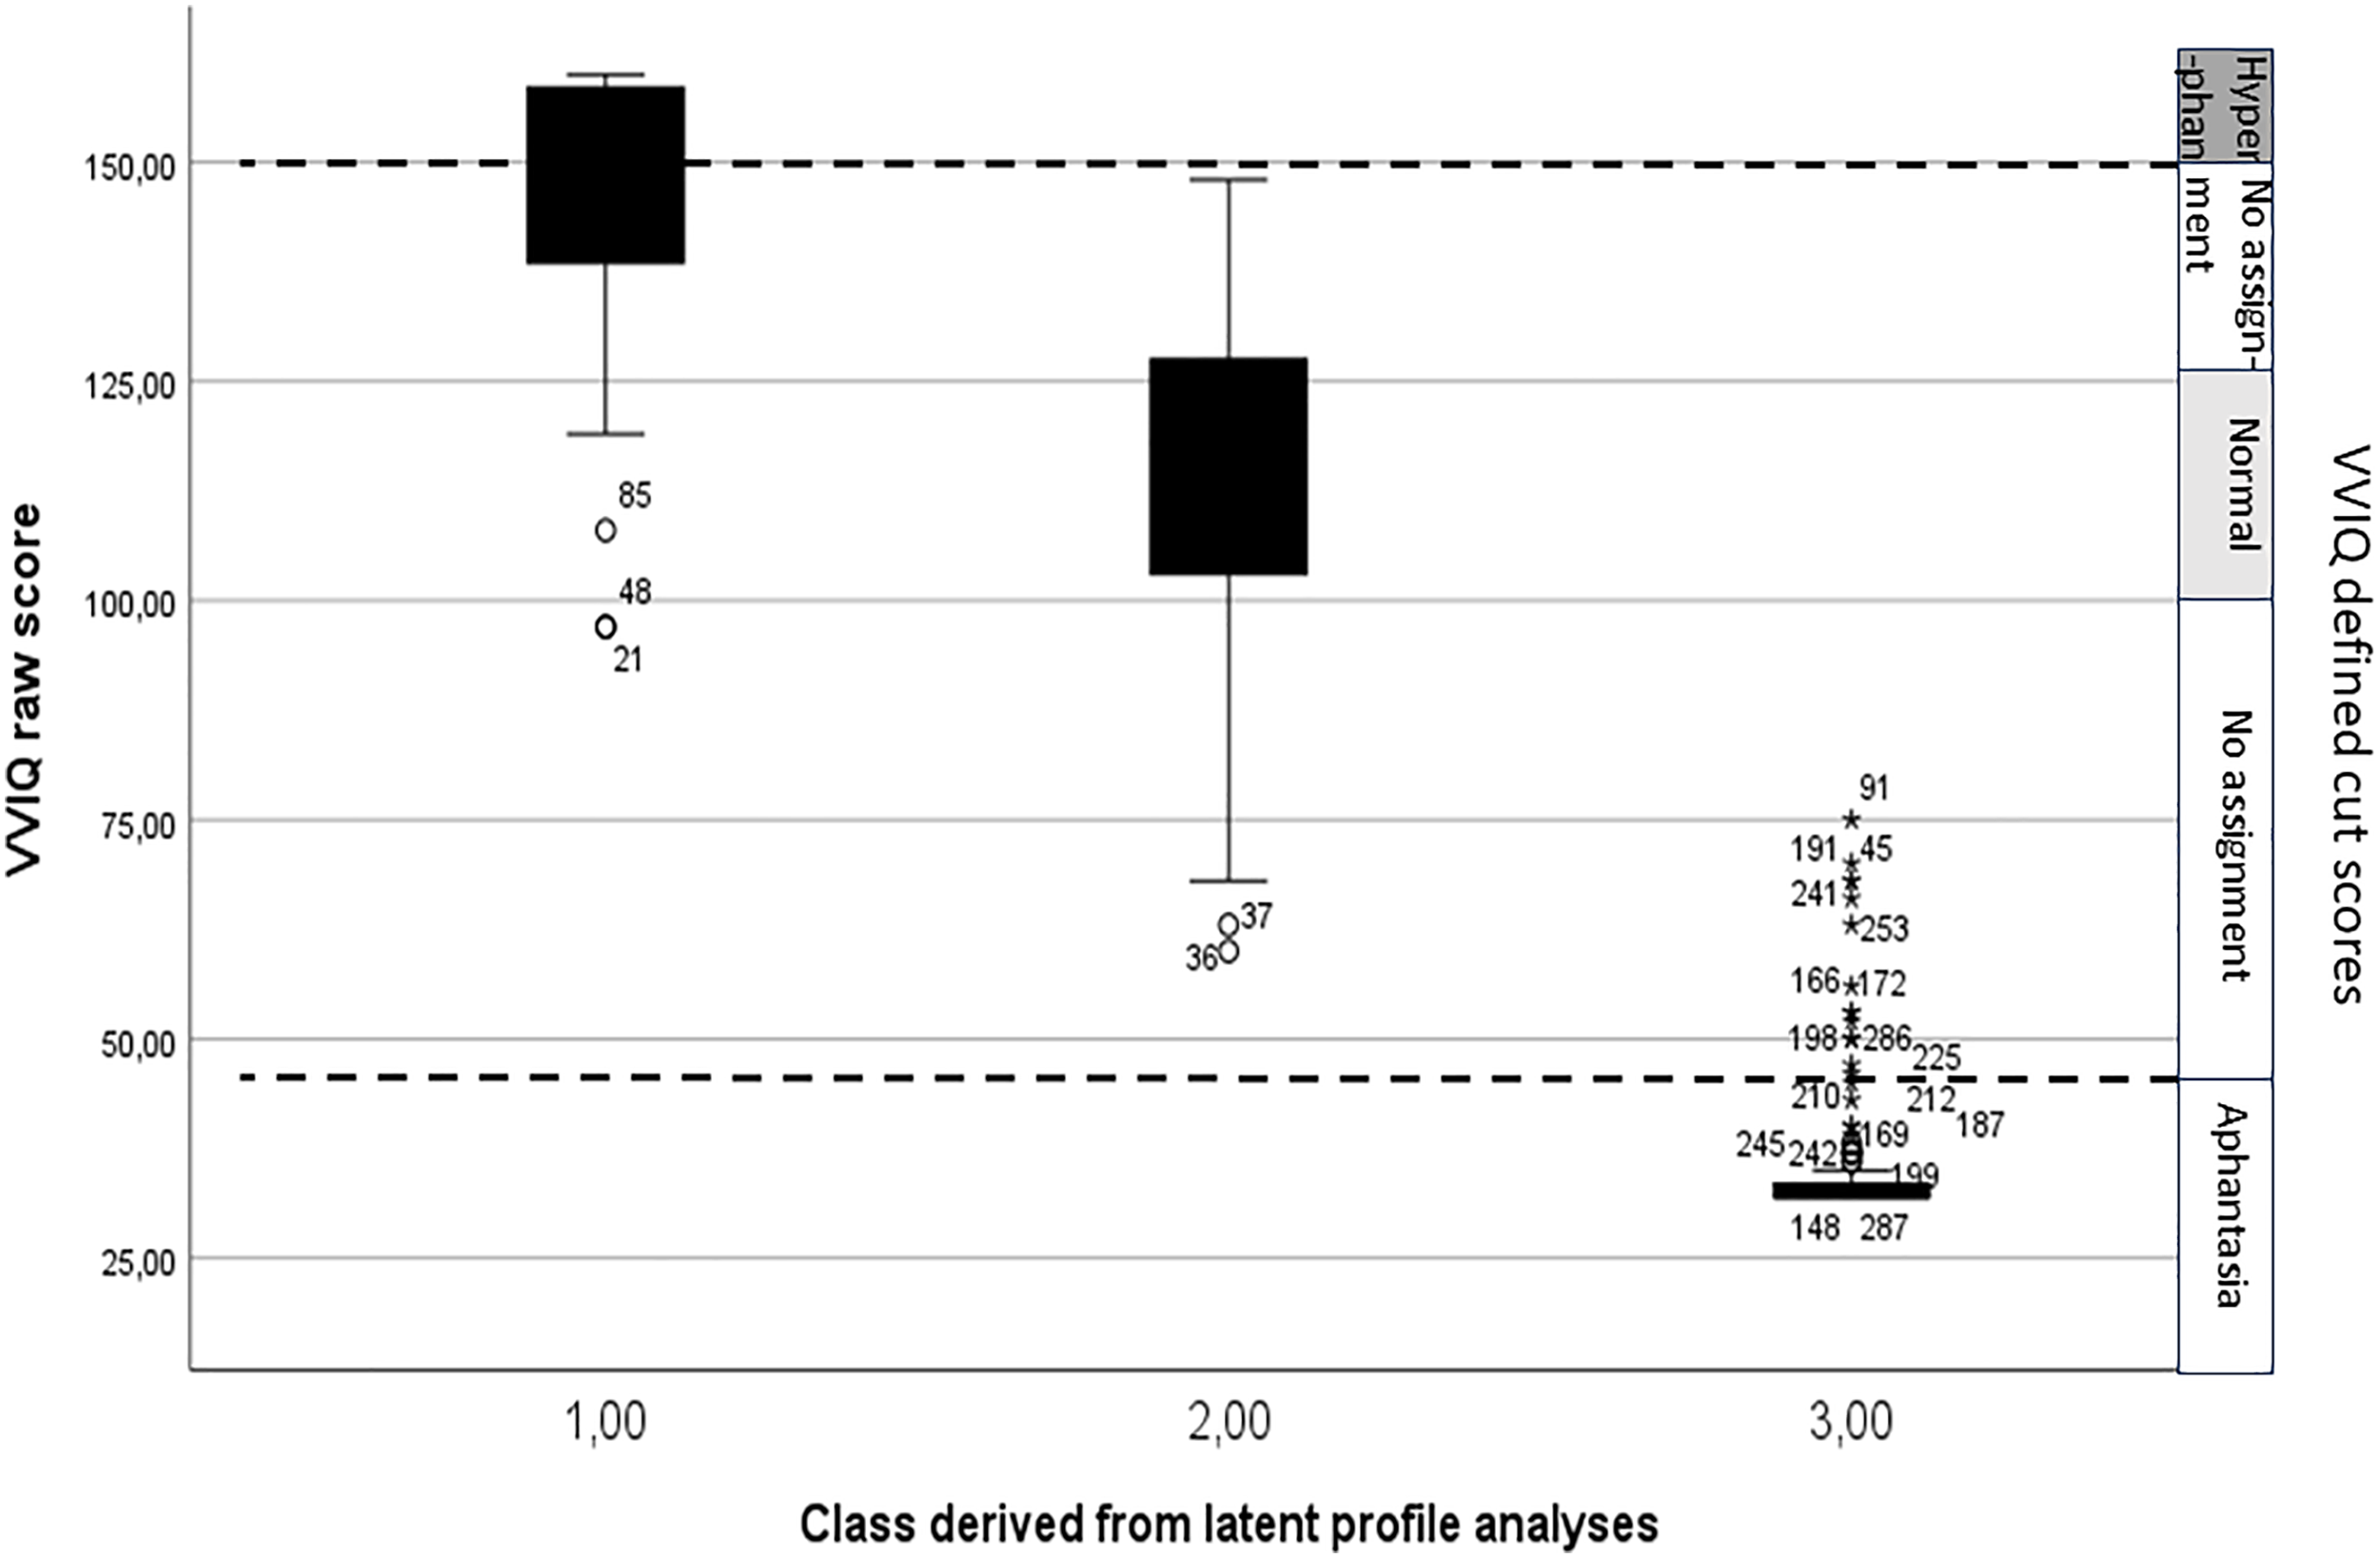
Imagery profiles as determined by the latent profile analyses in comparison to the vividness of visual imagery questionnaire cut scores.
Vividness of Visual Imagery Questionnaire-2 Profiles Within Classes.
Correlations of VVIQ-2 and Reading Measures
Next Spearman's rho correlations were run to test for links between the VVIQ-2 and the reading measures, which appear in Table 4. The coefficients in Table 4 show a statistically significant positive correlation between VVIQ-2 scores and the SWAS total and subscales, and Reading Enjoyment. The weakest correlation was between VVIQ-2 and Enjoyment (r = .19) which was significant, p = .01, as were all other correlations between the VVIQ-2 and Reading Absorption, p < .001. A Fisher's r-to-z test was used to confirm the hypothesis that VVIQ-2 would correlate strongest with the SWAS mental imagery subscale than with other subscales, which it did. By way of example, the correlation between VVIQ-2 and mental imagery, r = .80, was larger than that between transportation and VVIQ-2, r = .56, Z = 7.17, p < .001.
Correlations between Vividness of Visual Imagery Questionnaire-2 and Reading Measures.
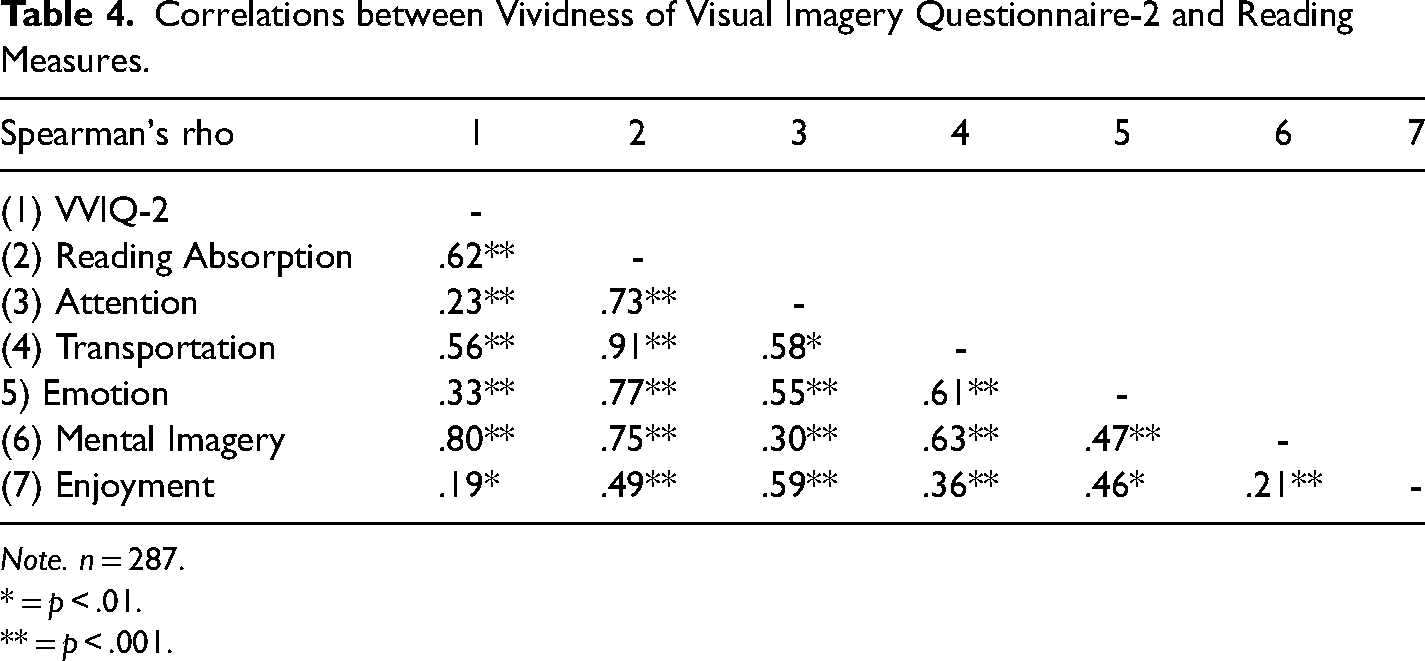
Note. n = 287.
* = p < .01.
** = p < .001.
Variations Between Class Analysis
Again, Kruskal-Wallis tests were run to determine whether there are statistically significant differences between the classes identified with the LPAs. The Kruskal-Wallis H tests showed that there are statistically significant differences between classes of imagers in terms of their: overall reading absorption, χ2(2) = 110.67, p < .001, reading absorption (attention), χ2(2) = 12.30, p = .002, reading absorption (transportation), χ2(2) = 90.89, p < .001, reading absorption (emotion), χ2(2) = 31.85, p < .001, and reading absorption (imagery), χ2(2) = 189.11, p < .001. A Kruskal-Wallis H test also showed statistically significant differences between imager classes and reading enjoyment, χ2(2) = 7.97, p = .019. Effect sizes (i.e., η²) were also calculated (Jawinski, 2017; Lenhard & Lenhard, 2017) and are reported in Table 5.
Between Group Comparisons for Reading Absorption and Enjoyment.
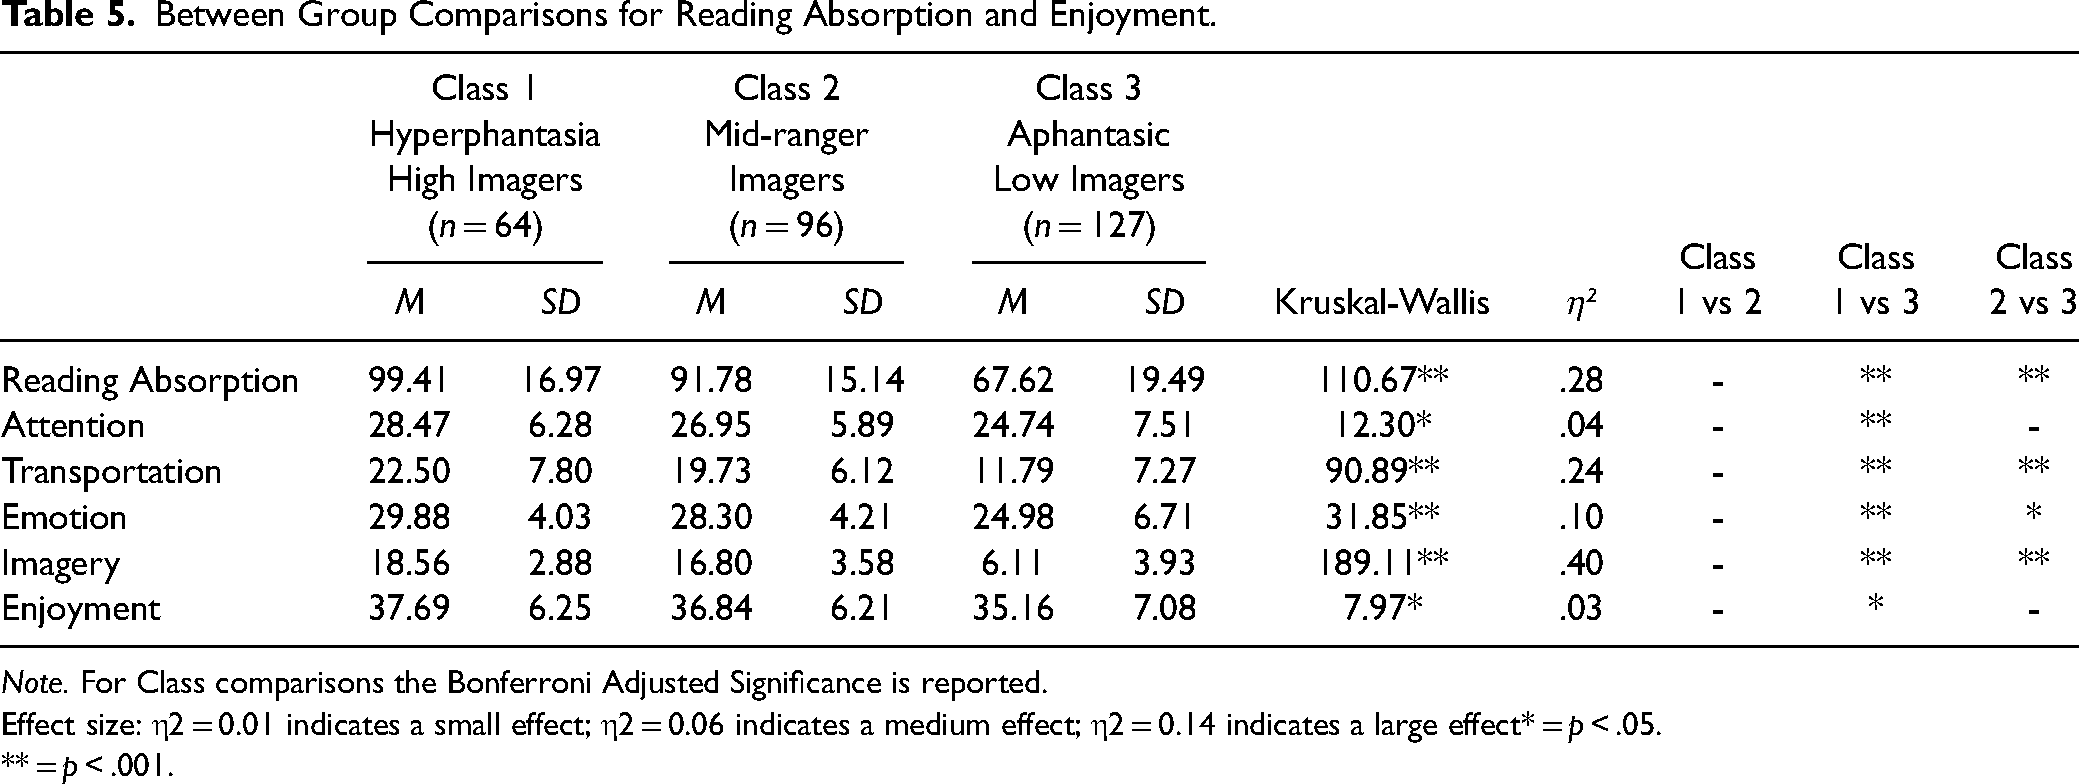
Note. For Class comparisons the Bonferroni Adjusted Significance is reported.
Effect size: η2 = 0.01 indicates a small effect; η2 = 0.06 indicates a medium effect; η2 = 0.14 indicates a large effect* = p < .05.
** = p < .001.
In addition to the Kruskal-Wallis, post-hoc Dunn's tests with a Bonferroni correction were run to assess the pairwise comparison between classes. The Dunn's test uses the same pooled variance as the Kruskal-Wallis test to calculate the variances between groups (Dinno, 2015; Rajesh, 2023). Overall, these Dunn's tests, reported in Table 5, show a significant difference between Classes 1 (hyperphantasics/high imagers) and 3 (aphantasics/low imagers) (p < .001) in the categories of Reading Absorption, Reading Absorption (Transportation), Reading Absorption (Emotion), and Reading Absorption (Imagery), with aphantasics consistently presenting with lower scores. There were significant differences found between Classes 2 and 3 in Reading Absorption, Reading Absorption (Transportation), and Reading Absorption (Imagery). There was no significant difference between Classes 2 and 3 for Reading Absorption (Attention) or Enjoyment. Between Classes 2 and 1 Dunn's tests with Bonferroni correction revealed no significant differences.
Discussion
This study aimed to identify mental imagery classes using LPA, and investigate the reading experience of participants as a function of their mental imagery class. To our knowledge, this is the first study to use a LPA to investigate the latent profiles of mental imagery ability. Further, we investigated the reading experience of participants as a function of these mental imagery classes. As expected, the LPA confirmed three distinct imagery profiles, which approximately corresponded to the ranges generally assumed to exist in previous research (Bainbridge et al., 2021; Dance et al., 2022; Zeman et al., 2015, 2020). The tests showed that there were significant group differences in all areas, and the post-hoc tests provided the more specific between-group differences.
As expected, there were significant group differences found between Groups 1 and 3 in all areas of reading absorption. Interestingly, for the subcategory of attention on the SWAS, there was only a small effect size found whereas all other sections had medium-large effects. The SWAS subsection of mental imagery unsurprisingly showed the largest effect size across groups, but transportation also had a noticeably large effect size. This is consistent with Green and Brock (2002) as well as the meta-analysis by Van Laer et al. (2014) who posit that imagery is a key component in narrative transportation.
Interestingly, there were no statistically significant differences between hyperphantasics/high imagers (Class 1) and mid-range imagers (Class 2) across any of the reading measures. This may suggest that low imagery/aphantasia gives a unique experience of reading that is very different from what is experienced by high imagers, and which is at least moderately different from mid-range imagers. Thereby the second hypothesis was supported, which stated that there would be significant correlations between VVIQ-2 scores and the SWAS, and that the derived imagery profiles would result in significant between-group differences.
Discussion of Profiles
Due in part to the targeted over-representation of low imagers/aphantasics, these results provide unique insights into individual differences in mental imagery experience. At a conceptual level, we confirm that there appear to be three groups of imagers, corresponding to aphantasia, mid-range imagers, and hyperphantasics. Thus, the LPA presented here broadly corroborated previously imagery assignments or groups according to their VVIQ or VVIQ-2 scores (Zeman et al., 2020). According to these previous assumptions, aphantasic/low imagers have generally been defined by those scoring between 16–23 (Zeman et al., 2020) on the half-length VVIQ, which on the full-length VVIQ-2 would equate to 32–46. According to the current LPA, the average VVIQ-2 scores for Class 3 was 35.71. High imagers/hyperphantasics are generally classed as scoring between 75–80 (Zeman et al., 2020) or 150–160 in the VVIQ-2. The average score for Class 1 was 145.27. Class 2 had an average score of 114.13. If using the VVIQ this would be an expected score of 57 which is in the mid-range of 51–63 on the VVIQ or 102–126 on VVIQ-2 (Zeman et al., 2015, 2020). Accordingly, the current findings generally endorse the ranges previously assigned to imagers by the aforementioned studies, but suggest that current practice likely under-identifies both aphantasia/low imagers and hyperphantasia/high imagers.
Class 1 (high-imager/hyperphantasics) was the smallest profile, though they still represented 22% of the sample. Research has suggested that the prevalence of hyperphantasia is only around 2.5% of the general population (Milton et al., 2021; Zeman et al., 2020). With this in mind, 22% of a sample is actually a surprisingly large proportion of the sample considering that they were not recruited specifically as low imagers/aphantasics were. Additionally, as the Aphantasia Network helped with recruitment, this may have inflated the high imagery numbers as well as there are people of all imagery levels who sign up to their network. Interestingly, hyperphantasic participants were the only group with no significant reported differences between the eyes open versus closed condition. One explanation might be that their mental imagery is sufficiently strong to not be affected by additional imagery coming from the visual system.
Similarly, while the average score of Class 2 was also in line with previous research (Zeman et al., 2020); the findings from the LPA did not clarify the rather large gap in scores between the low-imagers/aphantasics of Class 3 and the midrange/phantasics of Class 2. In fact, although we have referred to Class 2 as midrange imagers, the average scores are not in the middle of the VVIQ-2 range but are much closer to those in Class 1 (aphantasia), and there was even a significant amount of overlap between the two profiles. There were, of course, participants who scored in the range of 46–104 on the VVIQ-2, and they were split between Classes 2 and 3. As the VVIQ-2 was used, it is possible that some who fell into this nebulous score range did so as a result of their very different experiences (e.g., high imagery with eyes open and low with eyes closed). Even so, when using the VVIQ to remove the eyes open versus closed condition, there are certainly those who score between the aphantasic range of 16–23 and the norm group, which begins with a low score of 51. This will require further investigation and clarification as these participants have commonly been left out of the research as they are not high or low enough which is problematic for understanding the full spectrum of imagery.
Reading Absorption and Enjoyment
The results of this study clearly indicate that there is a difference in reading experience dependent upon one's mental imagery. From the results presented here, differences in reading experience were strongest in story world absorption and specifically in the areas of mental imagery, transportation, and emotional engagement. Importantly, the findings of significance between hyperphantasics/high imagers and mid-range imagers when compared to Class 3 in all subsections of the SWAS point to there being a difference in reading experience that goes beyond whether or not an individual reports being able to see the story in their head.
Mental imagery has been linked with comprehension (De Koning & van der Schoot, 2013; Leopold et al., 2019) and how readers are absorbed into, stimulated by, and/or emotionally relate to a story (Bilandzic & Busselle, 2008; Green & Brock, 2000; Klin & Drumm, 2010; Kuijpers et al., 2014). These studies and others have drawn links between imagery and reading performance. However, as none of these have specifically addressed aphantasia, we now must wonder whether or not our Class 3 has either been under-represented in participants or whether they are able to compensate for a lack of imagery with other tools and strategies.
Individual differences in mental imagery experience should be explicitly included in reading comprehension theories, such as those that discuss an ever-evolving situation model as an essential part of reading (Zwaan & Radvansky, 1998). Indeed, Zwaan and Radvansky (1998) specifically mention that situation models do not necessarily require the creation of literal mental images. However, it is still unclear whether situation models differ fundamentally for people with different imagery profiles. It would seem reasonable to assume that situation models are different in those who report seeing the story like a movie in their head as opposed to those who see nothing at all and who report that they skim past the details. Perhaps specific parts of a situation model will update differently for those in unique profiles (e.g., spatial understanding of a setting rather than a temporal understanding, which may be more consistent across imagery levels).
Finally, our results indicated that imagery level was not strongly related to reading enjoyment. While there was a between-group difference in enjoyment between hyperphantasics/high imagers and aphantasics/low imagers it was relatively small. Even when compared to the next smallest effect size found, Attention (η2 = .042), Enjoyment was still by far the smallest (η2 = .027). Additionally, there was no difference in enjoyment between mid-range imagers and aphantasics/low imagers. Unlike in the other measures where average scores varied by at least a couple of points, the average total enjoyment scores were much closer between all classes, and all were well above the middling score of 27.5. These results suggest that having low or no imagery does not equate to a dislike of reading
Limitations
The final sample size for this study was 287, slightly smaller than we would have wanted for conducting LPAs, with a sample of 300 or more being recommended (Spurk et al., 2020). However, the deliberate over-representation of aphantasics meant that we had an ample enough representation to detect a unique profile, with it being recommended that at least 5% of the sample belong to the category (Weller et al., 2020). Had we not over-recruited aphantasics, which have a population prevalence of four percent (Dance et al., 2022), then we might not have had a sufficient number to detect an aphantasic profile.
Second, the reading measures were answered as a general reflection of reading experience and not in response to specific passages. Using passages would allow greater comparability in self-reported reading experience, relying less on retrospective information. Interestingly,
Third, while LPA analyses suggested that a model with three imagery classes was the best fit for our data, it is possible and indeed seems likely that there are more profiles that would be identified from the mid-low imagery profile should a larger sample be obtained. We have established here that there are significant group differences between high imagers/hyperphantasics and low imagers/aphantasics in all measured areas and in some areas between mid-range imagers and aphantasics. Aphantasics/low imagers who make up Class 3 are distinctly different from the other two Classes, but looking at these results, it is possible that the range of scores for those considered to be low imagers could potentially be expanded to include a higher score threshold. Class 3 absorbed many of the individuals who scored below 100. Though the average was only 35.71, as mentioned this is possibly in large part due to the floor effect of the VVIQ-2 which has a base score of 32. Additionally, as the VVIQ-2 was used, the profiles were influenced by the scores of both the eyes open and closed conditions. Studies using the VVIQ with smaller sample sizes may be unable to detect Class 2 at all, and individuals experiencing different amounts of imagery in one condition over another would then be more likely to be misclassified.
Implications for Future Research
More work is needed to confirm the profiles found in this study. This would mean not only replicating the LPA to confirm the existence of at least three profiles, but work is also needed to solidify our understanding of the ranges of these profiles and what they equate to with regards to experience. For example, future studies should seek to better understand the imagery experience of those who fall into the nebulous range of scores between the averages of Classes 2 and 3. Though it is possible that with a larger sample more profiles could emerge especially from Class 2, for the time being it seems prudent to at least seek a better understanding of why participants were assigned to their respective classes when their scores fell between 46–104 on the VVIQ-2. In general, once this expansion and confirmation work is done, these profiles can and should be used in mental imagery research and specifically studies concerning aphantasia. Interestingly, if the mid-range imagery score range does begin as high as the LPA here suggests, then it is possible that the threshold for meaningful and accessible mental imagery is much higher than previously understood.
This study was concerned with the vividness of visual mental imagery. Vividness of imagery was chosen here to understand one small area of experience. Imagery can be understood as the sensorimotor simulation in the absence of external stimuli (Kosslyn & Jolicoeur, 2021), therefore not constrained to the visual modality, but also encompassing auditory, tactile, gustative, olfactory, vestibular, proprioceptive, and interoceptive information. Initial work indicates that aphantasics generally report a lack of other senses in their conscious imagery as well (Dance et al., 2021), however, more research is needed that systematically tests for imagery profiles in other modalities. Following on from this, it would seem important to understand how different mental imagery profiles experience, and are affected by, educational practices and interventions and the resulting effect on academic trajectories (e.g., finding certain subjects more difficult, being drawn to specific professions). Research has begun to test whether mental imagery is affected by screen media usage in both adults (Suggate, 2023) and children (Suggate & Martzog, 2020), with the reasoning being that screen media supplant active image generation required during reading, for instance. However, this work has not yet specifically looked at different imagery profiles.
It would be interesting to investigate whether these self-perceptions of reading experiences translate into measurable differences in reading comprehension. One such area for future research should consider whether transportation into a narrative is differentially available to those with different imagery profiles, or if the way in which readers are transported into a story is fundamentally different. We have shown in this study that there are group differences with respect to transportation; however, more research is needed to better understand how individuals from these profiles would describe their immersion/transportation into a text (i.e., if they feel as though they are in the story world itself, or if while reading they simply lose track of time in the physical world). This in turn may offer insights into areas such as ludic reading.
Additionally, there have been links made between aphantasia/low imagery and Severely Deficient Auto-Biographical Memory (SDAM) (Watkins, 2018). SDAM is the lack of ability to relive events which have been personally experienced in a vivid first person perspective (Zeman, 2024). Importantly, Zeman (2024) reflects that other types of memory impairments have not been strongly linked to aphantasia/low imagery. This paper only asked participants to reflect on general experience as opposed to asking them to relive a specific moment and therefore memory deficits were not of great concern here. However, there are important implications for memory of a text. If hyperphantasics/high imagers experience transportation into a text as though they are living it while aphantasics/low imagers do not, the ability to relive the text may be very different.
In addition, although differing imagery abilities have not been found to impact remote reading outcomes in adults (Mak et al., 2020; Speed et al., 2024). Work has not yet been conducted to understand if there are implications for these experiential differences in the earlier stages of literacy. When children are learning to read, it would seem crucial to understand if there may be any measurable differences to being in one imagery profile over another. For instance, research could look at ease of decoding and reading comprehension skill acquisition and performance across children's school careers. Further, it could be tested whether children with aphantasia are overrepresented in reading disability diagnoses. Additionally, some methods of reading instruction, particularly those that specifically endeavour to encourage students to work with mental imagery, may benefit some more than others. Ultimately, it will be especially important to understand the full spectrum of imagery in order to effectively support all children as they learn to read, and so that strategies that work for both high and low visual imagery profiles can be identified and implemented.
Conclusion
This study has sought to provide new insight into how we group and understand mental imagery differences. First, we used an LPA analysis and identified three classifications of imagery that corroborated previously held assumptions, we also discovered that for many participants having eyes open or closed made a significant difference to perceived ability. It is therefore further established that there are those with low/no imagery as well as those with vivid/high imagery and then there are all those in between. It now falls to the research community to gain a better understanding of what these differences mean, not only in the context of everyday life but also in the completion of specific tasks. These individuals have been existing and hopefully succeeding in the same settings; however, their experiences with regards to vividness of mental imagery have not been the same. Assuming equal success without data to show aphantasia does not affect access to education or impair job opportunities would seem rash.
Our results here also show that although reading enjoyment is not greatly implicated by imagery classification, there are large group differences in reading and mental imagery but also in their experience of being transported into a story. Perhaps these seem like superficial differences at first glance, but it seems extremely likely that there are larger implications beginning in early childhood and continuing throughout adulthood. Regardless, hopefully this will open the door and inspire research which investigates these differences.
Footnotes
Acknowledgements
We would like to thank Kathryn Asbury, Sophie von Stumm, and Elpida Pavlidou for their valuable insights throughout this study. We would also like to thank the Aphantasia Network for their assistance with recruitment.
Declaration of Conflicting Interests
The authors declared no potential conflicts of interest with respect to the research, authorship, and/or publication of this article.
Funding
The authors received no financial support for the research, authorship, and/or publication of this article.