
Abstract
Individual-level data are routinely used in trial-based economic evaluations to assess the effectiveness and costs of a given intervention. While effectiveness measures are often expressed via utility scores derived from health-related quality-of-life instruments (e.g., EQ-5D questionnaires), information on different types of health care resource use (HRU) measures (e.g., number and types of services) are collected to compute the costs. Partially complete HRU data, particularly for self-reported questionnaires, are handled via ad hoc methods that rely on some assumptions (fill in a zero) that are typically hard to justify. Although methods have been proposed to account for the uncertainty surrounding missing data, particularly in the form of multiple imputation or Bayesian methods, these have mostly been implemented at the level of costs at different times or over the entire study period, while little attention has been given to how missing values at the level of HRUs should be addressed and their implications on the final analysis. We present a general Bayesian framework for the analysis of partially observed HRUs in trial-based economic evaluations, which can accommodate the typical complexities of the data (e.g., excess zeros, skewness, missingness) and quantify the impact of missingness uncertainty on the results. We show the benefits of our approach with a motivating example and compare the results to those from more standard analyses fitted at the level of cost variables after adopting some ad hoc imputation. This article highlights the importance of adopting a comprehensive modeling approach to handle partially observed HRU data in economic evaluations and the strategic advantages of building these models within a Bayesian framework.
Highlights
Missing health care service data in trial-based economic evaluations are often removed or imputed using quite restrictive assumptions (e.g., no use of service).
We propose a flexible Bayesian approach to account for missing health care service uncertainty and compare the results with models fitted at more aggregated levels (e.g., total costs) using a real case study.
Our results show that, depending on the (assumed) missingness assumptions and the level of data aggregation at which analyses are performed, results may be considerably changed.
When feasible, analyses should be conducted at the most disaggregated level to ensure that all available information collected in the trial is used in the analysis without relying on (often) restrictive ad hoc imputation approaches.
Keywords
Economic evaluations represent an increasingly important component in the process of health technology assessment (HTA) of new health care interventions in many countries.1,2 In the context of trial-based economic evaluations, HTA institutions recommend cost-utility analysis as the “reference case” approach, using health-related quality-of-life (HRQol) utility scores as the health outcome to ensure direct comparability of interventions across disease areas. Alongside utilities, costs are computed by applying the appropriate unit prices, retrieved from the literature or national sources, to the amount of health care resource use (HRU) consumed by the patients over a certain period of time (e.g., number and type of visits over the past 3 mo). Self-reported questionnaires, such as the Client Service Receipt Inventory 3 and iMedical Cost Questionnaire, 4 are routinely used to collect HRU data but often suffer from low completion rates.
Previous reviews have advocated for the importance of dealing with missing outcome data in trial-based economic evaluations5,6 and have highlighted an overall improvement over time in current practice toward the adoption of approaches that formally take into account the uncertainty around missing values, such as multiple imputation. 7 A more recent review provided an updated analysis of the missingness approaches used in economic evaluations and revealed a somewhat unclear picture about the consistency of the methods used to address missingness at different levels of aggregation. 8 More specifically, the authors highlighted a clear difference between the typical methods used to handle missing values at the level of cost/utility data, where multiple imputation is often used, compared with the level of questionnaire items, where some form of single imputation approach is used. While this may not pose a problem for EQ-5D questionnaires, often characterized by unit nonresponse (all answers skipped), the same cannot be said for HRU questionnaires, which are typically lengthy and subject to item nonresponse (some answers skipped). As a result, when confronted with partially missing HRU responses, analysts may decide to “fill in the gaps” based on some specific assumptions such as no use of service (i.e., imputed as 0). Although this can be justified in some cases based on external information, when this is lacking, it is essential that the uncertainty around missing HRU data is properly quantified and its impact on the analysis results reflected.
Building on the existent literature, we propose a novel Bayesian framework for trial-based economic evaluations that allows a flexible model specification and the handling of missing data at the HRU level. The choice of a Bayesian approach has practical advantages compared with a standard frequentist framework,9,10 including 1) the use of a modular structure to increase model complexity in a relatively easy way, 11 2) natural interpretation of cost-effectiveness results in probabilistic terms, 12 and 3) direct implementation of probabilistic sensitivity analysis, consisting in the quantification of the impact of parameters’ uncertainty on the conclusions. 13 We show the benefits of using our framework on a real case study, with a focus on appropriately modeling partially observed HRU values and its implications in terms of inferences and, crucially, cost-effectiveness results.
The article is structured as follows: the second section presents the case study and describes the data. The third section defines the general framework of the statistical models used to analyze costs/utilities and HRU values. The fourth section compares the results of models fitted at different levels of aggregation and shows how different assumptions about partially missing cases may affect the model estimates. The fifth section performs the economic evaluation, summarizes the inferences for each model, and compares the cost-effectiveness results. The sixth section discusses the proposed framework and suggests some improvements for future work. Finally, the Appendix includes additional material related to model assessment and results, while the software code is provided in the online supplementary material.
Case Study: The PBS Trial
The Positive Behaviour Support (PBS)
14
trial was a multicenter, randomized controlled trial involving community intellectual disability services and service users with mild to severe intellectual disabilities and challenging behaviors. Positive behavior support is a multicomponent intervention that is designed to foster prosocial actions and enhance the person’s quality of life and their integration within the local community. Participants (N = 244) were enrolled and randomly allocated to staff teams trained to deliver PBS in addition to treatment as usual (reference intervention,
Individual-level utility scores at each time
Number (Proportion) of Missing Cases for the Utilities and Different Health Care Resource Use Services (Self-Reported Questionnaires), Presented by Time Point of the Trial a
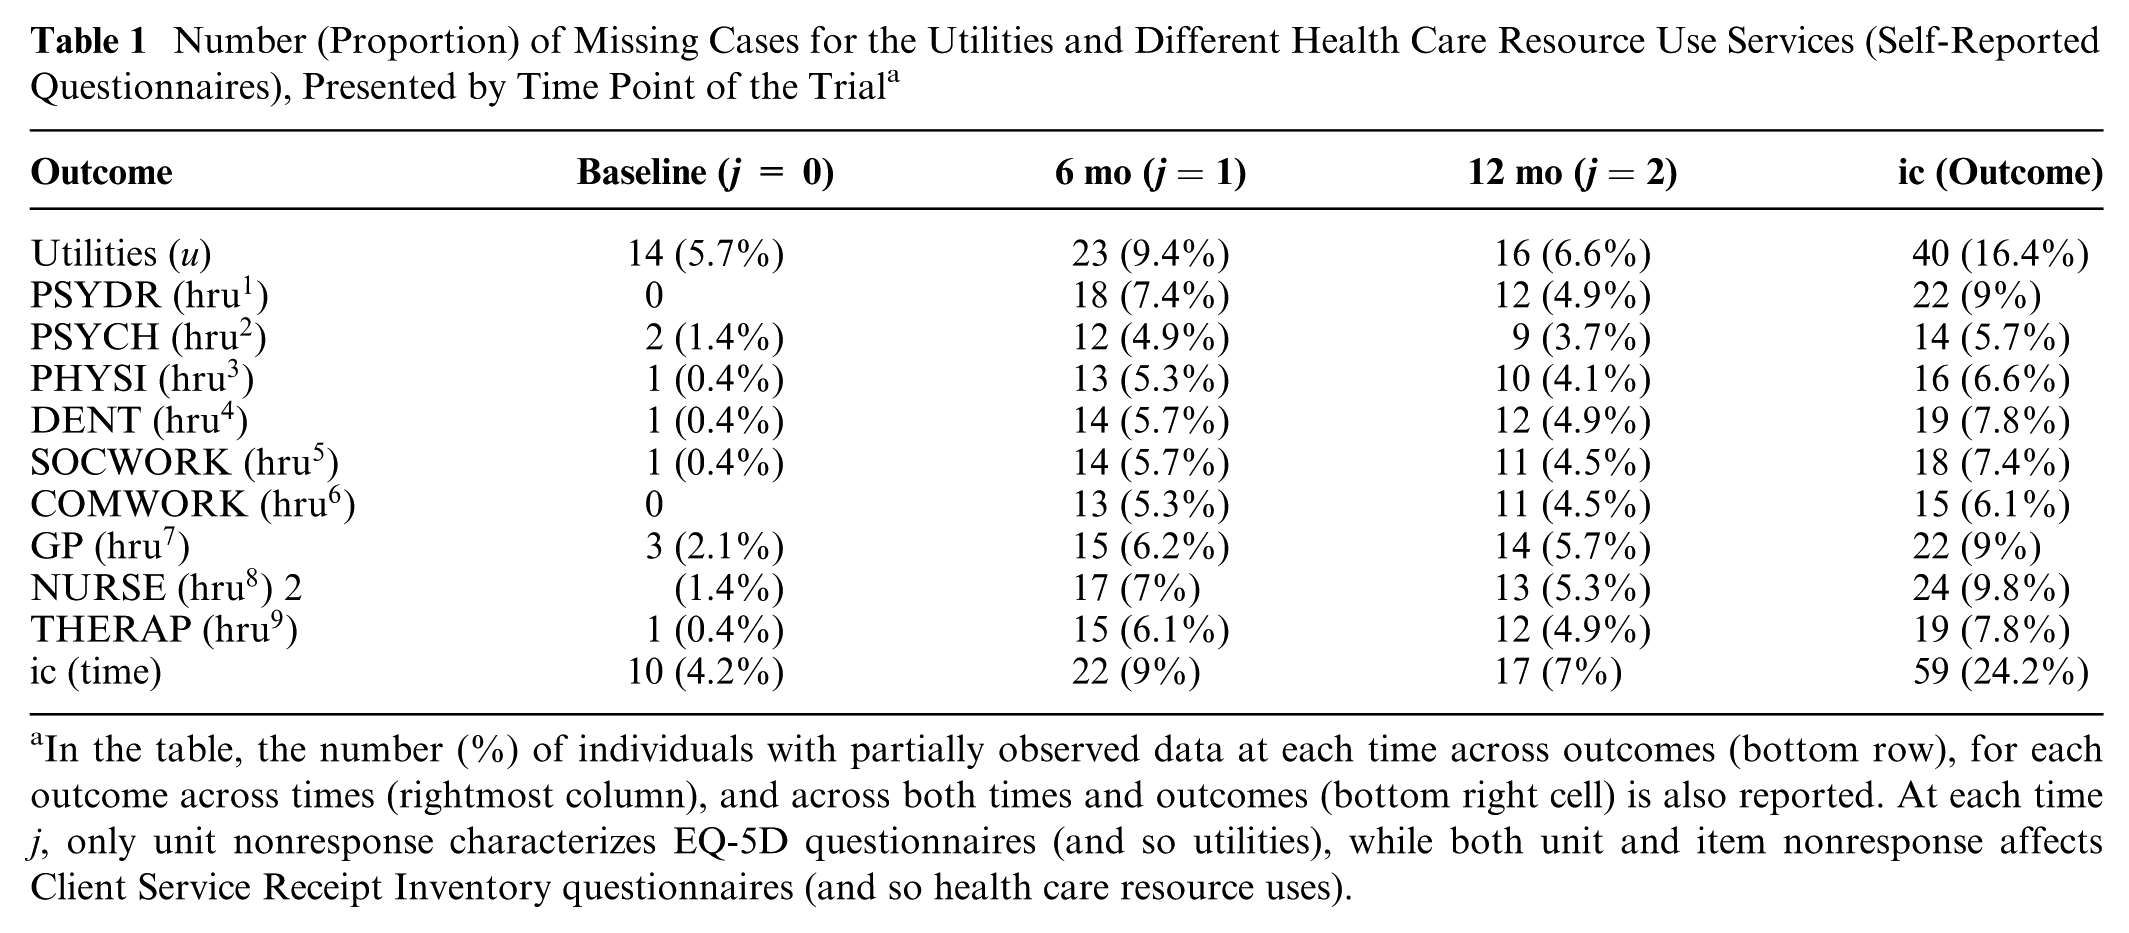
In the table, the number (%) of individuals with partially observed data at each time across outcomes (bottom row), for each outcome across times (rightmost column), and across both times and outcomes (bottom right cell) is also reported. At each time j, only unit nonresponse characterizes EQ-5D questionnaires (and so utilities), while both unit and item nonresponse affects Client Service Receipt Inventory questionnaires (and so health care resource uses).
Overall, the proportions of missing values are moderate and never exceed
In addition to missingness, a typical feature of HRU data is the amount of “extreme” values that remain constant over time (e.g., zero values), typically denoted as “structural values.” 17 Table 2 reports the number (proportions) of structural zeros observed for each type of HRU service in the PBS study.
Number (Proportion) of Structural Zeros Observed for Each Type of HRU Service in the PBS Study
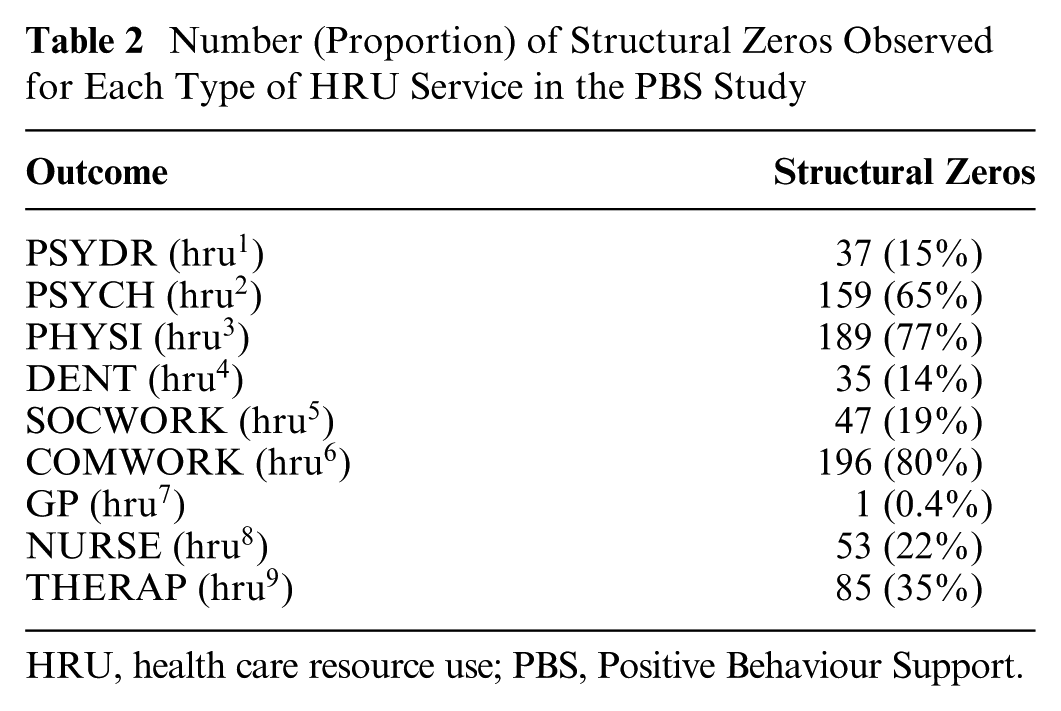
HRU, health care resource use; PBS, Positive Behaviour Support.
The proportions of structural zeros in most HRUs range from
Modeling Framework
We first present our framework building upon previously introduced approaches. We start by considering models fitted at the level of total costs and quality-adjusted life-years (QALYs)18−21 or costs and utilities at different times22,23 and then extend these to account for partially observed HRU data. The framework allows for typical features of cost-effectiveness data (e.g., skewness, correlation, structural values) while also handling missing HRUs without relying on ad hoc assumptions (e.g., assumed zeros). Although different study designs in terms of data collection could be considered (e.g., multiple times for the effectiveness but only 1 for costs), we argue that the PBS data reflect the typical design used in many trial-based economic evaluations. 24 Thus, we illustrate the framework using the trial design (see the second section) as reference, where disaggregated outcomes are collected at baseline and equally spaced follow-up times. However, we note that the framework can also be modified to handle different types of data structures, including different collection times between outcomes and/or a cross-sectional design for some variables.
Assume that some patient-level HRU and HRQol data from a trial are collected via self-reported questionnaires (e.g., CSRI and EQ-5D) at equally spaced times
where
The framework allows the modeling of different types of variables: HRU and HRQoL, costs and utilities at each time, or total costs and QALYs. In principle, it is arguably easier to specify a model for aggregated (e.g., total costs) compared with disaggregated variables (e.g., costs or HRU), since it allows for performing the analysis based on a fewer number of variables and a cross-sectional setting. However, in reality, the occurrence of missing values at the most disaggregated level (i.e., HRU and HRQoL) is unavoidable, with proportions of unobserved values that are usually substantial.5,6 In the presence of partially missing questionnaire answers, modeling at aggregated levels (e.g., costs or total costs) does not allow direct incorporation of the evidence from the partially observed items, which need to be discarded unless their values are imputed prior to the analysis. While item nonresponse is often not a problem for HRQoL, 25 it severely affects HRU data, with many individuals providing information about the usage of only some of the services. 26 To our knowledge, guidelines on the handling of partially missing HRU data are not available, with analysts often not reporting detailed information about their proportions of missing values. 8 When information on HRUs is lacking, it is plausible to assume that some deterministic imputation of item nonresponses is used to improve data completeness. A typical example occurs when individuals with a missing value on a specific service are assumed to not have used it, thus suggesting the replacement of the unobserved value with a zero. However, such assumption can never be verified based on the observed data and, when repeatedly applied for different services, times, and individuals, may have a substantial effect on the analysis results.
We separately present our approach by level of data aggregation: 1) total costs and QALYs
Modeling of Total Costs and QALYs
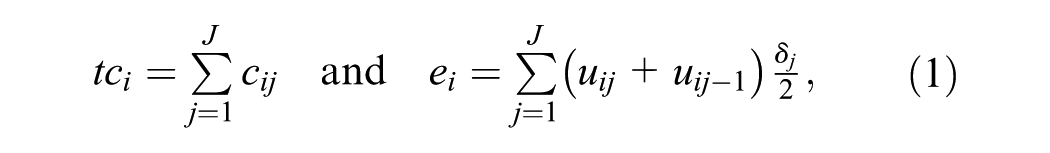
At the most aggregated level, data are summarized into effectiveness and total costs (

where, for example,
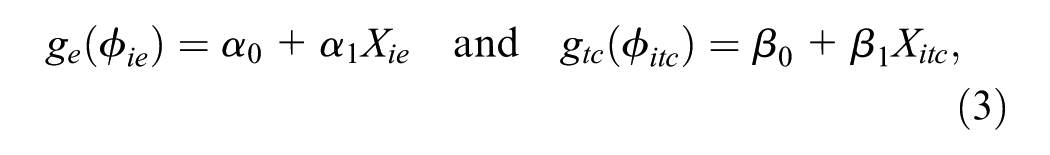
where the sets of regression parameters
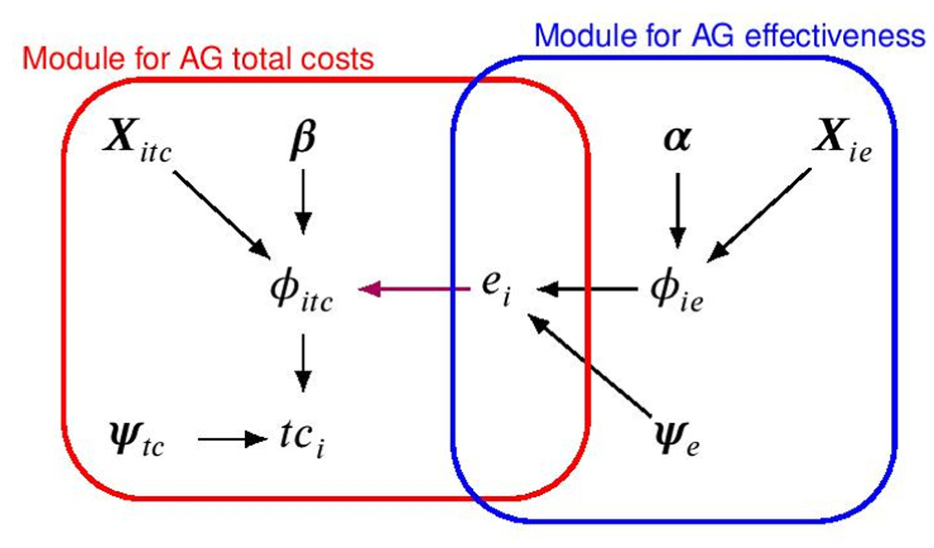
Joint distribution, expressed in terms of a marginal distribution for the effectiveness and a conditional distribution for the total costs, respectively, indicated with a blue and red line. The parameters indexing the corresponding distributions or “modules” are indicated with different Greek letters, while the black and magenta arrows show the dependence relationships between the parameters within and between the 2 models, respectively. Note that
An appealing feature of this strategy is the need to specify only 2 distributions. However, when HRU nonresponse occurs, analysts need to handle the partially observed disaggregated data prior to fitting the model. As a simple solution, they could either discard all cases with partially observed HRUs or impute as zero all HRU nonresponses (
Modeling of Costs and Utilities at Each Time
At an intermediate aggregation level, the data consist of 2 longitudinal variables, namely, the utilities and costs computed at each time (

where

where the sets of regression parameters
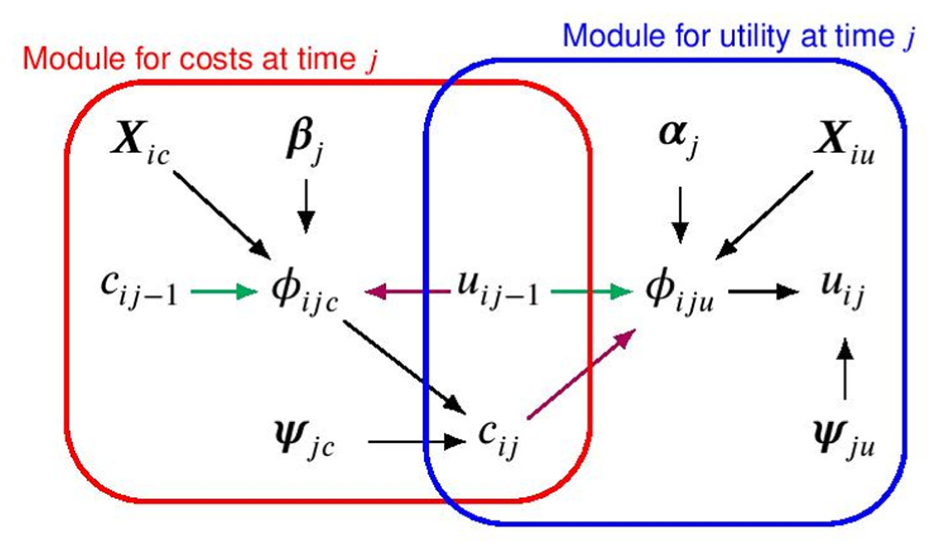
Joint distribution, expressed in terms of a conditional distribution for utilities and costs at time
Although this strategy can be more challenging to implement than that in the “Modelling of Total Costs and QALYs” section, it provides a more efficient way to handle partially observed cases. Indeed, by modeling longitudinal variables, missingness uncertainty at any time can be directly quantified through a probabilistic approach without relying on ad hoc imputation methods. However, if participants provide partial information at the level of the questionnaires (i.e., item nonresponse), analysts are still required to handle partially observed responses prior to model fitting. As a simple solution, they could either discard all cases with partially observed HRUs or impute as zero all partially observed HRUs at each time (
Modeling of HRU Services and Utilities at Each Time
At the most disaggregated level, the data consist in the series of longitudinal variables
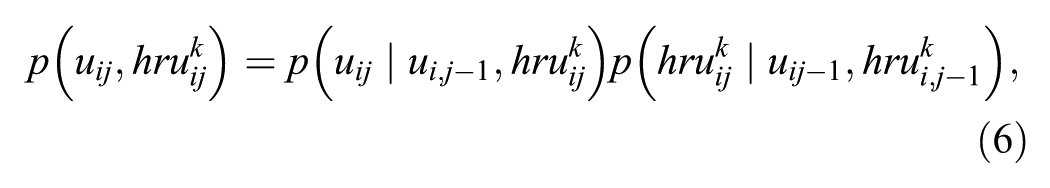
where

where the sets of regression parameters
To specify a Hurdle model for HRUs, we first define an individual indicator variable
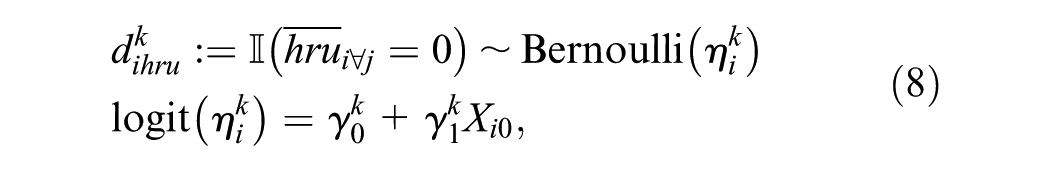
where

These quantities can then be combined with unit prices
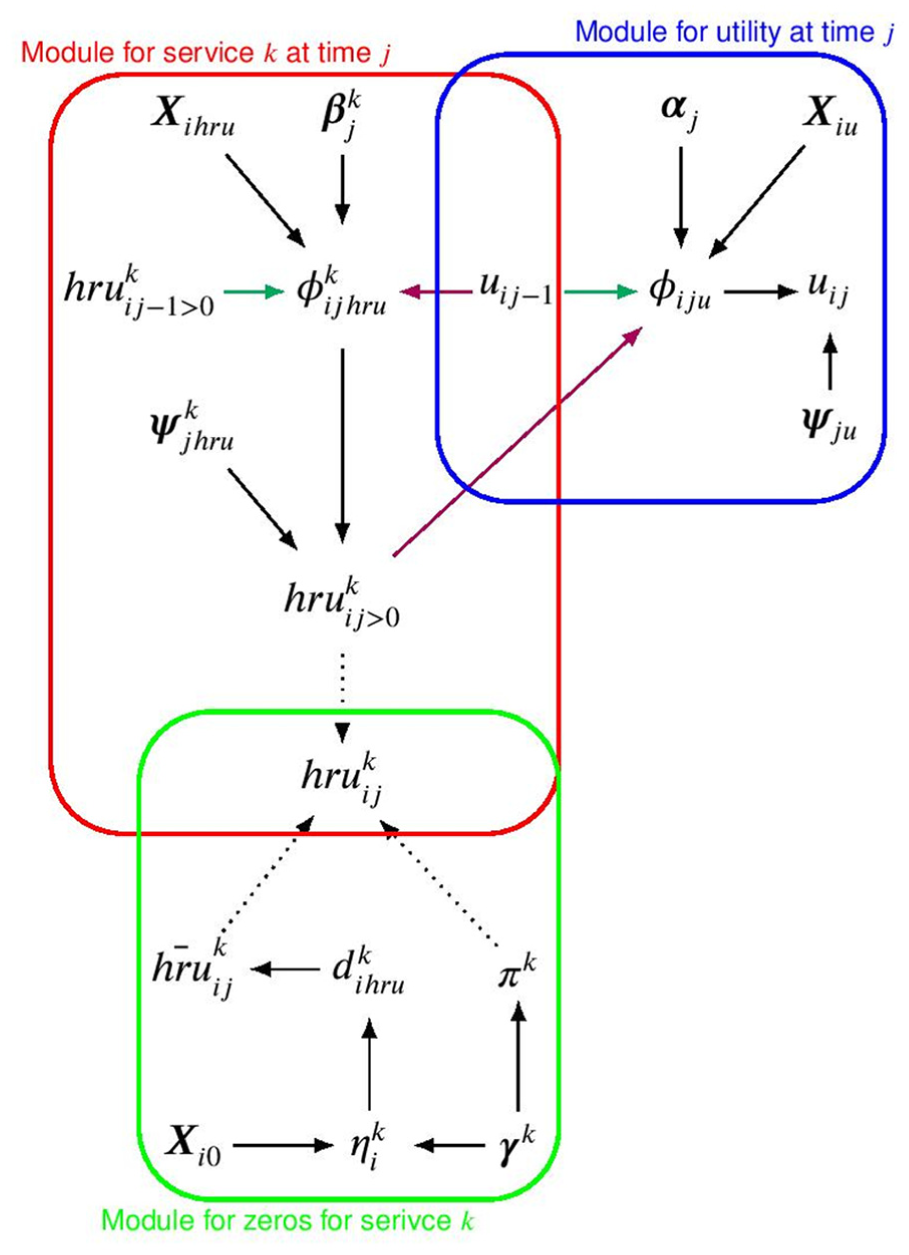
Joint distribution, expressed in terms of conditional distributions for utilities, nonzero and structural zero HRUs at time
The proposed strategy is more challenging to implement compared with those given in the “Modeling of Total Costs and QALYs” and “Modeling of Costs and Utilities at Each Time” sections due to the presence of multiple HRU variables, each consisting of a 2-part mixture for the nonzero and structural zero component. However, defining the model at the most disaggregated level provides the most efficient way to handle partially observed HRUs. We note that the dependence structure in equation 4 and equation 6 is simply one possible choice, which was selected based on the comparison of the model fit to the PBS data and with respect to alternative specifications. In general, we recommend that analysts explore different specifications and select the one that provides the best compromise between flexible dependence structures between the modeled variables and a feasible implementation to the available data.
Results
All models were fitted using
We also compared the results from our analyses to those of a traditional modeling approach based on a frequentist statistical framework. Although it is difficult to identify a standard approach for handling missing values and modeling health economic data in routine analyses, we used information collected from previous reviews5,6,8 to identify the methods used in this analysis. A detailed description of the methods used under the traditional modeling approach is provided in Appendix A alongside a summary of the statistical and health economic results derived from it. In Appendix B, we explain in detail how the hurdle model was implemented in
Model Estimates
Table 3 compares the posterior results of models fitted to the PBS data at the level of S1) total costs and QALYs, S2) costs and utilities at each time, and S3) HRU categories and utilities at each time. Within the first 2 strategies, alternative approaches to handle partially observed data are implemented. For strategy 1, missing cases are either included in the analysis (ALL), imputed as zero only for HRUs (IMP-H), or imputed as zero for both HRUs and costs (IMP-HC). For strategy 2, missing cases are either included in the analysis (ALL) or imputed as zero only for HRUs (IMP-H). Finally, for strategy 3, all data with no ad hoc imputation are used (ALL). Table 4 shows the posterior estimates and
Posterior Means and
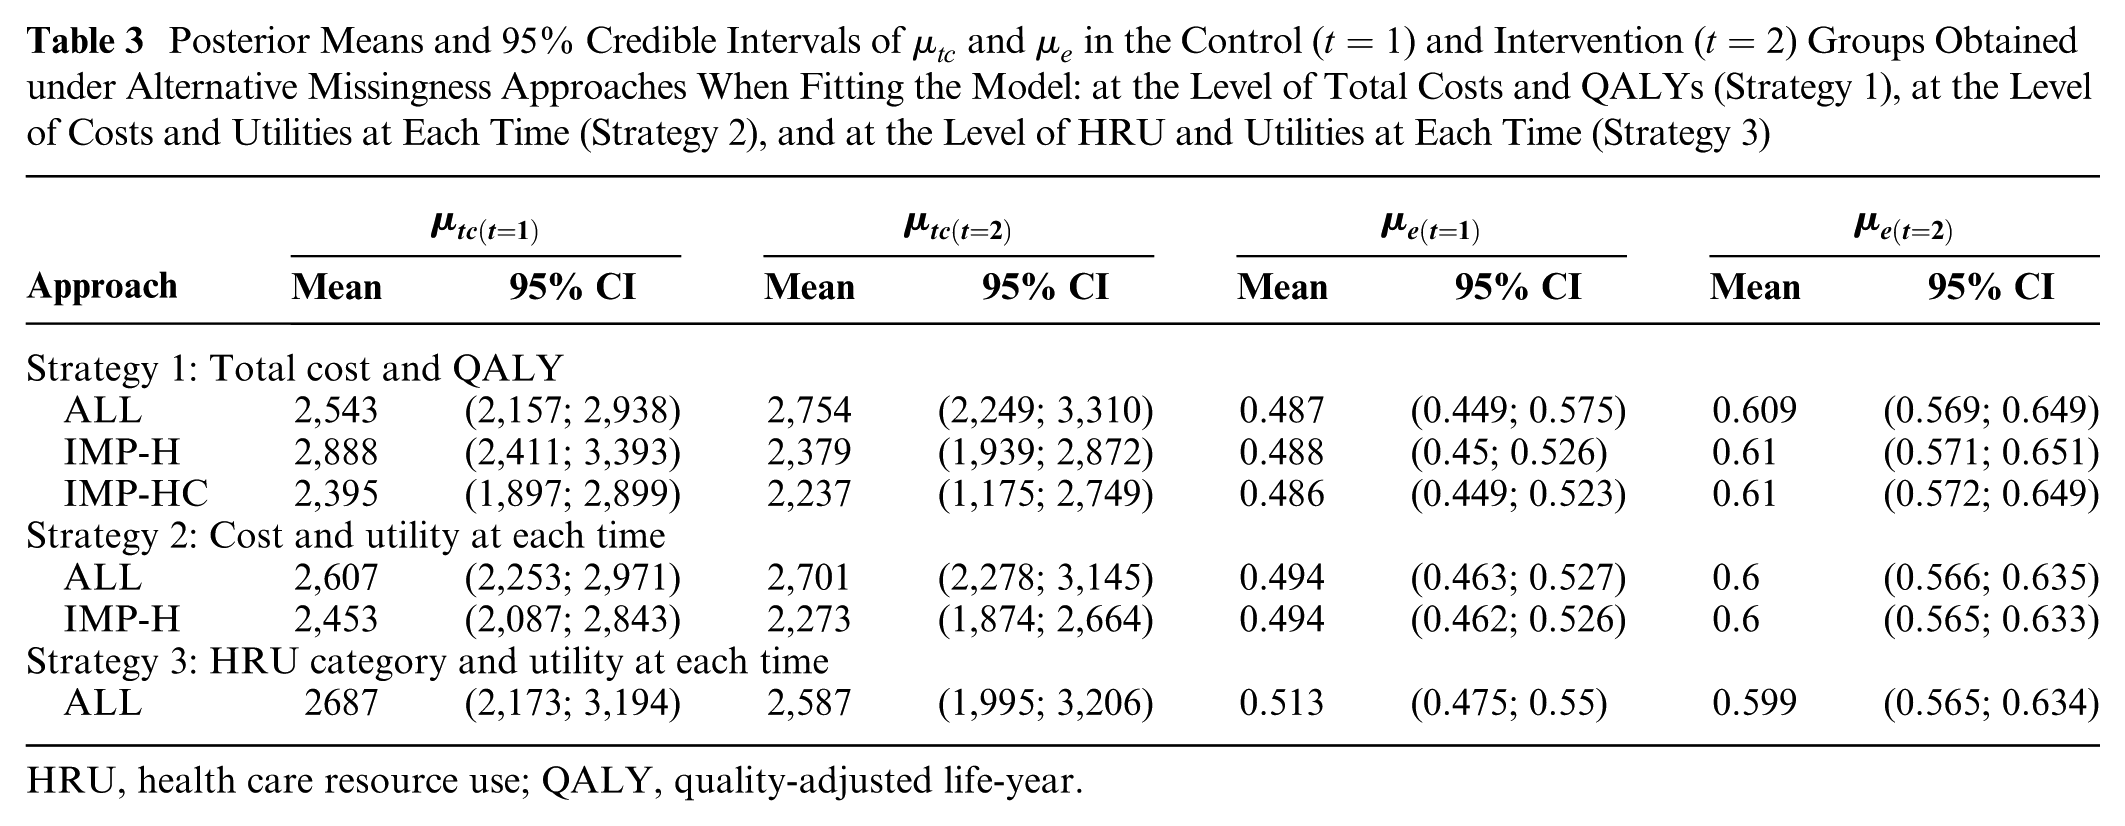
HRU, health care resource use; QALY, quality-adjusted life-year.
In general, estimates of mean QALYs in both treatment groups are always very similar. This is expected in that, within each strategy, zero imputation was considered only for HRU/cost variables, thus not affecting utilities and/or QALYs. In addition, since only unit nonresponse affects HRQoL data, no substantial information gain is obtained by modeling utilities compared with QALYs, with average estimates remaining almost unchanged across all strategies.
A comparison of the estimates obtained under strategy 1 suggests that an analysis fitted to all cases without zero imputation (ALL) is associated with mean total cost estimates for the intervention that are higher compared with those of the control group (
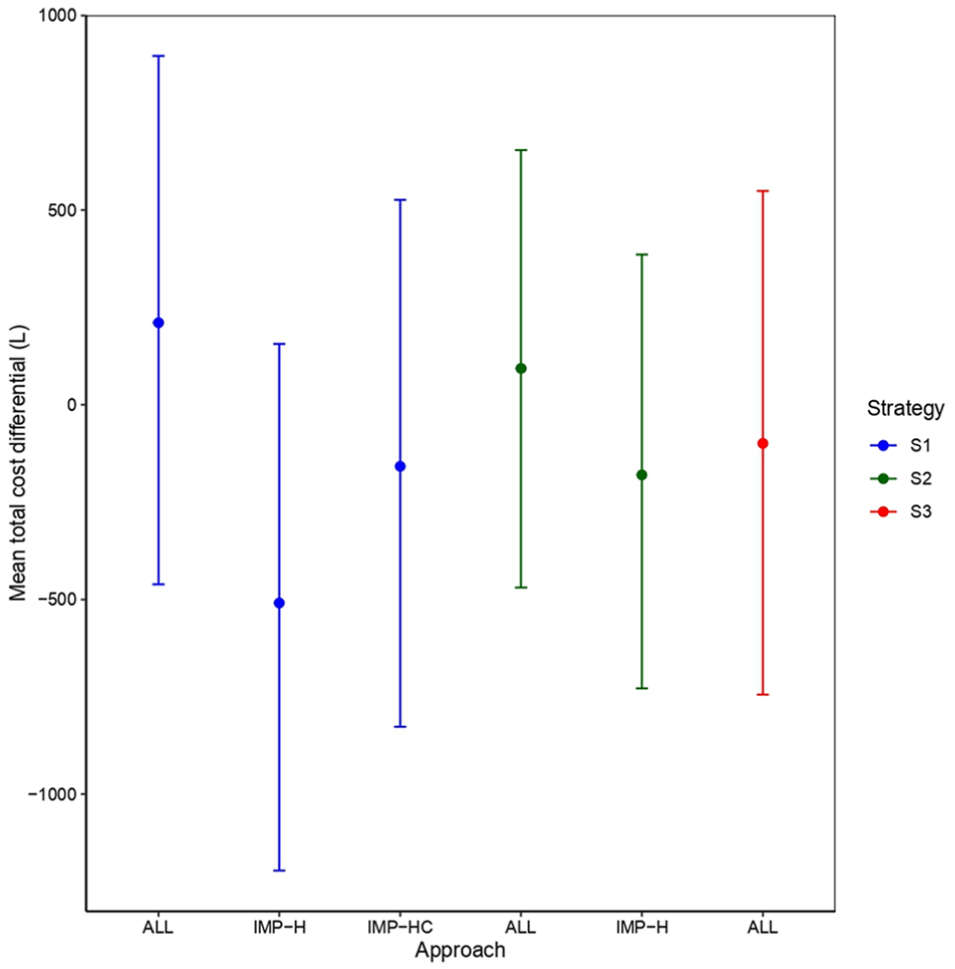
Estimated mean total cost difference between treatment groups in the Positive Behaviour Support study based on different modeling strategies (S1, S2, S3) and alternative approaches to handling missing health care resource use and/or cost data.
Mean estimates derived from models fitted at the level of total costs (S1, blue color) show a considerable degree of variability and slightly positive (ALL), slightly negative (IMP-HC), or quite negative (IMP-H) values. Similar conclusions can be drawn based on the results from models fitted at the level of the costs at each time (S2, green color). However, results derived from direct modeling of HRU data (S3, red color) show average estimates in favor of the intervention (slightly cheaper than the control) and located between the results under ALL and the other zero-imputation approaches (for S1 and S2). Although no formal bias assessment is possible, due to the empirical nature of the analyses, we note that for aggregated modeling strategies (S1 and S2), estimates based on some form of zero imputation (IMP-H, IMP-HC, IMP-H) are systematically lower compared with those based on models in which no ad hoc imputation was done (ALL). This suggests that reliance on the zero imputation of HRU/costs, which distorts the original data and likely leads to an underestimation of missingness uncertainty, can substantially drive the model estimates.
Economic Evaluation
We end by assessing the cost-effectiveness of the intervention, comparing the results under each modeling strategy. We specifically rely on the examination of the cost-effectiveness plane (CEP) 37 and the cost-effectiveness acceptability curve (CEAC) 38 to summarize the health economic analysis.
The CEP (Figure 5a) is a graphical representation of the joint distribution of the population average effectiveness and costs increments between the arms. In the graph, we show the results only under ALL (light blue for S1, light green for S2, and light red for S3) to ease presentation. The slope of the straight line crossing the plane is the willingness-to-pay threshold (often indicated as
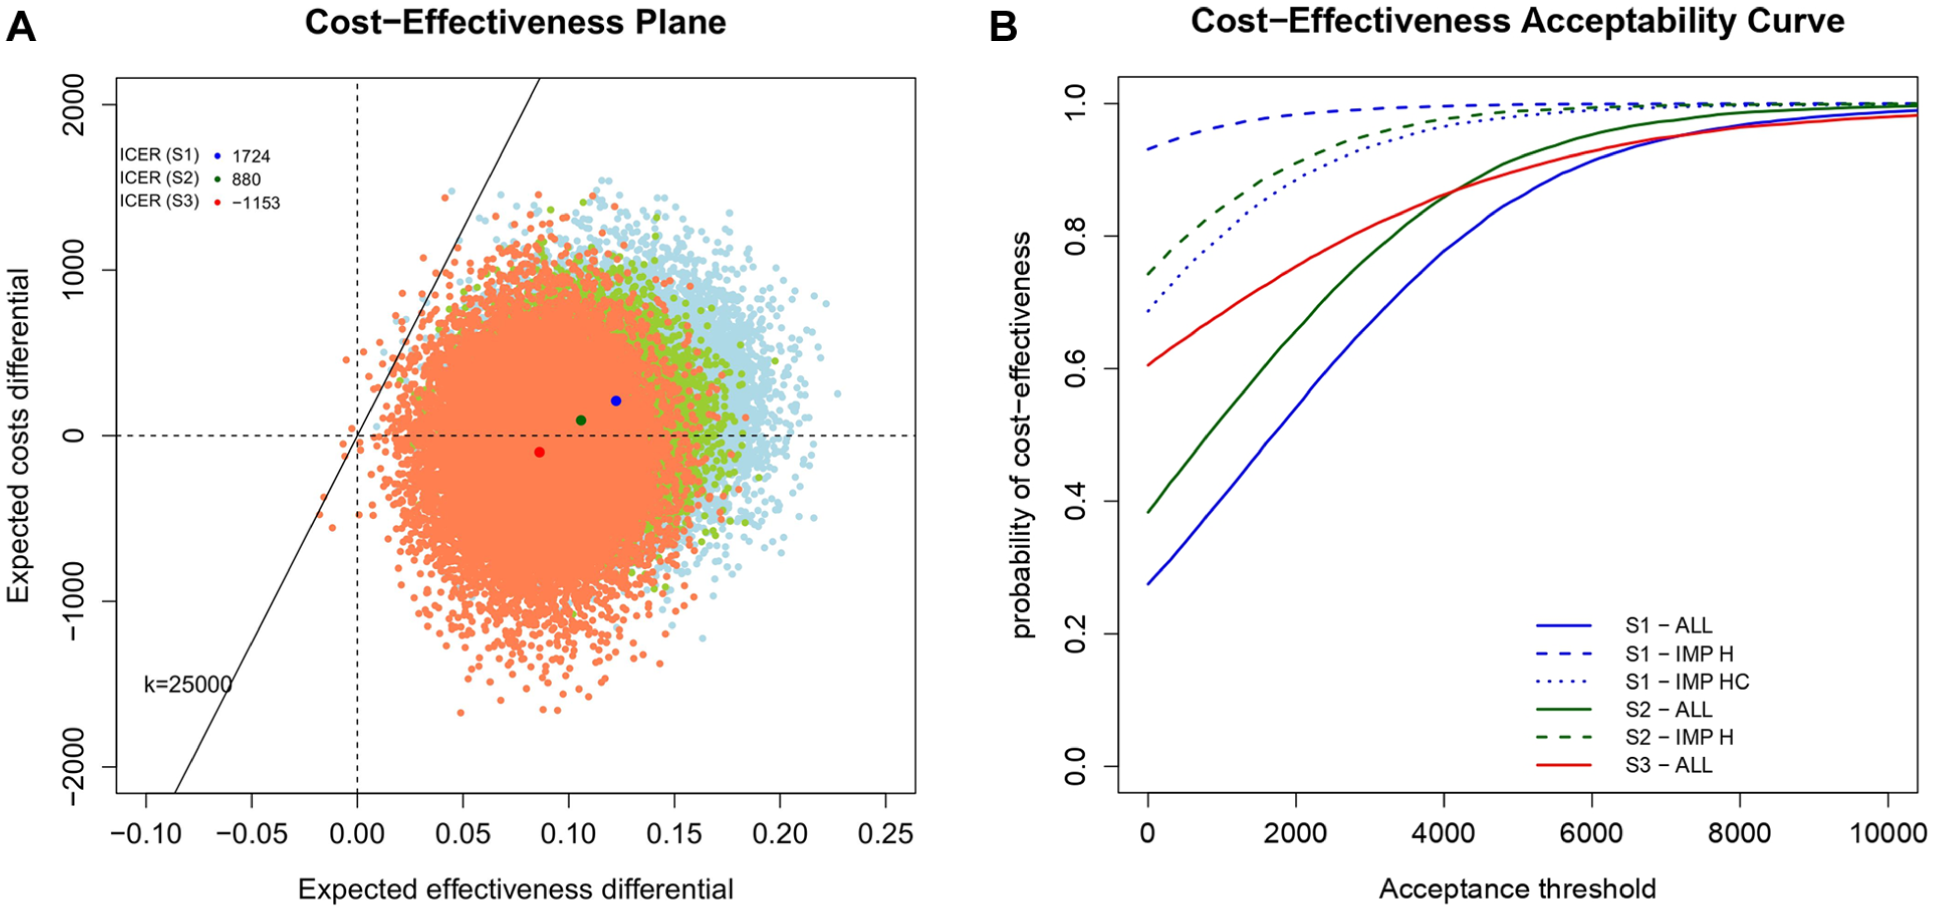
(a) Cost-effectiveness planes (CEPs) and (b) cost-effectiveness acceptability curves (CEACs) associated with alternative modeling strategies and missingness approaches. In the CEPs, incremental cost-effectiveness ratios based on the results from ALL under the 3 modeling strategies are indicated with corresponding darker colored dots (blue for S1, green for S2, and red for S3), while the straight line passing through the plot (evaluated at
The CEAC (Figure 5b) is obtained as the proportion of dots lying in the sustainability area upon varying the acceptance threshold
Discussion
Trial-based economic evaluations are typically conducted on quantities that are derived from disaggregated data, such as self-reported EQ-5D and HRU questionnaires, which are almost inevitably affected by missingness. For HRU outcomes, the lack of a “gold standard” method of data collection 39 and the typical occurrence of item nonresponse patterns make the task of handling missingness particularly challenging. Analysts routinely rely on some ad hoc methods to handle missing values that often involve specific assumptions, for example, zero-imputed corresponding to no use of service. Although this might be reasonable in some cases, zero imputations is often performed to ensure a higher completeness rate for more aggregated outcomes. This, however, can be a dangerous practice in that it fails to fully recognize the impact of missingness uncertainty and may even distort estimates and mislead cost-effectiveness assessments. Although this problem may be less relevant in some cases, for example, when disaggregated data are either fully observed or fully missing at each moment of collection (e.g., EQ-5D questionnaires), it becomes crucial when data are affected by item-level missingness, which is typically the case for HRU questionnaires.
In this article, we have presented a general modeling framework to handle item-level HRU missingness without requiring any ad hoc imputations. The framework takes advantage of the Bayesian setting to handle different features of the data while also directly quantifying the impact of missingness uncertainty on cost-effectiveness results. Our approach represents an improvement with respect to the current practice and can be implemented in a relatively easy way using freely available software.
In the PBS study, analyses implemented without zero imputation resulted in estimates of cost-effectiveness that were considerably lower compared with approaches based on zero-imputed data, especially for low values of the acceptance threshold (between
According to these considerations and previous guidelines, 40 we formulate the following recommendations for analysts. First, at the design stage, appropriate strategies should be used to minimize the number of missing values in the data collected during the study 41 such as reducing the length of the follow-up period and/or the number of items within the questionnaires. Second, once the data are collected, the practice of ad hoc imputing HRU data (e.g., zero) should be avoided, unless clearly motivated, since it can distort the data and lead to incorrect inferences. Third, at the analysis stage, the choice of the modeling approach should be informed based on the observed missingness patterns. When individuals are associated with fully missing responses in questionnaires and over time points, no advantage can be obtained by focusing on disaggregated data, and modeling at the level of QALYs and total costs is likely to be appropriate. When individuals are associated with fully missing responses in questionnaires but partially observed responses across time points, a model fitted at the level of longitudinal utilities and costs should be preferred. When individuals are associated with partially missing responses within questionnaires and across time points, only a model fitted at the level of questionnaire responses (e.g., HRU categories) allows for full use of all the available evidence collected. Note that, in practice, the implementation of models at more disaggregated levels becomes more challenging as the number of outcomes, time points, and missing values increases. Thus, analysts should consider the feasibility of the ideal approach in relation to the available data and, when necessary, implement strategies to facilitate its implementation. Examples include simplification of the dependence structure among the modeled variables to reduce the number of parameters to estimate, the use of more informative priors to handle sparse data, and aggregation of some types of disaggregated data (e.g., different types of health care categories) to reduce the number of modeled variables.
Results obtained from a traditional approach, based on multiple imputation by chained equations (MICE) and bootstrapping (shown in Appendix A), lead to estimates and cost-effectiveness conclusions that were in line with those from Bayesian models. However, we encountered some practical issues that limited the implementation of the traditional approach. First, all attempts to apply the method at the level of HRU categories led to substantial convergence problems in the MICE algorithm. Second, on a standard computer with a
Our results are obtained with specific reference to the case study considered. However, the PBS trial is very much representative of the “typical” dataset used in health economic evaluation alongside studies. Thus, it is highly likely that the same features (and potentially the same contradictions in the results, upon varying the complexity of the modeling assumptions) apply to many real cases. We note that the decision-theoretic framework granted by the Bayesian approach provides a natural setting to quantify the impact of the uncertainty on the results while also allowing an intuitive probabilistic interpretation of standard cost-effectiveness outputs (e.g., CEACs). For example, if results are not robust to a set of departures from the benchmark missingness assumption, further analyses can be sought by means of more advanced methods to explicitly investigate the variability in the unobserved values based on external information (e.g., selection models or pattern mixture models).42,43
There are 2 main limitations of the proposed framework. First, the choice of treating partially observed data for each variable under a common missingness assumption may be practically convenient but not realistic. It is plausible that the presence of different missingness patterns suggests the existence of different missingness processes, for example, people who drop out of the study are likely associated with different reasons with respect to those who missed a few visits, and such processes should be specified separately. Second, the model may become computationally challenging when the number of variables (i.e., time points or HRU categories) increases. Alternative approaches could be used to overcome these limitations. For example, the sparsity of the data could be handled by either aggregating some variables based on some plausible justifications (e.g., aggregating different types of GP visits as a single HRU category and computing a weighted price) or by using shared priors to use the information from the observed data across all or some of the variables to facilitate the identification of some parameters.
In conclusion, in this work we have presented a flexible Bayesian analytic framework that can 1) jointly model HRUs and effectiveness, 2) account for the features of the data, and 3) make full use of the available evidence to quantify the impact of missingness uncertainty without the need to rely on ad hoc imputations prior to model fitting. Unless clearly justified based on some external information, analyses that rely on these ad hoc imputations prior to model fitting will produce results that are likely driven by the specific approach used (and therefore implicit assumptions made) and should therefore be avoided.
Supplemental Material
sj-pdf-1-mdm-10.1177_0272989X251376026 – Supplemental material for A Bayesian Modeling Framework for Health Care Resource Use and Costs in Trial-Based Economic Evaluations
Supplemental material, sj-pdf-1-mdm-10.1177_0272989X251376026 for A Bayesian Modeling Framework for Health Care Resource Use and Costs in Trial-Based Economic Evaluations by Andrea Gabrio in Medical Decision Making
Footnotes
Appendix A: Estimates from the Models Fitted at Different Levels
Appendix B: Implementation “Trick” to Handle Zero Values
The model specified at the most disaggregated level of the data uses a different sampling distribution for the
where
If we set the mean of the structural-zero component
and set
In fact, the estimation of the other parameters is not really affected by this choice, provided that the encoded prior really induces the variance toward zero. It is also plausible that different values for
With this in mind, we have used different values for
Acknowledgements
We would like to acknowledge the hard work of all the people involved in the Positive Behavior Support trial and to thank them for providing us with access to their data.
The author declared no potential conflicts of interest with respect to the research, authorship, and/or publication of this article. The author received no financial support for the research, authorship, and/or publication of this article.
Ethical Considerations
The authors did not carry out any human and/or animal studies for this publication submission. In addition, the authors of this article do not have any ethical considerations to disclose.
Consent to Participate
The authors did not carry out investigations involving humans for this publication submission.
Consent for Publication
Not applicable.
Data Availability
References
Supplementary Material
Please find the following supplemental material available below.
For Open Access articles published under a Creative Commons License, all supplemental material carries the same license as the article it is associated with.
For non-Open Access articles published, all supplemental material carries a non-exclusive license, and permission requests for re-use of supplemental material or any part of supplemental material shall be sent directly to the copyright owner as specified in the copyright notice associated with the article.