
Abstract
Patient-level health economic data collected alongside clinical trials are an important component of the process of technology appraisal. For end-of-life treatments, the modeling of cost-effectiveness data may involve some form of partitioned survival analysis, in which measures of quality of life and survival for pre- and postprogression periods are combined to generate aggregate measures of clinical benefits (e.g., quality-adjusted survival). In addition, resource use data are often collected and costs are calculated for each type of health service (e.g., treatment, hospital, or adverse events costs). A critical problem in these analyses is that effectiveness and cost data present some complexities, such as nonnormality, spikes, and missingness, which should be addressed using appropriate methods to avoid biased results. This article proposes a general Bayesian framework that takes into account the complexities of trial-based partitioned survival cost-utility data to provide more adequate evidence for policy makers. Our approach is motivated by, and applied to, a working example based on data from a trial assessing the cost-effectiveness of a new treatment for patients with advanced non–small-cell lung cancer.
• This is the first article proposing a Bayesian modeling framework for patient-level partitioned survival cost-utility analysis that can jointly take into account the typical complexities of the data, such as correlation, skewness, and spikes at zeros. • The framework is defined using a modular structure that enables a flexible model specification in terms of a sequence of conditional parametric distributions that can be chosen based on the specific characteristics of each modeled variable (e.g., type of effectiveness or cost component). • The proposed methods overcome the limitations of standard approaches that ignore at least some of the complexities of the data and, although easier to implement and well established among practitioners, may mislead cost-effectiveness decisions of policy makers.
Keywords
The statistical analysis of health economic data is an increasingly important component of clinical trials, which provide one of the earliest opportunities to generate economic data that can be used for decision making.
1
The standard analysis of individual-level data involves the comparison of 2 interventions for which suitable measures of effectiveness and costs are collected on each patient enrolled in the trial, often at different time points during the follow-up. Different types of resource use data (e.g., hospital visits, consultations, scans, number of doses, etc.) are collected for each patient and time point using electronic health records, self-reported questionnaires, or a combination of these. Service use information is combined with unit prices to calculate patient-level costs for different health services and then summed up over the follow-up. The effectiveness is often measured in terms of preference-based health-related quality-of-life instruments (e.g., the EQ-5D questionnaires
2
) and combined with national tariff systems to express the patients’ health states in terms of utility scores. For the United Kingdom, utilities are usually measured on a scale from

where
When the primary endpoint of the trial is survival, such as in cancer trials, in which patients may be either dead or still alive at the end of the study, it is possible to combine the information from both utility and survival for each patient into a single measure. More specifically, the patient-level survival at time

where
Partitioned Survival Cost-Utility Analysis
When survival time changes rapidly after the progression of the disease, inferences about mean utilities should take into account the differences between pre- and postprogression responses as well as their dependence relationships. This is the rationale behind partitioned survival analysis, which involves the partitioning of survival data for the time-to-event endpoint, typically overall survival (OS), into 2 components: progression-free survival (PFS) and postprogression survival (PPS), with

where
We note that the calculation of QAS in Equation 2 and Equation 3 assumes the absence of censoring. In practice, however, some of the patients may be still alive at the end of the trial (censored). When this occurs, unfortunately, the calculation of QAS data based on utility scores may alter survival times and result in informative censoring, which can distort the inferences. 5 For the rest of the article, we will assume that no informative censoring occurs (in our case study, >99% of patients had died during the follow-up) so that standard partitioned survival cost-utility analysis methods can be assumed to be valid. In the “Discussion” section, we will discuss the potential implications and possible methods to perform the economic assessment in the presence of censored data.
Statistical modeling for trial-based cost-utility data has received much attention in both the health economics and the statistical literature in recent years,9,10 increasingly often under a Bayesian approach.11–13 From the statistical point of view, this is a challenging problem because of the generally complex relationships linking the measure of effectiveness (e.g., QALYs) and the associated costs. First, the presence of a bivariate outcome requires the use of appropriate methods to account for the correlation between the variables.14–16 Second, both utility and cost data are characterized by empirical distributions that are highly skewed, and simplifying assumptions, such as (bivariate) normality of the underlying distributions, are usually not granted. The adoption of parametric distributions that can account for skewness (e.g., beta for the utilities and gamma or log-normal for the costs) has been suggested to improve the fit of the models.17–19 Third, data may exhibit spikes at 1 or both of the boundaries of the range for the underlying distributions, for example, zero costs and perfect health (i.e., utility of 1), which are difficult to capture with standard parametric models.19,20 The use of more flexible formulations, known as hurdle models, has been recommended to explicitly account for these “structural” values.21–23 Hurdle models consist of a mixture of a point mass distribution (the spike) and a parametric model fitted to the natural range of the relevant variable without the boundary values. Finally, individual-level data from clinical trials are almost invariably affected by the problem of missing data. Analyses that are limited to individuals with fully observed data (complete case analysis) are inefficient and yield biased results when the completers are not a random sample of all individuals in the trial. Alternative and more efficient approaches, such as multiple imputation and likelihood-based methods, rely on the less restrictive assumption that missingness can be fully explained based on the observed data, an assumption known as missing at random (MAR).24,25 However, MAR can never be tested from the data at hand, and when missingness depends on some unobserved data, an assumption known as missing not at random (MNAR), analyses based on the observed data alone will yield biased results. Content-specific knowledge and tailored modeling approaches can be used to make inferences under MNAR, and within a Bayesian approach, informative prior distributions represent a powerful tool for conducting sensitivity analysis to different missingness assumptions. 26
Outline
In this article, we extend the current methods for modeling trial-based partitioned survival cost-utility data, taking advantage of the flexibility of the Bayesian approach, and specify a joint probabilistic model for the health economic outcomes. We propose a general framework that is able to account for the multiple types of complexities affecting individual-level data (correlation, missingness, skewness, and structural values) while also explicitly modeling the dependence relationships between different types of quality of life and cost components. The article is structured as follows: first, in the next section, we present our modeling framework. In the “Example: The TOPICAL Trial” section, we present our motivating example, and in the “Application to the TOPICAL Study” section, we specify the model to handle the characteristics of the data from the case study. In the “Results” section, we summarize the statistical and health economic results of the analysis. Finally, in the “Discussion” section, we conclude with a discussion.
Methods
Consider a clinical trial in which patient-level information on a set of suitably defined effectiveness and cost variables is collected at
The effectiveness outcomes are represented by preprogression (
The objective of the economic evaluation is to perform a patient-level partitioned survival cost-utility analysis by specifying a joint model

where
Marginal Model for the Effectiveness
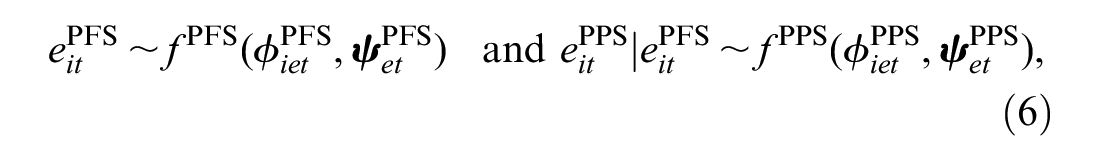
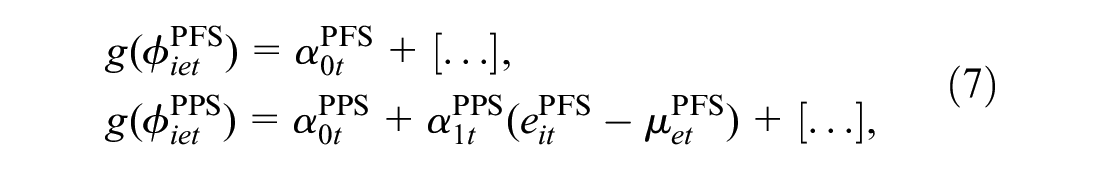
For each individual and treatment, we specify a marginal distribution of the effectiveness variables

where
where
where
Conditional Model for the Costs Given the Effectiveness
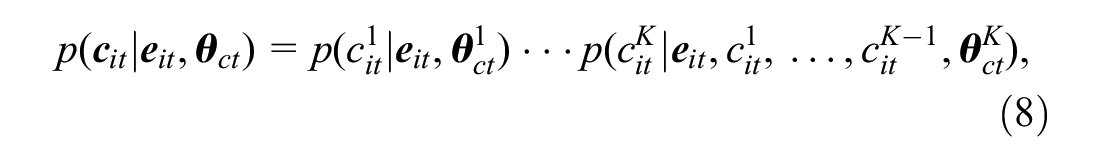
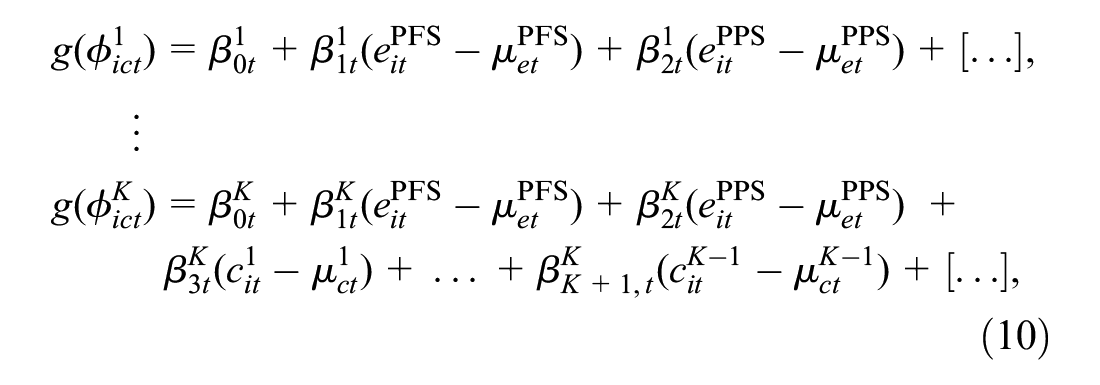
We factor the distribution of
where

where
where
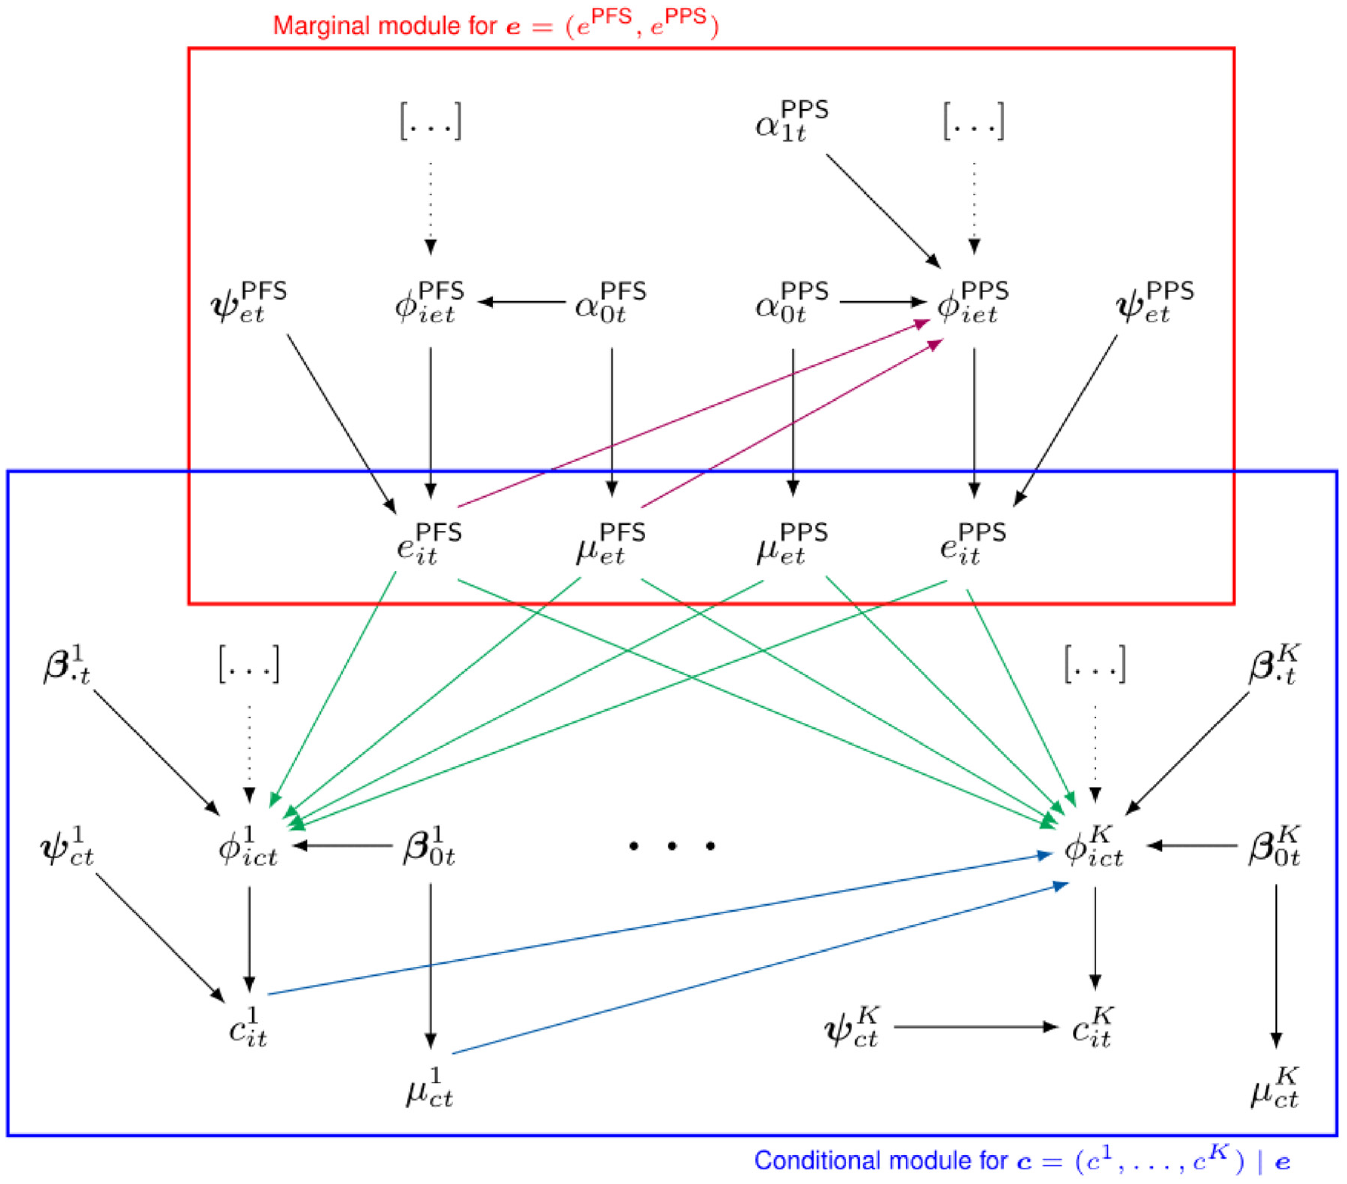
Figure 1 provides a visual representation of the proposed modeling framework. The effectiveness and cost distributions are represented in terms of combined “modules” (red and blue boxes), in which the random quantities are linked through logical relationships. Notably, this is general enough to be extended to any suitable distributional assumption as well as to handle covariates in each module. In the following section, we present our motivating example and describe the modeling specification in our analysis.
Joint distribution
Example: The TOPICAL Trial
The TOPICAL study was a double-blind, randomized, placebo-controlled, phase III trial conducted in the United Kingdom. Participants were elderly patients with non–small-cell lung cancer receiving best supportive care and considered unfit for chemotherapy because of poor performance status and/or multiple medical comorbidities.
28
Subjects were randomly assigned to receive a control (oral placebo, t = 1) or erlotinib (
The primary endpoint of the trial was OS; secondary endpoints were PFS (defined as the time between randomization and progression or death) and health-related quality of life measured by the EQ-5D-3L questionnaire, which was collected at monthly intervals up to and beyond progression for each patient. Because all patients progressed/died during the follow-up of the study, no extrapolation of OS and PFS was required. For each individual, PFS and PPS QAS data were obtained by combining his or her available EQ-5D utilities with the corresponding survival times during the follow-up using the formula shown in Equation 2. This implies that QAS may take both negative and positive values according to the utilities and survival observed during the pre- (
The costs are calculated on 3 different components: 1) drug (erlotinib), radiotherapy, and additional anticancer treatments, denoted with
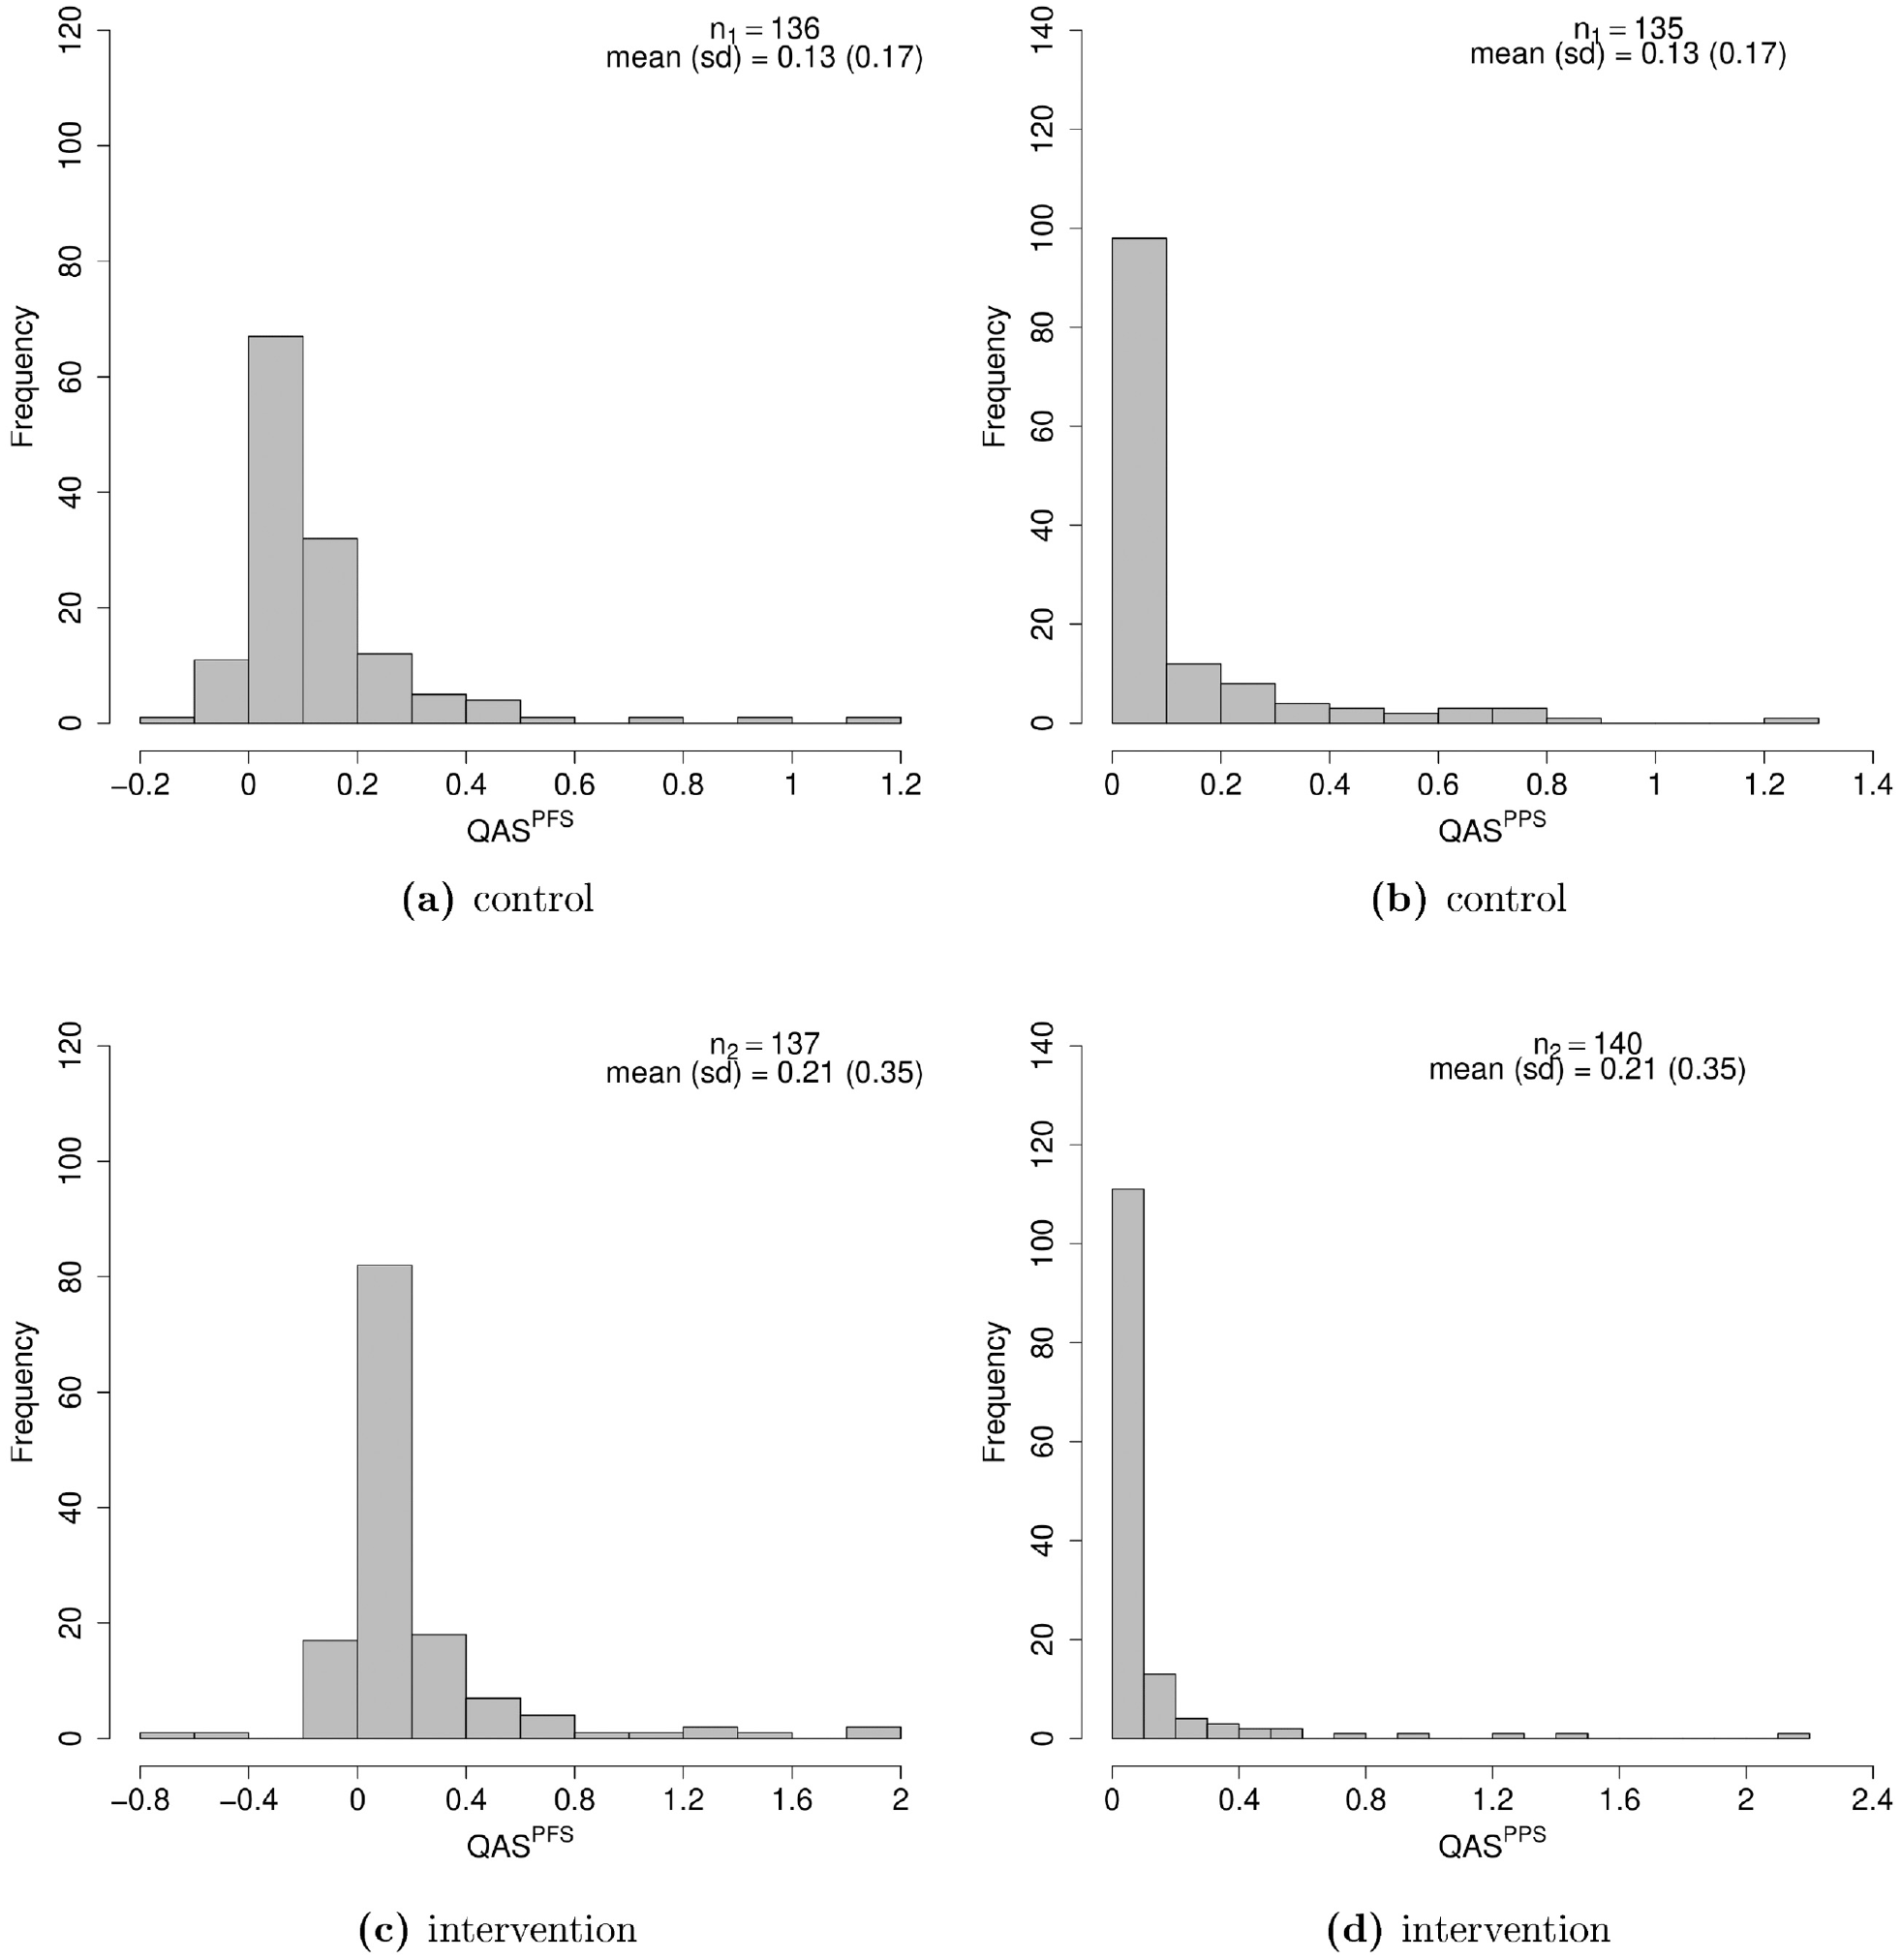
Histograms of the distributions of the pre- and postprogression quality-adjusted survival (QAS) data, in the control (a, b) and intervention (c, d) group. About 50% of the individuals in both groups are associated with zero postprogression survival QAS (highest bars in panels b and d), while no actual zero is observed for progression-free survival QAS, which mainly lies between
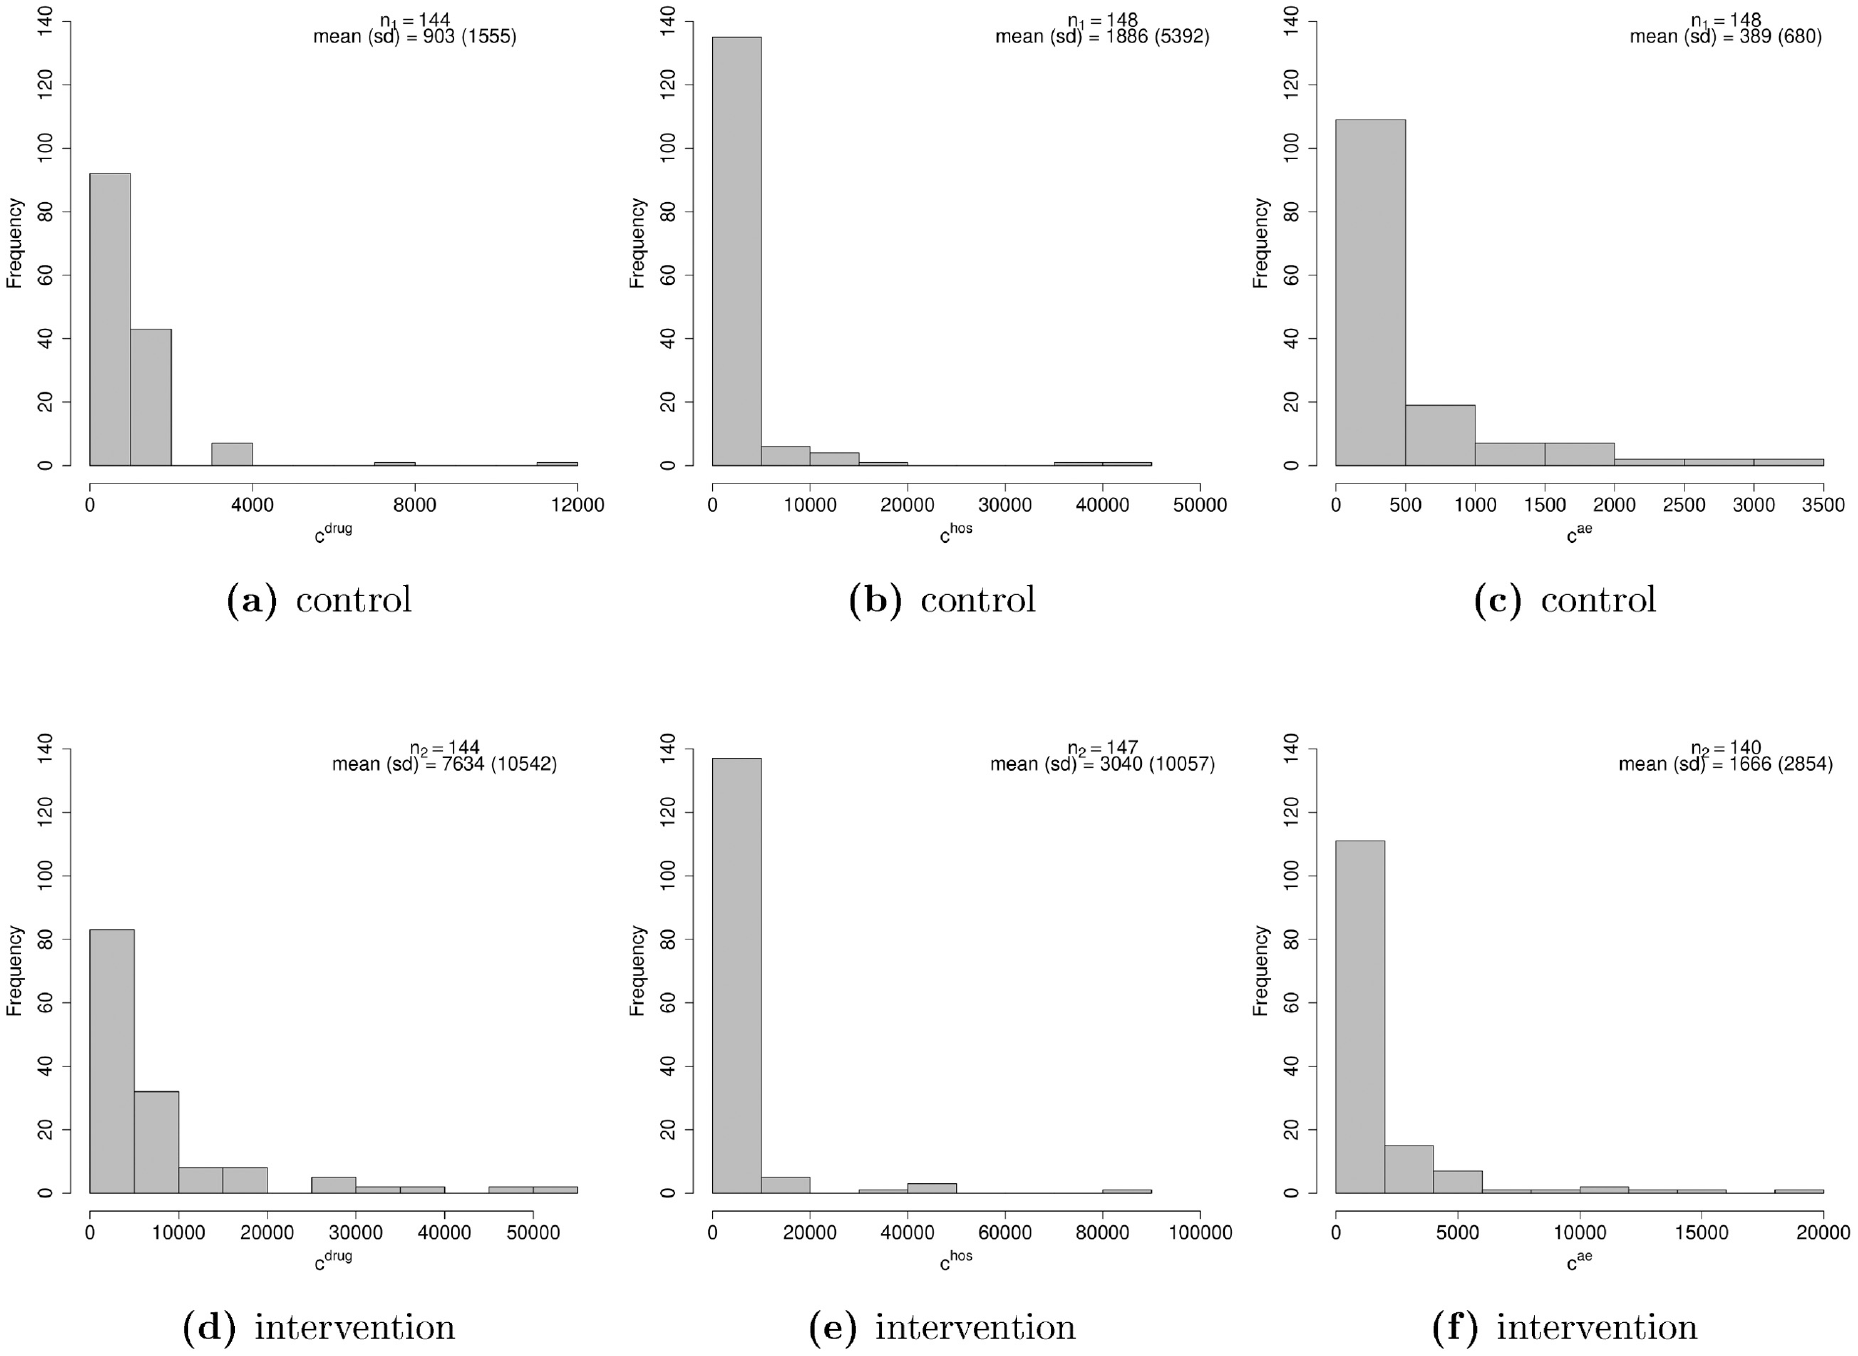
Histograms of the distributions of the 3 cost components (drug, hospital, and adverse events) in the control (a–c) and intervention (d–f) groups (all costs are expressed in pounds).
The total number of individuals with fully observed data for all variables (completers) was 249 (83%), whereas among those with partially observed data (51; 27%), most were associated with unobserved values for either
Application to the TOPICAL Study
Model Specification
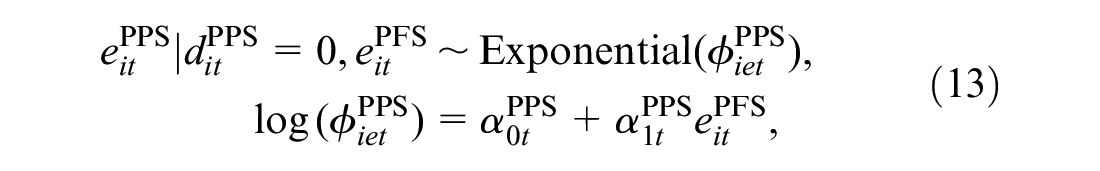
Throughout, we refer to our motivating example to demonstrate the flexibility of the proposed approach for dealing with the complexities of cost-utility data. The selection of the parametric distributions to model each variable is based on relative and absolute measures of fit, including predictive information criteria and predictive checks, which are explained and reported in detail in the “Model Assessment” section. We start by modeling

where
When choosing the model for

where
where
Next, we specify the conditional distributions of the cost variables
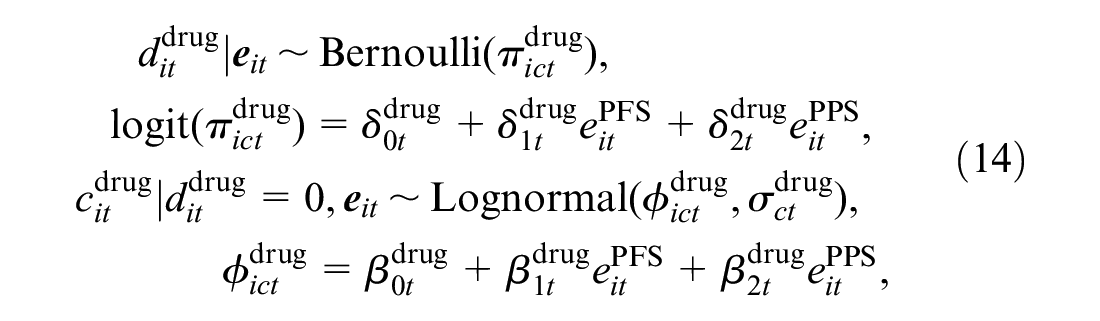
where
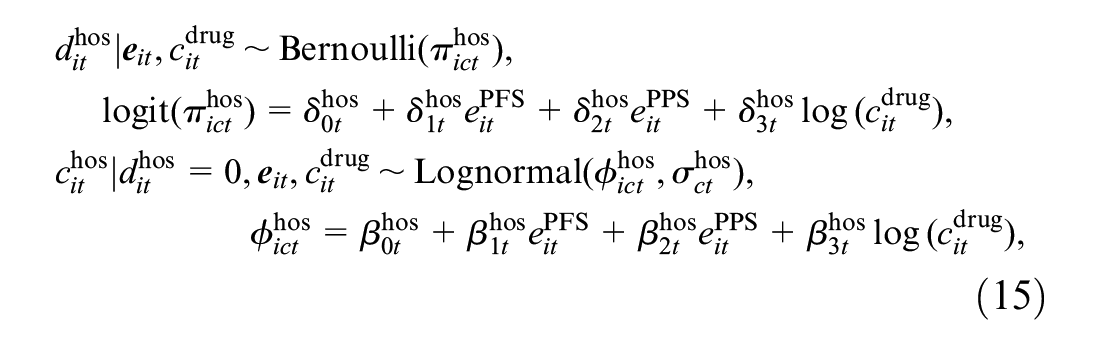
where
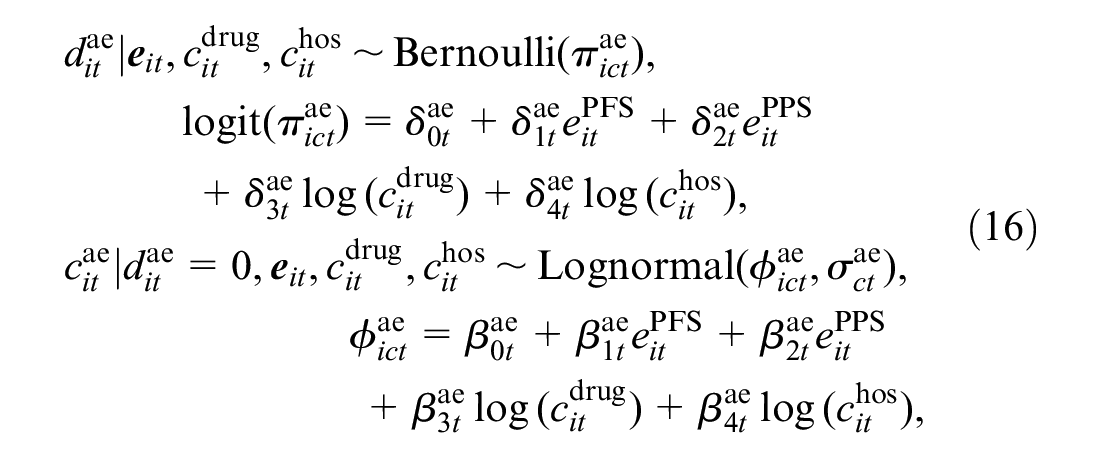
where
We note that, in all hurdle model specifications, predictor-specific parameters of logistic and log-linear regressions can be interpreted, respectively, as the change in the log odds for having a zero and in the log-mean for nonzero values, due to a unit variation in the corresponding predictor. In addition, when all predictors are centred, the intercept parameters can be interpreted as the log odds of having a zero value and the marginal mean of nonzero values on the log scale. For all parameters in the model, we specify vague prior distributions: a normal distribution with a large variance on the appropriate scale for the regression parameters (e.g.,
Estimation of the Marginal Means
When standard parametric distributions are used, the marginal mean effectiveness and cost parameters for each type of modeled variable could be retrieved by simply centering each variable in the effectiveness and cost modules. However, the use of nonnormal distributions and hurdle models makes it difficult to identify the marginal means in terms of the model parameters. To overcome this problem, we used an alternative approach based on numerical algorithms, known as Markov Chain Monte Carlo (MCMC) methods,
30
to approximate the posterior distributions of the marginal mean parameters. MCMC methods allow sampling from the desired posterior distributions of some parameters of interest via iterative and simulation-based algorithms. Specifically, we fitted the model using a particular type of MCMC algorithm known as Hamiltonian Monte Carlo, and we refer to the online supplementary material for a description of the method and its implementation in our analysis. Once the model is fitted, we save the posterior distributions of all model parameters

This approach is known as Monte Carlo integration and allows the approximation of the posterior distributions of the marginal means of the modeled variables by taking the average over a large number of randomly drawn samples from their target distribution. Finally, we derive the overall marginal means

where
Computation
We fitted the model in STAN, 31 which is a software specifically designed for the analysis of Bayesian models using Hamiltonian Monte Carlo algorithms and which is interfaced with R through the package rstan. 32 Samples from the posterior distribution of the parameters of interest generated by STAN and saved to the R workspace are then used to produce summary statistics and plots. We ran 2 chains with 15,000 iterations per chain, using a burn-in of 3000, for a total sample of 24,000 iterations for posterior inference. For each unknown quantity in the model, we assessed convergence and autocorrelation of the MCMC simulations using diagnostic measures such as density and trace plots, the potential scale reduction factor, and the effective sample size. 33 A summary of the results from these convergence checks for the parameters of the model and the STAN code used to fit the model are provided in the supplementary material.
Model Assessment
We compute 2 relative measures of predictive accuracy to assess the fit of the proposed model specification (denoted as “original”) with respect to a second parametric specification (denoted as “alternative”), in which we replace the Gumbel distribution for
Results between the 2 alternative specifications are reported in Table 1. For both criteria, the values associated with the “original” specification of the model are systematically lower compared with those from the “alternative” parameterization and result in an overall better fit to the data for the first model. We have also explored alternative model specifications based on different distributions for the effectiveness and cost variables. For
WAIC, LOOIC, and Effective Number of Parameter (
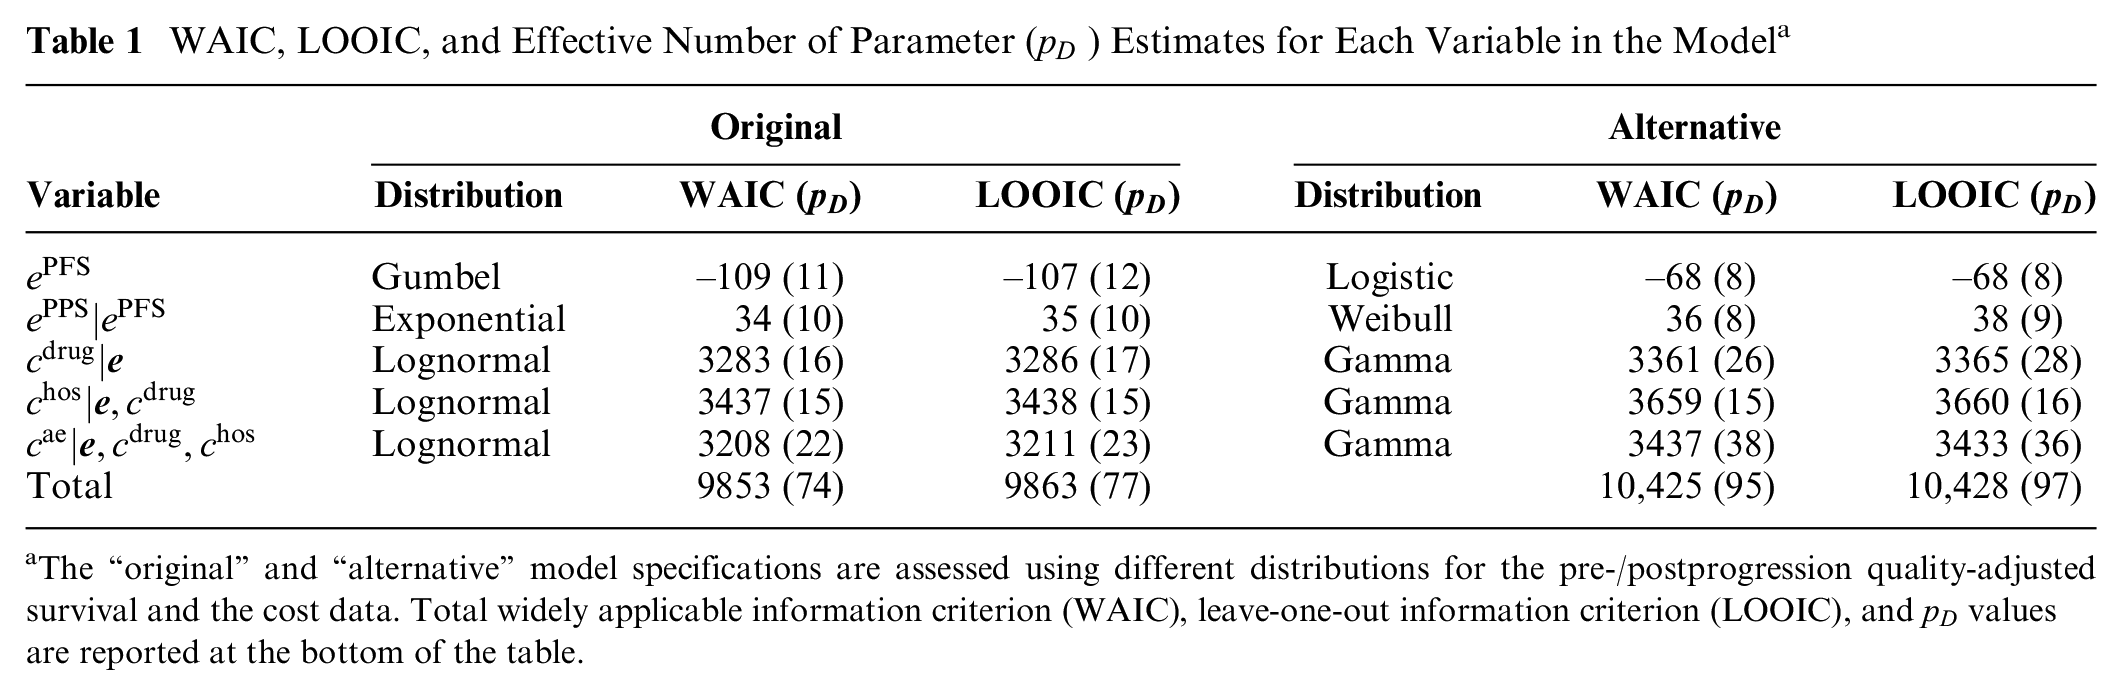
The “original” and “alternative” model specifications are assessed using different distributions for the pre-/postprogression quality-adjusted survival and the cost data. Total widely applicable information criterion (WAIC), leave-one-out information criterion (LOOIC), and
We additionally assess the absolute fit of the model using the observed and replicated data, the latter being generated from the posterior predictive distribution using the posterior samples of the parameters in each effectiveness and cost module. We use the posterior estimates of the parameters to sample 10,000 replications of the data, which are then used for model assessment. We computed different types of graphical posterior predictive checks, either in terms of the entire distributions via density and cumulative density plots or in terms of the marginal mean estimates between the real and replicated data (provided in the supplementary material). Overall, these checks suggest a relatively good fit of the model for each modelled variable.
Results
This section presents the results of the analysis from a 2-fold perspective. First, the posterior distribution of the marginal means of each component of the effectiveness (
Posterior Estimates
Figure 4 compares the posterior means (squares) and the
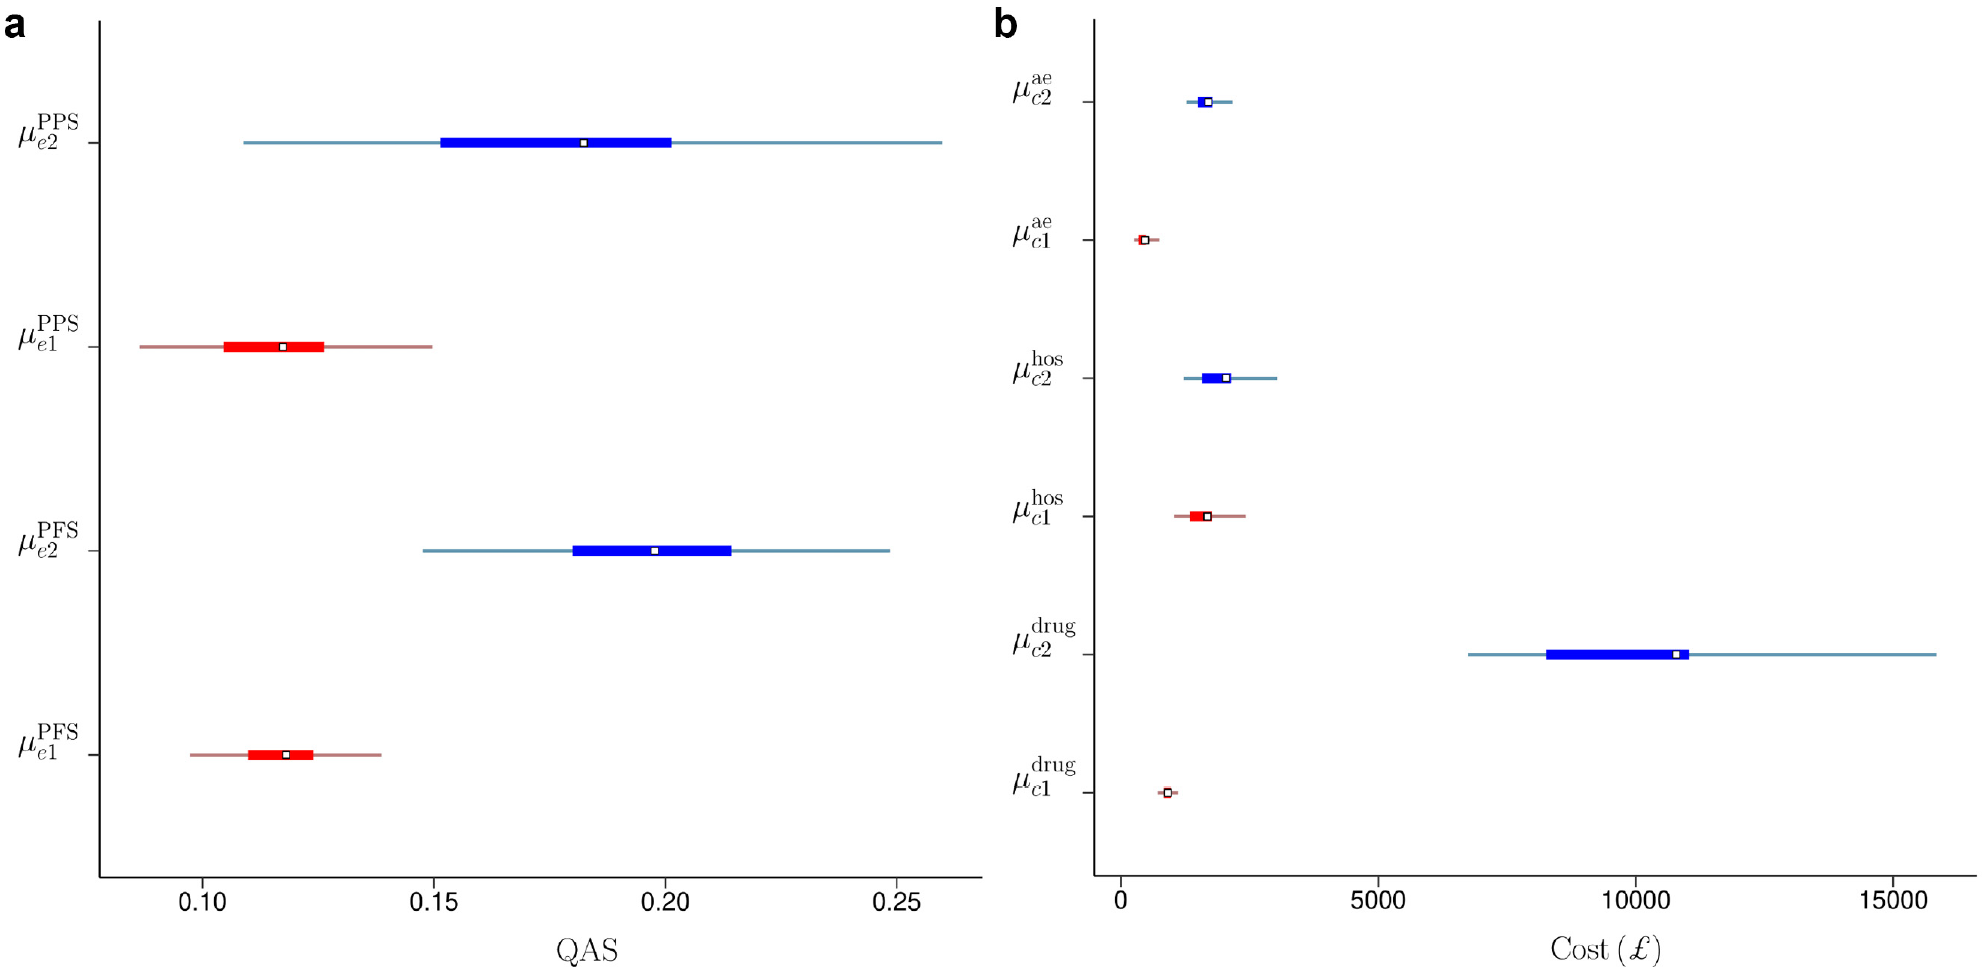
Posterior means (squares), 50% (thick lines) and 95% (thin lines) highest posterior density credible intervals for the marginal means of pre- and postprogression quality-adjusted survival (a) and for the marginal means of the drug, hospital, and adverse events cost (b) in the control (red) and the intervention (blue) group in the TOPICAL trial.
We derived the aggregated mean QAS and costs for each treatment group
Posterior Means, Medians, Standard Deviations, and
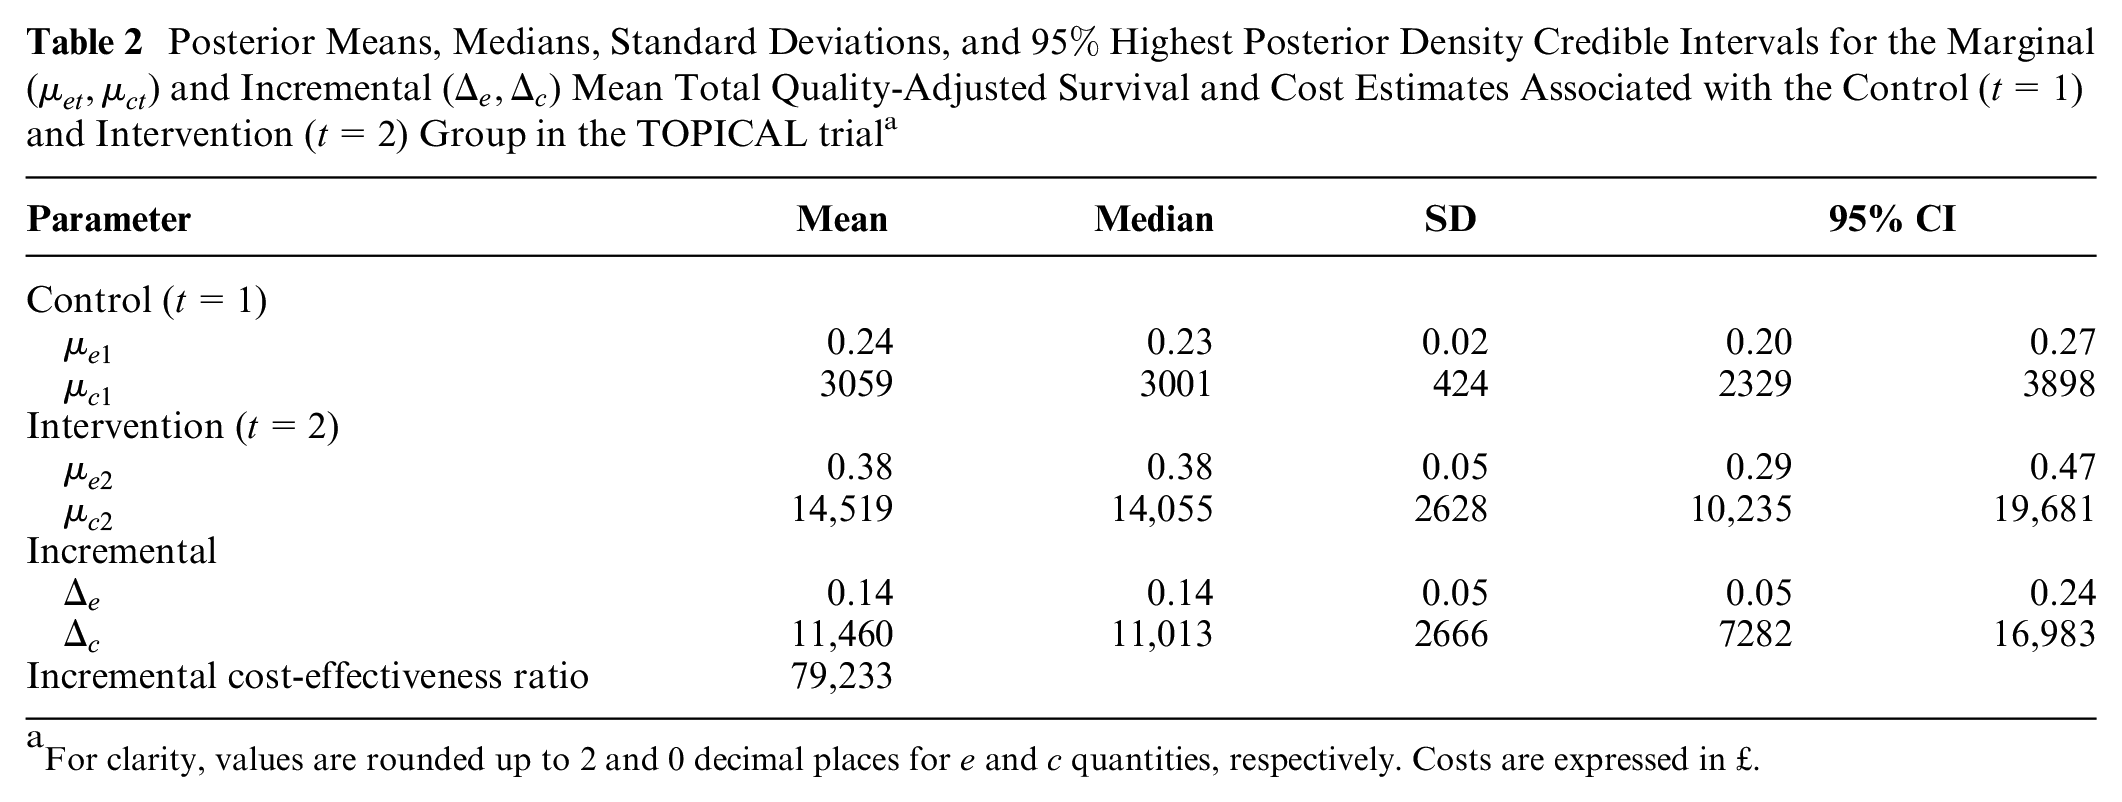
For clarity, values are rounded up to 2 and 0 decimal places for
Economic Evaluation
We complete the analysis by assessing the probability of cost-effectiveness for the new intervention with respect to the control. An advantage of using a Bayesian approach is that the economic analysis can be easily performed without the need to use ad hoc methods to represent uncertainty around point estimates (e.g., bootstrapping). Indeed, once the statistical model is fitted to the data, the samples from the posterior distributions of the parameters of interest can be used to compute different types of summary measures of cost-effectiveness.
We specifically rely on the examination of the cost-effectiveness plane (CEP)
38
and the cost-effectiveness acceptability curve (CEAC)
39
to summarize the economic analysis. Results in terms of the expected incremental benefit are also provided in the online supplementary material. Figure 5a shows the CEP, which is a graphical representation of the joint distribution of the mean effectiveness and cost increments between the 2 groups. The slope of the straight line crossing the plane is the willingness-to-pay threshold (often indicated with
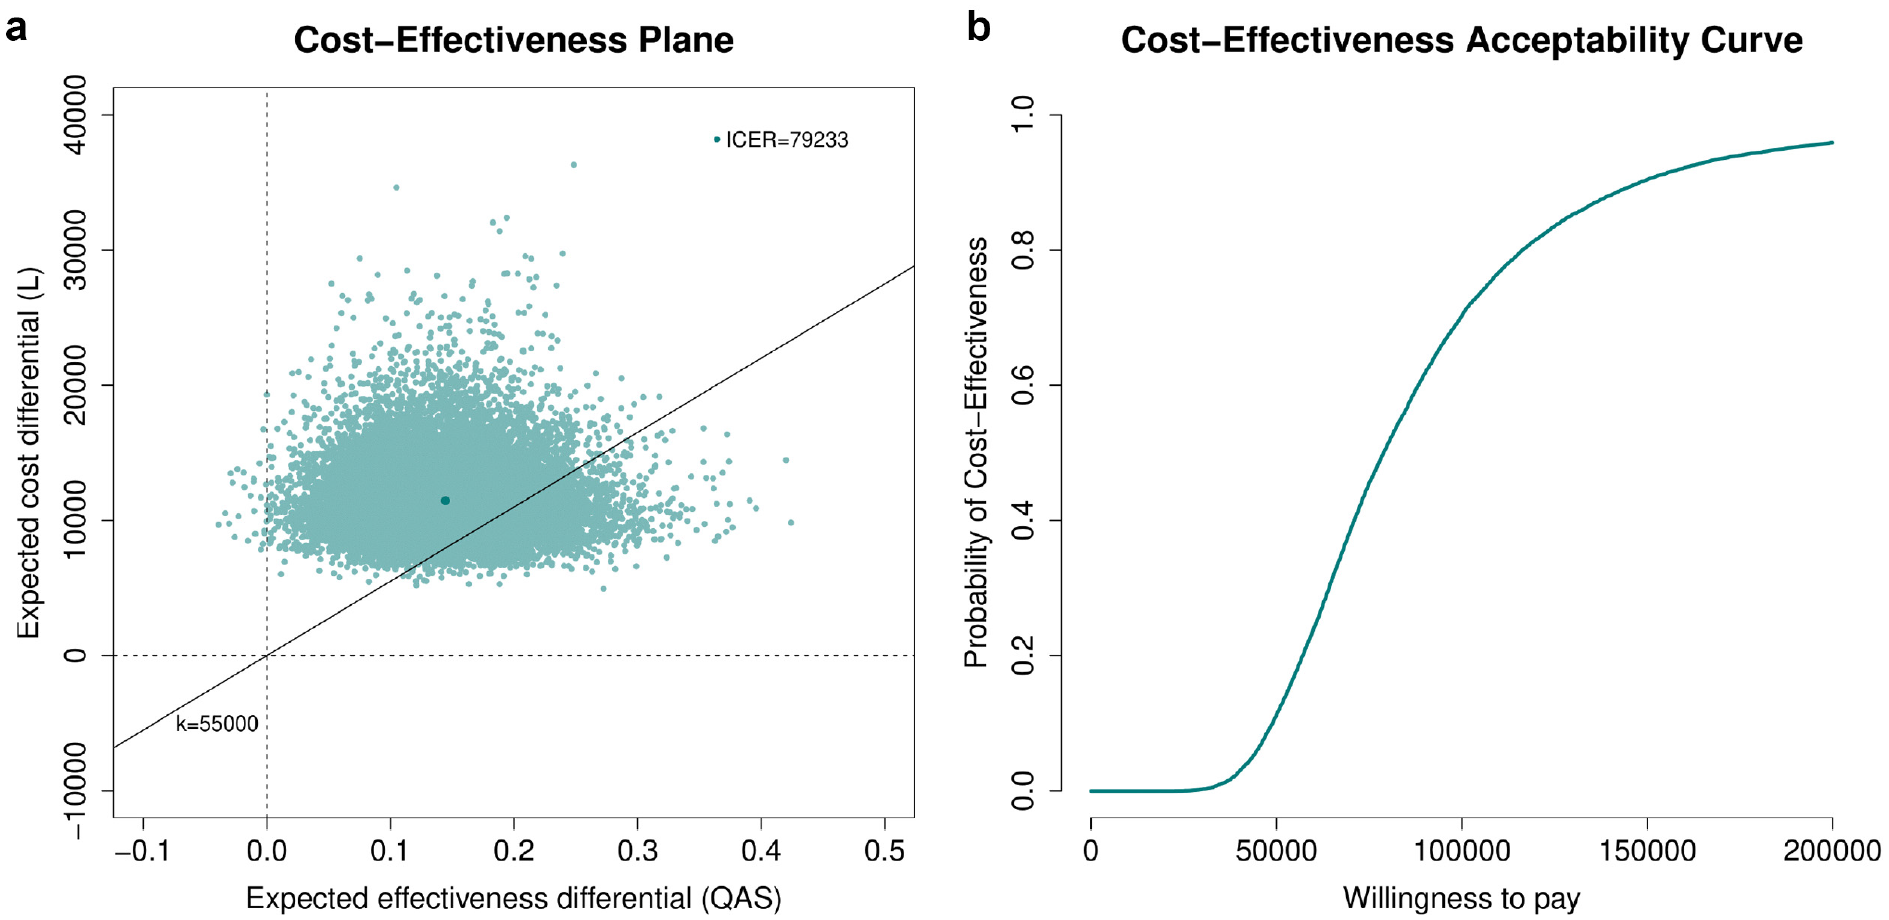
(a) Cost-effectiveness plane and (b) cost-effectiveness acceptability curve (CEAC) graphs associated with the 2 interventions in the TOPICAL trial. In the CEP, the value of the incremental cost-effectiveness ratio is reported (darker green dot), while the portion of the plane on the right-hand side of the straight line passing through the origin (evaluated at k = £55,000) denotes the sustainability area; in the CEAC, the probability of cost-effectiveness is shown for willingness-to-pay threshold values up to £200,000.
Discussion
In this article, we proposed a general framework for partitioned survival cost-utility analysis using patient-level data (e.g., from a trial), which takes into account the correlation between costs and effectiveness, skewness in the distribution of the observed data, the presence of structural zeros, and missing data. Although alternative approaches have been proposed in the literature to handle the statistical issues affecting cost-effectiveness data, they had either considered some of these issues separately19,21,27 or did not specifically focus on partitioned survival analyses.22,23 The approach developed in the “Methods” section uses a flexible structure that allows for handling the typical idiosyncrasies affecting effectiveness and costs within a joint probabilistic framework. This is a key advantage of the Bayesian approach compared with other approaches, especially in health economic evaluations in which the main objective is not statistical inference per se but rather assessing the uncertainty in decision making induced by the uncertainty in the model inputs.41,42
The economic results from our case study should be interpreted with caution, and some potential limitations in terms of the generalizability of the proposed framework should be highlighted. First, our analysis of TOPICAL is based on a subset of the individuals in the original trial (made available to us), and therefore, it is difficult to draw any cost-effectiveness conclusions about the trial from this analysis. Second, although the results are obtained under a MAR assumption, which is typically considered more plausible than just focusing on the complete cases, missingness assumptions can never be checked from the data at hand. It is possible that the assumption of MAR is not tenable, which may therefore introduce some bias. It is recommended that departures from MAR are explored in sensitivity analysis to assess the robustness of the conclusions to some plausible MNAR scenarios. 26 However, given the limitations of our analysis in terms of the interpretation of the trial results and the lack of any external information to guide the choice of the MNAR departures, we decided not to pursue these analyses here. We note that different approaches are available to conduct sensitivity analysis to MNAR, some of which can be implemented within a Bayesian framework, for example, through the elicitation of expert opinions using prior distributions.26,43
Finally, although in our analysis no censoring of survival time was observed, in many studies, a considerable proportion of patients may be censored when they do not progress/die during the follow-up. When this occurs, the calculation of patient-level QAS data is typically invalid as it may introduce informative censoring, which distorts the inferences. 5 A possible strategy to deal with censored survival data is to specify 2 different models to separately estimate the marginal mean utilities and the proportion of patients still alive at each follow-up point and then combine these estimates to obtain results on a QAS scale. For example, linear mixed models can be used for estimating the mean utilities, while Kaplan-Meier or other parametric survival functions can be used to estimate the survival probabilities at each time point. 6 In future work, we hope to extend the proposed framework to handle censored survival data and assess the robustness of the results to alternative assumptions, including informative censoring (e.g., using expert opinion).
In conclusion, although our approach may not be applicable to all cases, the data analyzed are very much representative of the typical data used in partitioned survival cost-utility analysis alongside clinical trials. Thus, it is highly likely that the same features apply to other real cases. This is a very important if somewhat overlooked problem, as methods that do not take into account the complexities affecting patient-level data, while being easier to implement and well established among practitioners, may ultimately mislead cost-effectiveness conclusions and bias the decision-making process.
Supplemental Material
sj-pdf-1-mdm-10.1177_0272989X211012348 – Supplemental material for A Bayesian Framework for Patient-Level Partitioned Survival Cost-Utility Analysis
Supplemental material, sj-pdf-1-mdm-10.1177_0272989X211012348 for A Bayesian Framework for Patient-Level Partitioned Survival Cost-Utility Analysis by Andrea Gabrio in Medical Decision Making
Supplemental Material
sj-pdf-2-mdm-10.1177_0272989X211012348 – Supplemental material for A Bayesian Framework for Patient-Level Partitioned Survival Cost-Utility Analysis
Supplemental material, sj-pdf-2-mdm-10.1177_0272989X211012348 for A Bayesian Framework for Patient-Level Partitioned Survival Cost-Utility Analysis by Andrea Gabrio in Medical Decision Making
Supplemental Material
sj-pdf-3-mdm-10.1177_0272989X211012348 – Supplemental material for A Bayesian Framework for Patient-Level Partitioned Survival Cost-Utility Analysis
Supplemental material, sj-pdf-3-mdm-10.1177_0272989X211012348 for A Bayesian Framework for Patient-Level Partitioned Survival Cost-Utility Analysis by Andrea Gabrio in Medical Decision Making
Supplemental Material
sj-pdf-4-mdm-10.1177_0272989X211012348 – Supplemental material for A Bayesian Framework for Patient-Level Partitioned Survival Cost-Utility Analysis
Supplemental material, sj-pdf-4-mdm-10.1177_0272989X211012348 for A Bayesian Framework for Patient-Level Partitioned Survival Cost-Utility Analysis by Andrea Gabrio in Medical Decision Making
Footnotes
Acknowledgements
We wish to thank the UCL CRUK Cancer Trials Centre for providing a subset of data from the TOPICAL trial. Dr. Andrea Gabrio was affiliated with the Department of Statistical Science, University College London (UK), at the time of the trial and is currently affiliated with the Department of Methodology and Statistics, Faculty of Health Medicine and Social Sciences, Maastricht (NL).
The author declared no potential conflicts of interest with respect to the research, authorship, and/or publication of this article.
The author received no financial support for the research, authorship, and/or publication of this article.
References
Supplementary Material
Please find the following supplemental material available below.
For Open Access articles published under a Creative Commons License, all supplemental material carries the same license as the article it is associated with.
For non-Open Access articles published, all supplemental material carries a non-exclusive license, and permission requests for re-use of supplemental material or any part of supplemental material shall be sent directly to the copyright owner as specified in the copyright notice associated with the article.