
Abstract
Background
Changing colorectal cancer (CRC) incidence rates, including recent increases for people younger than 50 y, need to be considered in planning for future cancer control and screening initiatives. Reliable estimates of the impact of changing CRC trends on the National Bowel Cancer Screening Program (NBCSP) are essential for programmatic planning in Australia. An existing microsimulation model of CRC, Policy1-Bowel, was updated to reproduce Australian CRC trends data and provide updated projections of CRC- and screening-related outcomes to inform clinical practice guidelines for the prevention of CRC.
Methods
Policy1-Bowel was recalibrated to reproduce statistical age-period-cohort model trends and projections of CRC incidence for 1995–2045 in the absence of the NBCSP as well as published data on CRC incidence trends, stage distribution, and survival in 1995–2020 in Australia. The recalibrated Policy1-Bowel predictions were validated by comparison with published Australian CRC mortality trends for 1995–2015 and statistical projections to 2040. Metamodels were developed to aid the calibration process and significantly reduce the computational burden.
Results
Policy1-Bowel was recalibrated, and best-fit parameter sets were identified for lesion incidence, CRC stage progression rates, detection rates, and survival rates by age, sex, bowel location, cancer stage, and birth year. The recalibrated model was validated and successfully reproduced observed CRC mortality rates for 1995–2015 and statistical projections for 2016–2030.
Conclusion
The recalibrated Policy1-Bowel model captures significant additional detail on the future incidence and mortality burden of CRC in Australia. This is particularly relevant as younger cohorts with higher CRC incidence rates approach screening ages to inform decision making for these groups. The metamodeling approach allows fast recalibration and makes regular updates to incorporate new evidence feasible.
Highlights
In Australia, colorectal cancer incidence rates are increasing for people younger than 50 y but decreasing for people older than 50 y, and colorectal cancer survival is improving as new treatment technologies emerge.
To evaluate the future health and economic impact of screening and inform policy, modeling must include detailed trends and projections of colorectal cancer incidence, mortality, and diagnosis stage.
We used novel techniques including integrative age-period cohort projections and metamodel calibration to update Policy1-Bowel, a detailed microsimulation of colorectal cancer and screening in Australia.
Keywords
Background
Colorectal cancer (CRC), including colon cancer (CC) and rectal cancer (RC), was the fourth most commonly diagnosed cancer and the second most common cause of cancer death in Australia in 2023. 1 In line with international evidence, recent analyses showed that the overall CRC incidence in Australia has decreased in the past 2 decades, with trends differing between people aged <50 y versus those aged 50+ y.2–7 The incidence of CC and RC in people aged 50+ y has been decreasing at different rates, which is likely attributable to CRC screening.
CRC screening has been available in Australia through opportunistic screening using colonoscopy, sigmoidoscopy, fecal test, and/or biomarker testing since the 1990s, and organized screening through the National Bowel Cancer Screening Program (NBCSP) has been provided since 2006.2–5 Since 2020 after a gradual rollout over 2006 to 2019, the NBCSP, a population-based organized screening program, has provided free immunochemical fecal occult blood test (iFOBT) screening for people aged 50 to 74 y in Australia. 8 However CRC rates in people younger than 50 y have been increasing in Australia.2–5 This increase in early-onset CRC, also observed in other high-income countries, is associated with the changing prevalence of modifiable risk factors such as obesity, red and processed meat consumption, and alcohol consumption.2–5,9 Any modifications to screening recommendations must consider and reflect these trends in cancer incidence, including their impact on the future prevalence of both cancer and precancerous lesions.
Policy1-Bowel is a comprehensive, well-calibrated, and validated microsimulation model designed to simulate the natural history of CRC and precancerous lesions in individuals in the Australian population as well as the impact of the NBCSP.10,11Policy1-Bowel has been used to inform policy decisions and clinical practice since 2017, by evaluating various CRC screening strategies and providing predictions of the long-term impact of the NBCSP on CRC incidence and mortality and health expenditure in Australia.10–23 Previously, Policy1-Bowel assumed that the underlying risk of CRC and precancerous lesions varied with age, but not by year, and did not incorporate data on trends in CRC incidence rates, as data sources to inform this were not available. 10 Local data on trends in CRC incidence, stage distribution, survival, and mortality have since been made available.5,7,24–26
To inform the National Health and Medical Research Council (NHMRC)-endorsed Clinical Practice Guidelines for the Prevention, Early Detection and Management of Colorectal Cancer, Policy1-Bowel was updated to integrate new evidence and enhance its capabilities and accuracy. To recalibrate Policy1-Bowel using the expanded target data without increasing computational burden, we developed supplementary metamodels (simplified proxy models of a more complex model, 27 sometimes referred to as emulators 28 ) of parts of the model simulation. Metamodeling approaches are used to simplify computationally demanding simulation tasks and reduce computational runtime.29,30
This study aimed to describe the method and outcomes of the recalibration and validation of Policy1-Bowel, including the development of the recalibration metamodels, and demonstrate Policy1-Bowel’s ability to reproduce the latest Australian data on trends and projections of CRC-related outcomes for 1995–2045.
Methods
Overview of the Policy1-Bowel Platform
Details of Policy1-Bowel have been reported elsewhere, including the model design, previous calibrated parameters, and model validation.10–18 Briefly, Policy1-Bowel is a C++ microsimulation model that simulates CRC natural history, survival, and screening. A total of 20 million men and women are simulated per birth cohort. Each individual is simulated from age 20 y on an annual time step, until the individual dies from CRC or other causes or becomes 99 y old, whichever occurs first. Age-, sex-, and year-specific other-cause mortality rates were derived from Australian rates (see Appendix Section 1.2). Full details of the model have been published previously 10 ; we include a brief overview here.
Policy1-Bowel assumes 85% of CRCs develop from conventional adenomas and 15% develop from sessile serrated lesions. The model also simulates hyperplastic polyps but assumes these lesions do not progress to cancer. The location (colon or rectum) and size (<6 mm, 6–10 mm, >10 mm) of all lesions were modeled as well as the degree of dysplasia (low/high grade) and the architecture (tubular, tubulovillous, or villous) of conventional adenomas. Individuals with advanced adenoma(s) (i.e., >10 mm, with high-grade dysplasia, or with tubulovillous/villous histology 10 ) and/or serrated lesion(s) have a risk of developing preclinical cancer (i.e., cancers that have not yet been diagnosed). Over time, preclinical cancer can progress to a more advanced stage or become diagnosed, either after an NBCSP screening test or subsequent surveillance (henceforth referred to as an NBCSP-detected cancer) or outside of the program due to patient follow-up of symptoms, opportunistic (non-NBCSP) screening, or an incidental finding (non-NBCSP-detected cancer). The probability of a preclinical cancer being detected outside of the NBCSP varies by location and stage. Risk of subsequent CRC death varies by location (colon or rectum), cancer stage at diagnosis, time since cancer diagnosis, calendar year, age, and sex. Simulated patients who survive 5 y after a cancer diagnosis have no additional risk of dying from CRC compared with the general population without CRC. Based on international studies, patients with NBCSP-detected CRC were modeled with higher 5-y survival than patients whose CRC cancer was symptomatically detected at the same stage.31–33 Details of this are included in the appendix of Lew et al. 10
The natural history parameters in Policy1-Bowel relating to the initiation, growth, and progression/regression of precancerous lesions were previously calibrated to health state data observed in the COCOS trial, a Dutch trial of CRC screening with colonoscopy and computed tomography colonography conducted in screening-naïve individuals. 34 These model calibration results have been reported previously. 10 In addition, the model has been validated against long-term CRC incidence and mortality outcomes from randomized controlled trials and predictions from other CRC models. 11
Policy1-Bowel simulates the phased implementation of the NBCSP in 2006–2018 (see Appendix Table A1) and from 2019, 2-yearly screening for ages 50 to 74 y. The model assumed an overall ∼40% participation rate for people who were invited to participate in screening based on the reported NBCSP participation in 2006–2020 35 and includes different participation rates by sex, age, and screening history. People who received a positive iFOBT result progress to further follow-up with colonoscopy examination, with modeled follow-up colonoscopy compliance varying by age and sex from 62% to 78% based on data observed in 2006–2020. 35 Modeled test accuracy of iFOBT was obtained via calibration to iFOBT positivity rates and colonoscopy outcomes for those with positive iFOBT results as observed in the NBCSP.36–38 Colonoscopy surveillance prior to 2018 was modeled based on the 2013 colonoscopy surveillance guidelines, and colonoscopy surveillance from 2018 was based on the 2018 national guideline recommendations.39,40 Surveillance was assumed to stop at age 75 in line with these guidelines. See Lew et al. 10 and Appendix Section 1 for more details on Policy1-Bowel.
Policy1-Bowel Recalibration
In this study, Policy1-Bowel was recalibrated to 9 calibration target data sets (Table 1) in 3 successive stages. Counterfactual benchmark CRC incidence projections in the absence of screening were generated using a novel statistical age-period-cohort (APC) modeling approach; these projections were based on the historical CRC incidence rates observed in Australia but deliberately excluded any impact of the NBCSP. CRC incidence rates predicted by Policy1-Bowel in the absence of the NBCSP were calibrated to these no-screening CRC incidence targets. APC modeling has previously been used in international studies to inform detailed trends data included in microsimulations.41,42
Summary of Calibration Target Data Used in This Study
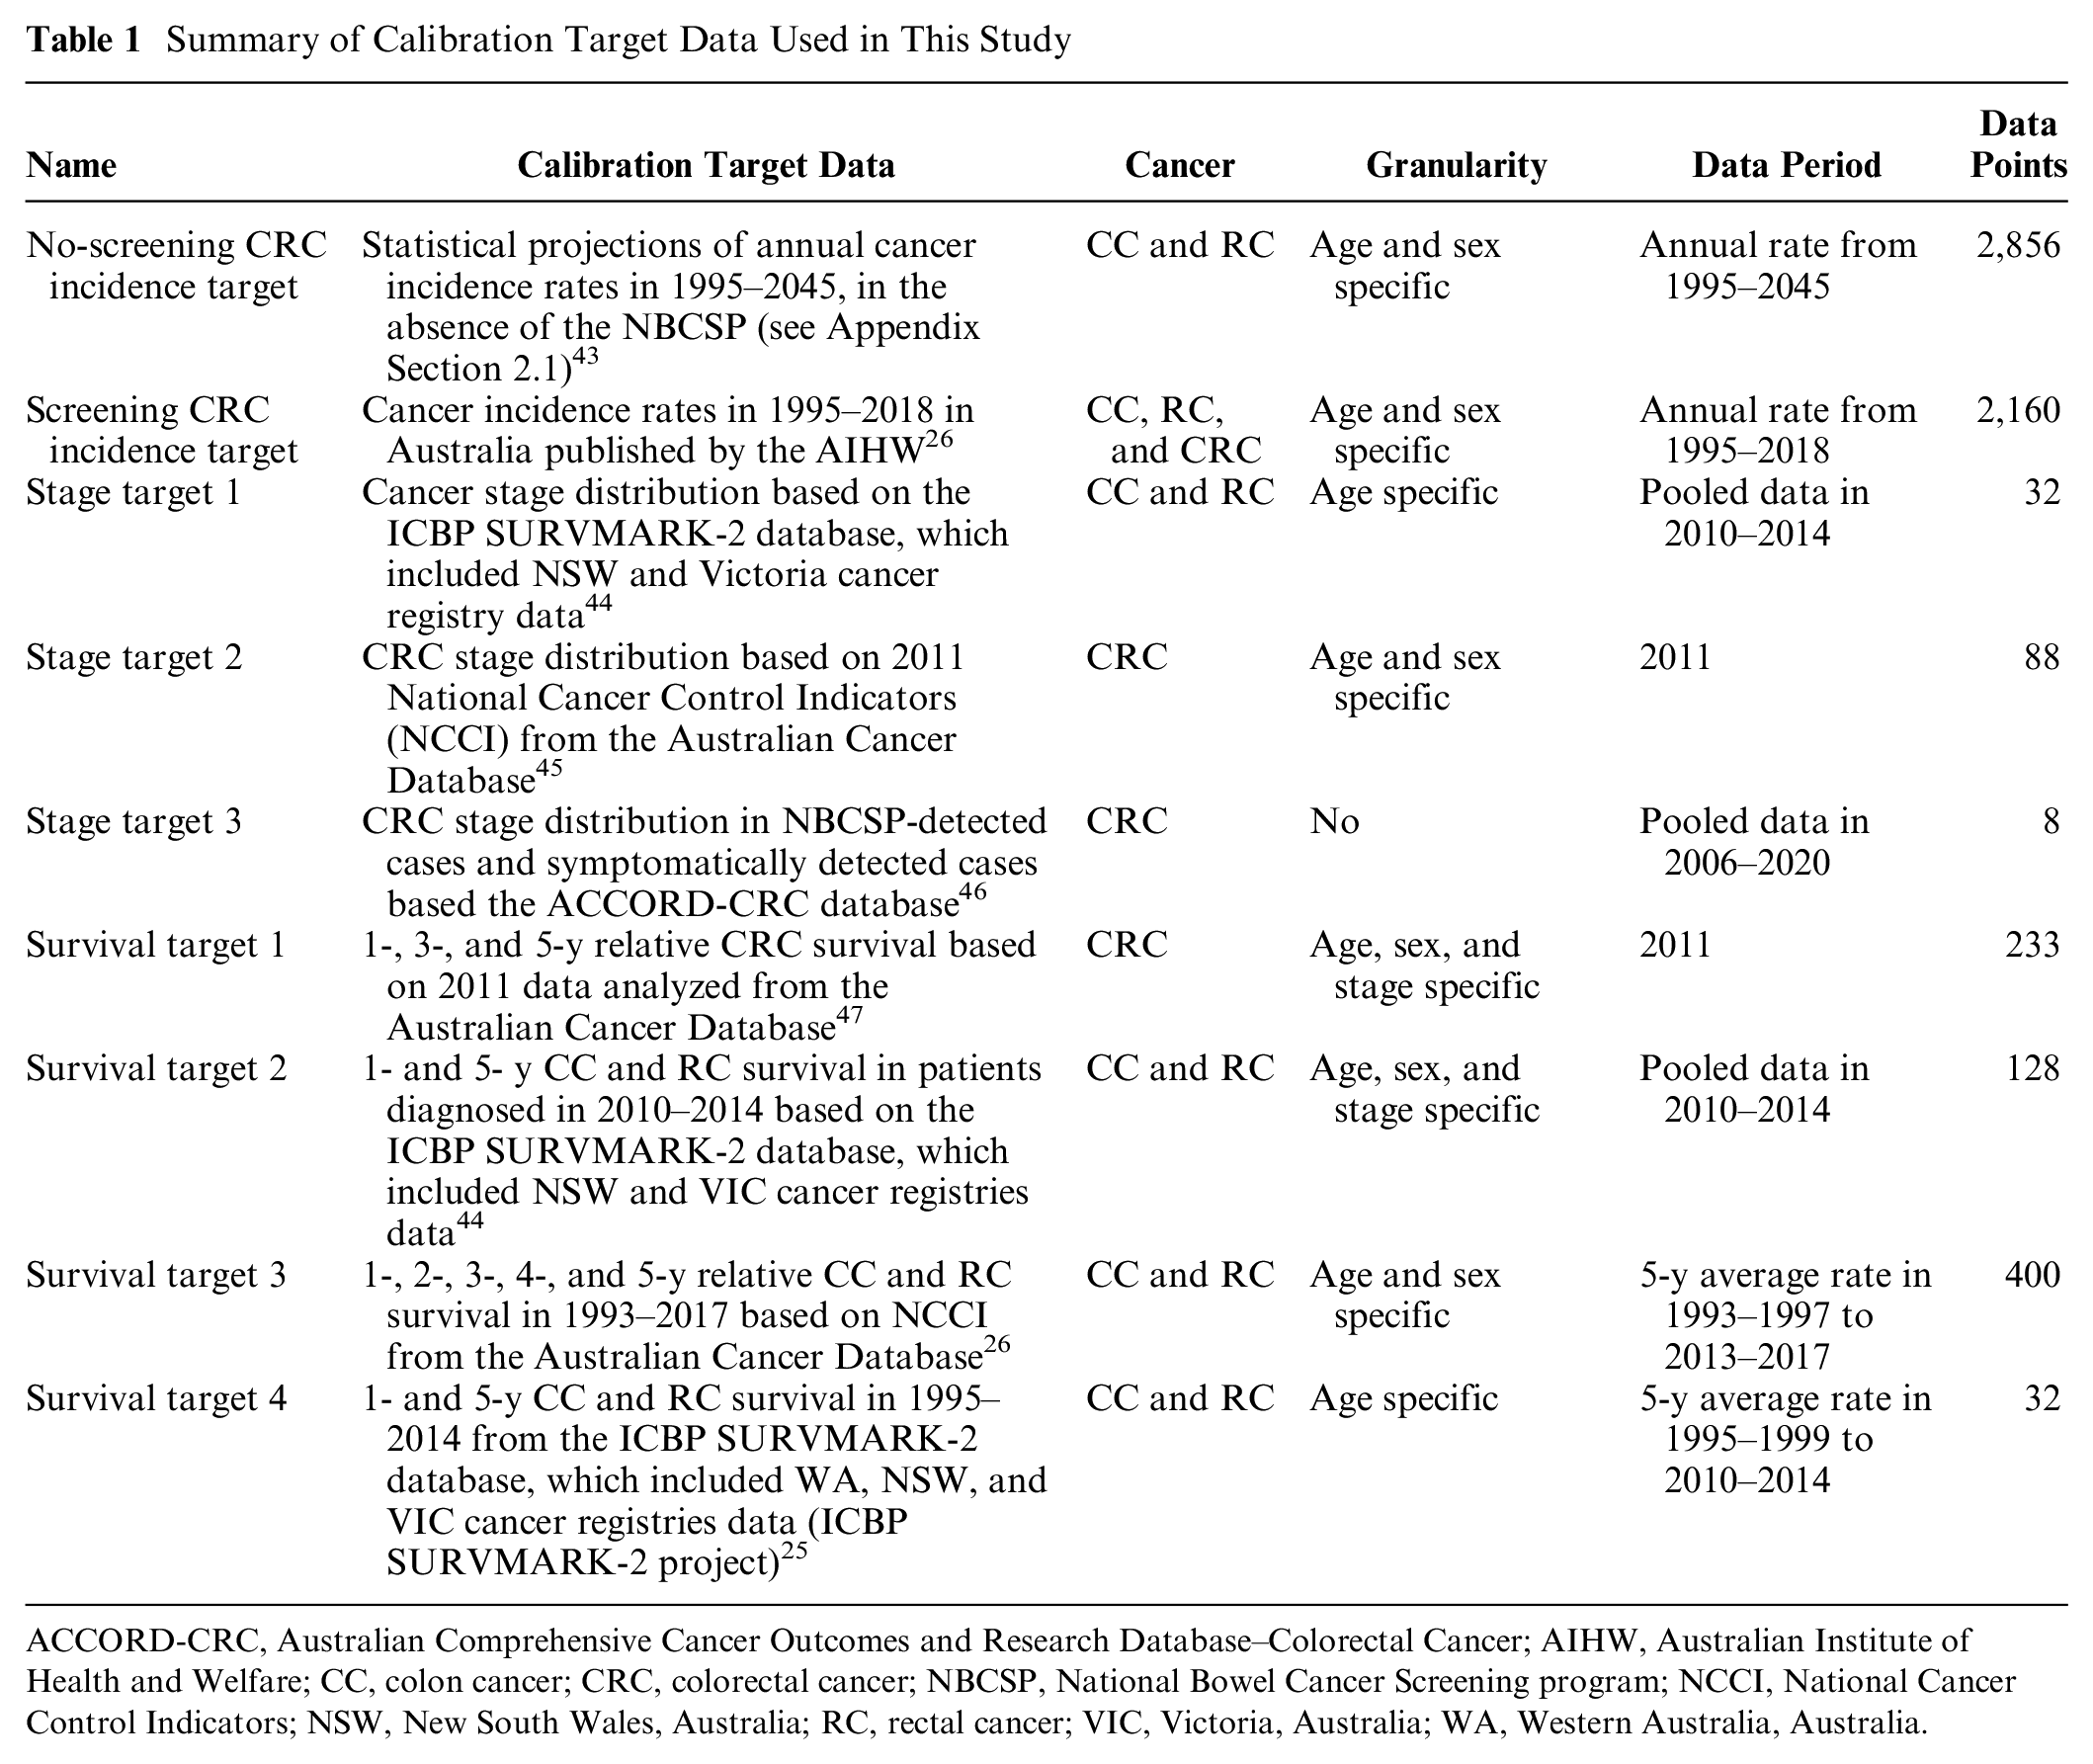
ACCORD-CRC, Australian Comprehensive Cancer Outcomes and Research Database–Colorectal Cancer; AIHW, Australian Institute of Health and Welfare; CC, colon cancer; CRC, colorectal cancer; NBCSP, National Bowel Cancer Screening program; NCCI, National Cancer Control Indicators; NSW, New South Wales, Australia; RC, rectal cancer; VIC, Victoria, Australia; WA, Western Australia, Australia.
Eight additional calibration target datasets of observed Australian data on cancer stage distributions, CRC incidence, and survival for 1995–2020 were identified from the published literature and government reports (Table 1). These were used as calibration targets for Policy1-Bowel predictions including the impact of the NBCSP from 2006. The 3 successive stages of Policy1-Bowel recalibration are outlined below and in Figure 1.
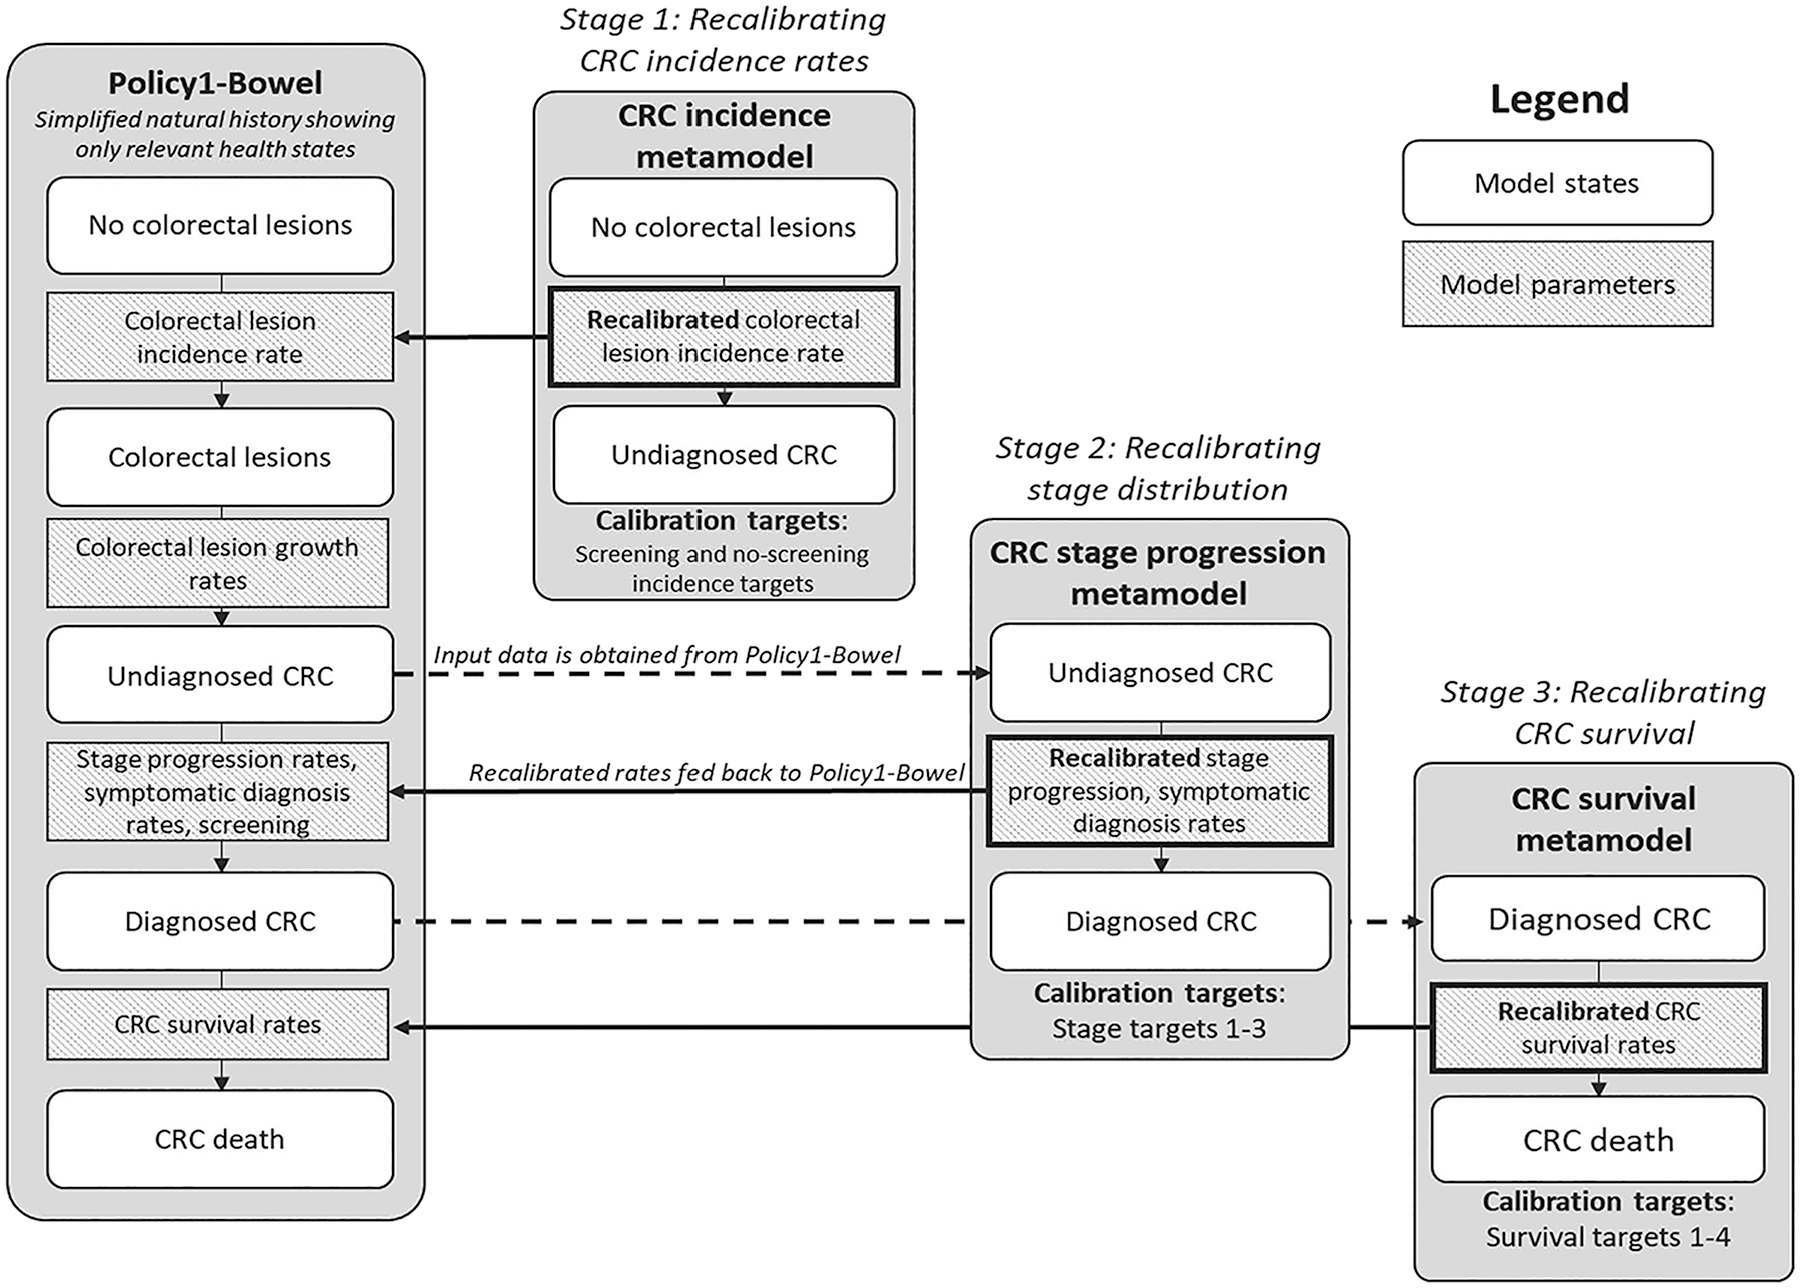
Schematic diagram of the Policy1-Bowel recalibration process and the metamodels used. CRC, colorectal cancer.
Throughout the recalibration process, metamodels were developed and used to make calibration to large data sets computationally feasible. This approach works by simplifying sections of the simulation and leveraging existing model data. This method was based on previous metamodel approaches to supplement epidemiological microsimulation models, leveraging the existing well-calibrated Policy1-Bowel parameter set.29,30 The metamodels used are shown in Figure 1, and a schematic diagram showing the Policy1-Bowel recalibration process is provided in Appendix Section 2.3.
Stage 1: Recalibrating CRC incidence rates
For stage 1 of the recalibration, Policy1-Bowel was recalibrated to better estimate CRC incidence trends, which vary by sex, location (colon or rectum), age, and birth cohort. Previously, Policy1-Bowel was calibrated to static CRC incidence rates for 2005–2007 from a cross-sectional cohort before the rollout of population-level screening.10,48 To complete this recalibration, we developed new CRC incidence projections and a metamodel to assist with the recalibration process.
APC baseline no-screening CRC incidence rate target
For this recalibration, Policy1-Bowel was recalibrated to reproduce baseline no-screening CRC incidence rates (no-screening CRC incidence target, Table 1), which were customized statistical projections of the CRC incidence rates in 1995–2045 for a counterfactual scenario in which the impact of the NBCSP was deliberately excluded. The APC model varied by age, sex, location (colon or rectum), and birth cohort and predicted overall CRC incidence rates. These rates were generated using a new integrative APC statistical modeling approach. This used CRC incidence data observed during 1982–2018 for people aged younger than 50 y (including an increasing trend in CRC incidence), data observed in 1982–2005 for those aged 50 to 74 y, and data observed in 1982–2018 for people aged 75+ y published by the Australian Institute of Health and Welfare. Observed data for people aged 50 to 74 y after 2006 (i.e., those eligible for NBCSP screening) were deliberately excluded to remove the impact of the NBCSP, so the model could reproduce the underlying lesion incidence. The integrative APC statistical model propagated to older ages the increasing trends observed for people aged <50 y. Full details of this approach appear elsewhere. 43 The APC model selection included adjusting the structure of the model by using different numbers of knots for natural cubic splines for smoothing and the integration of age groups in the APC model fitting. The choice of model design was varied to update these projections based on the Policy1-Bowel outputs. See Appendix Section 2.1 for a further description of the statistical projection methods and results.
CRC incidence metamodel
The recalibration to the no-screening CRC incidence target involved adjusting age-, sex-, location,- and birth cohort–specific adenoma and serrated lesion incidence rates for 130 birth cohorts to obtain model outcomes for people aged 20 to 99 y in 1995–2045. Previous Policy1-Bowel calibration methods are too computationally intensive to complete these calibrations, requiring months to complete. To reduce the computational burden, we developed a Python-based CRC incidence metamodel to assist with stage 1 recalibration.29,30 This metamodel used a parametric model of the relationship between lesion incidence rates and CRC incidence rates to approximate CRC incidence rates predicted by the full Policy1-Bowel model. For each birth cohort and cancer location (colon or rectum), each 10-y age range, 20 to 29, 30 to 39, . . ., 70+ y, was associated with a parameter
The CRC incidence metamodel was calibrated using the Nelder-Mead algorithm to identify the best-fit lesion incidence rate parameters for each birth cohort’s calibration targets. By using the multipliers
CRC incidence recalibration procedure
The Policy1-Bowel model was recalibrated to the no-screening CRC incidence target detailed above, as well as the screening CRC incidence targets, which included published Australian rates for 1995–2020 after the introduction of opportunistic and NBCSP screening. 26 These targets were reproduced by simulating cohorts without and with NBCSP screening, respectively. To reproduce the CRC incidence targets, we modified the underlying colorectal lesion incidence rates, which were allowed to vary by sex, location, age, and birth year, based on the findings of the CRC incidence metamodel. This in turn determines lesion prevalence and the subsequent likelihood of developing CRC. Stage 1 recalibration was conducted in 5 steps as described below and illustrated in Appendix Figure A5.
Step 1: An initial no-screening CRC incidence target was developed using a new integrative APC statistical modeling approach (see above).
Step 2: Policy1-Bowel was recalibrated to the initial no-screening CRC incidence targets by simulating a hypothetical cohort with no NBCSP screening and recalibrating the age-, sex-, and year-specific lesion incidence rates using the CRC incidence metamodel (see above). As there are no observed data available to inform CRC incidence trends and projections in the absence of the NBCSP, this intermediate projection was selected for the initial no-screening incidence projection target. The no-screening incidence target was subsequently revised in step 3 (below).
Step 3: The recalibrated model was used to predict CRC incidence rates in a cohort with NBCSP screening, which was compared with the screening CRC incidence target.
Step 4: The propagated CRC incidence for people aged <50 y to older ages in the statistical APC model was adjusted based on the error between the Policy1-Bowel’s predictions and the screening CRC incidence targets, to generate a new no-screening CRC incidence target. These updated no-screening incidence targets were generated by adjusting the numbers of knots for natural cubic splines for smoothing of the APC model and integration of age groups and was recalibrated based on the error between Policy1-Bowel’s predictions and the screening incidence targets.
Step 5: Steps 2 to 4 were then repeated iteratively until the recalibrated Policy1-Bowel’s predictions were consistent with the no-screening CRC incidence targets in a hyptothetical “no NBCSP screening” scenario and with the screening CRC incidence targets in the “NBCSP screening” scenario.
Stage 2: Recalibrating CRC stage distribution
In stage 2, Policy1-Bowel’s predicted cancer stage distribution was calibrated to 3 sets of calibration target data from the following databases (Table 1):
The ICBP SURVMARK-2 database: pooled data from the New South Wales Cancer Registry (NSWCR) and Victoria Cancer Registries (VCR) in 2010–2014 (stage target 1) 44
Australian Cancer Database (ACD): national data for 2011 (stage target 2) 45
ACCORD-CRC database: pooled data from 6 public and private hospitals in metropolitan Melbourne for 2006–2020 (stage target 3) 46
Variation in cancer stage by age, sex, location, and/or NBCSP-detected versus non-NBCSP-detected cancers were used as targets during recalibration where available. The 3 databases had different levels of representativeness of the average-risk Australian general population (Table 1). Therefore, where the data did not agree, we prioritized model recalibration to stage target 2 (the most representative), followed by stage target 1, and then stage target 3 (the least representative).
Policy1-Bowel was recalibrated by adjusting the age-, sex-, stage-, and location-specific annual transition rates for a preclinical cancer to progress to a more advanced stage or become diagnosed outside of NBCSP screening. No other parameters were modified in this calibration stage. These parameters varied by age but not birth cohort, as there were not sufficient data to inform trends in the stage distribution in the absence of screening. In these calibrations, NBCSP screening was included in the simulation, and so the model can explicitly capture stage shifting due to early detection through screening, which varies by age, sex, and year. To reduce the computational burden for stage 2 recalibration, we developed a Markov chain CRC stage progression metamodel in Python, which approximated the CRC natural history component of Policy1-Bowel. The CRC stage progression metamodel incorporated the age-, sex-, stage-, and location-specific preclinical CRC prevalence from Policy1-Bowel and estimated the cancer stage distribution at diagnosis. The estimated number of NBCSP screening tests (based on Policy1-Bowel’s predictions) was used as a proxy measure for the proportion of cancers detected at screening.
The CRC stage progression metamodel was calibrated using the Nelder-Mead algorithm to identify best-fit cancer natural history parameters. Goodness-of-fit between the model outputs and the stage targets was measured using the least-squares difference. The best-fit cancer natural history parameters were then fed back into Policy1-Bowel, and Policy1-Bowel’s predictions were used to verify the calibration. See Appendix Section 3 for further details.
Stage 3: Recalibrating CRC survival
Policy1-Bowel simulates detailed survival rates that vary by cancer location (colon or rectum), cancer stage at diagnosis, time since cancer diagnosis (1 to 5 y after diagnosis), age, and sex. In stage 3 of the recalibration, the parameters governing the age-, sex-, calendar year–, and stage-specific CRC survival for 1993–2017 predicted by Policy1-Bowel were recalibrated. As no single data source was available that could inform all model parameters, 4 sets of calibration target data (survival targets 1–4, Table 1) were identified.
Two of the calibration datasets, from the ACD (survival target 1) 47 and ICBP SURVMARK-2 databases (survival target 2), 44 were used to inform age-, sex-, stage-, and location-specific CRC survival in the period 2010–2014. Two other datasets, from the ACD (survival target 3) 26 and ICBP SURVMARK-2 database (survival target 4), 25 were used to inform age-, sex-, calendar year–, and location-specific CRC survival trends for 1995–2017.
Policy1-Bowel was recalibrated by adjusting the interval-specific CRC survival parameters, which vary by sex, age, cancer stage, time since diagnosis, calendar year, and cancer location. No other parameters were modified in this calibration stage. People who had an NBCSP-detected CRC were assumed to have a higher relative survival compared with people with a non-NBCSP-detected CRC 10 ; these rates were not recalibrated. The model-predicted 1- to 5-y relative survival was calculated by dividing the all-cause survival rate for cancer patients by the survival rate for the whole population, matched for age, sex, and calendar year. To reduce the calibration time, we developed a Markov chain CRC survival metamodel in Python to reproduce the cancer survival component of Policy1-Bowel. The CRC survival metamodel incorporated age-, sex-, stage-, calendar year–, and location-specific CRC incidence rates from Policy1-Bowel and simulated the cancer survival for 5 y after cancer diagnosis. The best-fit interval-specific cancer survival parameters were searched systematically using a sequential least squares programming optimization algorithm. Goodness-of-fit between the model outputs and survival targets 1 to 4 were measured using the least-squares difference. The final interval-specific CRC survival parameters identified by the metamodel were then incorporated into Policy1-Bowel, and Policy1-Bowel’s predictions were compared with survival targets 1 to 4 to verify the calibration outcomes.
Policy1-Bowel Validation
A 2022 study analyzed the CRC mortality trends by location in 1972–2015 in New South Wales based on data from the NSWCR and projected the CC and RC mortality rates up to 2040 using an age-stratified APC statistical modeling approach. 24 The NSWCR is the largest Australian population-wide registry, which collects and validates cancer registrations using a complete patient history based on multiple sources. New South Wales is the most populous state in Australia (it included about one-third of the total Australian population in 2023) and has a CRC mortality rate similar to Australia’s nationwide rate.26,49 As validation of the recalibrated Policy1-Bowel, we compared the 2022 study’s findings for trends and projections in 1995–2040 with the recalibrated Policy1-Bowel–predicted cancer mortality rates, which were based on the recalibrated CRC incidence and survival rates. 24 Neither the NSWCR data nor the findings of the 2022 study were used to inform the model recalibration. Because of known inaccuracies in published national CRC mortality rates due to coding errors, 50 the Australia Bureau of Statistics–reported nationwide CRC mortality rates by location were not used to validate the recalibrated Policy1-Bowel.
Results
Policy1-Bowel Recalibration
CRC incidence rates
The lesion incidence rates in Policy1-Bowel were recalibrated by identifying the best-fit parameter values to reproduce the target data. The recalibrated Policy1-Bowel predictions were broadly consistent with all CRC incidence targets. The associated normalized mean square error (NMSE; the mean square error normalised by the variance) was 0.014 versus the no-screening CRC incidence target and 0.043 versus the screening CRC incidence target. Modeled lesion prevalence at all ages was higher for later birth cohorts, with a notable increase for those born after 1970 (Appendix Figure A6). This reflects the expectation that increasing CRC prevalence rates are accompanied by higher lesion incidence rates. Lesion prevalence for people aged younger than 65 y was higher than the baseline estimates in the previous model parameter sets but lower than the baseline for people aged 65+ y. This reflects improved model fidelity compared with the previous Policy1-Bowel model calibration, which overestimated CRC incidence rates for older people. 10
The recalibrated Policy1-Bowel predicted CRC incidence rates for 1995–2040 for people aged <50 y, 50+ y, and all ages, with and without screening, are shown in Figures 2 and Figure 3. The cancer incidence rates for people aged <50 y (i.e., people not eligible for NBCSP) predicted by Policy1-Bowel were slightly lower than the no-screening incidence target. The recalibrated Policy1-Bowel predicted a larger increase in the cancer incidence rates for people aged 50+ y in 2013–2019 compared with the screening CRC incidence target (Figure 3), likely due to the impact of opportunistic screening (see the Discussion section).
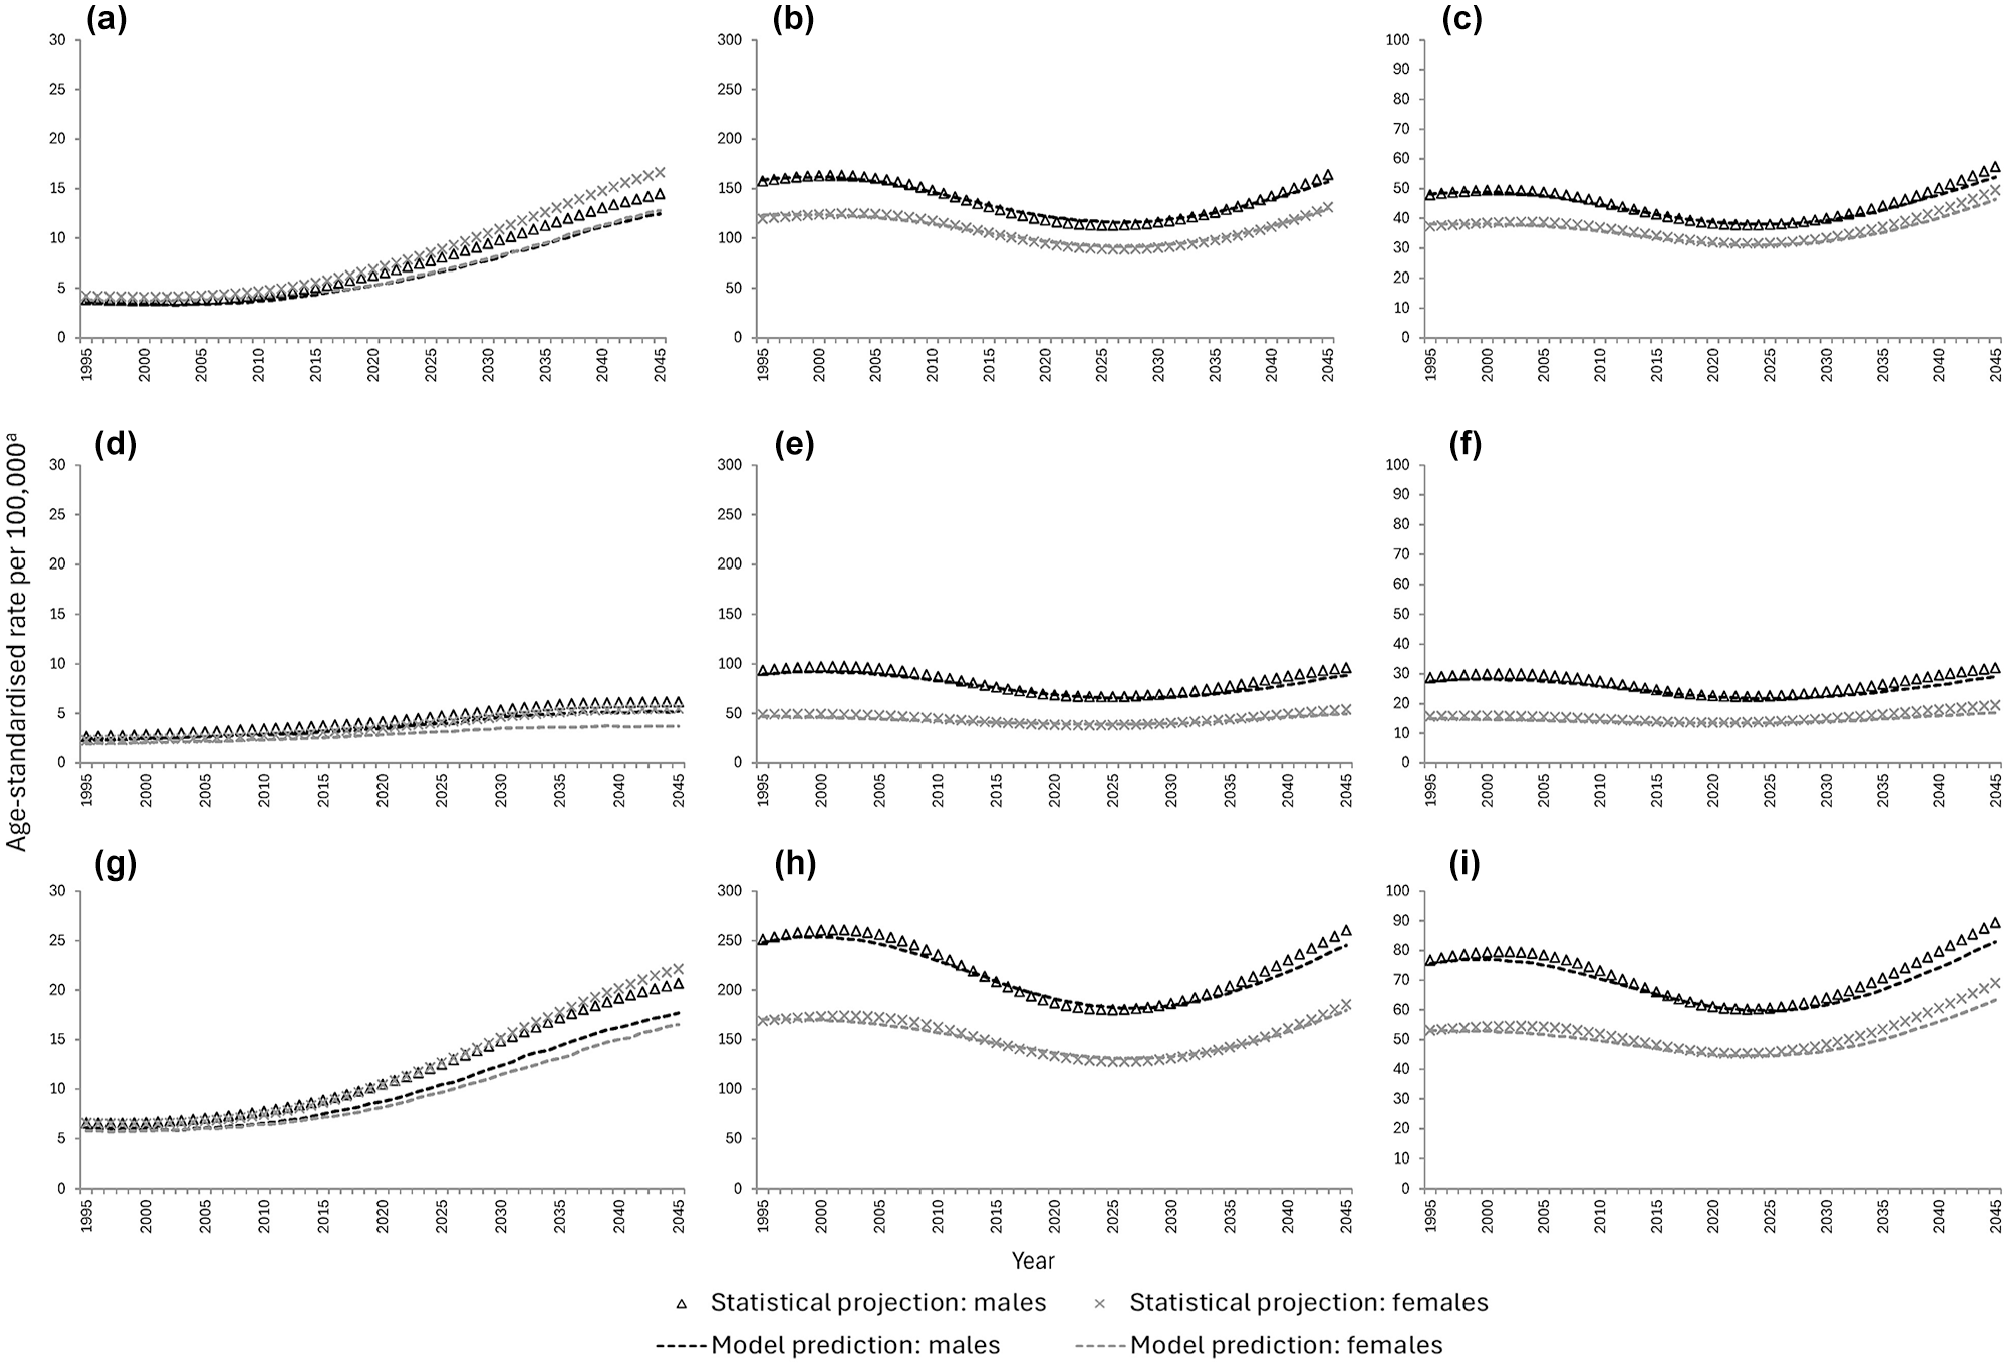
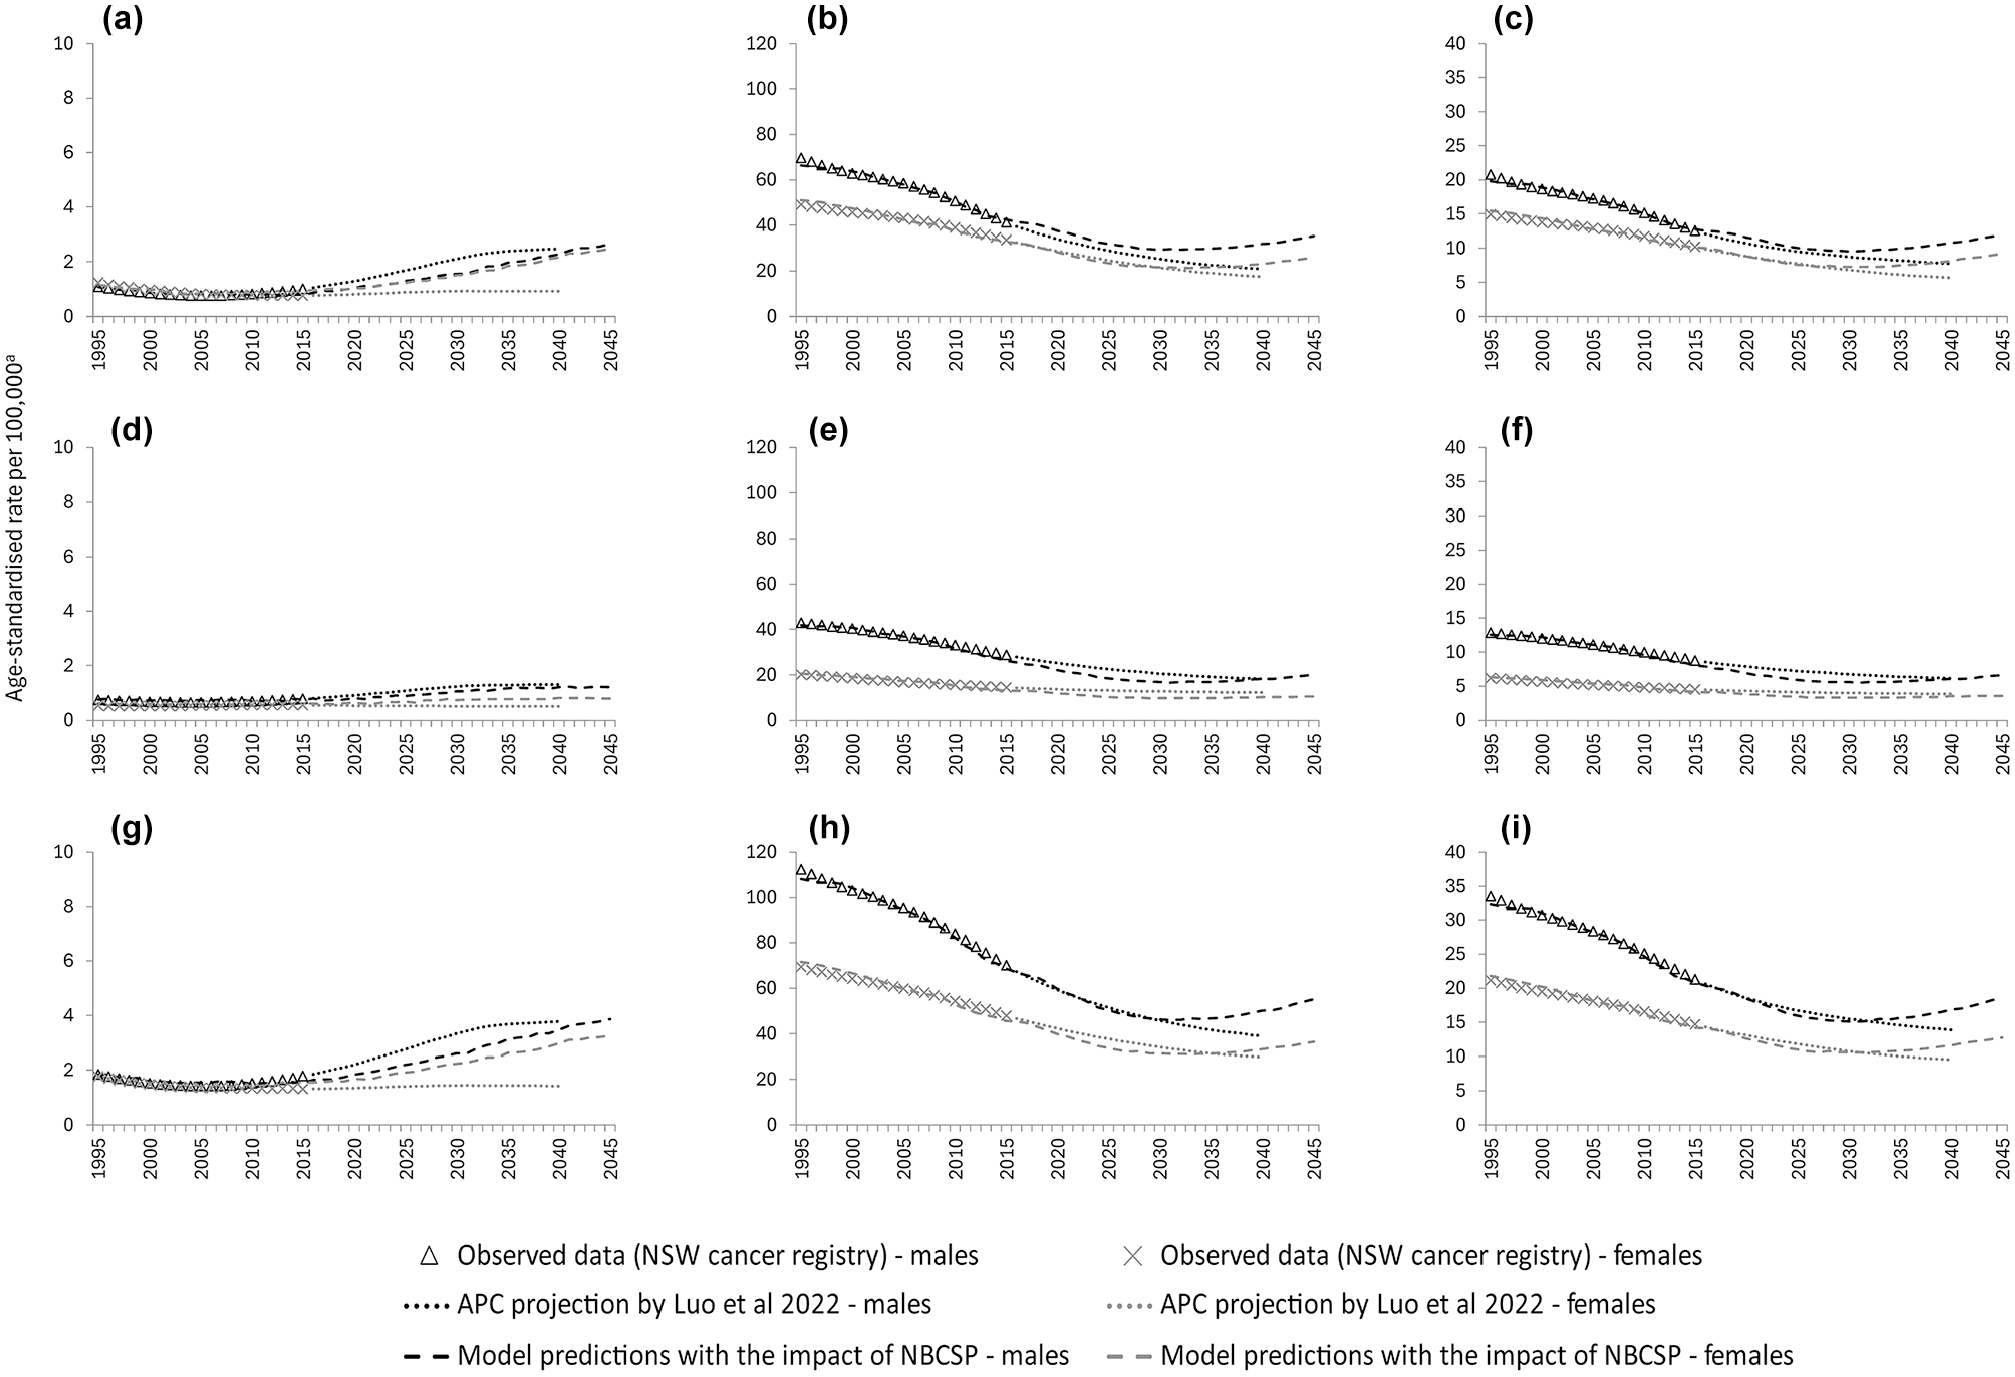
Model-predicted age-standardized CC, RC, and CRC incidence rate per 100,000 in 1995–2045 without the impact of the National Bowel Cancer Screening Program compared with the statistical age-period-cohort model projections (no-screening incidence target): (a) CC, age <50 y; (b) CC, age 50+ y; (c) CC, all ages; (d) RC, age <50 y; (e) RC, age 50+ y; (f) RC, all ages; (g) CRC, age <50 y; (h) CRC, age 50+ y; and (i) CRC, all ages.
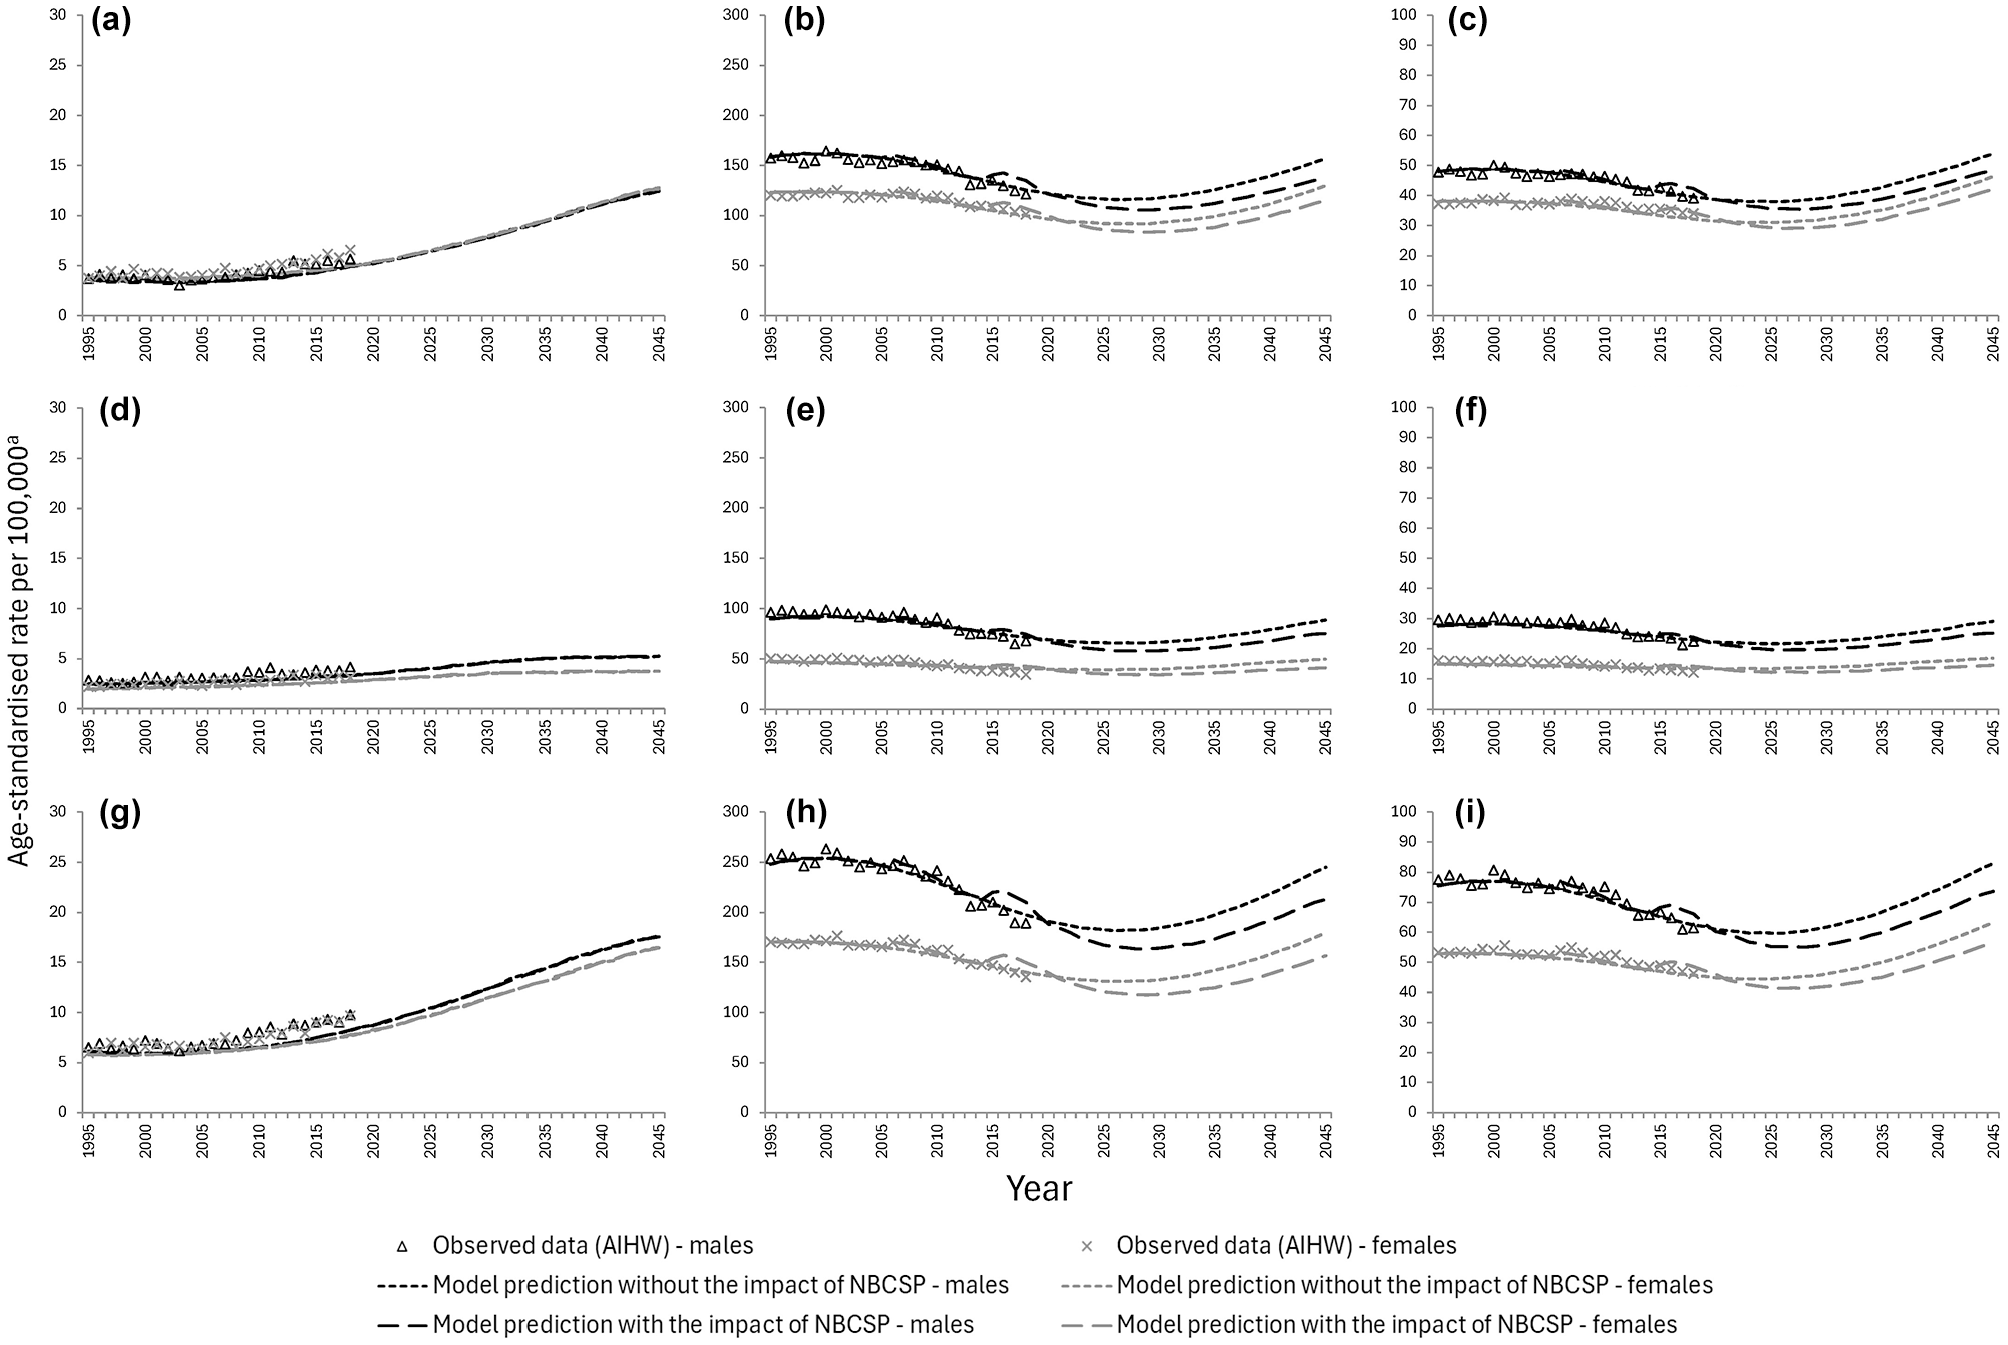
Model-predicted age-standardized CC, RC, and CRC incidence rate per 100,000 in 1995–2045 with and without the impact of the National Bowel Cancer Screening Program compared with the published observed data in Australia for 1995–2018 (screening CRC incidence target): (a) CC, age <50 y; (b) CC, age 50+ y; (c) CC, all ages; (d) RC, age <50 y; (e) RC, age 50+ y; (f) RC, all ages; (g) CRC, age <50 y; (h) CRC, age 50+ y; and (i) CRC, all ages.
CRC stage distribution
Using the best-fit cancer natural history parameters, the cancer stage distributions predicted by the recalibrated Policy1-Bowel were consistent with stage targets 1 (ICBP SURVMARK-2) and 2 (ACD), respectively (Figure 4) for all CRCs diagnosed in 2010–2014 and in 2011. The model-predicted cancer stage distributions for NBCSP-detected and non-NBCSP-detected cancers in 2006–2020 were also consistent with stage target 3 (ACCORD-CRC) (Figure 5). The recalibrated Policy1-Bowel predictions were associated with an NMSE of 0.334 when compared with stage target 1, 0.396 compared with stage target 2, 0.051 versus stage target 3 for NBCSP-detected cancers, and 0.445 versus stage target 3 for non-NBCSP-detected cancers. Generally, in the recalibrated stage progression parameter set, stage progression was slightly higher for younger ages (<60 y) than older ages, but non-NBCSP detection rates were higher for those in the 60- to 80-y age range at early stages, potentially indicating the presence of opportunistic screening. The stage target data by 5-y age groups (stage target 2) included significant fluctuations (Figure 4). This could be attributable to statistical uncertainty and/or the nonlinear impact of screening. However, the model estimates, which included the simulated impact of screening, generally fit these data well.
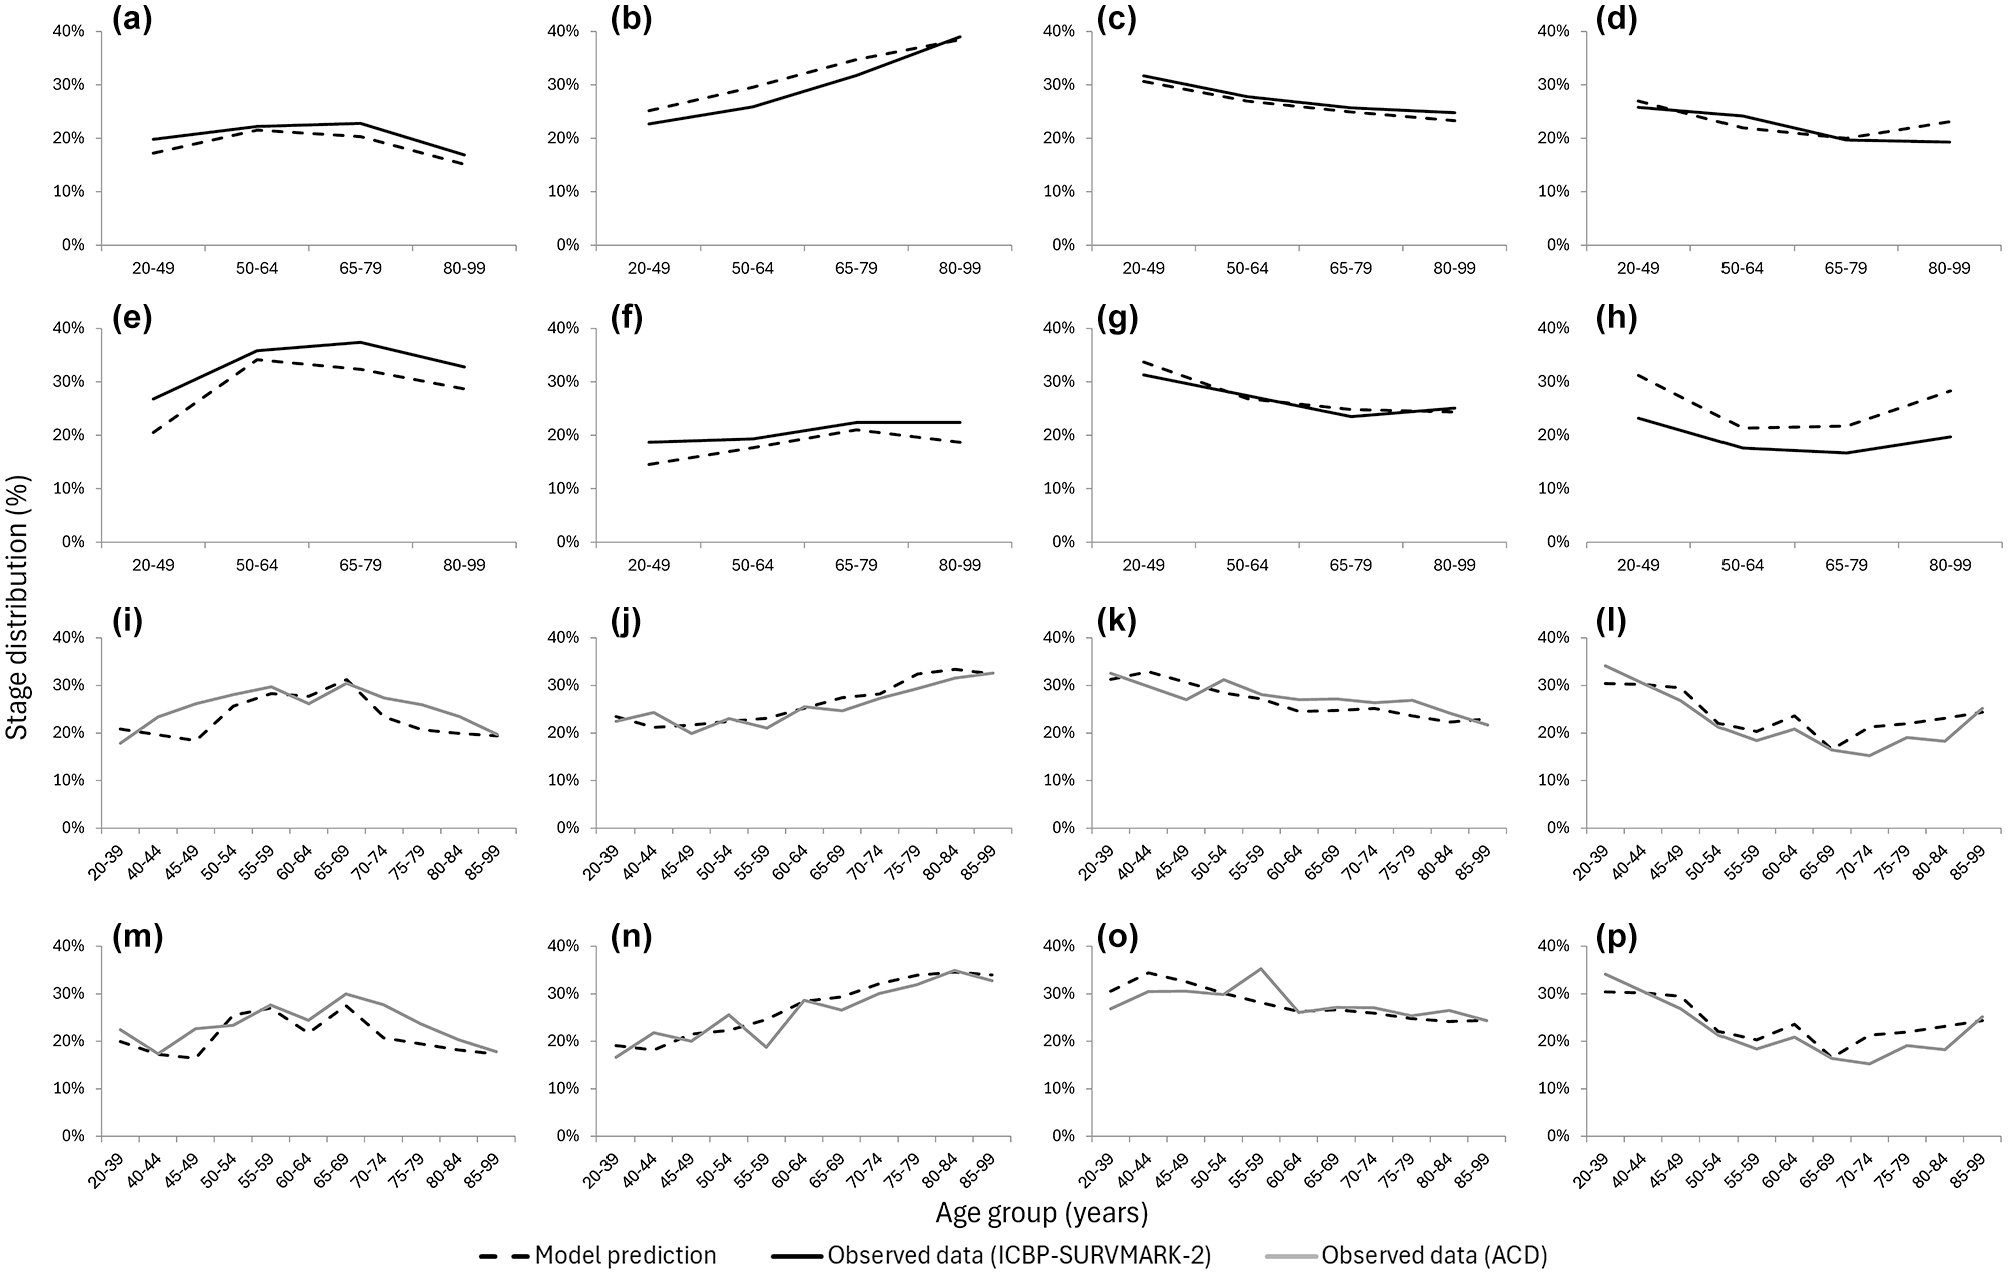
Model-predicted age-specific stage distribution of CC, RC, and CRC diagnosis by stage versus published data (stage targets 1 and 2): (a) both sexes, CC, stage 1a; (b) both sexes, CC, stage 2a; (c) both sexes, CC, stage 3a; (d) both sexes, CC, stage 4a; (e) both sexes, RC, stage 1a; (f) both sexes, RC, stage 2a; (g) both sexes, RC, stage 3a; (h) both sexes, RC, stage 4a; (i) male, CRC, stage 1b; (j) male, CRC, stage 2b; (k) male, CRC, stage 3b; (l) male, CRC, stage 4b; (m) female, CRC, stage 1b; (n) female, CRC, stage 2b; (o) female, CRC, stage 3b; and (p) female, CRC, stage 4.b
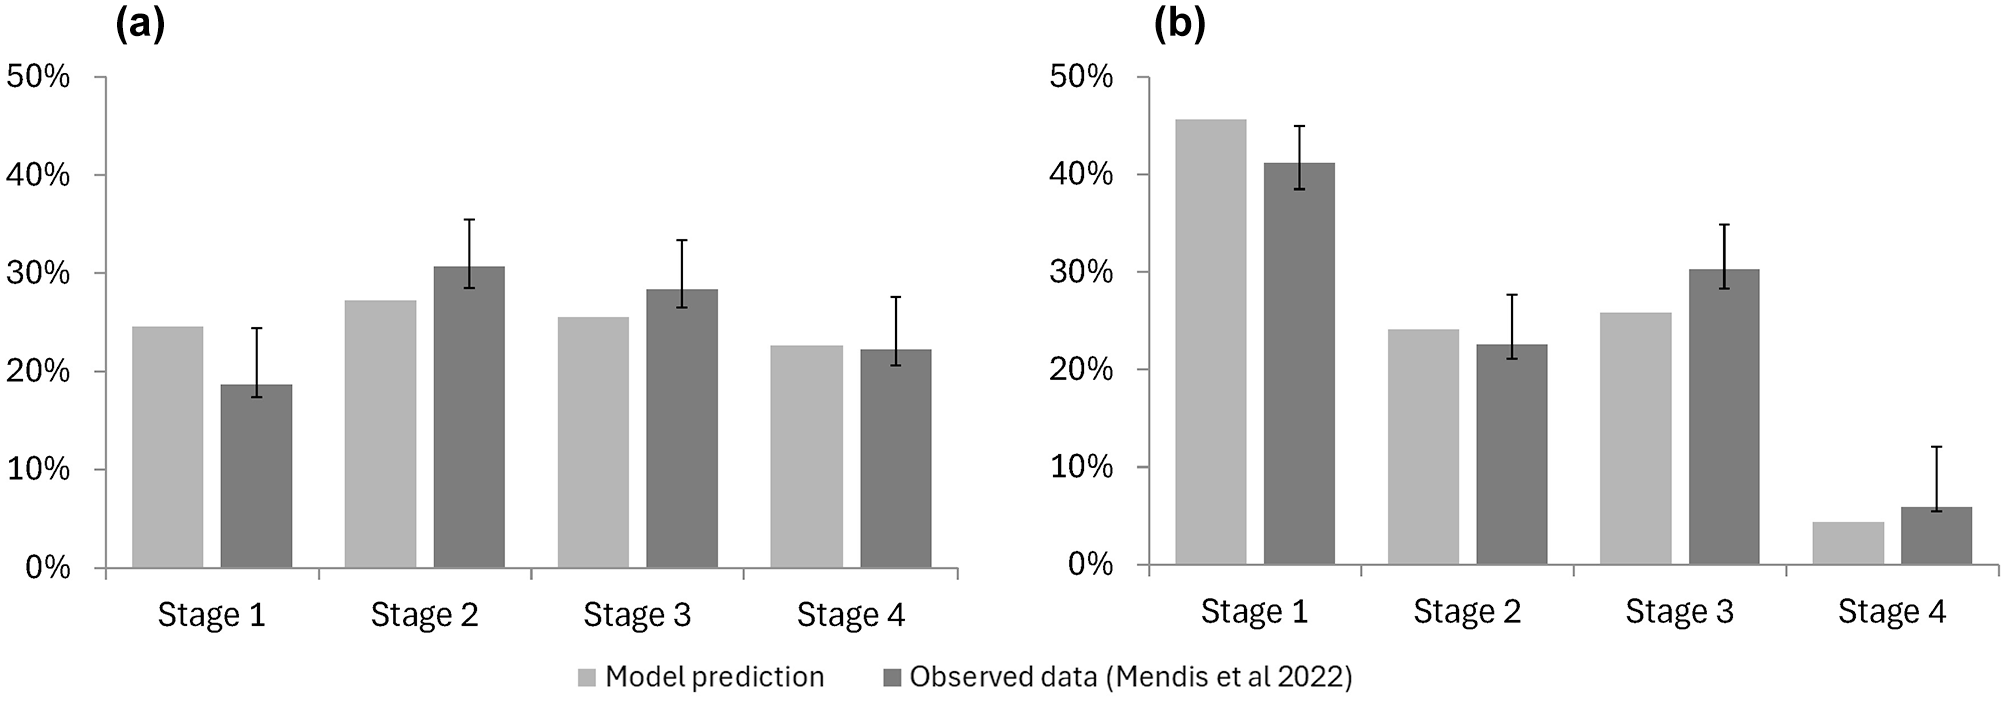
Model-predicted stage distribution of (a) non-NBCSP-detected and (b) NBCSP-detected CRCs diagnosed in people aged 50 to 74 y in 2006–2020 in the NBCSP screening scenario, compared with data from Mendis et al. (2022; stage target 3).
CRC survival
The age-, sex-, and stage-specific cancer survival in 2011 and 2010–2014 predicted by the recalibrated Policy1-Bowel model were consistent with survival target 1 (ACD) and survival target 2 (ICBP SURVMARK-2), respectively. The NMSE of the recalibrated Policy1-Bowel predictions was 0.032 compared with survival target 1 and 0.021 when compared with survival target 2. Figure 6 compares the recalibrated Policy1-Bowel predicted 5-y relative cancer survival compared with survival target 1 and survival target 2. The comparison between the model-predicted 1- and 3-y cancer survival with survival targets 1 and 2 are provided in Appendix Section 4.2. Across all stages, ages, and locations, the trends in the annual cancer survival parameters were slightly increasing, leading to the increasing trends in 5-y survival shown in Figure 7
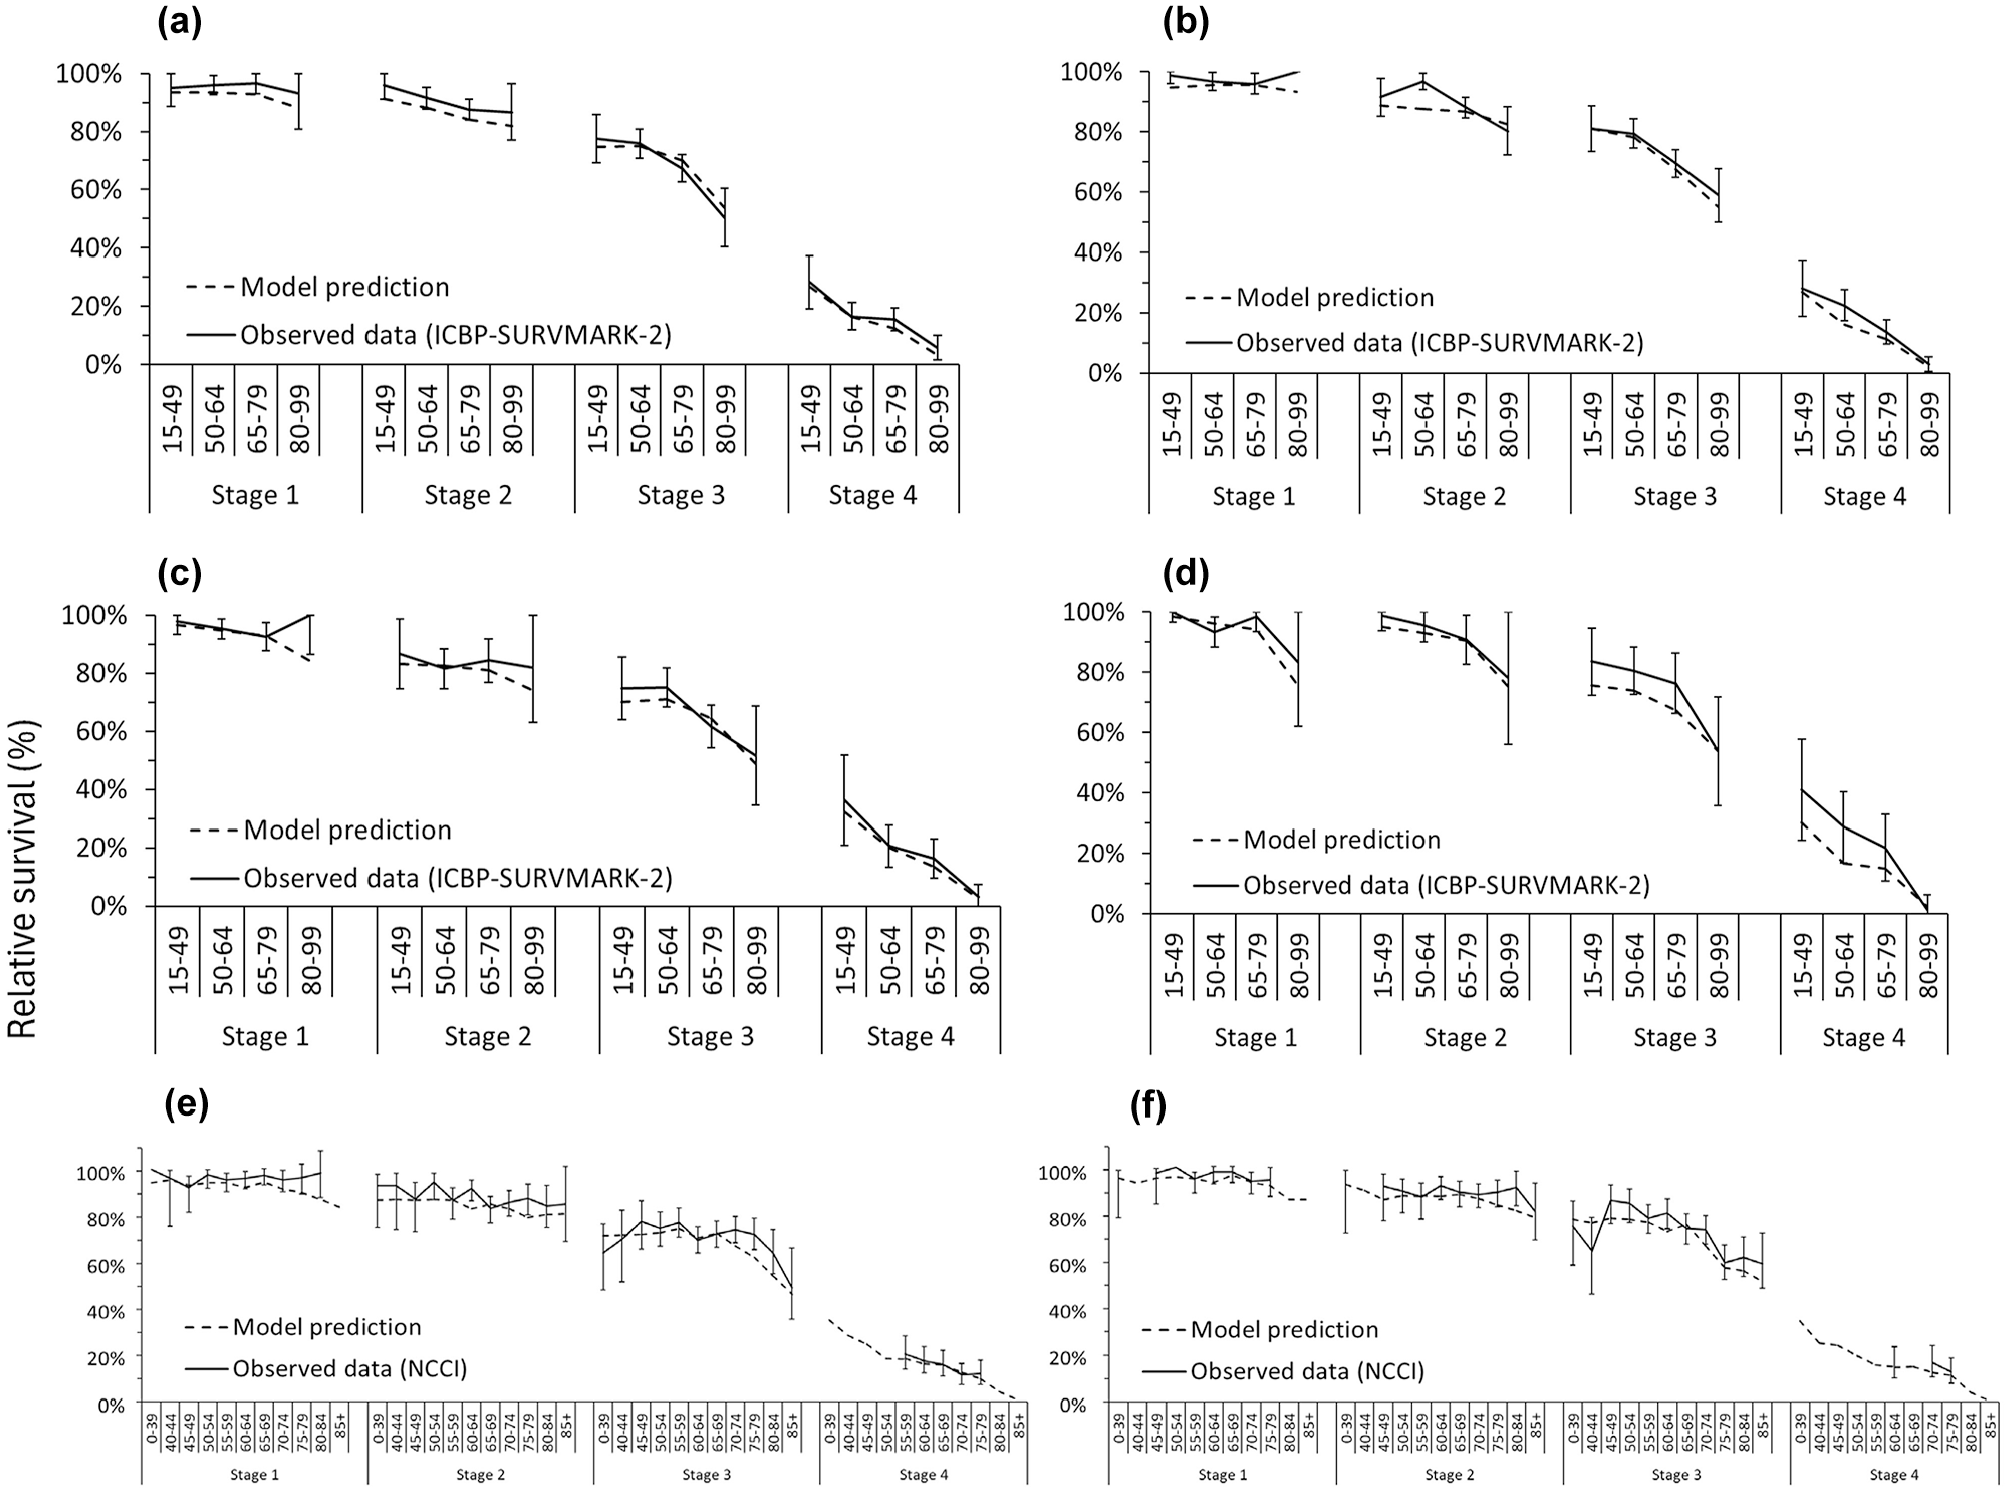
Model-predicted 5-y age-, sex-, and stage-specific CC, RC, and CRC relative survival versus observed data (survival targets 1 and 2): (a) 5-y CC survival, malesa; (b) 5-y CC survival, femalesa; (c) 5-y RC survival, malesa; (d) 5-y RC survival, femalesa; (e) 5-y CRC survival, malesb; and (f) 5-y CRC survival, femalesb. CC, colon cancer; CRC, colorectal cancer; ICBP, the International Cancer Benchmarking Partnership; SURVMARK-2, Cancer Survival in High-Income Countries project - phase 2; NCCI, National Cancer Control Indicators; RC, rectal cancer.
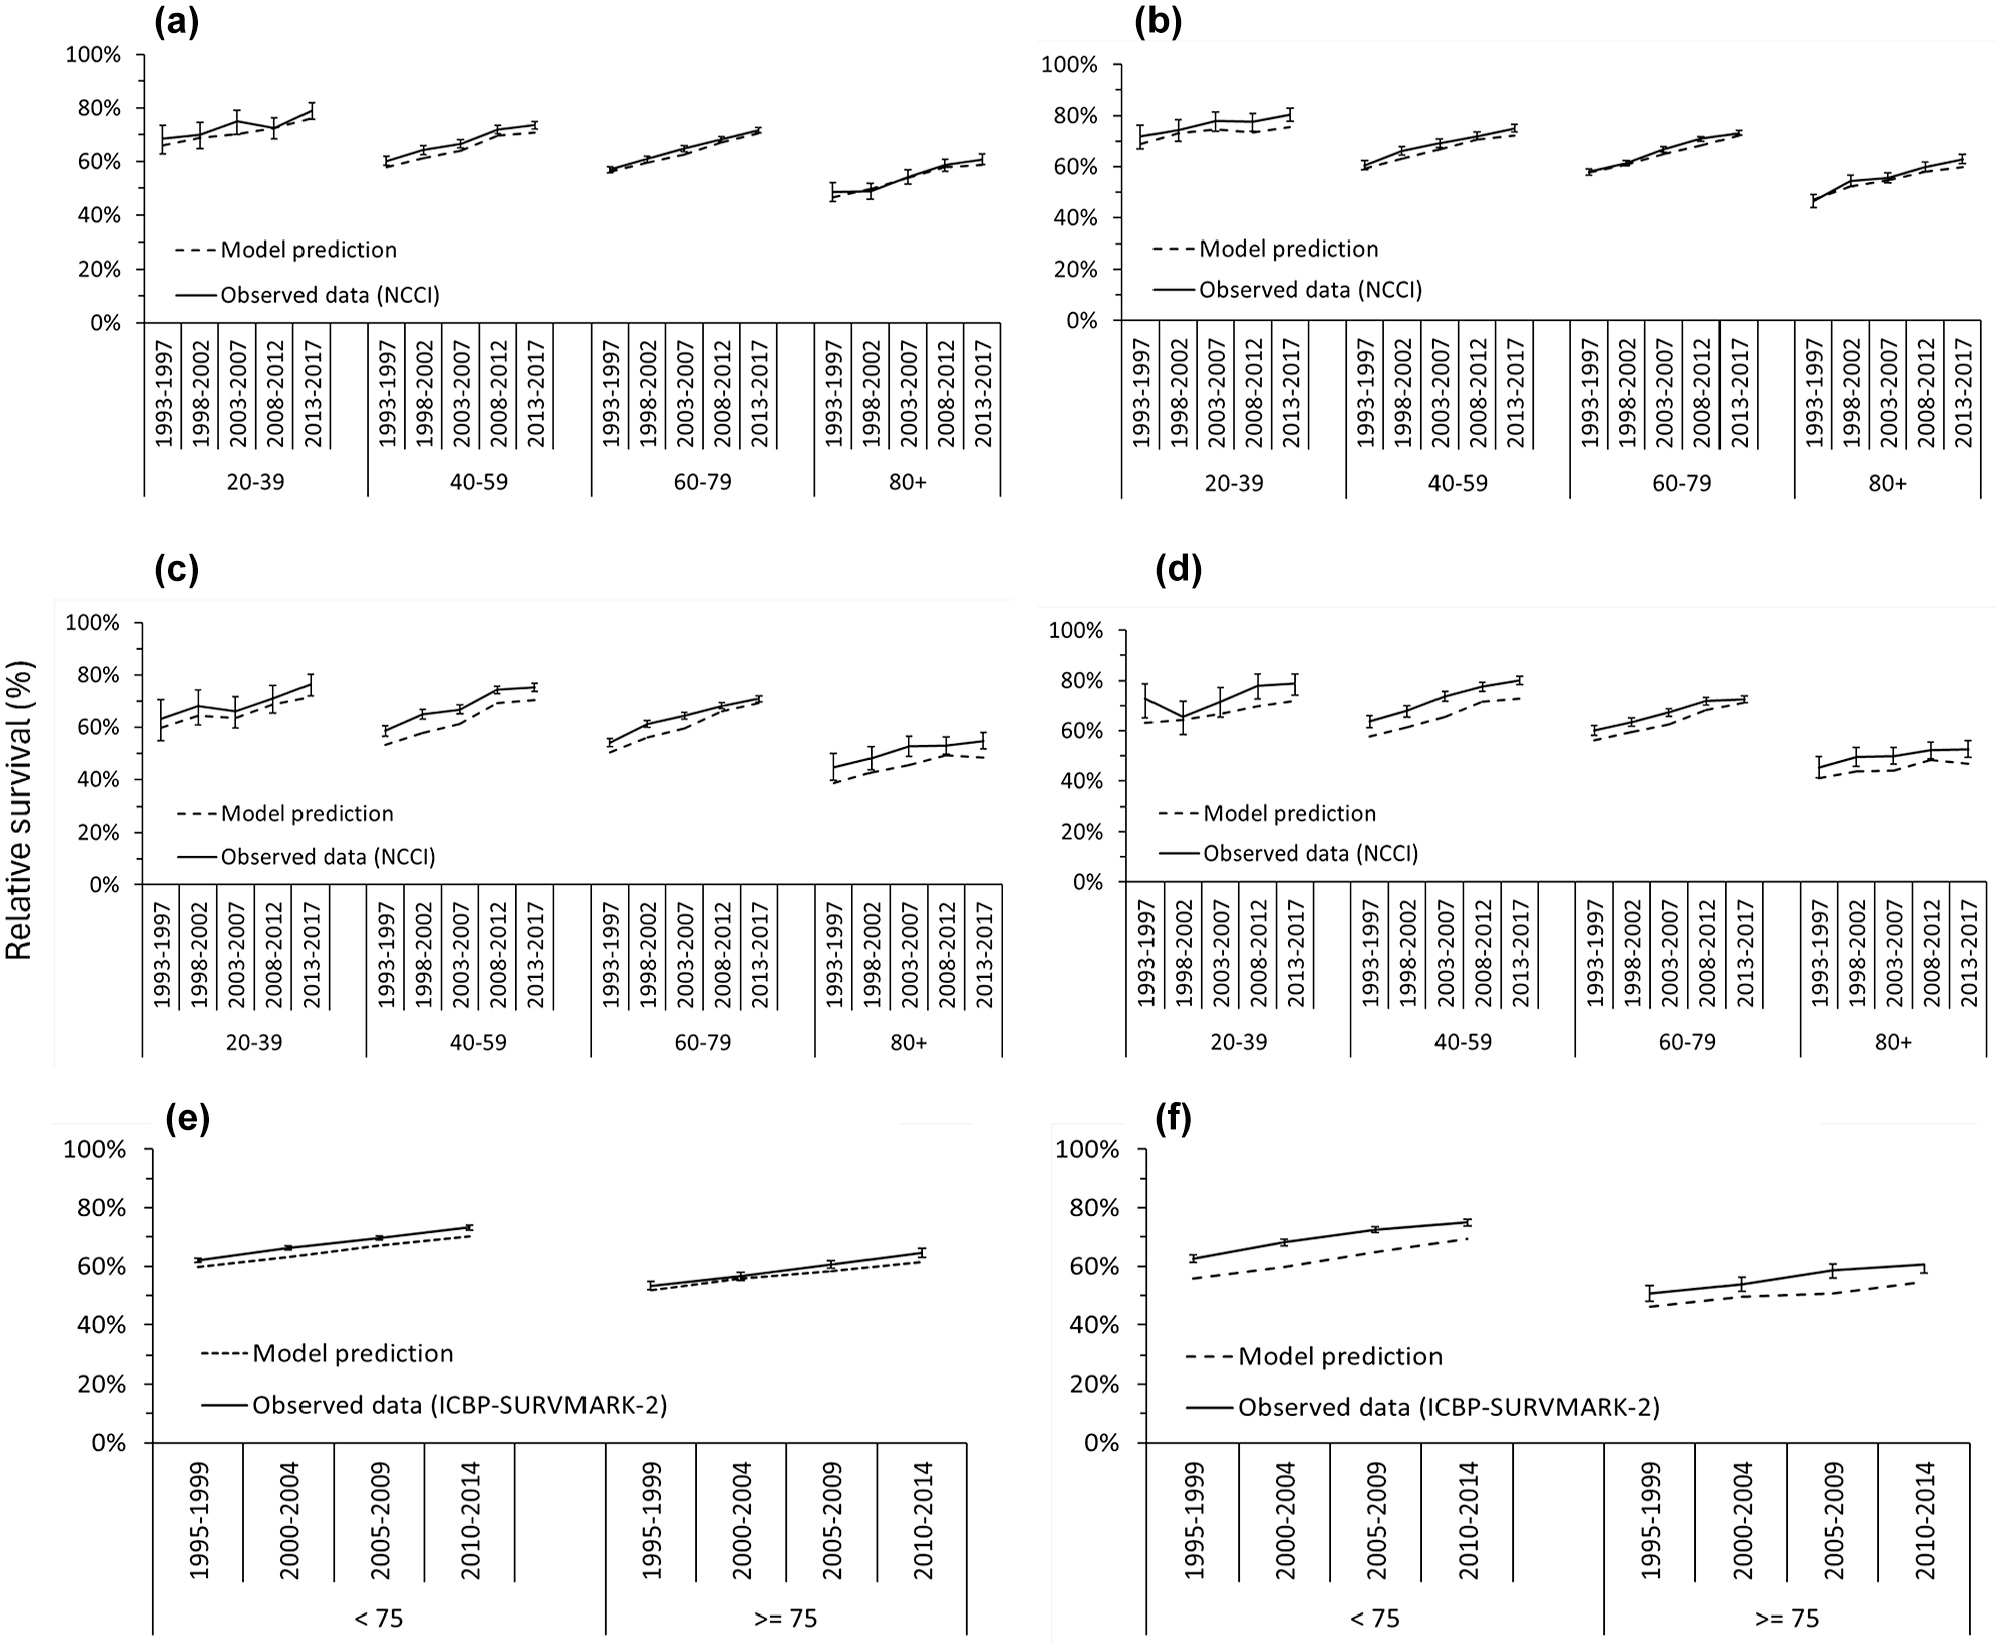
Model-predicted stage-specific CC and RC relative survival trends versus published data (survival targets 3 and 4): (a) 5-y relative CC survival in 1993–2017, males (NCCI)a; (b) 5-y relative CC survival in 1993–2017, females (NCCI); (c) 5-y relative RC survival in 1993–2017, males (NCCI)a; (d) 5-y relative RC survival in 1993–2017, females (NCCI); (e) 5-y relative CC survival in 1995–2014, males (SURVMARK)b; (f) 5-y relative RC survival in 1995–2014, females (SURVMARK).b
In addition, the trends in relative cancer survival predicted by Policy1-Bowel over the period 1995–2017 were consistent with survival targets 3 and 4, with an NMSE of 0.099 and 0.105, respectively. Figure 7 shows the recalibrated Policy1-Bowel–predicted trends in 5-y relative cancer survival. Additional details and calibration outcomes are shown in Appendix Section 4.
Policy1-Bowel Validation
The recalibrated Policy1-Bowel–predicted CRC mortality rates in 1995–2015 were consistent with the published APC statistical projections and the CRC mortality observed in New South Wales, 24 (Figure 8) which were not used to inform the recalibration. The recalibrated Policy1-Bowel predictions were broadly consistent with future APC statistical projections to 2030 (for which survival data were not available to recalibrate to) but differed from 2030 onward. This divergence was likely because the APC statistical projections did not directly model the effects of NBCSP screening but instead propagated the trends in mortality rates over 2006–2015 to later years, whereas Policy1-Bowel models the screening impact directly, including a plateau in health benefits after all individuals have been invited to screening.
Model-predicted CC, RC, and CRC mortality rates in 1995–2040 compared with published findings from a previous analysis of the New South Wales Cancer Registry data for 1995–2015 and statistical APC projections to 2045: (a) CC, age <50 y; (b) CC, age 50+ y; (c) CC, all ages; (d) RC, age <50 y; (e) RC, age 50+ y; (f) RC, all ages; (g) CRC, age <50 y; (h) CRC, age 50+ y; and (i) CRC, all ages.
Discussion
Policy1-Bowel was recalibrated to capture the detailed CRC incidence trends and projections, updated epidemiological data on CRC stage distributions, and detailed trends in CRC survival in Australia for 1995–2045. Furthermore, CRC mortality rates predicted by the model for 1995–2015 agree with data observed in NSW, and predictions for 2016–2030 are broadly consistent with published statistical APC projections. 24 To our knowledge, the newly recalibrated Policy1-Bowel is the first CRC microsimulation model to incorporate the detailed trends and projections in CRC incidence by age, sex, cancer location, and birth cohort and detailed trends in CRC survival by age, sex, cancer location, cancer stage, and year.
The recalibrated model was able to reproduce validation targets such as historical CRC mortality rates. The robustness and validity of Policy1-Bowel’s model structure, including its ability to capture screening outcomes, was assessed previously. 11 By incorporating new cancer incidence trends and accurate mortality predictions with a detailed simulation of NBCSP screening, Policy1-Bowel can make accurate predictions regarding the long-term health and cost impact of screening interventions and inform policy recommendations. For example, the recalibrated model can provide more accurate predictions of the long-term potential benefits, harms, and cost-effectiveness of lowering the NBCSP starting age to people aged 45 or 40 y, combining data on increasing cancer rates in this cohort with the impact of screening. The updated model was used to generate evidence for the NHMRC-approved Clinical Practice Guidelines for the Prevention, Early Detection and Management of colorectal cancer, 23 which led directly to the Australian Government Department of Health and Aged Care formally considering reducing the starting age of screening to 45 y. 51
Another strength of this study is the use of integrative statistical APC models to project CRC incidence rates, which were used to calibrate the Policy1-Bowel model. This method accounted for the rising CRC incidence in people aged <50 y, which has been reported in Australia and other countries, and complex trends for those aged 50+ y (temporarily decreasing over 2000–2025, likely attributable to opportunistic screening, and increasing from 2025 as the younger cohort with increased CRC incidence ages). Previous studies that used APC modeling to inform microsimulation models include a study that generated a counterfactual baseline for cervical cancer incidence in the absence of screening, 41 similar to our approach. Modeling by the US Preventive Services Task Force also used APC modeling to inform increases in the CRC incidence rate in their microsimulation.42,52 Unlike that study, our analysis uses novel methods to incorporate both increasing CRC incidence for people younger than 50 y and slightly lower CRC incidence rates for people older than 50 y (potentially due to opportunistic, non-NBCSP screening among other risk factor trends) in our no-NBCSP-screening projections. 43
A further strength of this study is the use of metamodels to aid recalibration. Policy1-Bowel is a complex microsimulation model that requires hours to simulate a single birth cohort. Recalibrating Policy1-Bowel to CRC incidence trends during 1995–2045 would require calibrating outcomes for 153 birth cohorts. Traditional calibration approaches would be infeasibly computationally intensive as each cohort would require many simulation iterations, so calibrating a single cohort could take days or weeks. The 3 metamodels used in this study can complete a multicohort model calibration under an hour, if not minutes. This significantly reduced the computational runtime required for Policy1-Bowel recalibration, making it achievable within the project time frame and providing a platform to update the model calibration with any new data in a timely manner.
Generally, metamodeling can help speed up computationally intensive epidemiological models, used to perform value-of-information analysis, deterministic or probabilistic sensitivity analyses, model calibration, and optimization. 27 For example, a 2021 study used a metamodel of the Adenoma and Serrated Pathway to Colorectal Cancer microsimulation model to assess more than 40,000 CRC screening strategies after calibrating to a baseline set of 300 screening strategies; this would have been infeasible for the full microsimulation model. 29 Other studies used machine learning–based metamodels to calibrate the natural history of microsimulation models of CRC,28,30 substantially reducing the computational time without requiring domain-specific knowledge for the metamodel design. The design of a metamodel can be very flexible, as the metamodels themselves are used only to identify candidate parameter sets. The final calibration targets are always computed in the original model, and all subsequent analyses use the full, original model.
In addition, by staging the calibration across CRC incidence, stage at diagnosis, and survival, we were able to reduce the number of parameters varied at each stage. These 3 parts of the model are relatively independent. Although the stage calibration may affect the time of CRC diagnosis and therefore the CRC incidence outcomes, the changes made during the stage calibration in this study did not affect the accuracy of the final CRC incidence outcomes, demonstrating that sequential calibrations were sufficient to reproduce the calibration targets.
The exact causes of increasing trends in CRC incidence for people younger than 50 y are unclear. 3 These increases may be due to a rise in risk factors, 53 increased public awareness of CRC, genetic risk, and/or potential increases in opportunistic screening (see below) leading to earlier diagnoses. Additional data are required to better understand and capture the causes of these trends. Our model recalibration supports the theory that opportunistic screening activities have had a significant role in this increase. The integrative APC statistical modeling approach avoids the need to simulate specific causes and risk factors, instead using trends observed in routinely collected national data and projections based on these. This approach can be refined as additional data and evidence become available. In addition, our APC approach relies on extrapolating from data for unscreened cohorts. Although we have developed new techniques to combine findings from unscreened and screened cohorts, 43 these methods will need to evolve as fewer cohorts remain unexposed to screening.
Although the CRC mortality rates predicted by Policy1-Bowel were consistent with the APC statistical projections for 2016–2030, they differed from 2030 onward. The divergence is likely due to the different ways Policy1-Bowel and the APC statistical projections capture the effect of the NBCSP. The APC statistical projections are based on data prior to 2015, when the NBCSP was gradually expanding its range of eligible ages and propagated trends attributable to the increasing influence of NBCSP in projections of future mortality rates. These decreasing trends are also present in other projections of CRC mortality in Australia. 7 As the NBCSP reached full rollout in 2020 and all eligible individuals have been invited, its impact on CRC rates is likely to have consistent impacts on each birth cohort, as they are exposed to the same biennial screening invitations across their lifetime rather than the inconsistent invitation schedules experienced over 2006–2019. In addition, the CRC mortality projections used standard age-stratified APC models (separate APC models for age <50 y and age 50+ y), which may not have fully propagated the increasing CRC risk for younger age groups to the older age groups. This means the APC model may have overestimated the reduction in mortality rates over 2030–2040. In contrast, Policy1-Bowel simulates the phased implementation of the NBCSP and detailed screening patterns and projections over 2030–2040, including a more realistic plateauing of the NBCSP’s impact. Policy1-Bowel therefore predicted an overall increasing trend for CRC mortality rates after 2030 due to the increasing CRC risk modeled for the younger birth cohorts and the constant impact of the NBCSP. We believe this is both a more realistic set of projections for the CRC mortality rates and a more powerful platform to evaluate the impact of any potential changes to cancer screening in Australia.
A limitation of this study is that Policy1-Bowel cannot completely capture the impact of opportunistic screening outside of the NBCSP on CRC outcomes and trends in Australia. Opportunistic screening increased in Australia from the early 1990s, indicated by the increasing number of Medicare claims for colonoscopies and other analyses.20,54,55 Opportunistic screening could increase the cancer incidence for younger ages through early detection and reduce the cancer incidence for older ages due to the removal of precancerous lesions. Although the statistical APC modeling used to inform Policy1-Bowel included non-NBCSP-related trends such as the impact of opportunistic screening on CRC incidence, Policy1-Bowel was not designed to simulate the opportunistic screening activities in detail as there are no data available on the magnitude or the pattern of opportunistic CRC screening activities in Australia (e.g., age range, screening frequencies, screening technologies used, reasons to attend screening, etc.). This limitation led to an underestimate of the model-predicted CRC incidence rates for people aged <50 y from mid-2000 and an overestimate for people aged 50+ y in 2013–2019, due to the unmodeled impact of opportunistic screening. The latter discrepancies were found in the model predictions for 2013–2019, a period coinciding with the rapid expansion of the NBCSP when more people aged 50–74 y were invited to participate for the first time. This occurred because Policy1-Bowel could not account for the nonnegligible proportion of people participating in the NBCSP who had previously undergone opportunistic screening and were less likely to have underlying colorectal lesions and/or cancer. This discrepancy is expected to diminish after the NBCSP became fully implemented in 2020, as the proportion of individuals participating in the NBCSP for the first time will be significantly reduced and consist mostly of those aged 50 y.
The APC modeling itself has some notable assumptions and limitations. Age-specific effects are assumed to remain unchanged over time, reflecting relative risk increases due to aging. Future cohort and period effects are assumed to be the same as those in the most recent observed cohort and period in the absence of the NBCSP. The projections do not explicitly capture historical or future changes in risk factors that can contribute to CRC, such as smoking exposure, alcohol drinking, red meat or processed meat consumption, physical inactivity, overweight and diabetes, or the impact of prevention interventions.
The recalibration to reproduce CRC incidence rates was based on adjusting the underlying lesion incidence rates only. Other parameters, such as lesion growth rates and cancer onset rates, were not adjusted. While it is plausible that the same drivers of increasing cancer incidence could also cause an acceleration in lesion growth rates, there were no data available to directly inform this. We therefore chose to focus on calibrating a smaller number of parameters governing lesion incidence, to avoid overfitting the model. Future modeling should explore the impact of this assumption and identify potential data sources to inform lesion prevalence and growth trends, rather than calibrating solely to cancer incidence trends and existing, static data on lesion prevalence.
Another limitation of the study is that, in the absence of data for CRC survival projections, Policy1-Bowel assumed that CRC survival rates from 2018 onward remained the same as the rates observed for 2014–2017 (i.e., the latest observed data available to inform the calibration). This is a conservative assumption, which may lead to an overestimate of future CRC mortality rates if CRC survival in Australia improves due to advancements in cancer treatment. We will continue updating Policy1-Bowel to incorporate any new evidence on CRC survival. We were also not able to reflect the uncertainty in the data sources. Future modeling work could use metamodels to bootstrap the baseline modeling results to assess the impact of the variances of parameters, which is a method that has successfully been used previously.27,29,56
The newly recalibrated Policy1-Bowel can make detailed and accurate predictions of the future CRC incidence, mortality, and screening outcomes in Australia. The predictions generated by the updated model can be used to inform policy decisions relating to CRC, particularly population CRC screening recommendations and other CRC control initiatives, as the burden of CRC and the impact of screening continue to evolve in Australia. The metamodels developed in this study will allow Policy1-Bowel to be recalibrated regularly to incorporate new evidence on CRC incidence, mortality, and survival.
Supplemental Material
sj-docx-1-mdm-10.1177_0272989X251314050 – Supplemental material for Recalibrating an Established Microsimulation Model to Capture Trends and Projections of Colorectal Cancer Incidence and Mortality
Supplemental material, sj-docx-1-mdm-10.1177_0272989X251314050 for Recalibrating an Established Microsimulation Model to Capture Trends and Projections of Colorectal Cancer Incidence and Mortality by Jie-Bin Lew, Qingwei Luo, Joachim Worthington, Han Ge, Emily He, Julia Steinberg, Michael Caruana, Dianne L. O’Connell, Eleonora Feletto and Karen Canfell in Medical Decision Making
Supplemental Material
sj-pdf-2-mdm-10.1177_0272989X251314050 – Supplemental material for Recalibrating an Established Microsimulation Model to Capture Trends and Projections of Colorectal Cancer Incidence and Mortality
Supplemental material, sj-pdf-2-mdm-10.1177_0272989X251314050 for Recalibrating an Established Microsimulation Model to Capture Trends and Projections of Colorectal Cancer Incidence and Mortality by Jie-Bin Lew, Qingwei Luo, Joachim Worthington, Han Ge, Emily He, Julia Steinberg, Michael Caruana, Dianne L. O’Connell, Eleonora Feletto and Karen Canfell in Medical Decision Making
Footnotes
The authors declared the following potential conflicts of interest with respect to the research, authorship, and/or publication of this article: Karen Canfell is co-principal investigator (PI) of an investigator-initiated trial of human papillomavirus (HPV) screening in Australia (Compass), which is conducted and funded by the Australian Centre for the Prevention of Cervical Cancer (ACPCC), a government-funded health promotion charity. The ACPCC has previously received equipment and a funding contribution for the Compass trial from Roche Molecular Systems USA. She is also co-PI on a major implementation program, “Elimination of Cervical Cancer in the Western Pacific,” which receives support from the Minderoo Foundation and equipment donations from Cepheid Inc. Michael Caruana is an investigator on an investigator-initiated trial of cytology and primary HPV screening in Australia (“Compass”) (ACTRN12613001207707 and NCT02328872), which is conducted and funded by the Australian Centre for the Prevention of Cervical Cancer, a government-funded health promotion charity. The ACPCC has received equipment and a funding contribution for the Compass trial from Roche Molecular Systems and operational support from the Australian Government. However, neither MC nor his institution on his behalf (the Daffodil Centre, a joint venture between Cancer Council NSW and The University of Sydney) receive direct or indirect funding from industry for Compass Australia. These disclosures do not constitute a conflict of interest for the present study and so the authors declare no potential conflicts of interest with respect to the research, authorship, and/or publication of this article. The authors disclosed receipt of the following financial support for the research, authorship, and/or publication of this article: This work was performed to support the 2023 review and update of the Population Screening chapter of the Clinical Practice Guidelines for the Prevention, Early Detection and Management of Colorectal Cancer, which were auspiced by Cancer Council Australia and the Department of Health and Aged Care, Australian Government. KC and JBL report grant funding from the National Health and Medical Research Council of Australia (APP1194679 and APP1194784, respectively). JS is a recipient of a Cancer Institute NSW Career Development Fellowship (2022/CDF1154). These funding agreements ensured the authors’ independence in designing the study, interpreting the data, writing, and publishing the report.
Ethical Considerations
Not applicable; no human or animal subjects.
Consent to Participate
Not applicable; no human or animal subjects, no patient data.
Consent for Publication
Not applicable; no human or animal subjects, no patient data.
ORCID iDs
Data Availability
Deidentified data, model outputs, and data analytic code may be available upon reasonable request to the corresponding author.
References
Supplementary Material
Please find the following supplemental material available below.
For Open Access articles published under a Creative Commons License, all supplemental material carries the same license as the article it is associated with.
For non-Open Access articles published, all supplemental material carries a non-exclusive license, and permission requests for re-use of supplemental material or any part of supplemental material shall be sent directly to the copyright owner as specified in the copyright notice associated with the article.