
Abstract
The net value of reducing decision uncertainty through collecting additional data is quantified by the expected net benefit of sampling (ENBS). The ENBS is the difference between the population-level expected value of sample information (EVSI) for the data collection exercise and the costs associated with the data collection. ENBS calculations for studies that collect survival data are complicated by the need to take into account censoring, and this has limited the application of value-of-information analysis in this setting. In this tutorial article, we present a general-purpose algorithm for calculating the ENBS for a study that collects survival data along with a step-by-step implementation in R. The algorithm is based on recently published methods for simulating survival data and computing EVSI that do not rely on the survival data being from a distribution with any particular parametric form and that can take into account any arbitrary censoring process. We illustrate the method using a real-life case study drawn from an appraisal of pembrolizumab plus axitinib for treating advanced renal cell carcinoma in which the initial decision was informed by immature survival data.
Highlights
The net value of reducing decision uncertainty by collecting additional data is quantified by the expected net benefit of sampling (ENBS). This tutorial presents a general-purpose algorithm for computing the ENBS for collecting survival data along with a step-by-step implementation in R.
The algorithm is based on recently published methods for simulating survival data and computing expected value of sample information that do not rely on the survival data to follow any particular parametric distribution and that can take into account any arbitrary censoring process.
We demonstrate in a case study based on a previous cancer technology appraisal that ENBS calculations are useful not only for designing new studies but also for optimizing reimbursement decisions for new health technologies based on immature evidence from ongoing trials.
Keywords
Introduction
In many countries, 1 health technology assessment (HTA) is used to prioritize the allocation of health care resources. An important component of HTA is health economic evaluation, in which alternative technologies are compared in terms of expected costs and health benefits. Technologies that aim to improve survival require accurate estimates of life expectancy across the relevant patient population. Yet, HTAs are often informed by immature survival data from ongoing trials, in which the clinical event of interest, death, has occurred in only a small proportion of trial participants, particularly for new cancer treatments. 2 This is a key concern for decision makers who are responsible for deciding on the adoption of new health technologies, such as the National Institute for Health and Care Excellence (NICE) in the United Kingdom. 3 Between 2011 and 2022, NICE conducted 229 technology appraisals (TAs) of new cancer drugs, of which 158 (69%) relied on immature survival data where death had occurred in less than 50% of the trial participants. 4 In 85 (37%) cancer TAs, extremely immature survival data with less than 20% of observed death events was used. This can partly be attributed to the introduction of regulatory mechanisms aimed at accelerating assessments and conditional licensing of new pharmaceuticals by the European Medicines Agency5,6 and the US Food and Drug Administration 7 in the last decades.
Estimating long-term survival from immature trial data requires a high degree of extrapolation beyond the observed trial period, necessitating assumptions about disease progression and treatment mechanisms that have not yet been observed. Thus, significant uncertainty about a technology’s long-term effectiveness and cost-effectiveness can remain. This uncertainty increases the risk of recommending a cost-ineffective technology that reduces population net health benefits, by diverting limited resources from more effective interventions and/or by providing patients with an inferior treatment option. Therefore, there may be value in reducing uncertainty by extending an ongoing trial’s follow-up and collecting additional data before making an adoption decision. This is particularly important when decision reversal is expected to be difficult or costly, as past experiences with conditional approval suggest,8–11 or when early access to a new technology reduces the probability that additional data will be collected. 12 In this context, there will be a tradeoff between granting early access to a new technology that may turn out to reduce net health benefits and waiting for uncertainty to be reduced through ongoing data collection with a potential loss of health benefits while waiting.13,14
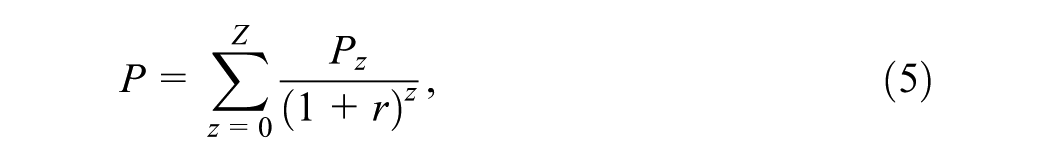
This tradeoff can be quantified by computing the expected value of sample information (EVSI), which measures the expected value to the decision maker of collecting additional data. 15 EVSI measures the value of collecting additional data by simulating plausible datasets before the actual data collection takes place and then computing the expected costs and health benefits of alternative technologies given both the simulated data and existing evidence. The expected net benefit of sampling (ENBS) is the expected net value of the proposed data collection and can be calculated by subtracting the data collection costs, as well as potential health opportunity costs if approval is withheld while additional data are being collected, from the population EVSI. 16
Recently, Vervaart et al. 17 developed efficient general-purpose methods for simulating survival data and for computing the EVSI for collecting survival data from an ongoing trial, 14 accounting for structural uncertainty about the choice of survival model for extrapolation. There is, however, a lack of clear guidance and practical software for applying ENBS calculations to real-world decision making informed by immature survival data. ENBS calculations for survival data are complicated by the need to take into account censoring, which occurs when the event of interest is not observed for all study participants due to limited follow-up and trial dropout.
In this tutorial, we focus on describing the practical implementation of these efficient EVSI methods and how they can be used to standardize ENBS calculations for collecting additional survival data, using a recent cancer TA by NICE that was informed by immature survival data from an ongoing trial. We provide a step-by-step implementation using
The tutorial is structured as follows. In the second section, we present methods and a general-purpose algorithm for computing the ENBS for collecting additional survival data and introduce
Method
Decision Model
Cost-effectiveness models are commonly used to compare

Survival Data
Uncertainty is an inherent aspect of assessing the cost-effectiveness of health technologies, which often arises due to limitations in the available data. This is particularly pronounced for survival data, which are commonly used to inform key decision drivers such as life expectancy and time to disease progression. Survival data describe the time from some well-defined origin, such as treatment initiation, until the occurrence of some particular event or endpoint, such as death or disease progression. 23 Survival data are often censored due to administrative censoring, which happens when the follow-up time is not sufficient to observe the event of interest for all individuals. Individuals may also be lost to follow-up and drop out of the study due to various reasons, such as relocating to another country or withdrawing consent, leading to another type of censoring known as loss to follow-up. Parametric survival models are therefore often used to extrapolate censored survival data beyond the observed period, typically over the remaining lifetime. To achieve robust extrapolations that accurately predict long-term survival outcomes, it is crucial to have sufficient follow-up data.24,25 Yet, survival extrapolations are often informed by immature survival data from trials that are still ongoing, particularly for new cancer drugs.2,26 The immaturity of the trial data directly corresponds to the level of uncertainty not only in the survival extrapolation but also, consequently, in the cost-effectiveness estimates.24,26 Uncertainty stemming from immature survival data can therefore result in a greater risk of recommending a cost-ineffective technology that reduces population net health benefits.
The expected value of eliminating uncertainty about the survival parameters can be quantified by computing the expected value of partial perfect information (EVPPI).
27
However, obtaining perfect information is rarely possible. Instead, we may reduce uncertainty about the survival parameters by delaying a decision to approve or reject a new health technology from current time
Expected Value of Sample Information
At the point of decision making,
The EVSI of extending the follow-up from current time

where the first term is the expected net benefit of a decision made with new data,
Computing EVSI for Survival Data
To compute the EVSI, we need to perform three main steps:
Sample from the joint distribution of the model parameters and compute the expected net benefits given current information in a PA.
Simulate new study datasets conditional on the PA sample.
Compute the posterior expected net benefits given both the simulated datasets and current information.
Probabilistic analysis
To compute the expected net benefits given current information, we first sample
The total costs
Simulating survival datasets
Vervaart et al.
17
proposed 2 general-purpose methods, a discrete sampling method and an interpolated inverse transform sampling (ITS) method, for simulating survival data
It is important to account for both administrative censoring and censoring due to loss to follow-up when simulating survival times. We can apply administrative censoring by specifying the time at which the study ends or the next interim analysis takes place and then taking the minimum of the simulated survival times and the time point at which administrative censoring will take place. The probability of being lost to follow-up can be modeled using an independent parametric survival model if loss to follow-up is assumed to be independent of the event of interest or a joint model if there is dependency between censored and observed events. We record the survival time corresponding to the earliest occurrence of the 3 possible events: the event time, the administrative censoring time, and the censoring time due to loss to follow-up. We also define a censoring indicator to denote whether the recorded survival time corresponds to an observed event or a censoring event.
Mathematically, a single simulated dataset,
Computing posterior net benefits
A practical choice for computing the posterior net benefits conditional on the simulated datasets is a fast nonparametric regression-based method, 14 which does not require a parametric distribution for the simulated data. The nonparametric regression-based method estimates the posterior net benefits by regressing the net benefits on a summary statistic of the simulated datasets.
The regression-based method works as follows. First, for each treatment option

where
We then extract the regression model–fitted values

Population-level EVSI
To establish the population-level EVSI, an assessment of the number of current and future patients who may benefit from additional data collection over the decision relevance horizon is required.
34
The total beneficiary population,
We can compute the total beneficiary population as
where
While a positive population-level EVSI quantifies the expected value of the new data, we also need to consider the costs of collecting the data to determine whether additional data collection is worthwhile.
Expected net benefit of sampling
The ENBS quantifies the expected net value of additional data collection. 37 The ENBS is the difference between the population-level EVSI for collecting new data and the expected cost of continuing an ongoing study and/or conducting a new study and any potential health benefits that may be foregone if approval is withheld. A positive ENBS indicates that it is worthwhile to continue or conduct the study and collect more data before making an adoption decision.
Costs of data collection
The costs of conducting a new study include fixed costs that remain constant regardless of the sample size or length of follow-up, such as protocol development, approvals, site setup, database development costs, and analysis costs. In addition, variable trial costs, such as recruitment, follow-up, site and database management, and analysis costs, can depend on both the sample size and the length of follow-up. 38 Costs of continuing an ongoing study primarily consist of variable costs, as fixed trial costs have already been incurred. Study costs are often specified as research costs in funding applications and can be defined in collaboration with study experts. 35
In determining relevant costs, it is important to consider the perspective of the decision maker. For instance, the costs of completing an ongoing study for a new technology have already been committed by the manufacturer and are not borne by society. If patient access to a new treatment is delayed until the data have been collected, there is an opportunity cost to society in terms of potential forgone health benefits that could have been avoided by providing a cost-effective treatment during the data collection period. This opportunity cost can be quantified as the expected INB generated by the new treatment compared with standard care.
Decision options for additional data collection
There are 2 decision options when additional data collection is considered, in addition to approving or rejecting a new technology: approval with research (AWR) or only in research (OIR). AWR refers to approval while additional data are being collected, whereas OIR means a decision to approve or reject is withheld until additional data have been collected. 12 OIR may be more appropriate if there are significant irrecoverable costs, such as high upfront treatment or capital investment costs, that could be avoided if treatment initiation could be delayed until additional data have been collected, such as for chronic diseases, or if the new technology is not expected to improve net health benefits but there is still value in collecting additional data to reduce uncertainty. 39 OIR may also be the only option if the adoption decision is difficult or costly to reverse, including the time and effort required to change clinical guidelines and practice and switch patients over to an alternative treatment or when approval would adversely affect the prospects of further data collection. In these circumstances, there will be opportunity costs in terms of potential net health benefits foregone as patients receive a suboptimal treatment during the data collection period.
A generic algorithm for computing the ENBS for collecting survival data in a new or ongoing study using the previously described general-purpose data-simulation methods 17 and regression-based EVSI method 14 is given in Box 1.
Generic ENBS Algorithm for Collecting Survival Data
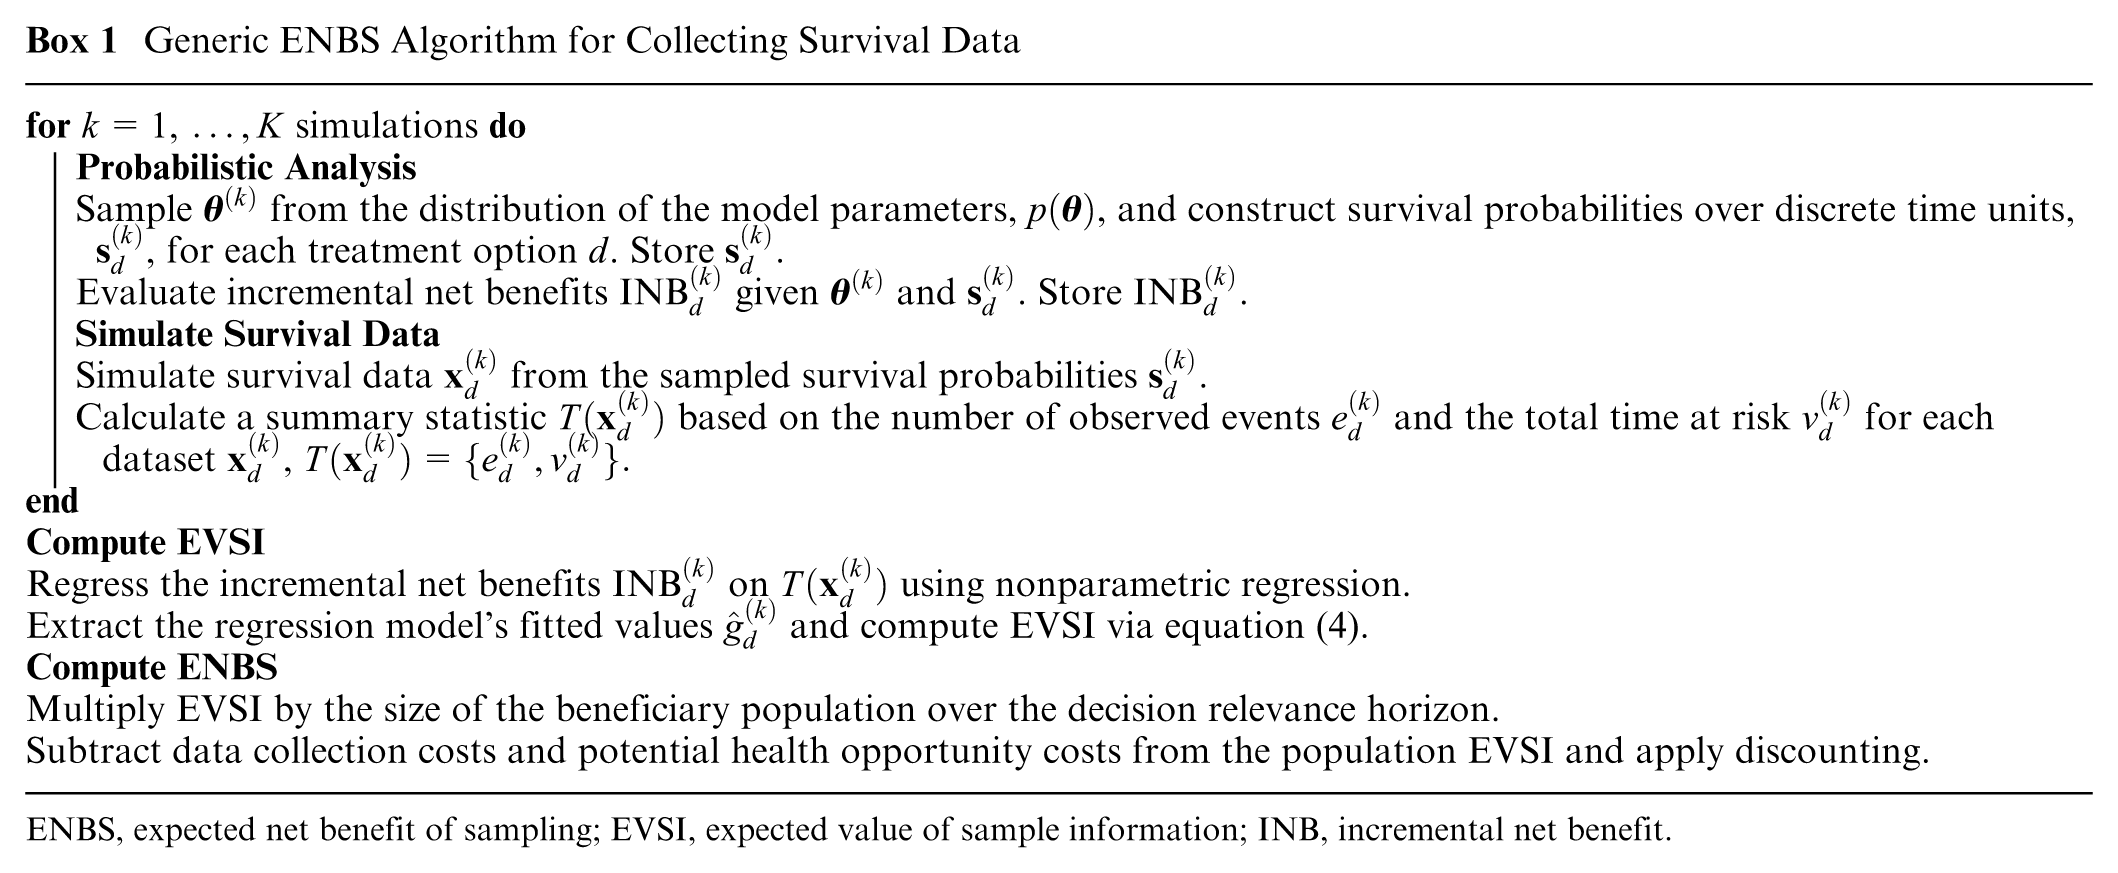
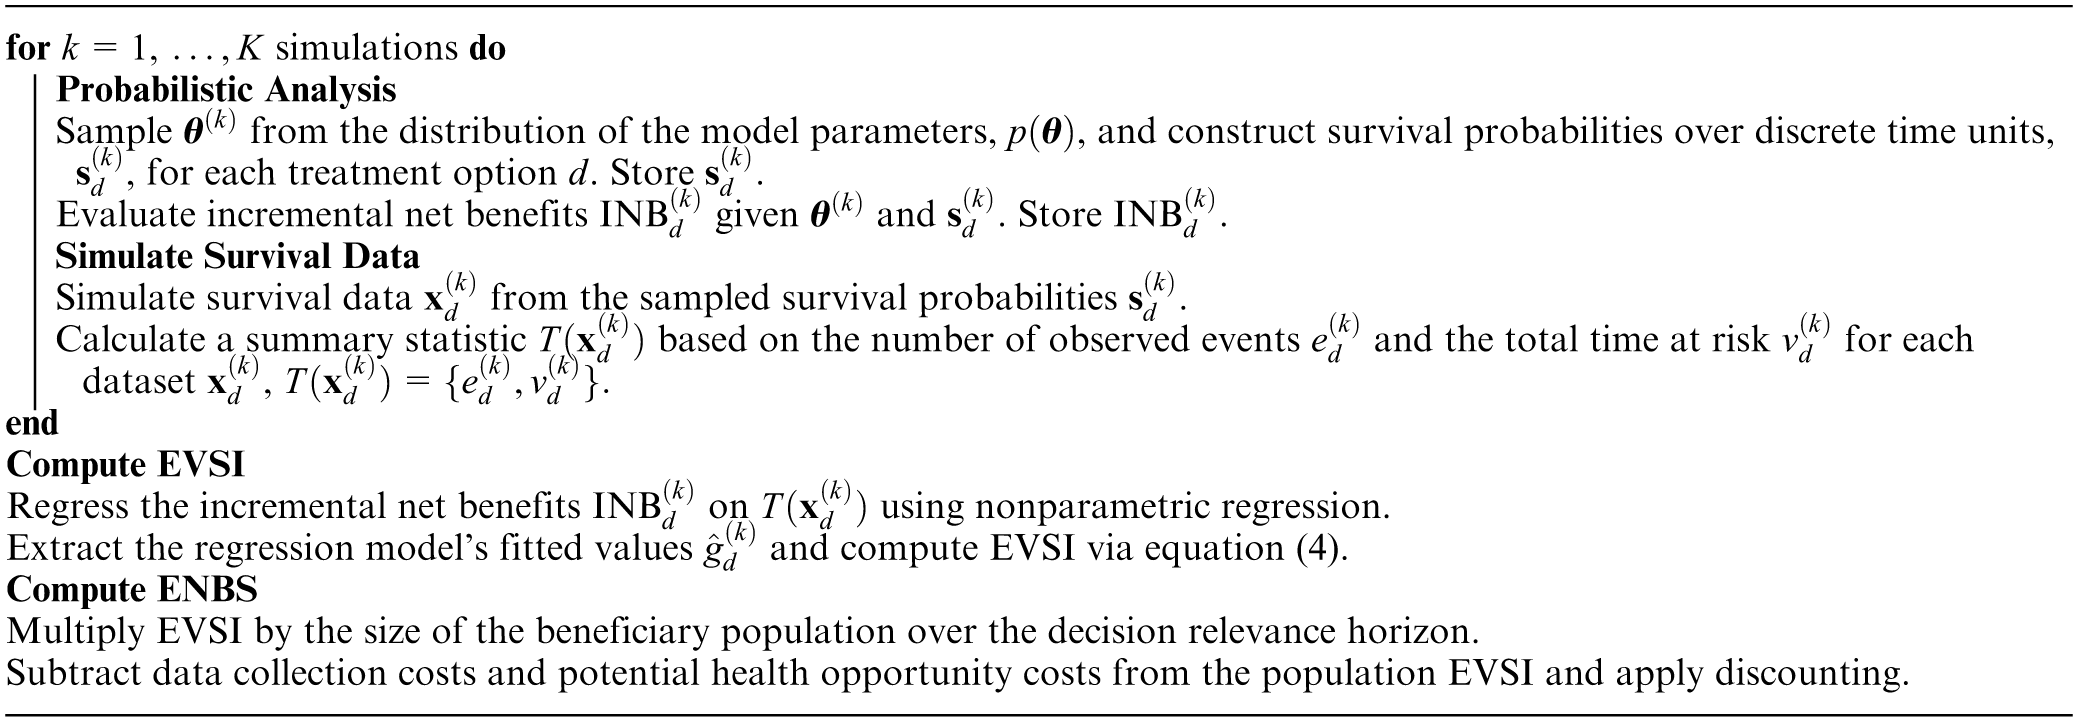
ENBS, expected net benefit of sampling; EVSI, expected value of sample information; INB, incremental net benefit.
Case Study: Pembrolizumab plus Axitinib for Treating Renal Cell Carcinoma
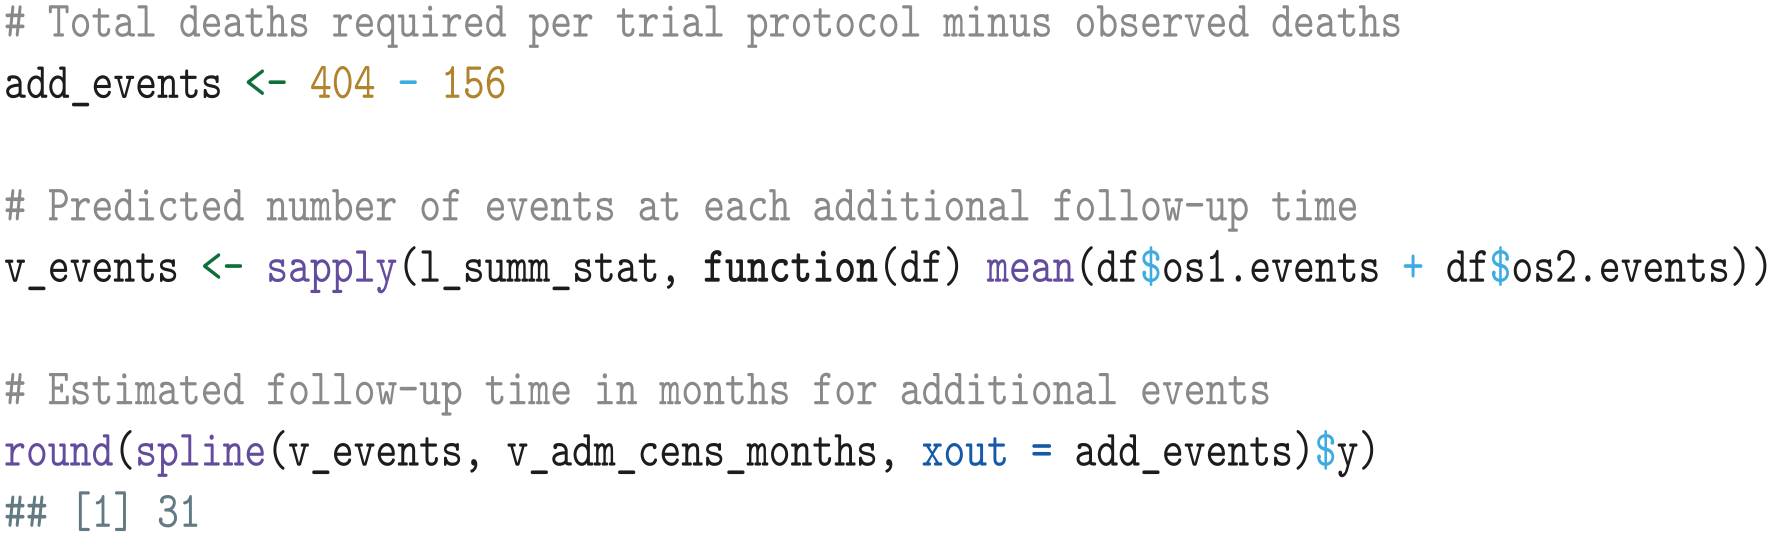
We based our case study on a recent single TA by NICE of pembrolizumab plus axitinib for treating advanced renal cell carcinoma, named TA650. 40 Key clinical evidence in TA650 was obtained in an interim analysis of the KEYNOTE-426 trial, an open-label phase 3 trial comparing pembrolizumab plus axitinib with sunitinib in patients with previously untreated advanced clear-cell renal-cell carcinoma. 41 Overall survival (OS) data were immature at the time of the appraisal, as only 156 (18%) of 861 enrolled patients had died during a median follow-up of 12.8 mo. According to the trial protocol, follow-up for OS would continue until 404 (47%) deaths had been observed, after which the study would be concluded. 42
Health Economic Model
We reconstructed the cost-effectiveness model that was used in TA650 using publicly available information from the NICE committee papers.
40
The model was based on a partitioned survival model (PSM) structure with 3 health states: progression free, progressive disease, and death. We used the algorithm by Liu et al.
43
to reconstruct individual patient data (IPD) for OS and progression-free survival (PFS) from published Kaplan-Meier (KM) curves for the KEYNOTE-426 trial.
41
This algorithm uses vector images to extract the coordinates of the KM curves, thereby improving accuracy and minimizing observer variation compared with alternative IPD reconstruction methods that rely on manual digitization.44,45 Plots of the reconstructed KM data can be found in Appendix A, while the
Analysis
The following section features
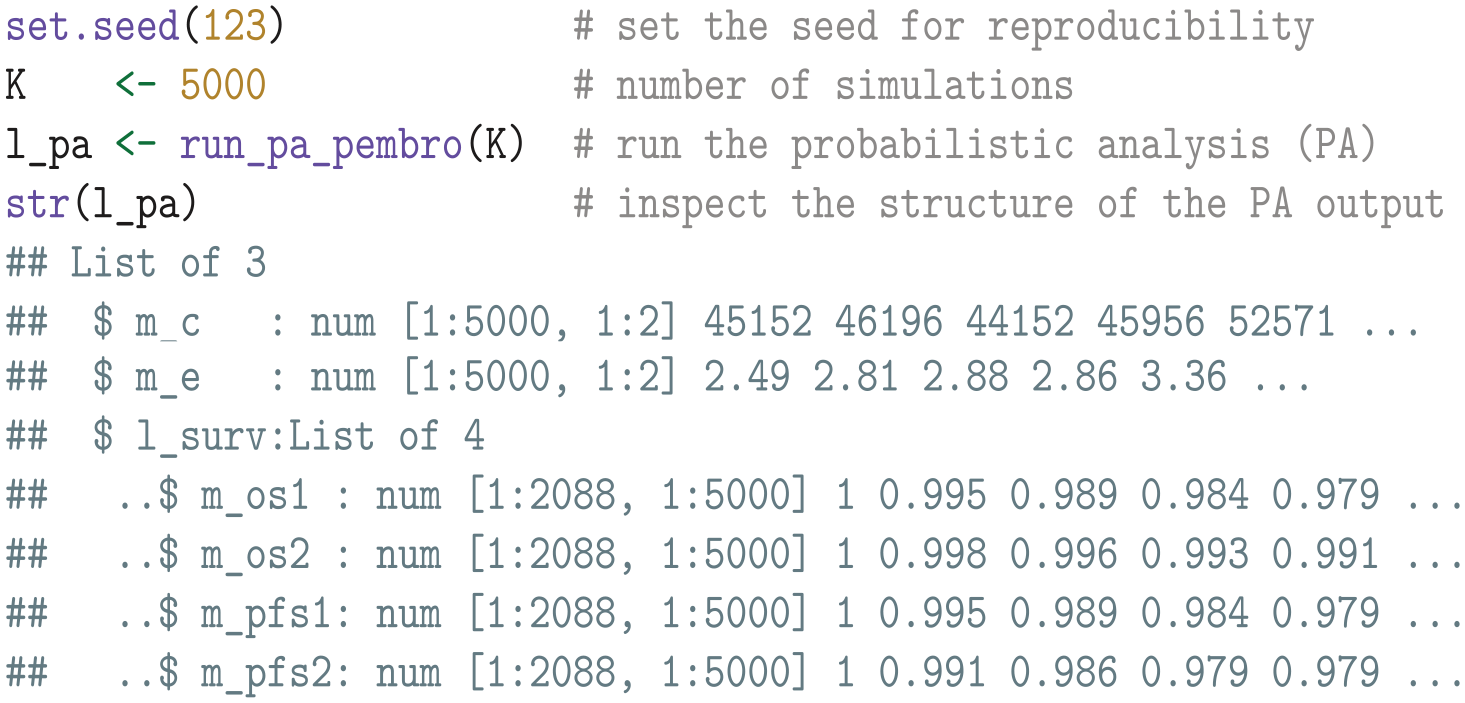
Probabilistic analysis
We begin our analysis by conducting a PA with
A cost-effectiveness scatterplot, as well as a plot of the simulated OS and PFS curves, can be found in Appendix D in the supplemental material. Note that the
Additional instructions for analysts who conduct their cost-effectiveness analysis and PA in Excel are given in the README file of the accompanying GitHub repository.
We then calculate the net health benefits given a willingness-to-pay threshold of £30,000 per QALY gained.

Expected value of partial perfect information
The EVPPI for any set of treatments and survival outcomes can be calculated by regressing the net health benefits on the mean survival estimates using a flexible nonparametric regression model. We perform this computation using the
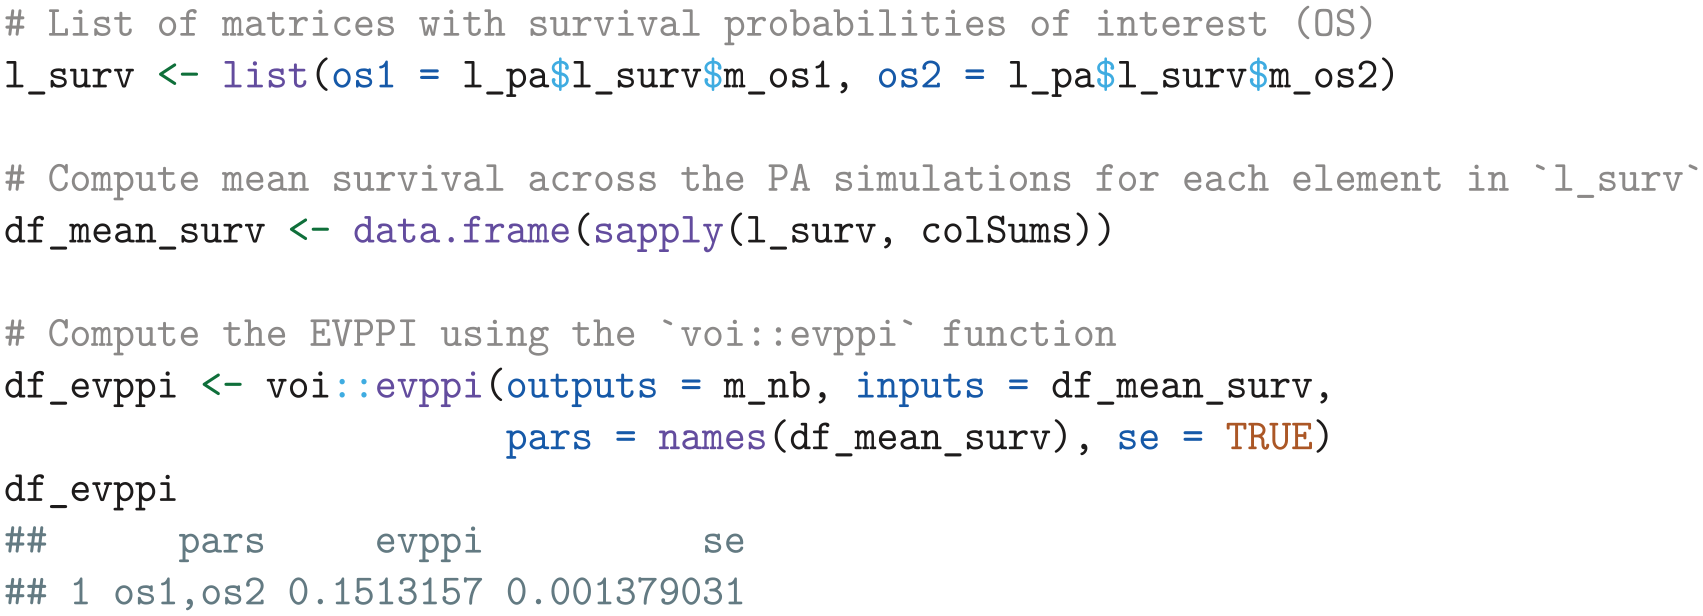
The resulting output
Survival data simulation
Data-simulation settings
To compute the EVSI for additional follow-up for OS in the KEYNOTE-426 trial, we must simulate plausible survival times for patients at risk at current follow-up time
We start by loading the reconstructed IPD containing vectors of survival times (times), event indicators (event), and treatment assignments (treat).
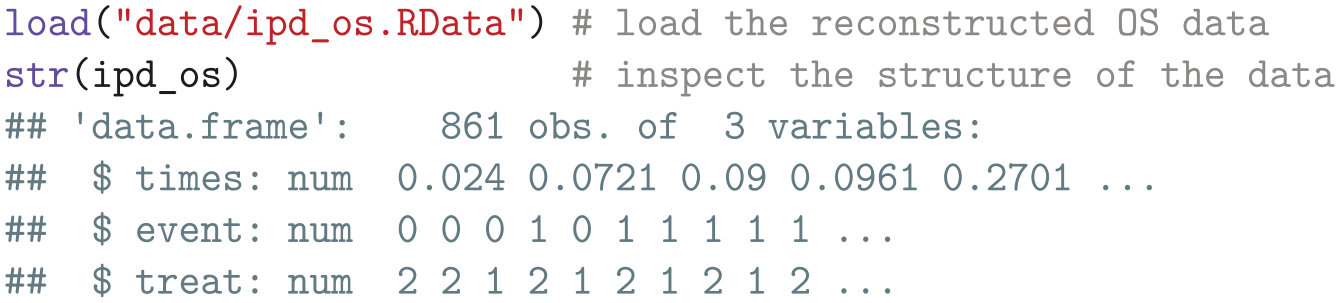
We then subset the reconstructed IPD to identify the censoring times for patients at risk at

However, we have now selected all censoring times, while we require only the administrative censoring times for the patients who are still enrolled in the trial at
If (reconstructed) IPD is unavailable, we can approximate the censoring times for patients at risk in each arm using
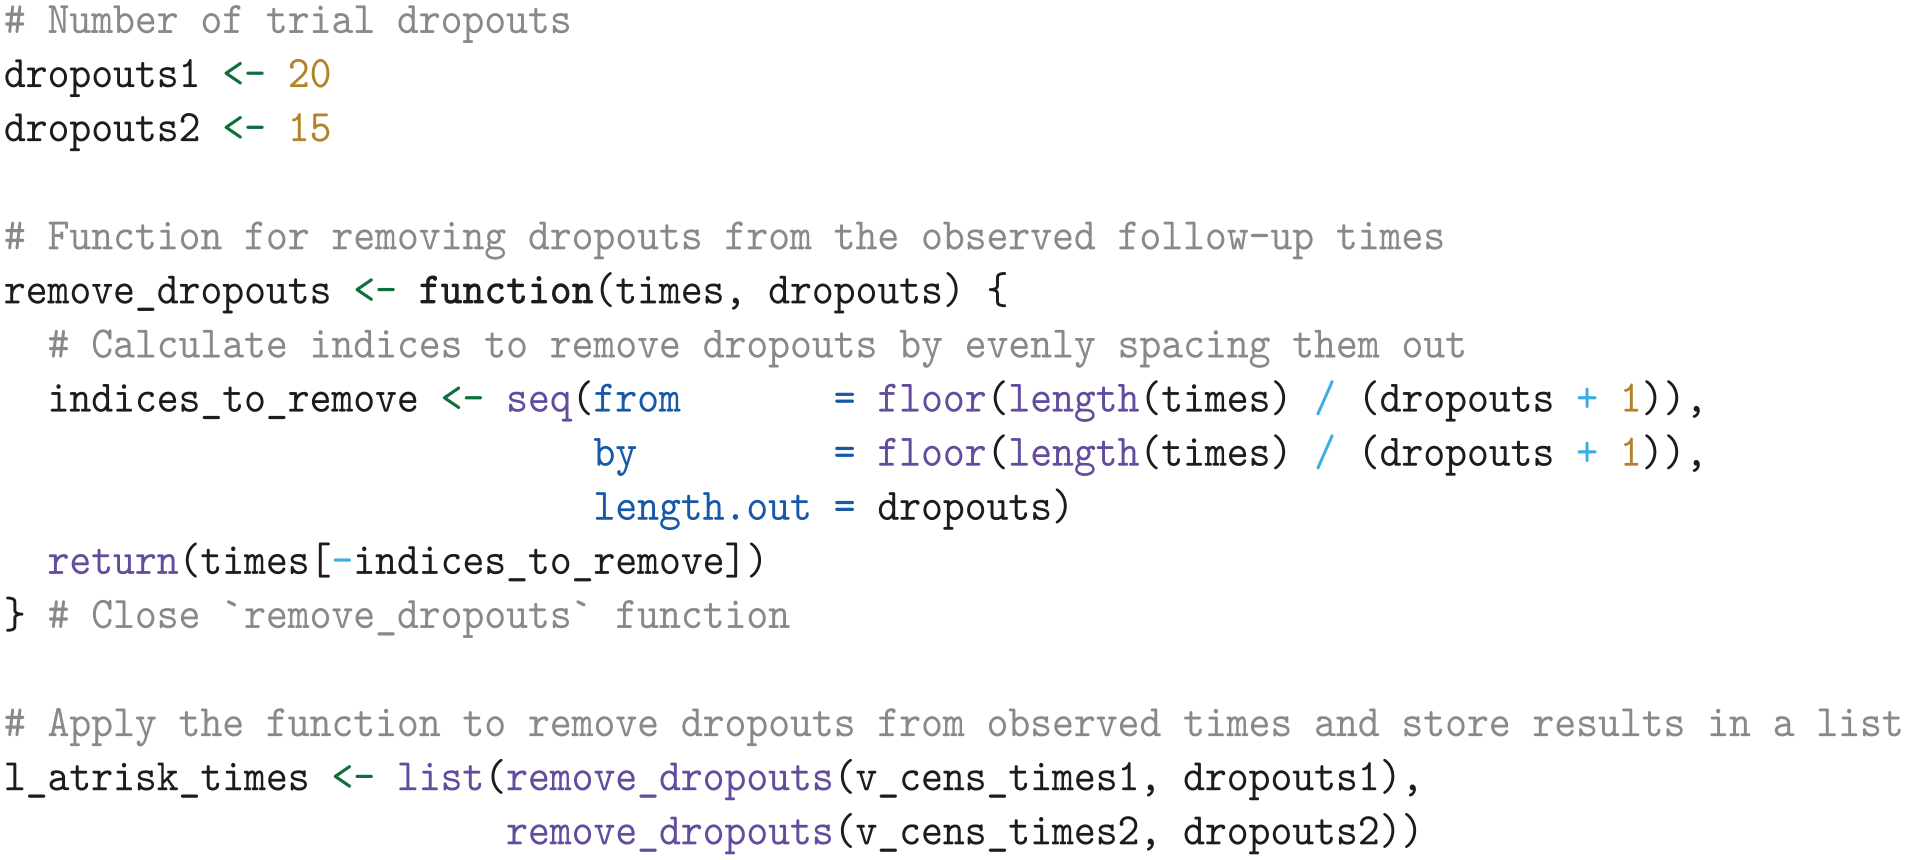
We also need to account for the possibility of future dropouts in the EVSI data-simulation step. To do this, we specify shape and rate parameters for the Gamma distribution of the trial dropout rate, informed by the observed dropouts and total time at risk in months for each treatment arm. These are intended for later use by the data-generation function, where they will be used to sample dropout rates.

If dropout rates are unknown, we can refer to similar studies or assume negligible dropout by setting the shape and rate close to zero and one, for example,
We then define 4 additional administrative censoring times, specified in months and ranging from 3 to 60 mo, evenly spaced on the log scale. These administrative censoring times will be used in the data simulation step and subsequently for calculating and interpolating the EVSI.

Data simulation
Now that we have established the data-simulation settings, we define the function
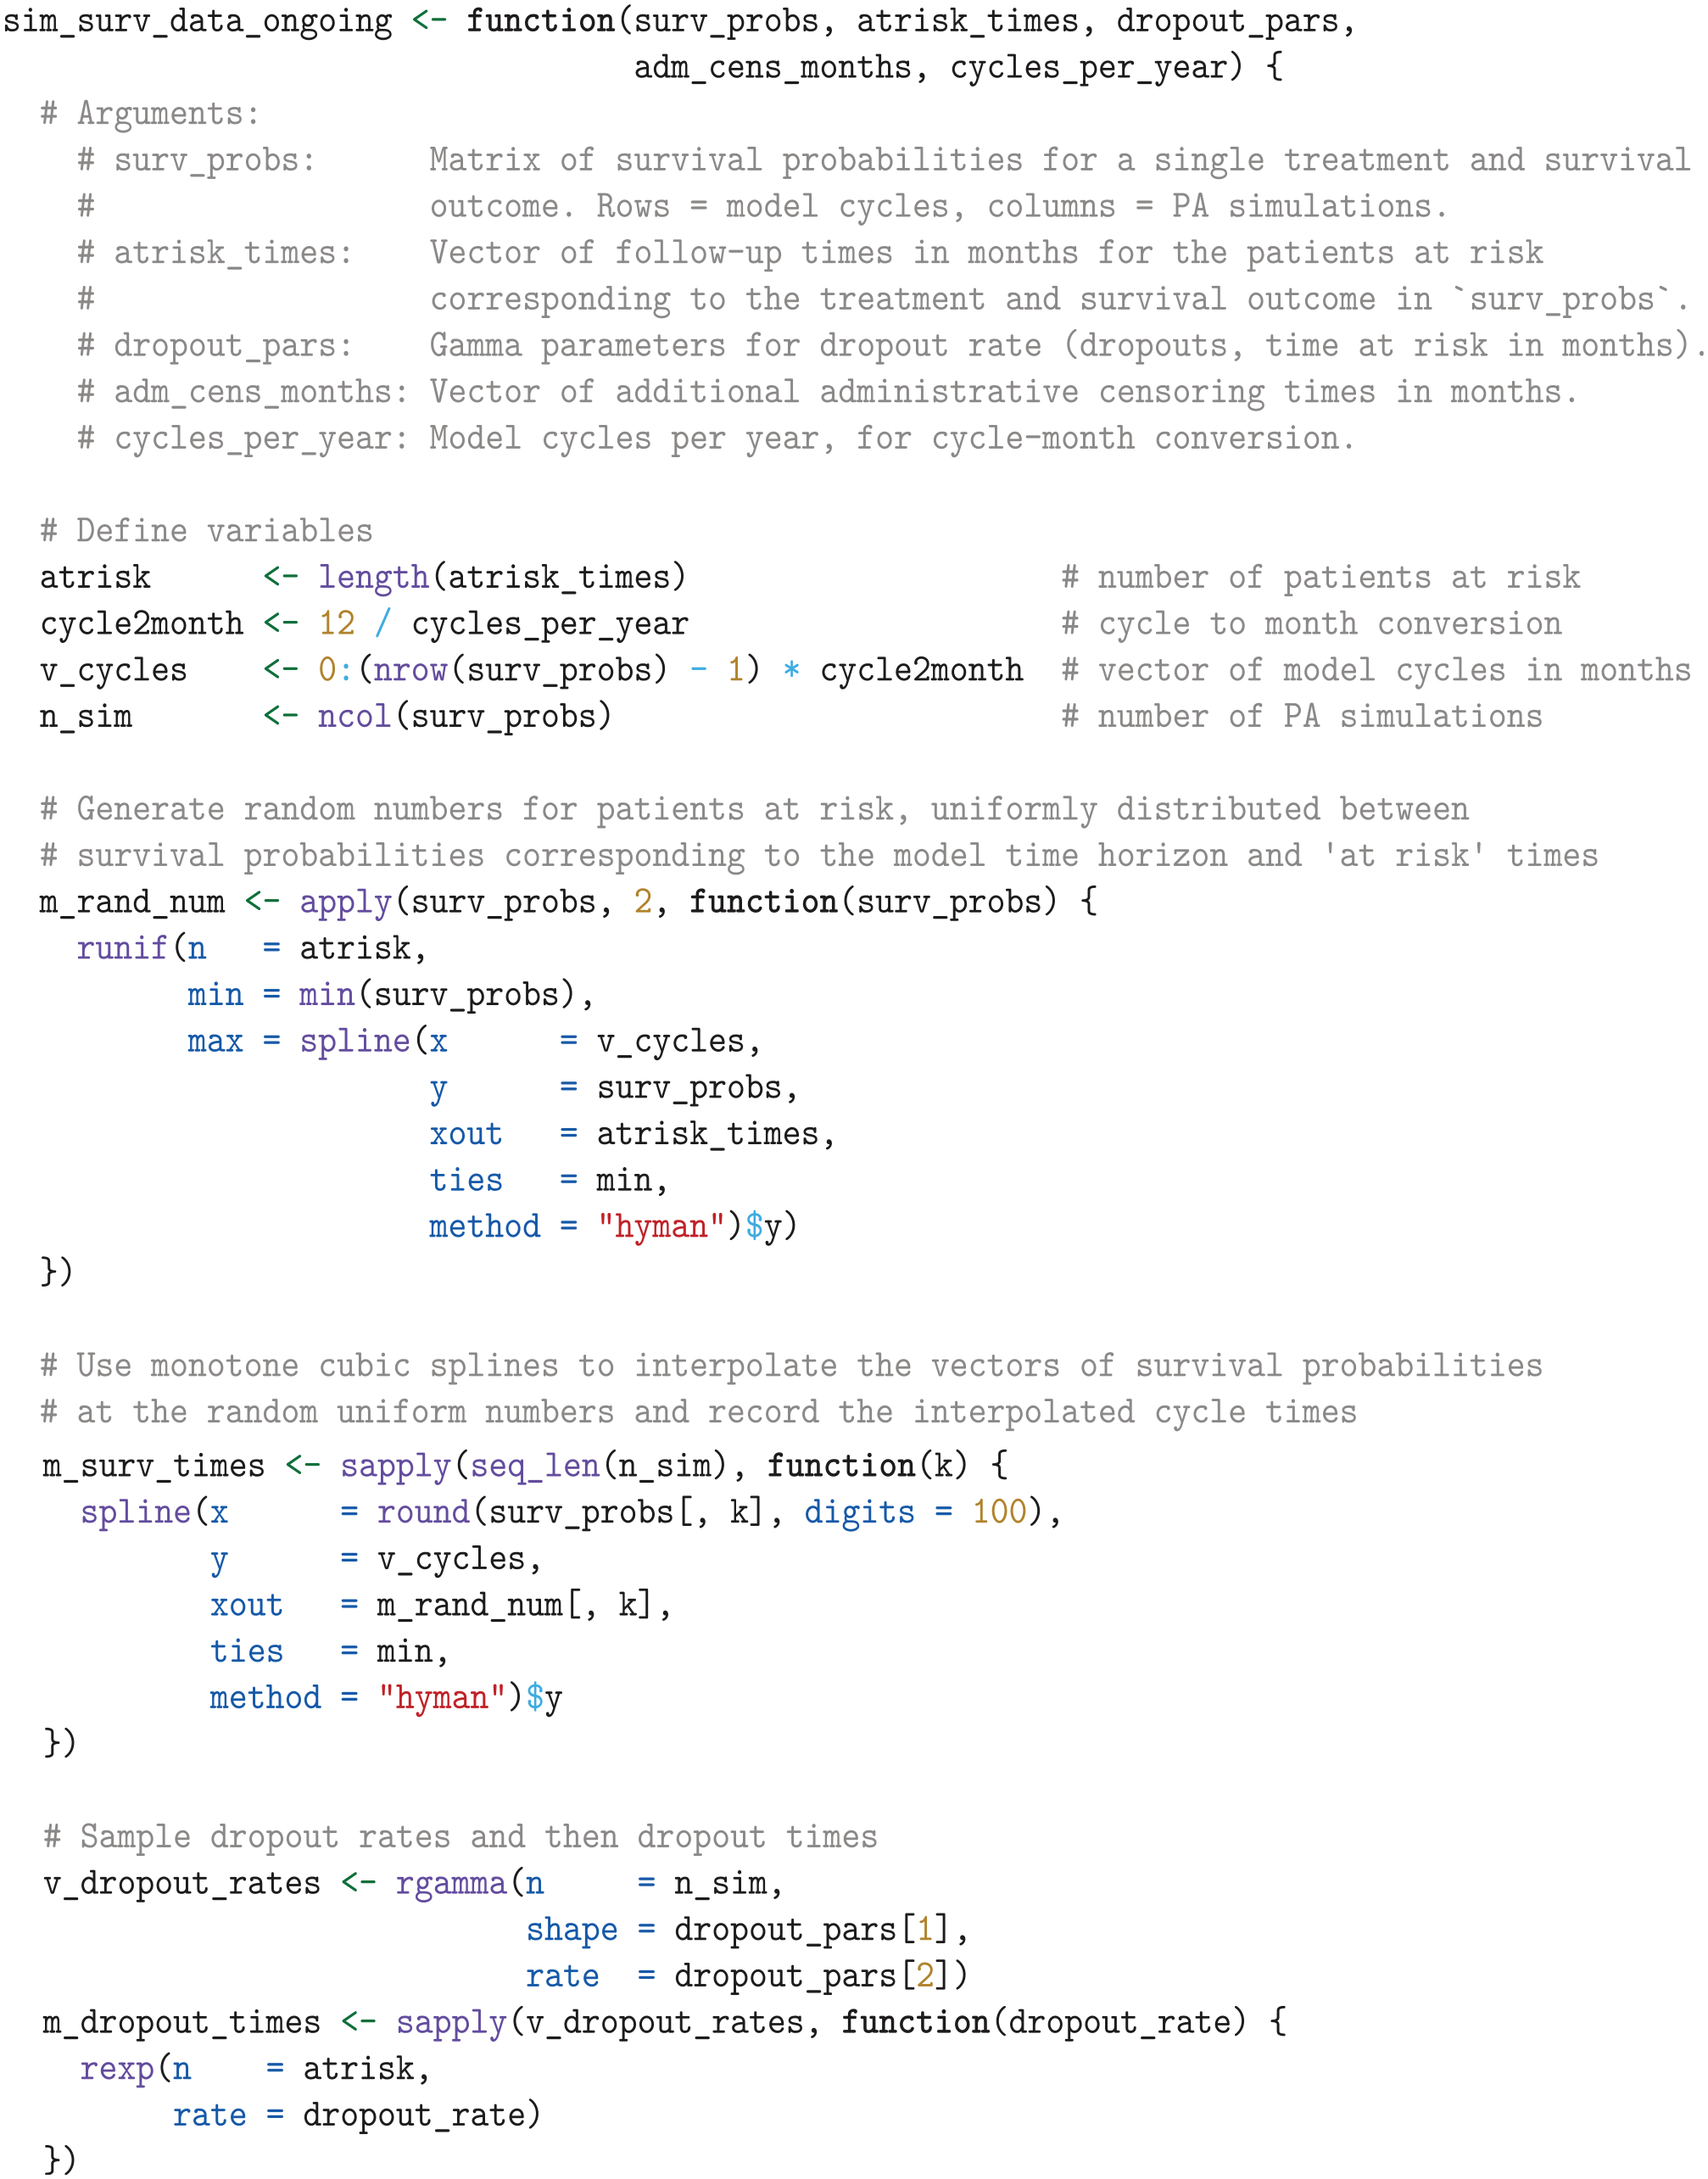
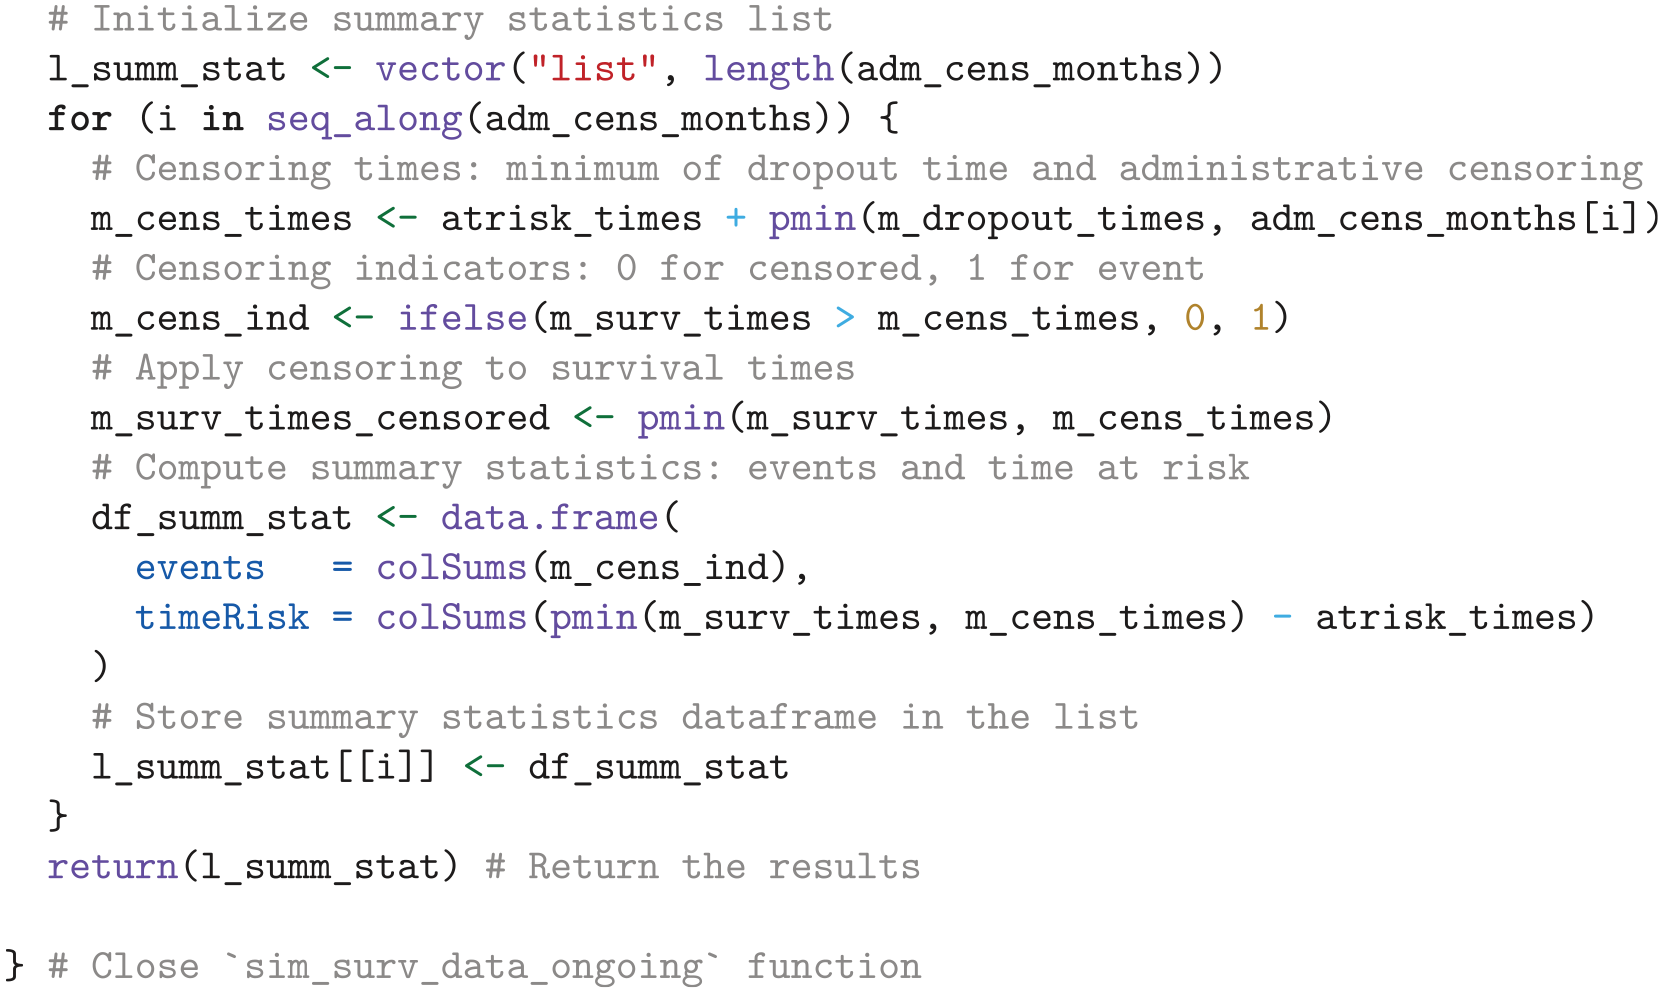
We then use the
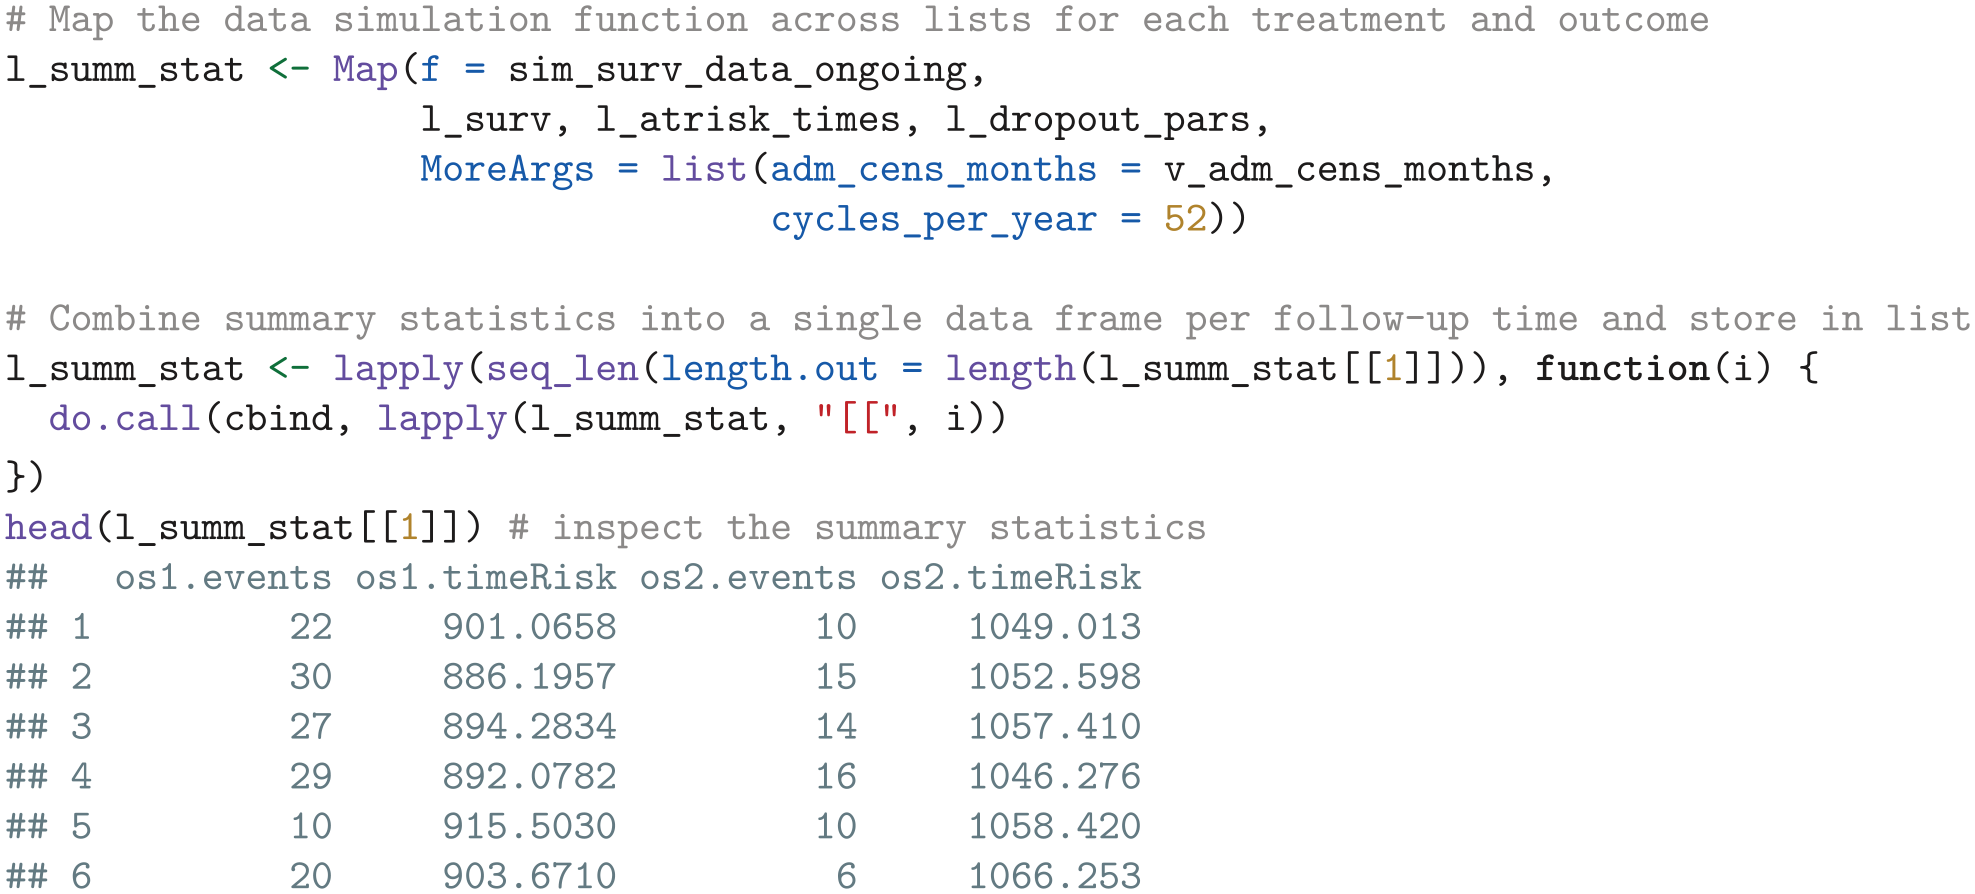
If additional parameters such as costs and quality of life are of interest for the EVSI calculations, define corresponding data-simulation functions to simulate data and calculate appropriate summary statistics. These summary statistics can then be combined with each data frame in the
We estimate the additional follow-up time required to reach the trial protocol’s specified end of follow-up through spline interpolation of the simulated number of events.
In the next step, we use the simulated summary statistics to compute the EVSI.
Expected value of sample information
We can compute the EVSI by regressing the net health benefits on the summary statistics based on the number of observed events and time at risk. To achieve this, we define a function that computes the EVSI using the regression methods in the
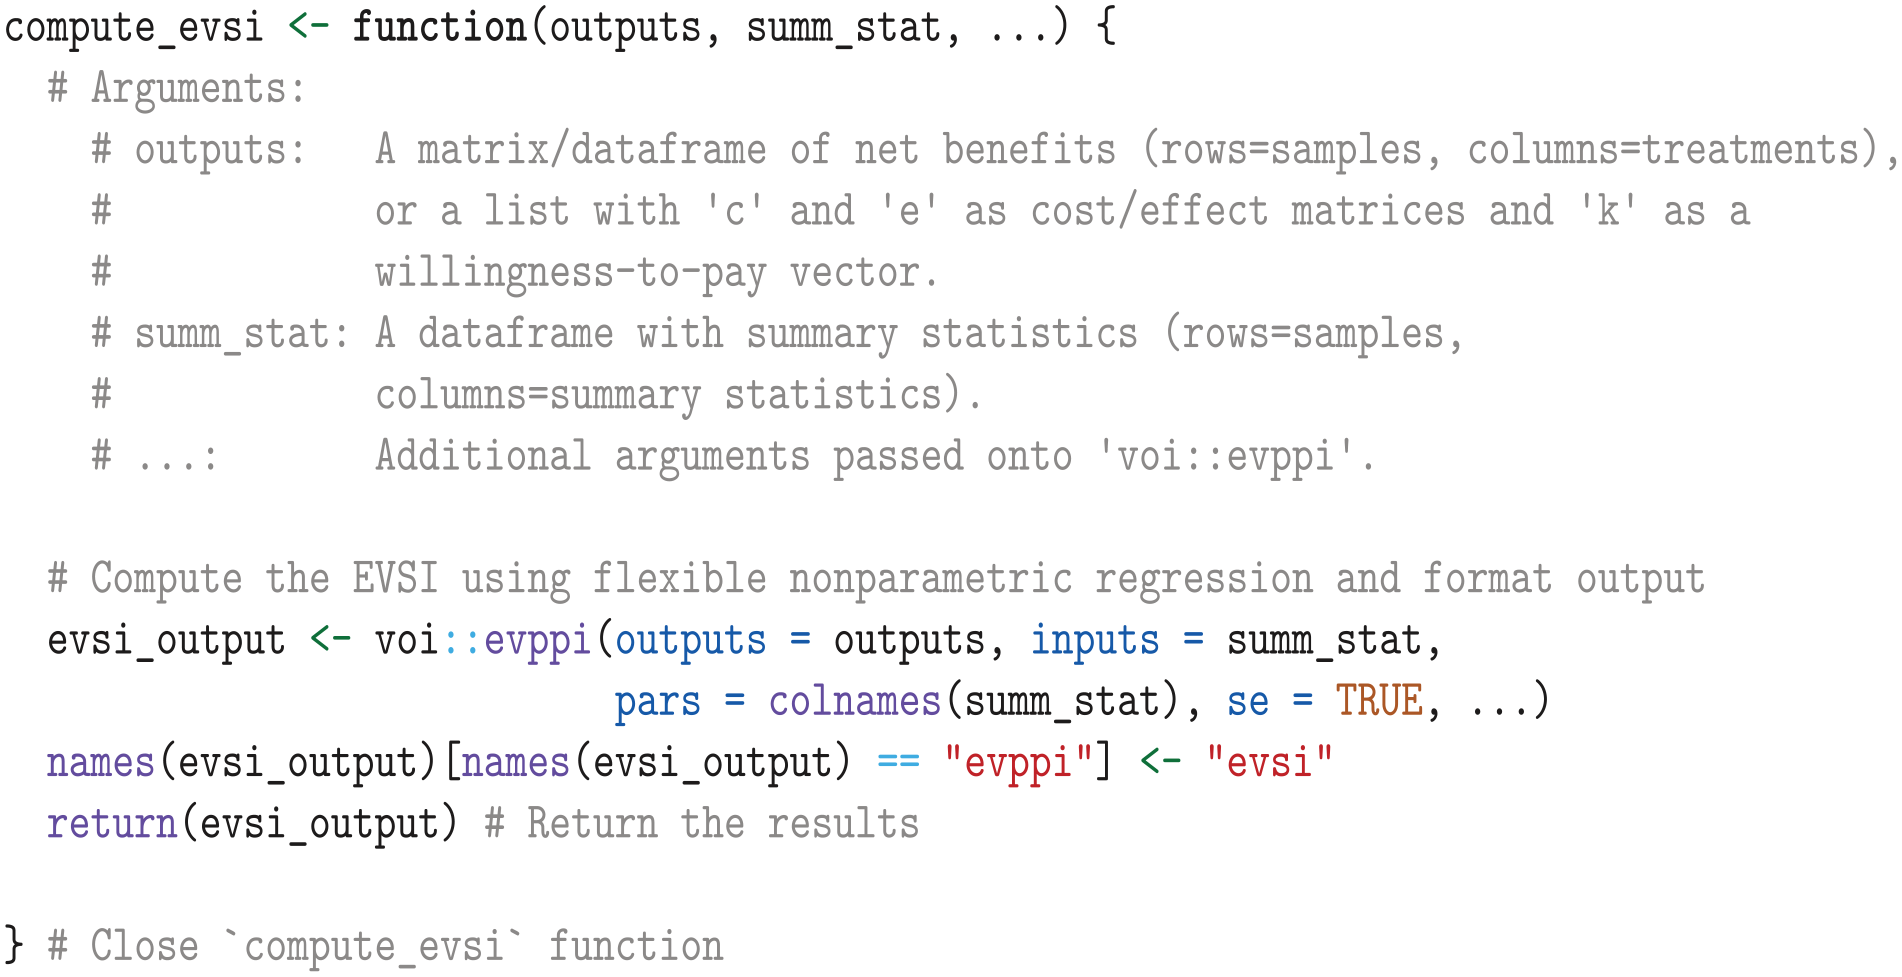
We then apply the
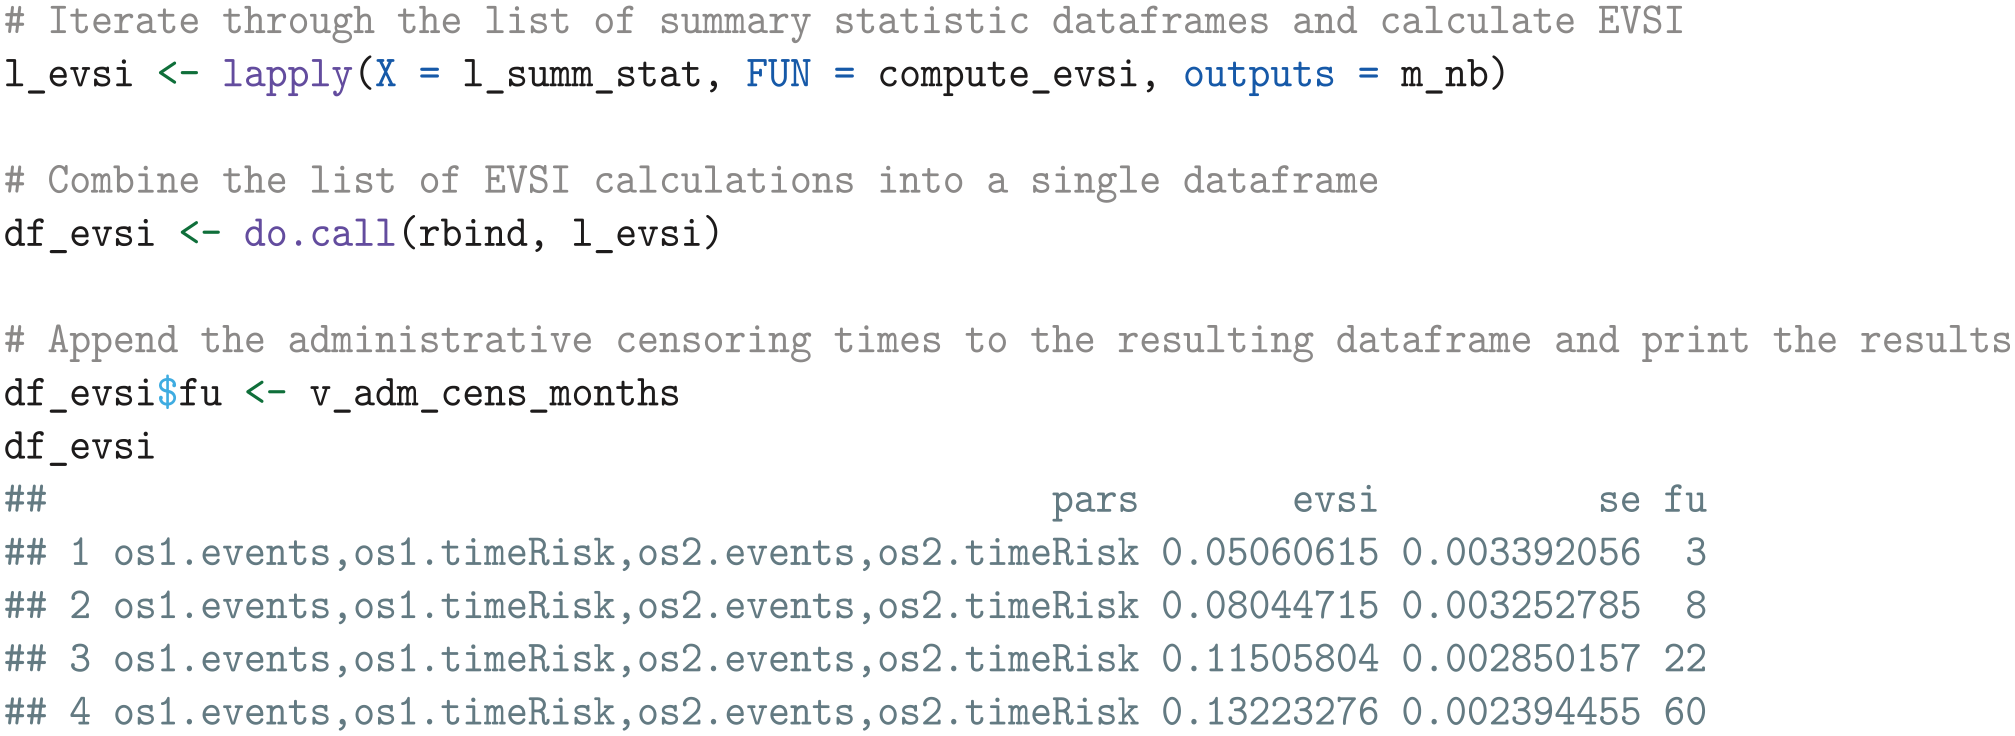
The resulting output
Next, we define a function that interpolates the EVSI estimates and standard errors over monthly increments. For interpolating the EVSI, we use an asymptotic regression model implemented in the
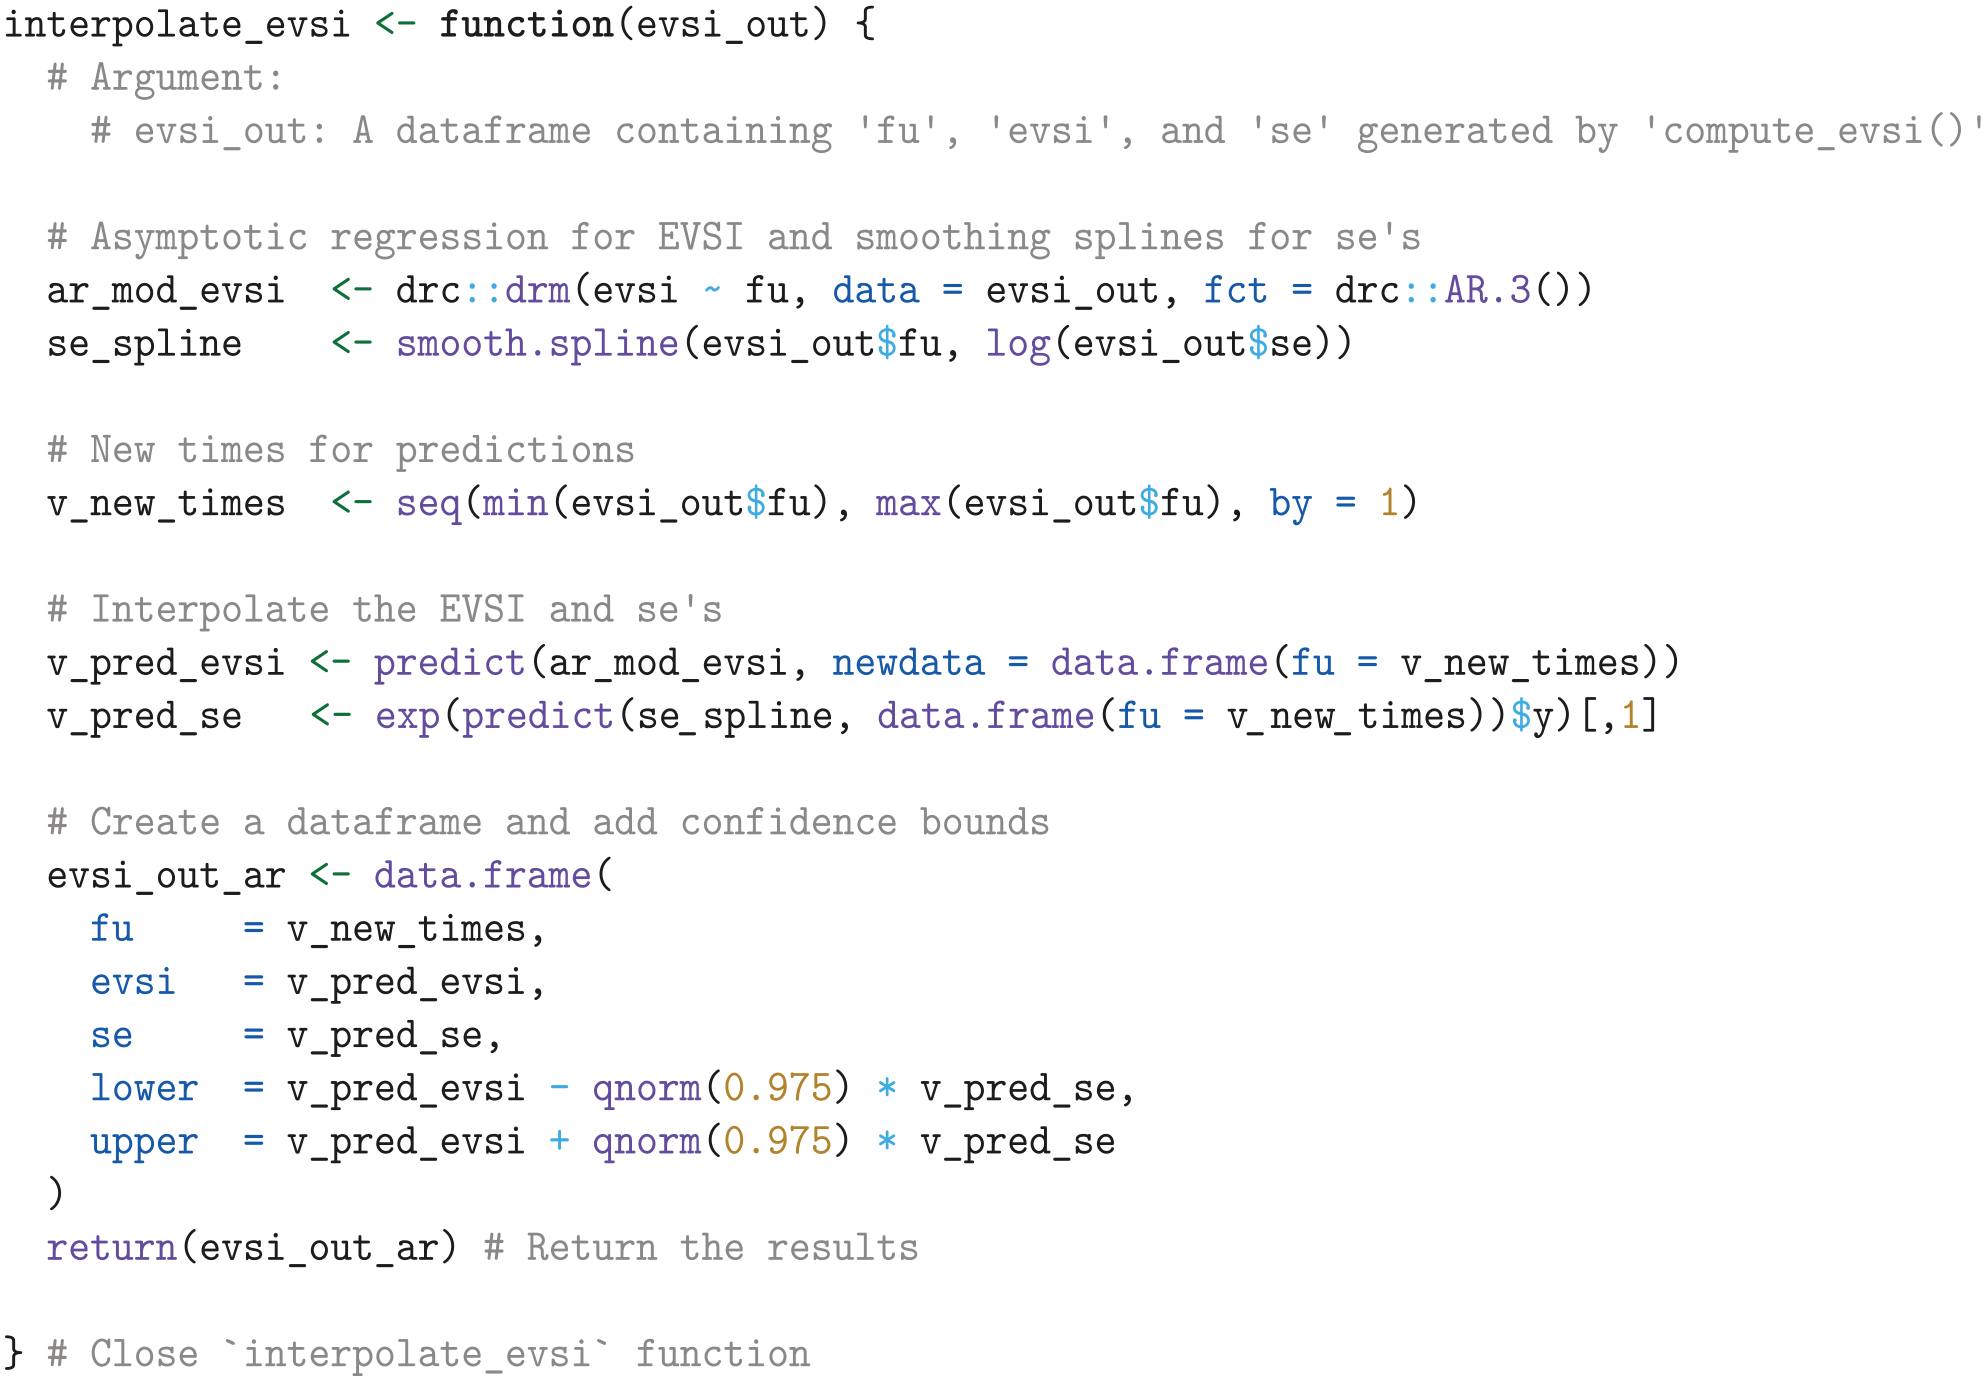
We then apply the
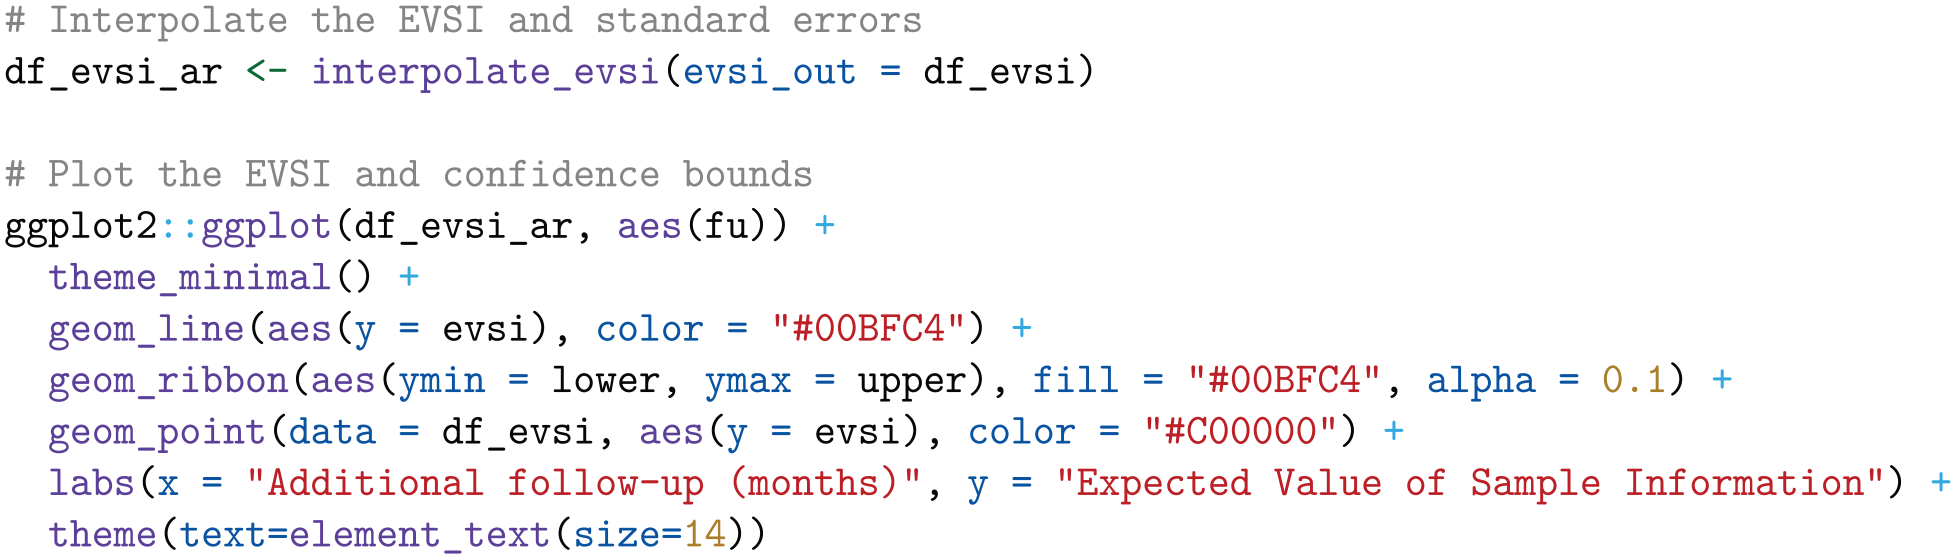
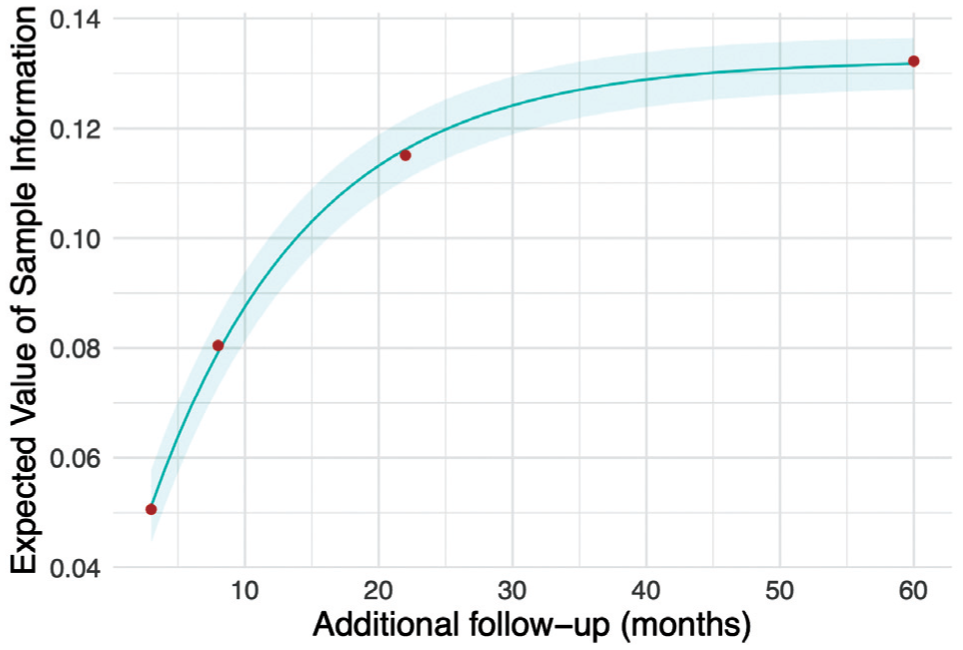
Expected value of sample information for additional follow-up for overall survival in KEYNOTE-426, starting from the point of the first interim analysis.
Expected net benefit of sampling
To compute the ENBS for AWR and OIR, we define a function named
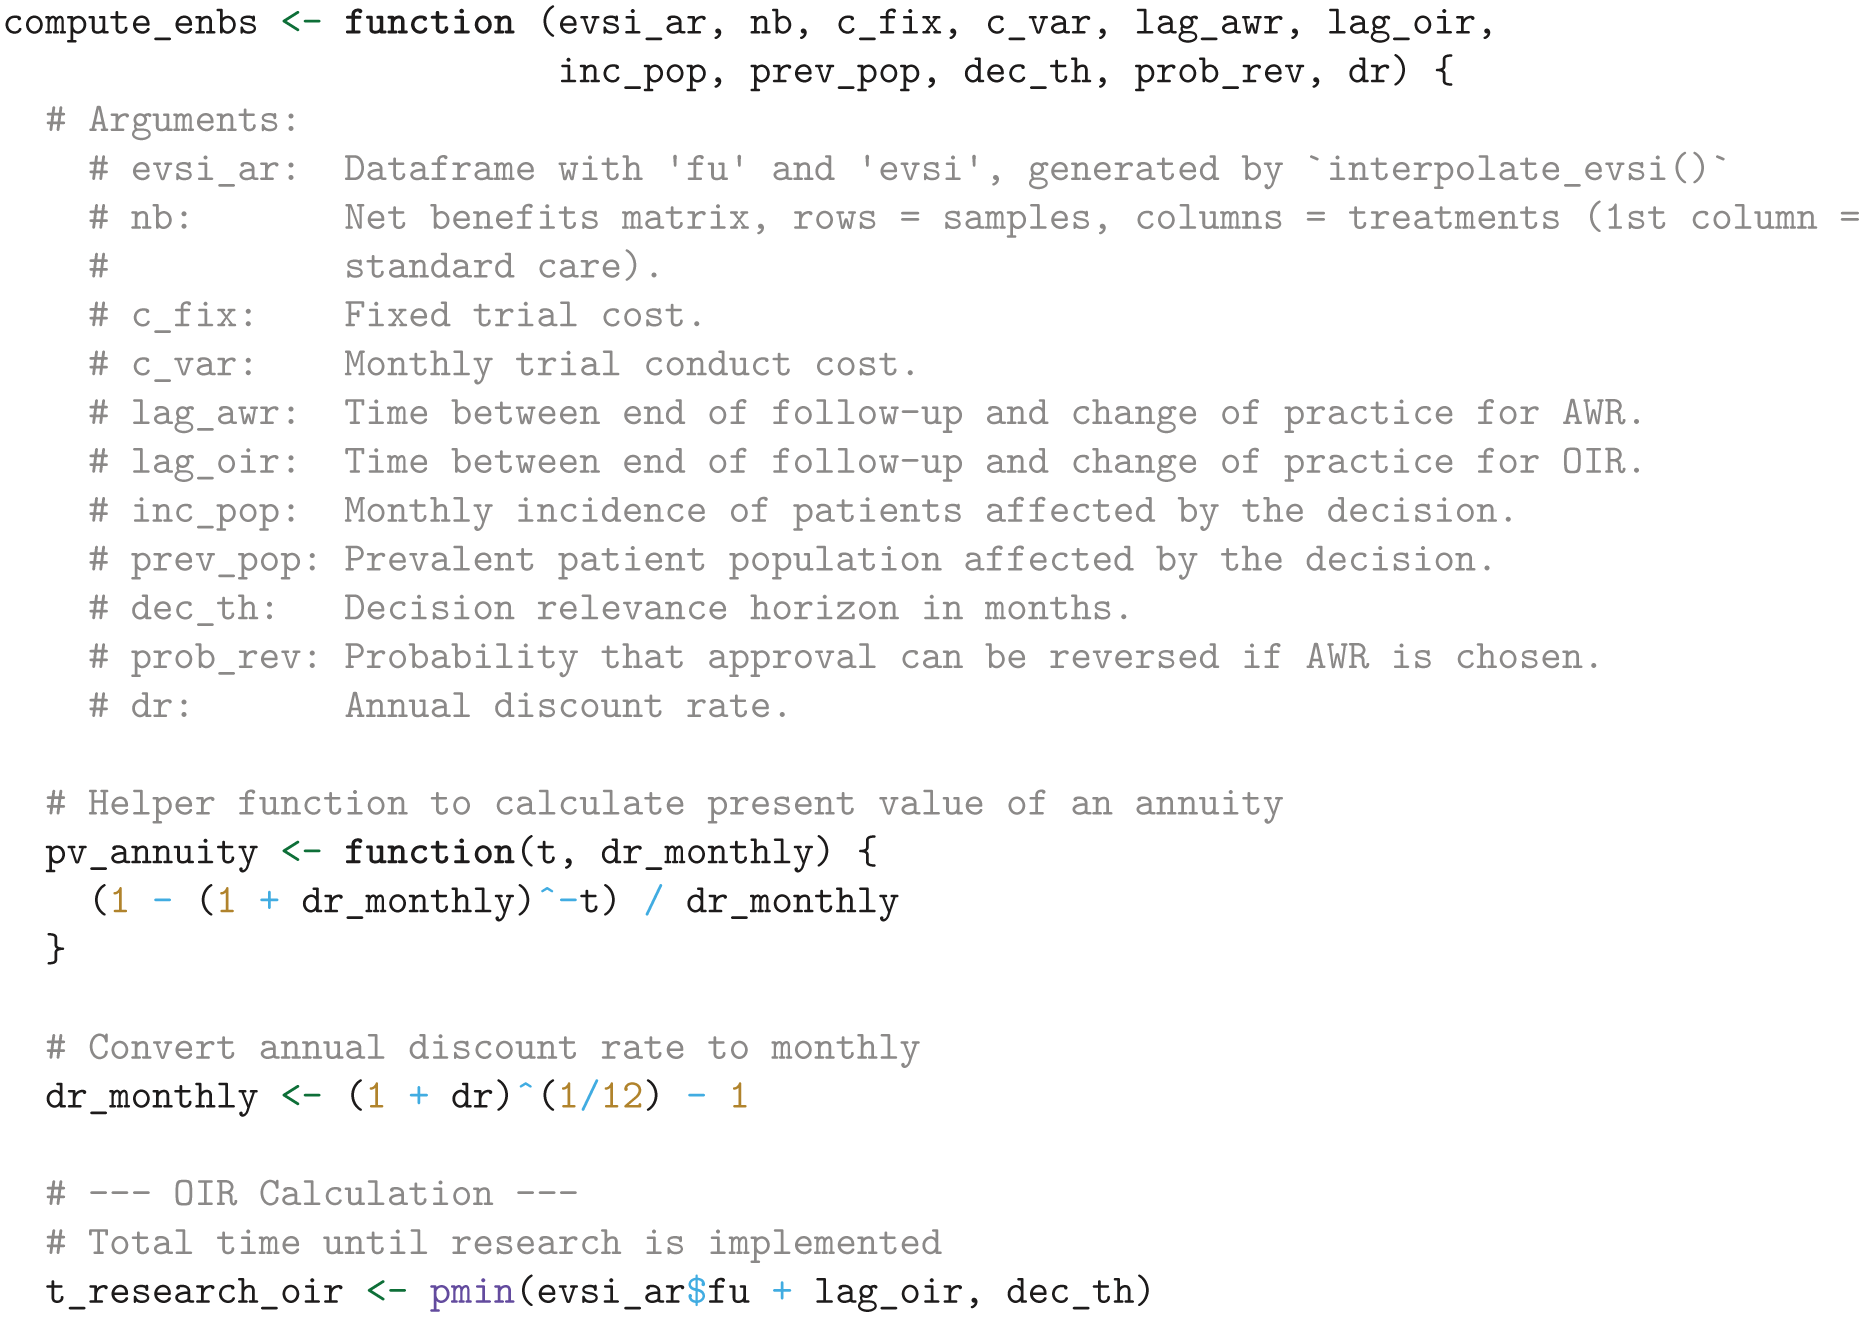
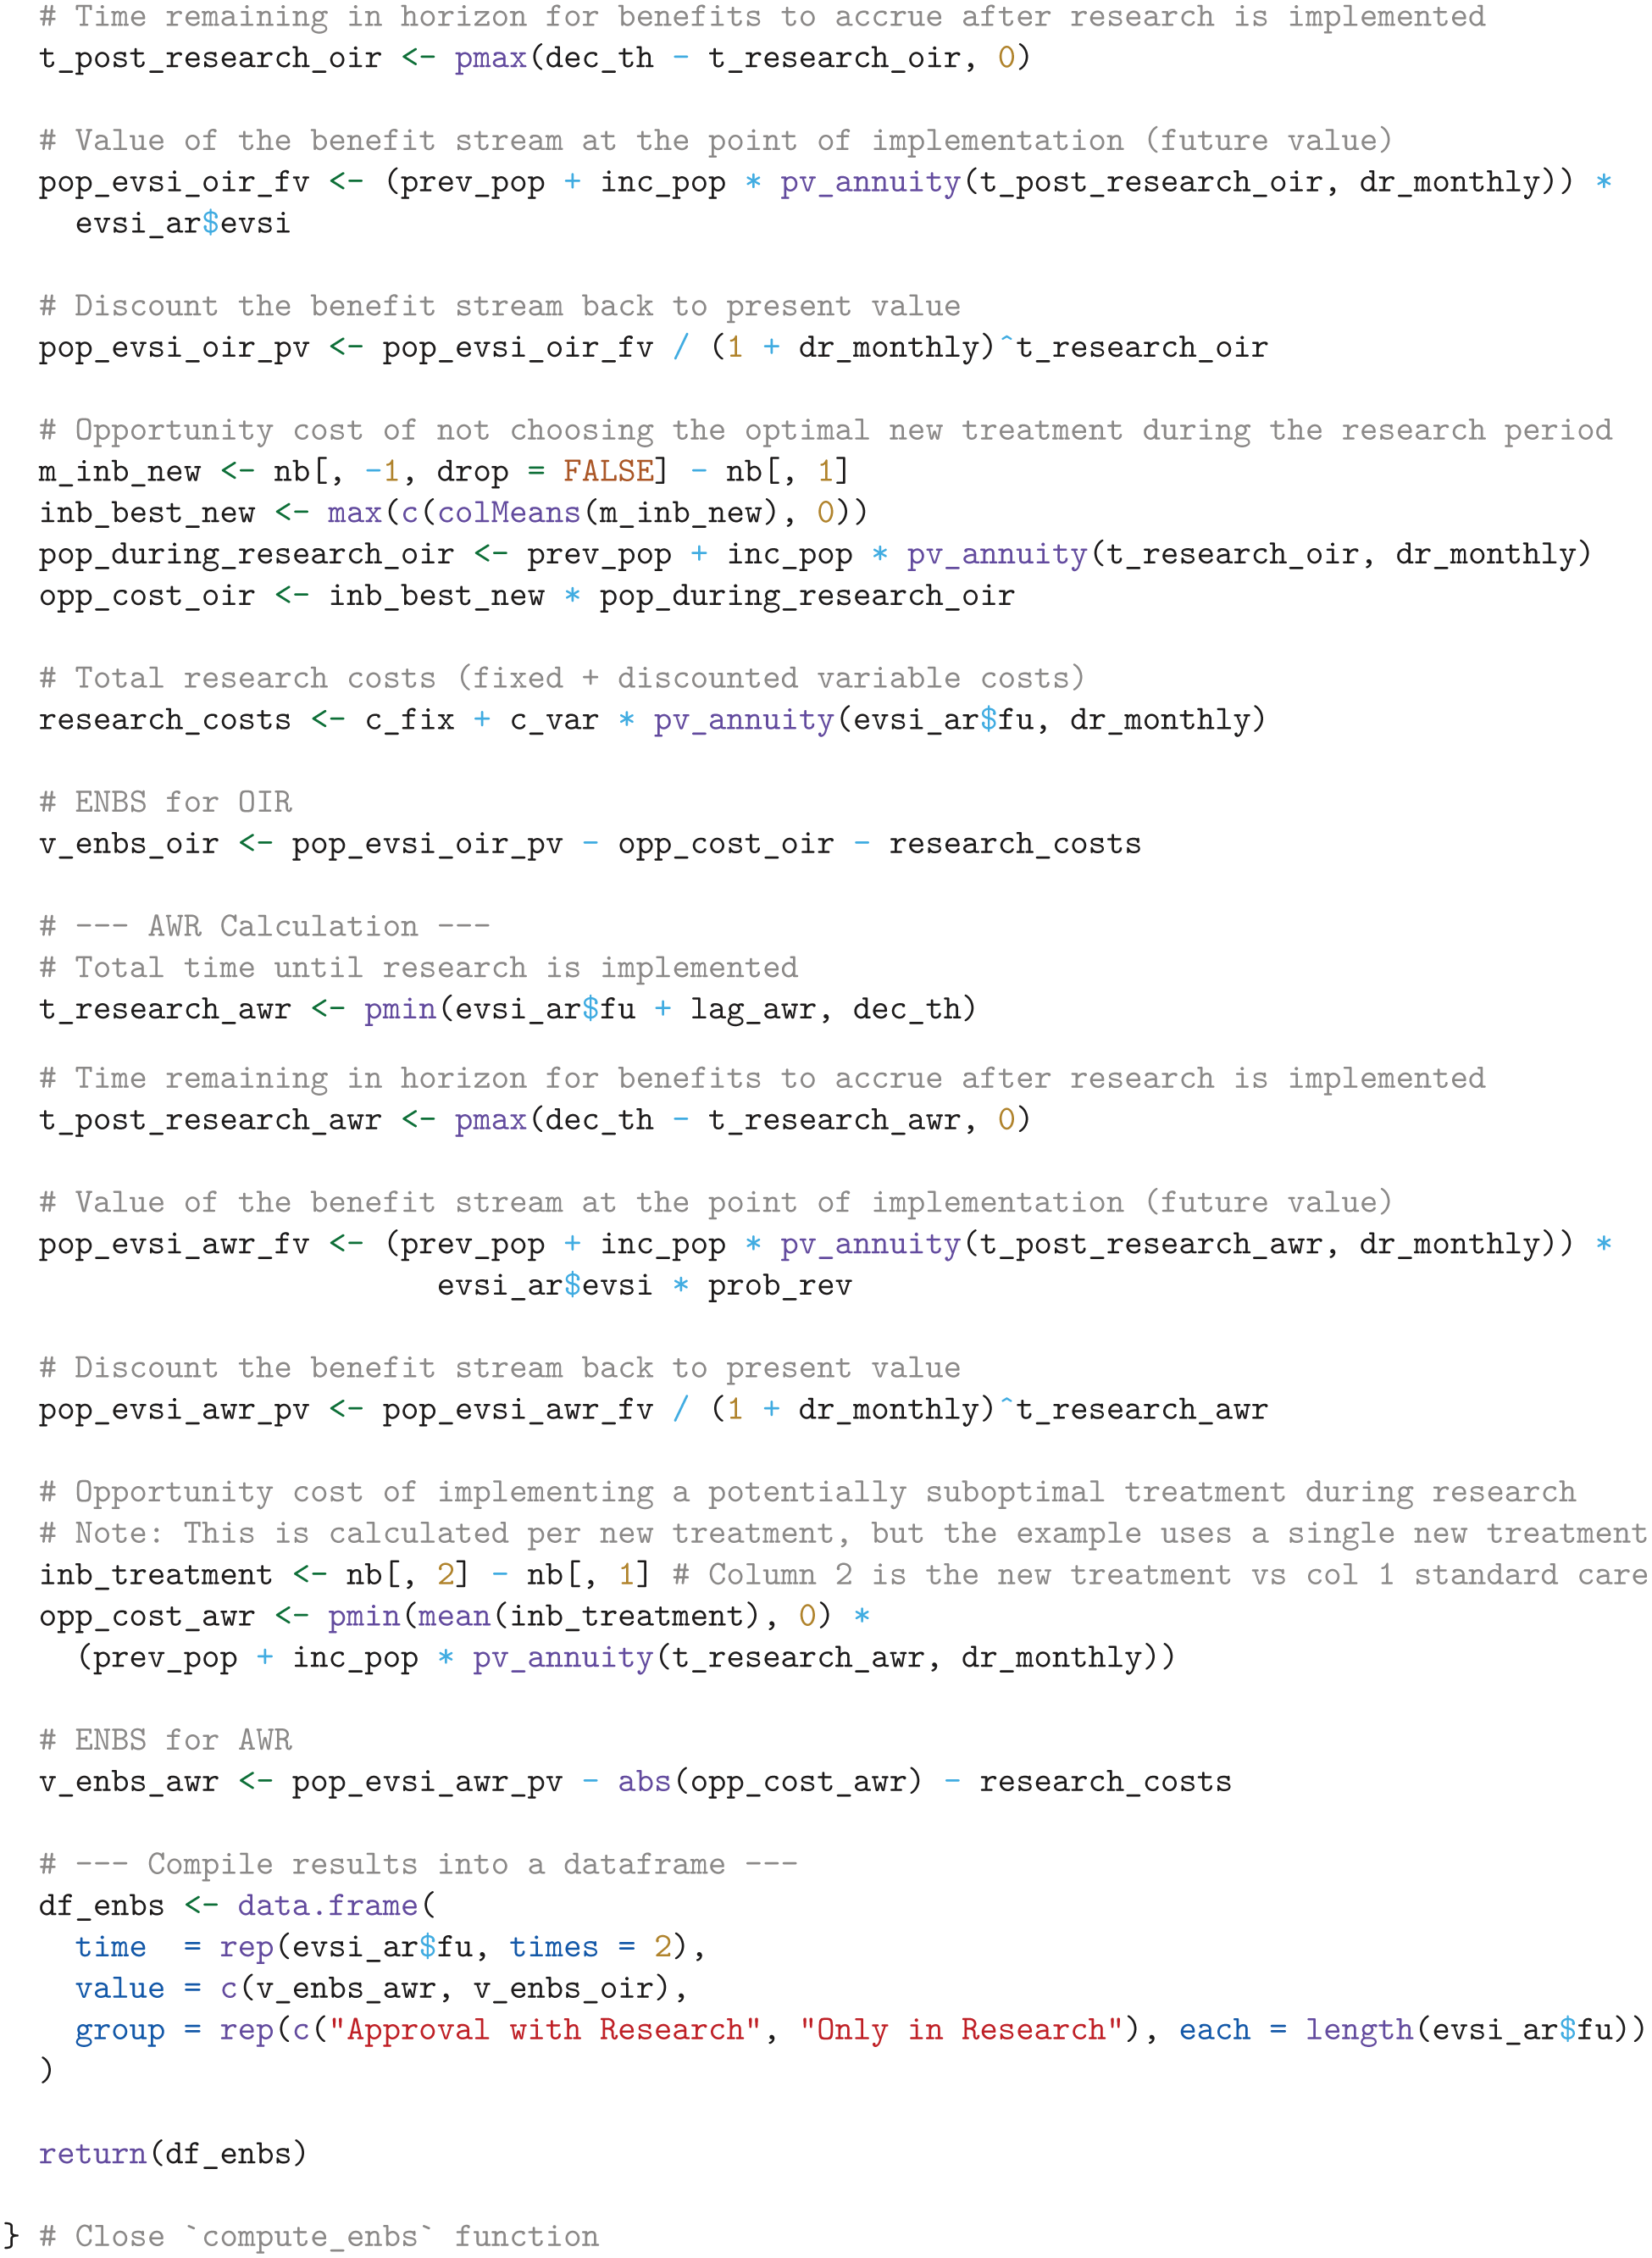
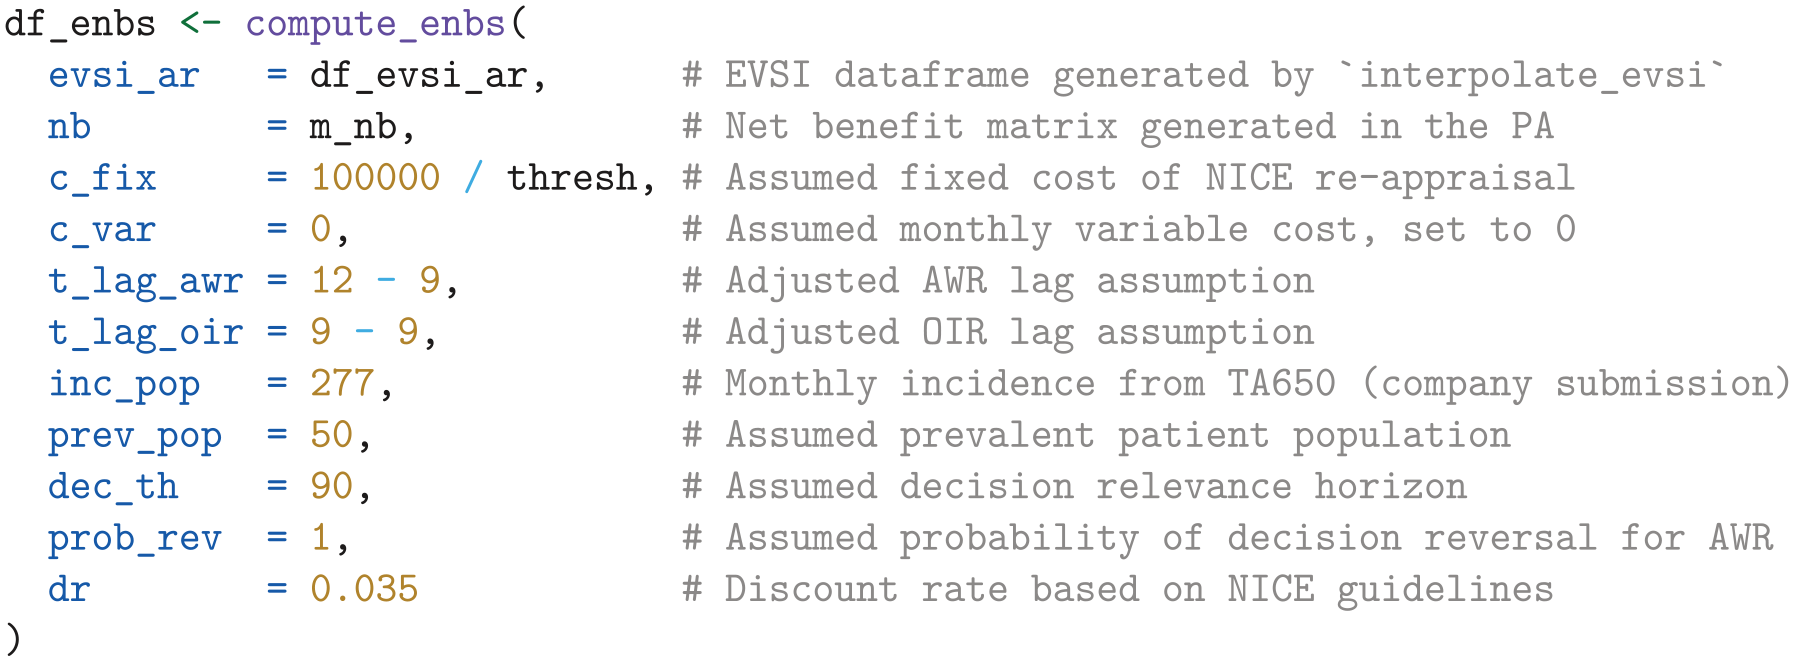
The ENBS computation relies on several assumptions:
We assume a fixed cost of £100,000 for the NICE reappraisal.
We assume the National Health Service (NHS) incurs no additional costs for the KEYNOTE trial’s continued OS follow-up, as the manufacturer bears this expense per trial protocol.
We assume a lag time of 12 mo and 9 mo for AWR and OIR, respectively. The lag time is the duration from the end of follow-up at
From the company submission, 40 we derived a monthly incidence of 277 patients with advanced renal cell carcinoma in the United Kingdom.
For illustrative purposes, we assume that 50 prevalent patients are eligible for the new treatment.
We use an annual discount rate of 0.035 and assume a decision relevance horizon of 90 mo.
Finally, under AWR, we consider a 100% probability of reversing an approval decision, albeit with an additional delay specified by
Using these inputs and assumptions, the ENBS is computed as follows:
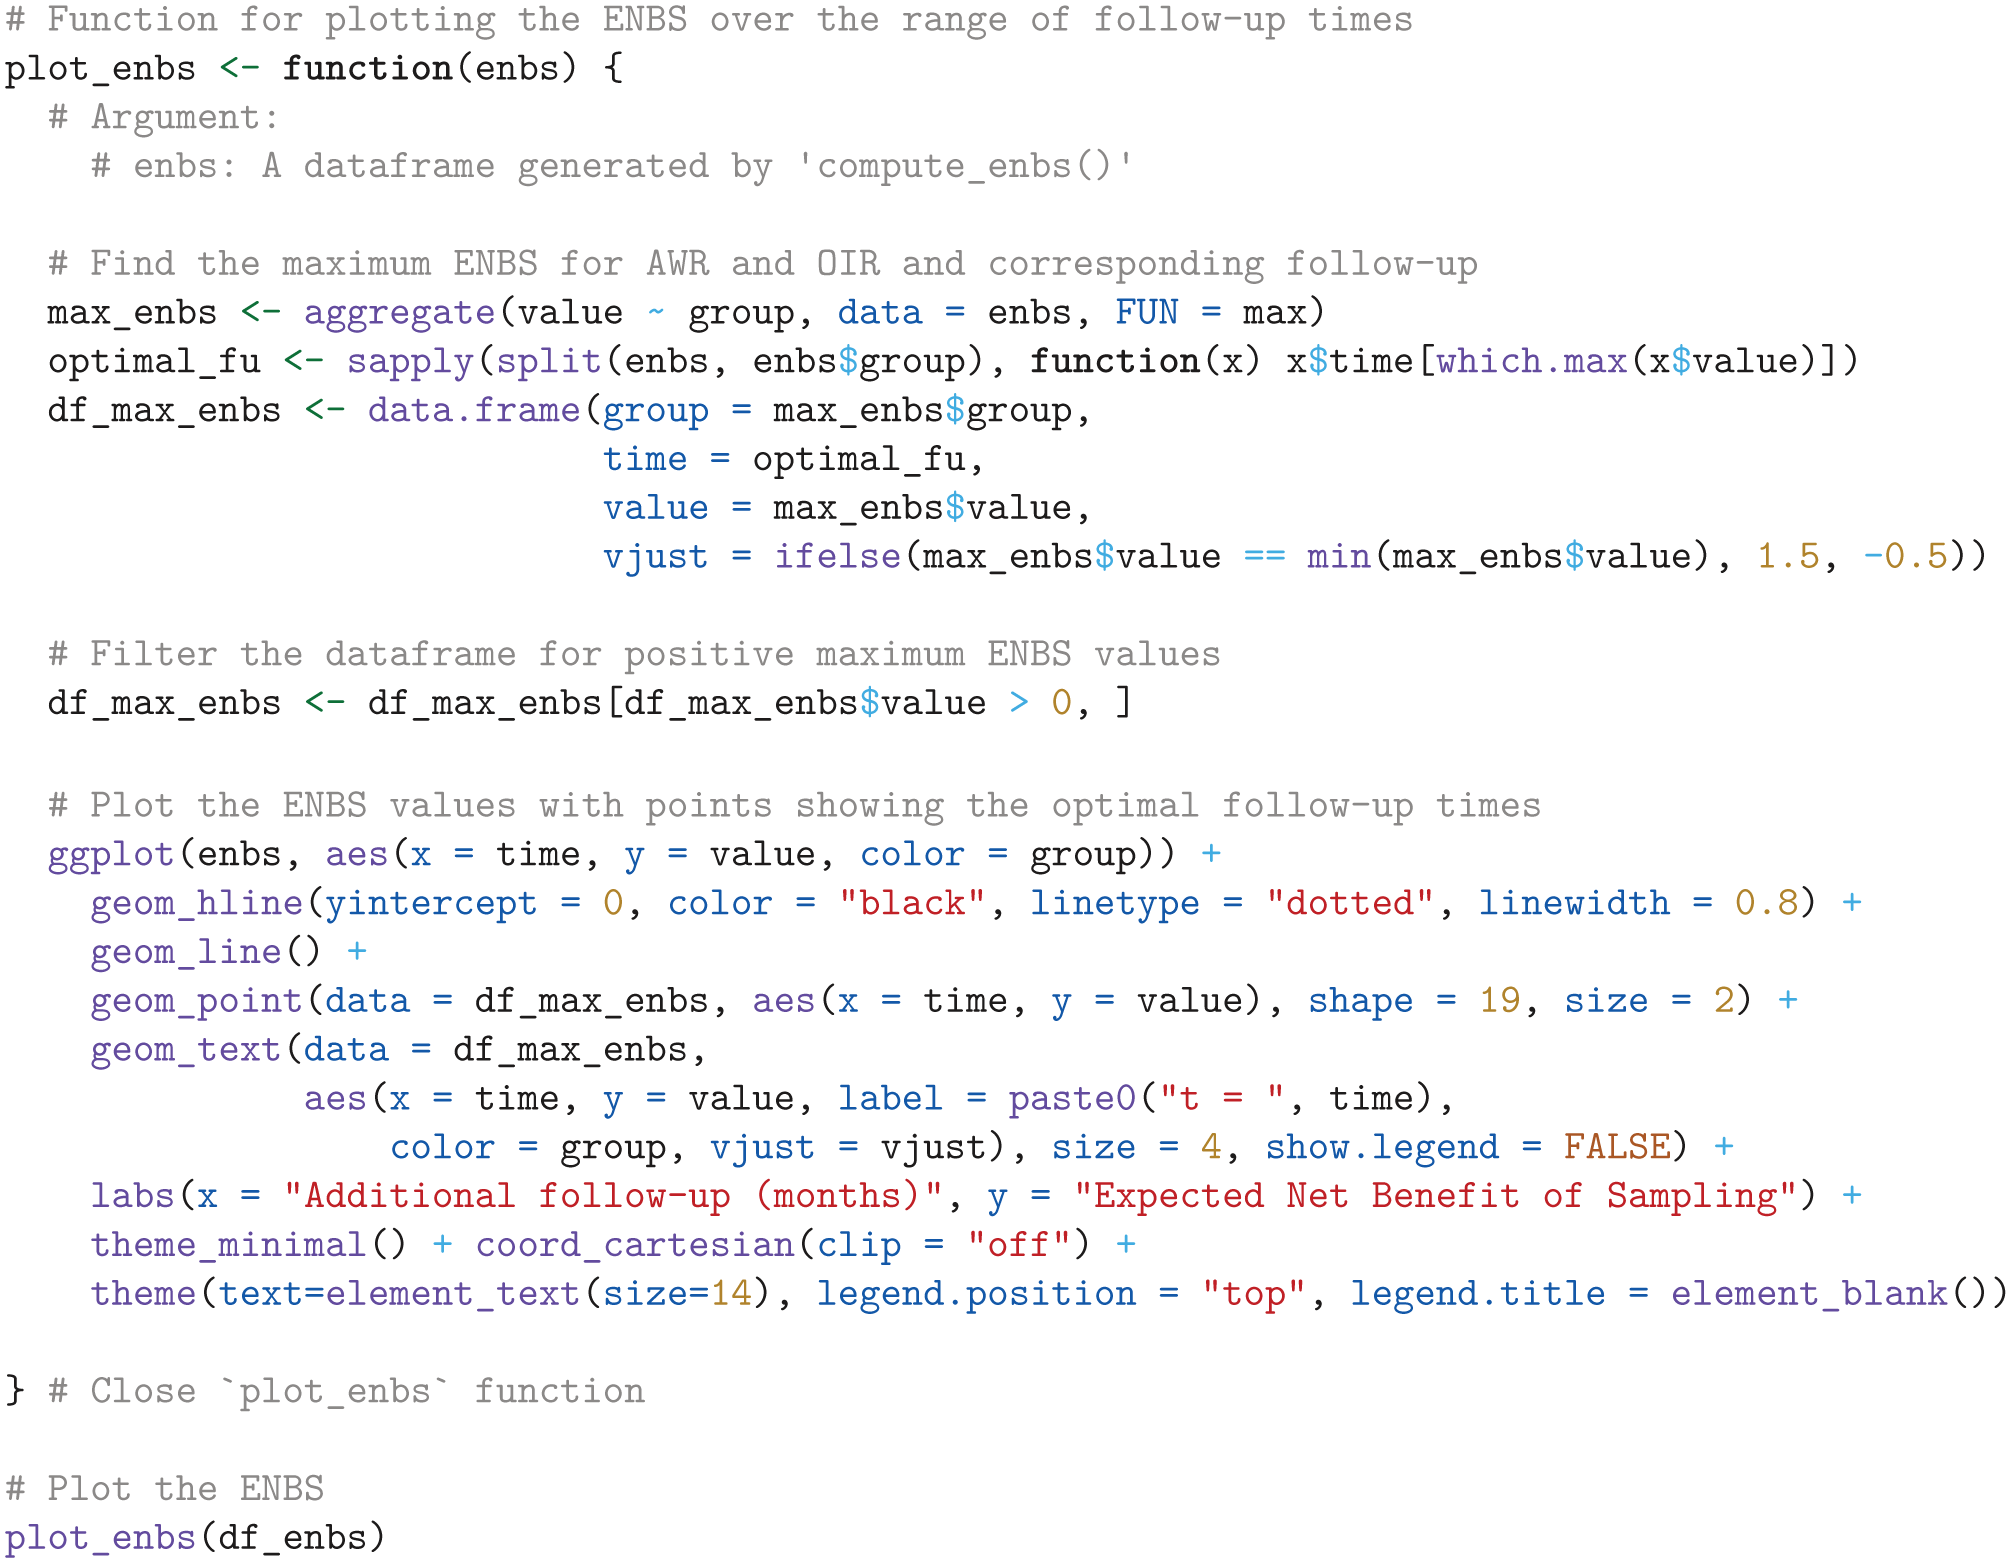
Next, we visualize the ENBS values over the range of follow-up times, highlighting the optimal follow-up times that maximize the ENBS for both AWR and OIR, using the
ENBS Analysis
Figure 2 presents the ENBS for additional OS follow-up in KEYNOTE-426 for the base-case and alternative scenarios. In the base-case analysis (Figure 2a), the ENBS initially increases as the EVSI increases and then decreases as the population who can benefit from the additional research declines with longer follow-up. The positive ENBS values for both AWR and OIR indicate that there is net value in collecting additional survival data with longer follow-up before making a final reimbursement decision. AWR has a greater ENBS and is therefore a better option than OIR across the range of follow-up times. The optimal decision option that maximizes the ENBS is AWR with an additional follow-up of 18 mo. This indicates that if the adoption decision can be fully reversed, and assuming value-based pricing, pembrolizumab plus axinitib should be conditionally approved and reappraised after 18 mo of additional follow-up for OS. These additional follow-up periods do not require an extension of the planned follow-up period per trial protocol, which is expected to conclude after 31 mo of additional data collection. The maximum ENBS for OIR is greater than that of AWR in 2 scenarios: when the threshold is set equal to the highest most recent estimate of the marginal cost per QALY in the NHS of £8,000 52 (Figure 2d), in which case pembrolizumab plus axitinib cannot be considered cost-effective and AWR is not an option, and when assuming an additional decision reversal delay of 6 mo for AWR (Figure 2e). Figure 2c illustrates that if the price for pembrolizumab is substantially reduced, the ENBS for OIR becomes negative, and pembrozilumab plus axitinib should be conditionally approved, even if approval cannot be reversed at a later point. The ENBS for AWR and OIR increases with a longer decision relevance time horizon (Figure 2b), whereas a lower incidence rate leads to a reduction in ENBS for both decision options without affecting the optimal follow-up period (Figure 2f).
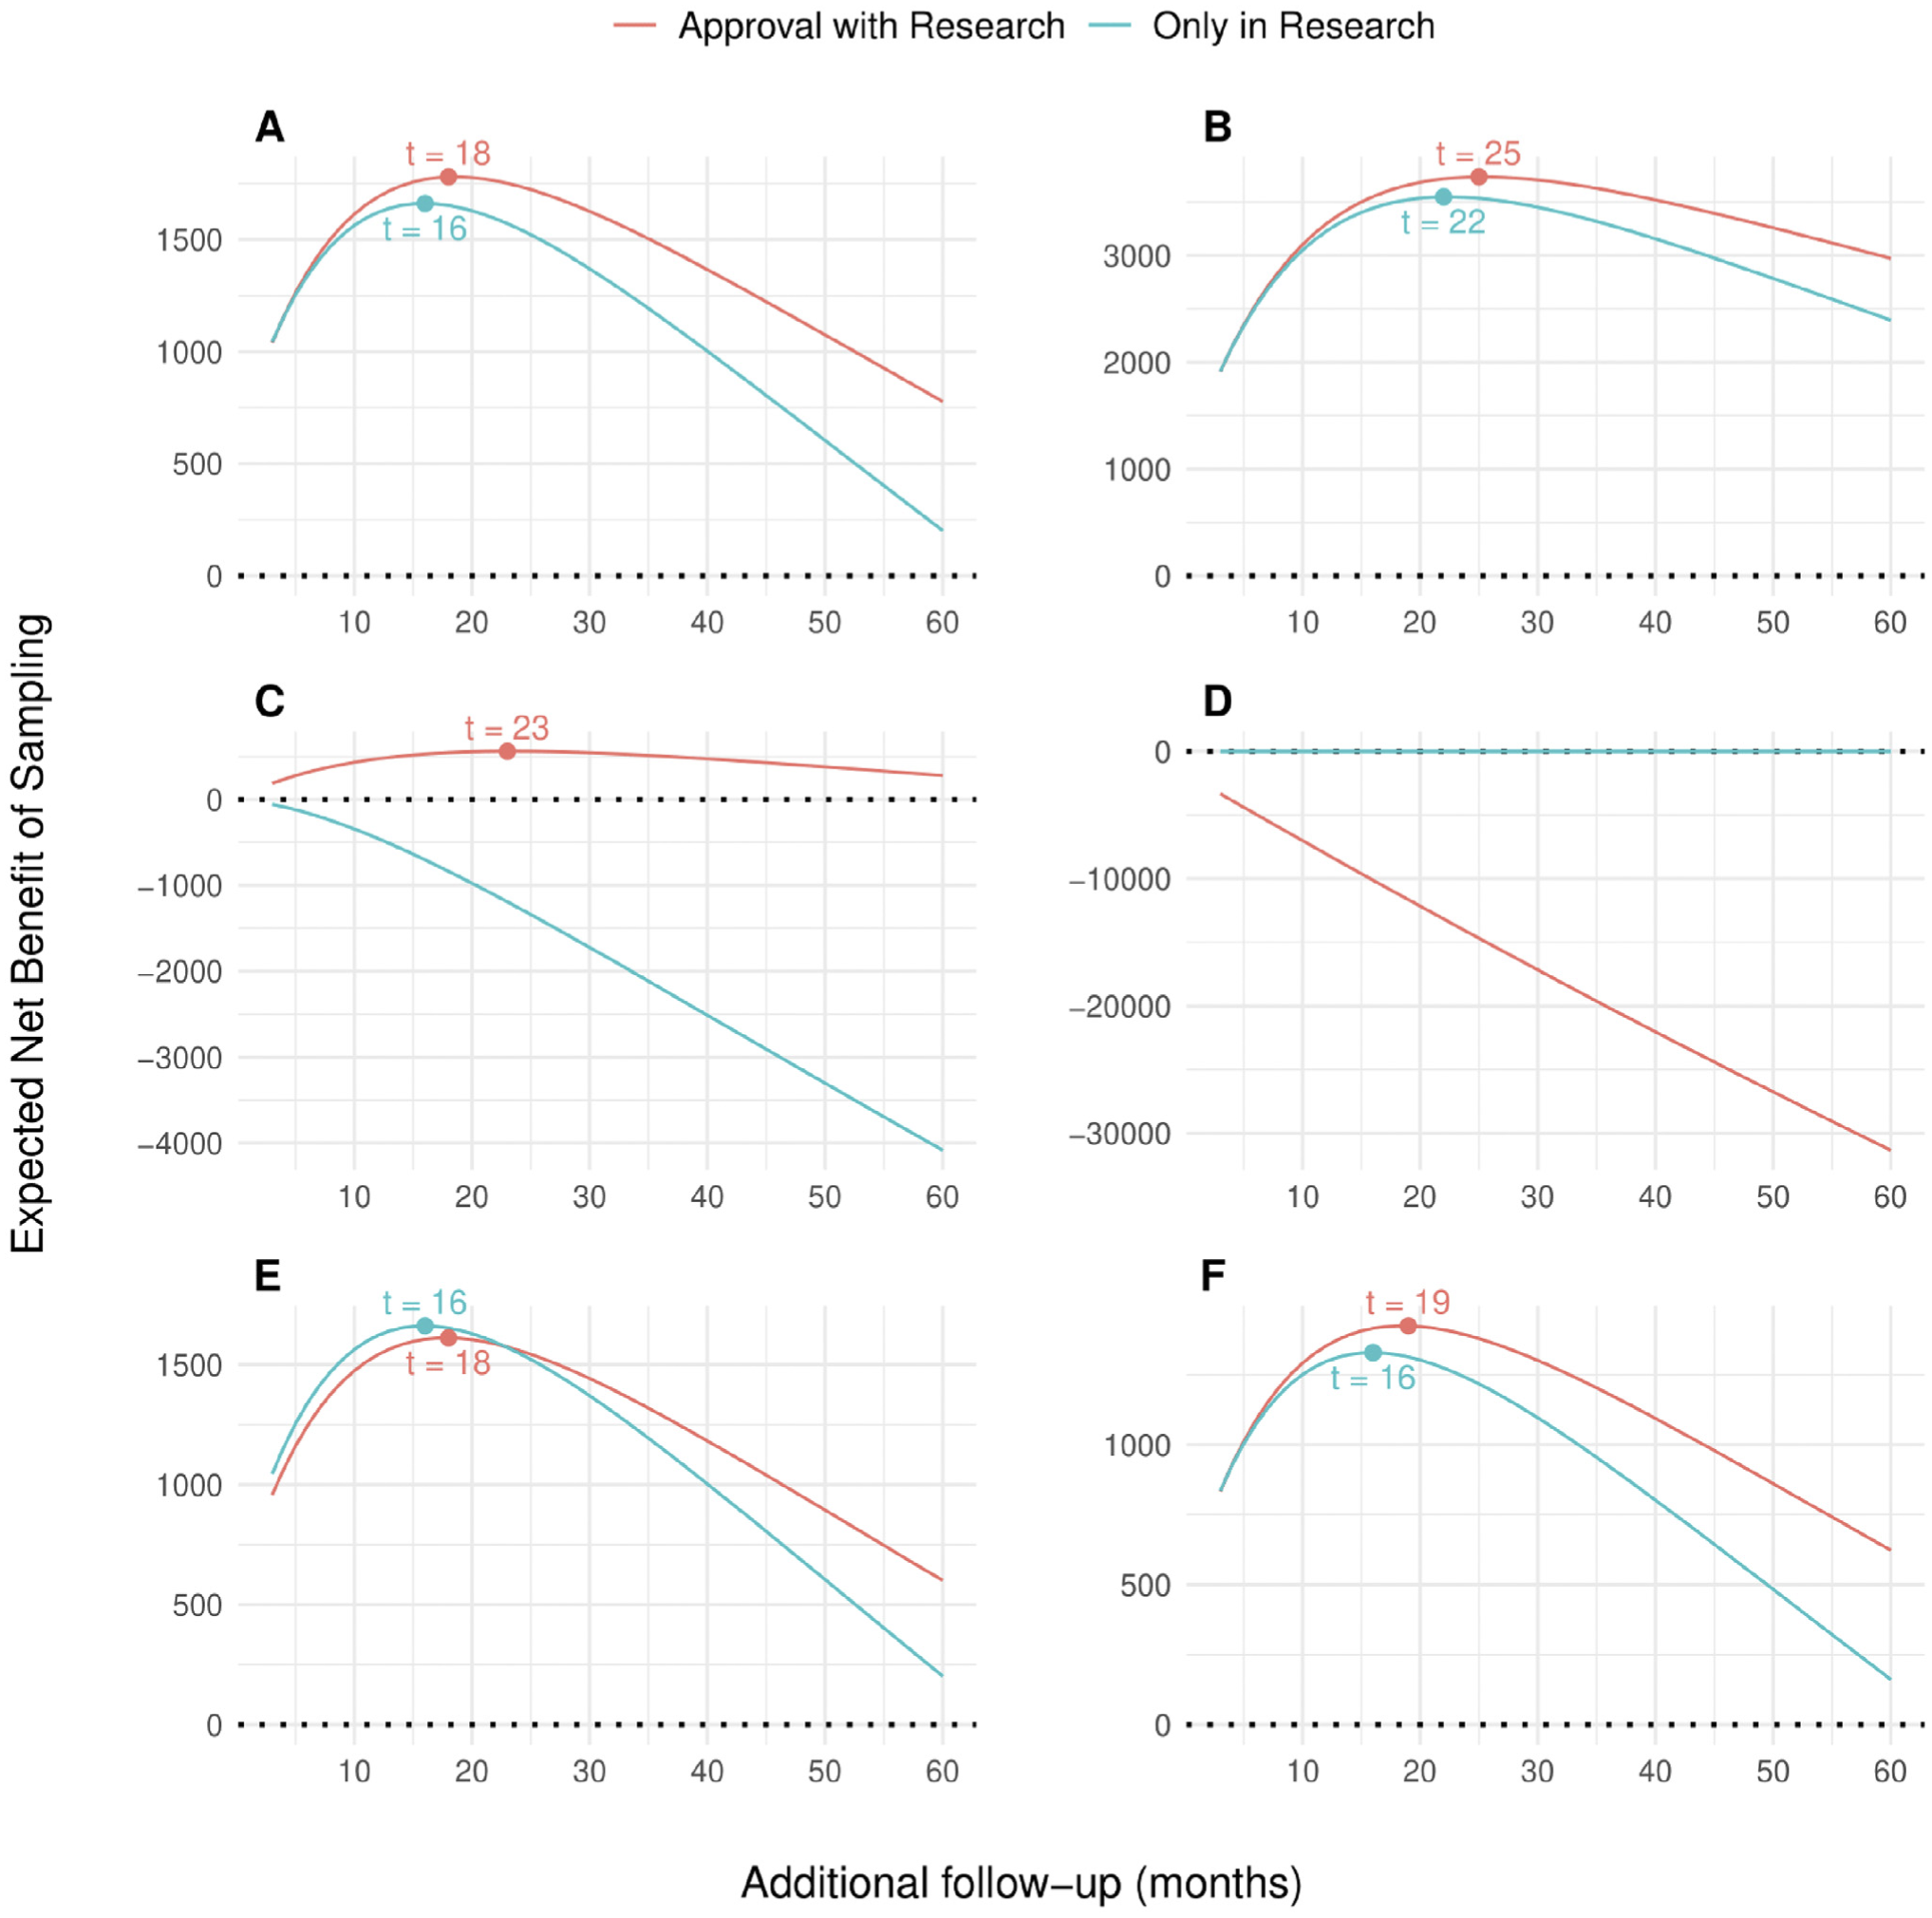
Expected net benefit of sampling (ENBS) for additional follow-up for overall survival in KEYNOTE-426 for the base-case analysis (a) and alternative scenarios (b–f). AWR, approval with research; OIR, only in research. (a) Base case, (b) decision relevance horizon of 180 mo, (c) 50% price discount,a (d) Threshold set at a health opportunity cost of £8,000 per QALY gained,b (e) additional reversal delay of 6 mo for AWR, and (f) 20% lower incidence.
Discussion
Strengths and Limitations
We have presented a tutorial for computing the ENBS for collecting survival data and a step-by-step implementation using
In the United Kingdom, many new oncology drugs with an uncertain evidence base are conditionally approved by NICE through the Cancer Drug Fund (CDF) to provide early patient access while additional data are being collected. 54 Evidential uncertainty often arises due to immature survival data, which has largely been addressed by collecting data with longer follow-up from ongoing trials.26,55 Trial data with longer follow-up then form the basis for a review appraisal to inform a final decision on routine commissioning, which should generally take place within 2 y after a drug enters the CDF. However, without a formal assessment of the benefits and costs of the additional data collection, the data collection period may be too long or too short and does not take into account that approval decisions can be difficult or costly to reverse, particularly on the basis of cost-effectiveness arguments, in which case OIR may be more appropriate. For instance, experiences with conditional approval for new pharmaceuticals in the Netherlands, 8 Belgium, 9 and Germany 10 demonstrated that discontinuing reimbursement has been problematic. This is also supported by a discrete-choice experiment, 11 which found that both policy makers and the public find it more difficult to discontinue reimbursement compared with not approving reimbursement in the first place. Our case study highlights that the appropriate type of guidance and a sufficient length of follow-up depends on multiple considerations, such as the decision relevance horizon, the time it takes to reverse an approval decision, the presence of significant irrecoverable costs, the size of the beneficiary population, the technology’s price, and the expected value of the additional data, and is likely to vary across different technology appraisals. For example, AWR was revised to OIR when we assumed a longer delay in reversing an AWR decision. In the scenario in which we assumed a 50% price discount, OIR was revised to approval since the benefits of early patient access given the lower price exceeded the value of additional evidence foregone. Adoption decisions that account for the ENBS of collecting additional survival data can therefore provide incentives for manufacturers to reduce the price when evidence is immature or justify a higher price by investing in better evidence. 13 While extrapolation of survival is often a key uncertainty, collecting data on other uncertain model parameters such as costs and quality of life may also be valuable, although this may require conducting a new study.
TAs of new oncology drugs, including the case study presented in this tutorial, are routinely informed by PSMs that are constructed using immature survival data. PSMs are relatively easy to construct and interpret, as they use commonly reported clinical endpoints such as OS and PFS directly to estimate health state membership. A key limitation of PSMs is the assumption of independence between survival endpoints. 46 This is particularly important for OS, which is extrapolated independently of intermediate endpoints such as progression. The independence between survival endpoints limits the possibility of assessing the biological mechanisms that drive the extrapolations, such as the treatment effect on pre- and post-progression mortality. Further research could extend the ENBS calculations for survival data described in this tutorial to the context of state-transition models (STMs), in which patients move between health states at fixed cycle times based on the probability of transitioning from one state to another. 46 By explicitly modeling the link between intermediate endpoints such as disease progression and survival, STMs can overcome a key limitation of PSMs regarding the independence between survival endpoints. In principle, all the necessary information for applying the methods described in this tutorial can be obtained from a probabilistic sample of transition hazards, since the hazards can be summed up to produce the cumulative hazards, and survival probabilities can be obtained by exponentiating the negative of the cumulative hazards. Survival times can then be simulated by first sampling a PFS time and then deciding whether the sampled PFS time is a progression or death event using a binomial experiment with probability derived from the hazards of transitioning from PFS to PPS and OS. 56 If the simulated time is a progression event, remaining time until death can be simulated from the conditional survival distribution for PPS to OS. Alternatively, the vectors of OS and PFS probabilities derived from an STM could be used directly as inputs for the ENBS algorithm described in this tutorial, in the same manner as for a PSM. Further research could focus on investigating this approach. A limitation of STMs is that they require IPD to estimate the transition probabilities, which is usually only available to the manufacturer. 46 Estimating transition probabilities can also be challenging in the context of immature survival data, as there may be only limited available data to inform the transitions, particularly for post-progression mortality. For example, patients who progress early may also have a higher risk of mortality following progression, and since early progressors will initially be overrepresented among the progressed patients, there is a risk of overestimating post-progression mortality. Woods et al. 46 recommended using STMs alongside PSMs to better assess clinical uncertainties during extrapolation periods. Furthermore, they highlighted the need for further research on methods for estimating transition probabilities in STMs in contexts in which PSMs are used.
Most TAs are informed by cost-effectiveness models that have been developed in Excel, which puts important constraints on the type of analysis that can be performed compared with the use of programming software such as
Conclusion
This tutorial presents a general-purpose algorithm and practical
Supplemental Material
sj-pdf-1-mdm-10.1177_0272989X241279459 – Supplemental material for Calculating the Expected Net Benefit of Sampling for Survival Data: A Tutorial and Case Study
Supplemental material, sj-pdf-1-mdm-10.1177_0272989X241279459 for Calculating the Expected Net Benefit of Sampling for Survival Data: A Tutorial and Case Study by Mathyn Vervaart in Medical Decision Making
Footnotes
Acknowledgements
The author wishes to thank Anna Heath, Karl Claxton, Torbjørn Wisløff, Eline Aas, Nicky Welton, and Mark Strong for their comments on an earlier version of this manuscript. Additionally, the author thanks the 4 anonymous reviewers and the associate editor for their comments.
Correction (October 2024):
This article has been updated with minor style corrections to the variables and expressions since its original publication.
The author declared no potential conflicts of interest with respect to the research, authorship, and/or publication of this article. The author disclosed receipt of the following financial support for the research, authorship, and/or publication of this article: MV was funded by a grant from the Norwegian Research Council through NordForsk (grant No. 298854). The funding agreement ensured the author’s independence in designing the study, interpreting the data, writing, and publishing the report.
References
Supplementary Material
Please find the following supplemental material available below.
For Open Access articles published under a Creative Commons License, all supplemental material carries the same license as the article it is associated with.
For non-Open Access articles published, all supplemental material carries a non-exclusive license, and permission requests for re-use of supplemental material or any part of supplemental material shall be sent directly to the copyright owner as specified in the copyright notice associated with the article.