
Abstract
The expected value of sample information (EVSI) can be used to prioritize avenues for future research and design studies that support medical decision making and offer value for money spent. EVSI is calculated based on 3 key elements. Two of these, a probabilistic model-based economic evaluation and updating model uncertainty based on simulated data, have been frequently discussed in the literature. By contrast, the third element, simulating data from the proposed studies, has received little attention. This tutorial contributes to bridging this gap by providing a step-by-step guide to simulating study data for EVSI calculations. We discuss a general-purpose algorithm for simulating data and demonstrate its use to simulate 3 different outcome types. We then discuss how to induce correlations in the generated data, how to adjust for common issues in study implementation such as missingness and censoring, and how individual patient data from previous studies can be leveraged to undertake EVSI calculations. For all examples, we provide comprehensive code written in the
Keywords
Introduction
What Is EVSI and Why Is It Not Used More Frequently?
The expected value of sample information (EVSI) measures the value of reducing decision uncertainty by undertaking a proposed study with a given design. 1 Specifically, EVSI is the expected economic benefit of a study that collects additional information that aims to reduce uncertainty before making a decision. 2 In medical decision making, EVSI can be applied to a wide range of study designs, including clinical trials, to inform the relative effectiveness of treatments or observational studies to estimate baseline event rates. The expected net benefit of sampling (ENBS) is defined as the costs of a study subtracted from its (population-level) EVSI. Studies with high ENBS efficiently trade off information value and data collection cost. ENBS can then be used to optimize study design and prioritize research investments that offer value for money.3,4 EVSI and ENBS can also support reimbursement decision makers as small values for EVSI and ENBS indicate that treatment recommendations should be made using existing evidence, rather than recommending the collection of further evidence before making a treatment recommendation. Despite these benefits of EVSI and ENBS, their practical application has been restricted by the difficulty of the computations required and by the small number of analysts who are familiar with its use. 5
How Is EVSI Computed?
In model-based health economic evaluations, EVSI is usually calculated using a simulation-based approach based on 3 main elements, each of which can increase the barrier to its implementation. 6 First, the model-based economic evaluation must be fully probabilistic (i.e., all relevant quantities must be parameterized and their uncertainty accurately characterized and encoded in probability distributions). In this setting, the optimum decision option is the one that maximizes expected net benefit, where expectation is taken over the parameter uncertainty. 1 Second, we must simulate plausible values for the data that would be collected in the proposed future study. 6 Third, we must update our parameter uncertainty using the simulated plausible study data from the previous step, potentially changing the optimum decision option. 7 This final step has traditionally been highly computationally demanding because it requires a large number of simulations.
The first and third elements of the process have been widely discussed. First, methods for developing probabilistic decision-analytic models are well established, since probabilistic analyses (PAs), also known as probabilistic sensitivity analyses, are required as part of health technology assessment (HTA) processes in many health systems.8–12 Good practice guidelines and textbooks also guide the development of probabilistic decision-analytic models using evidence from the literature.1,13–15 The third element has been facilitated by recently developed efficient approximation methods that have overcome the computational challenge of calculating EVSI using the simulated study data.16–19 These approximation methods have recently been compared and evaluated.20,21
What Does This Tutorial Discuss?
This tutorial addresses the crucial second element, simulating plausible study data, which has not received sufficient attention in the literature to allow analysts to easily compute EVSI. Fortunately, simulating study data is a common task outside of HTA.22,23 This tutorial highlights how these approaches23–29 can be used to compute EVSI. We will present methods to simulate data using correlated and uncorrelated parametric distributions that incorporate real-world study challenges, such as loss to follow-up, and using a nonparametric approach with individual patient data (IPD) from previous studies. We aim to support the generation of realistic study data to improve the accuracy of EVSI calculations. 6 Coupled with the recent advancements in EVSI computation, this tutorial will facilitate the use of EVSI in practice to guide research prioritization and study design.
Background and Notation
This section provides a brief introduction to EVSI and the notation used throughout this tutorial. A more complete introduction to EVSI is included in other sources.1,7,21
Model-Based Decision Analysis
We are aiming to decide between a set of
The Expected Value of Sample Information
Data to update information in
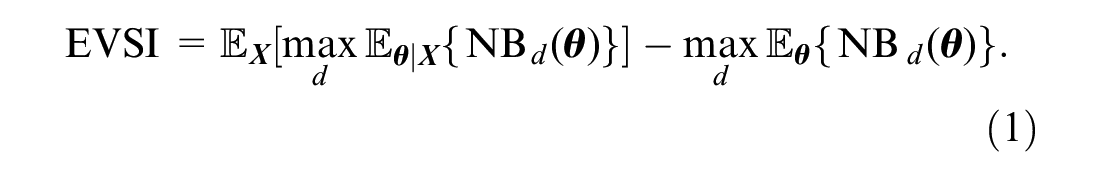
The first and second terms in this equation are usually not available in closed form and must be estimated using simulation methods.
Efficient Methods for Computing EVSI
The “standard” approach to EVSI estimation uses a nested Monte Carlo scheme that requires a large number of samples from the posterior distribution of the model parameters given sampled data,
Approaches to Simulating Study Datasets
We now discuss how to simulate plausible study datasets. For some EVSI computation methods, only a summary statistic (e.g., mean, sum), denoted
Simulating Study Outcomes Using Parametric Distributions
Plausible study data can be generated by specifying a parametric data-generating process
Irrespective of the complexity of
In practice,
Representation of a Probabilistic Analysis (PA) Sample with
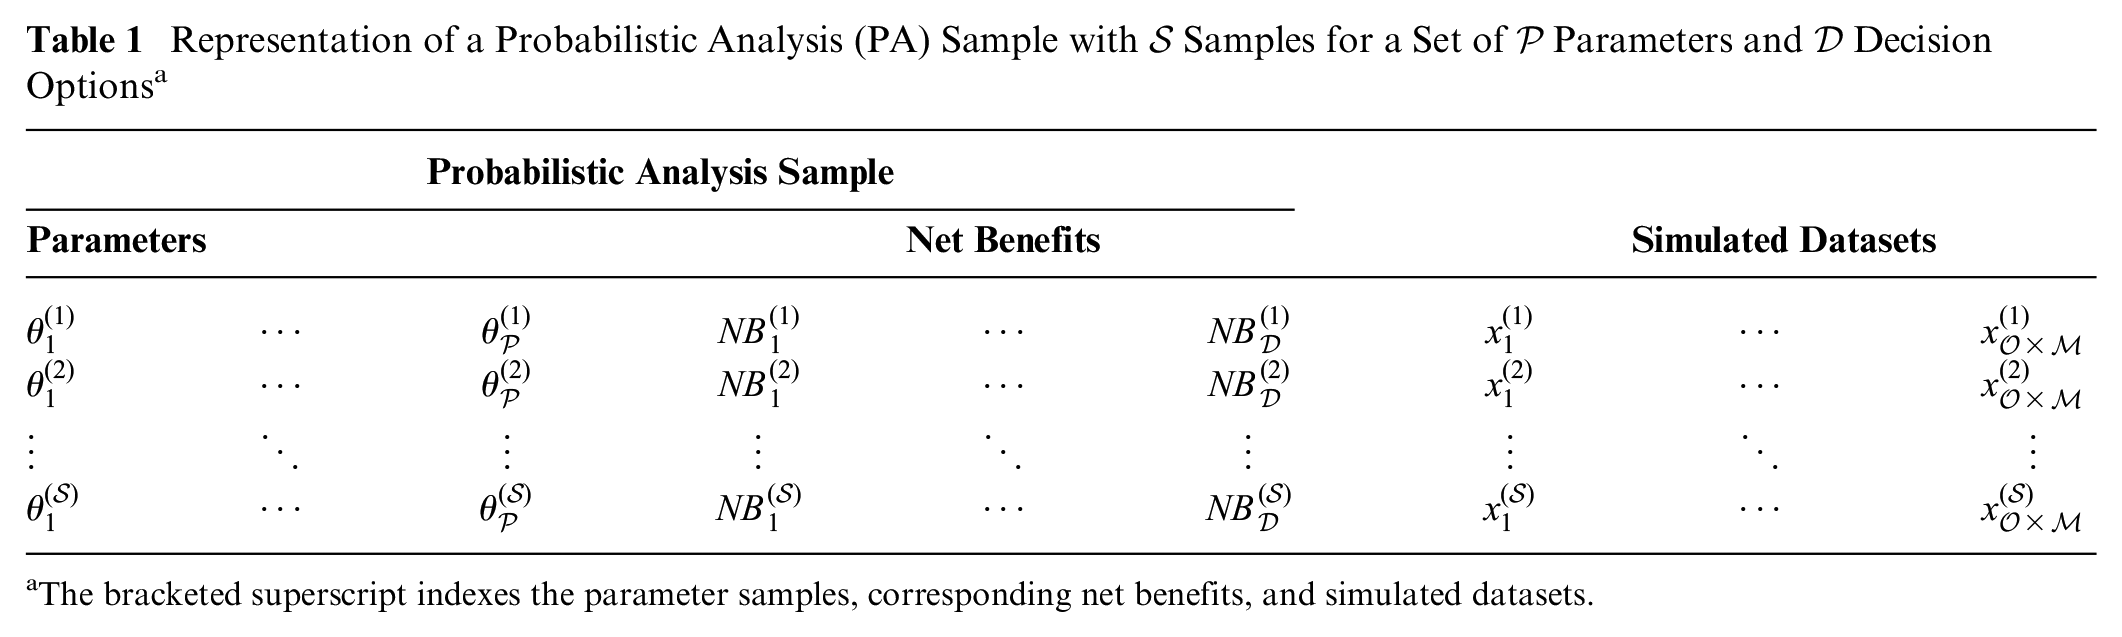
The bracketed superscript indexes the parameter samples, corresponding net benefits, and simulated datasets.
We assume that our study aims to record
Univariate Data Simulation for Complete Datasets
Initially, we consider studies that collect a single outcome at a single time point for each participant (i.e.,
Generating binary outcome data
Assume that our decision-analytic model has a parameter,
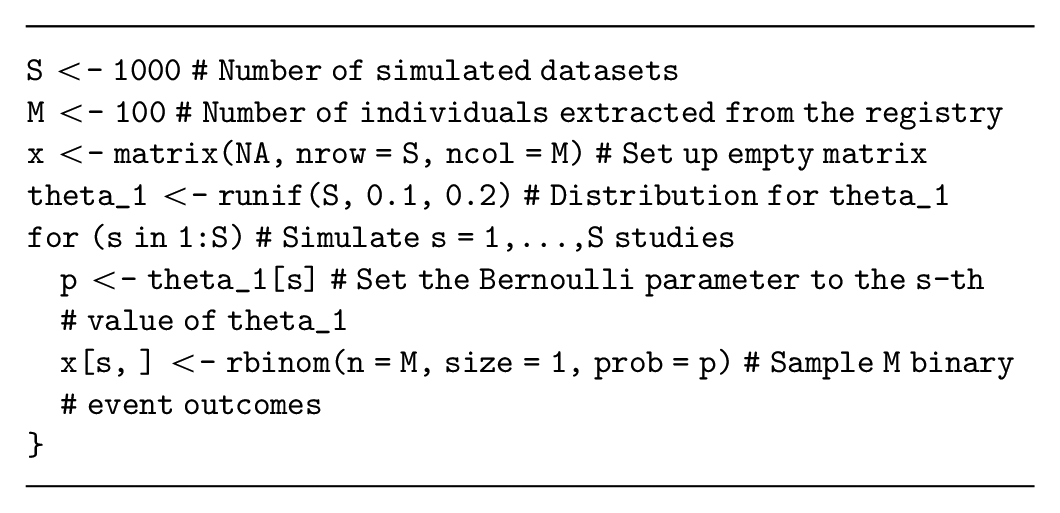
Alternatively, the number of events in each simulated study (i.e., a summary of the study data) can be sampled from a binomial distribution with parameter
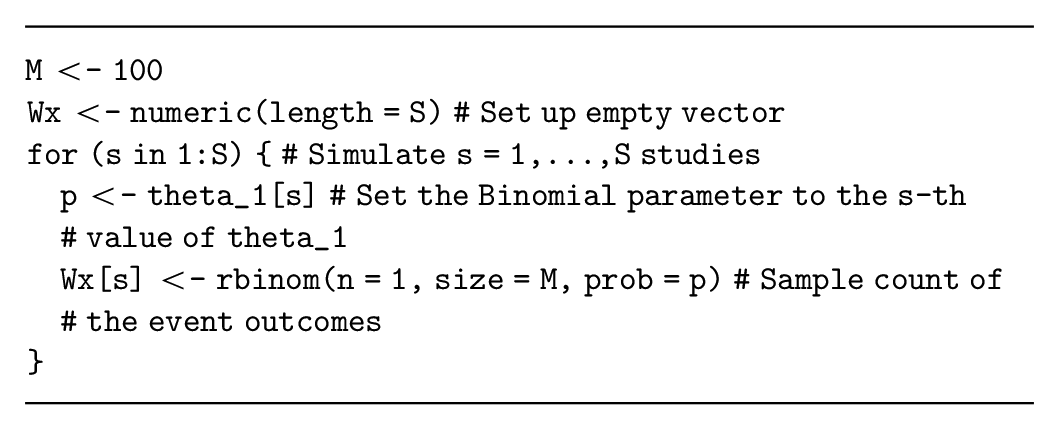
In this example, simulating the data summary is relatively simple and therefore recommended. However, if multiple outcomes will be simulated for each individual (see the multivariate data simulation section), then the individual-level binary outcomes will likely be required.
Generating normally distributed continuous data
Assume that the decision-analytic model has a parameter,
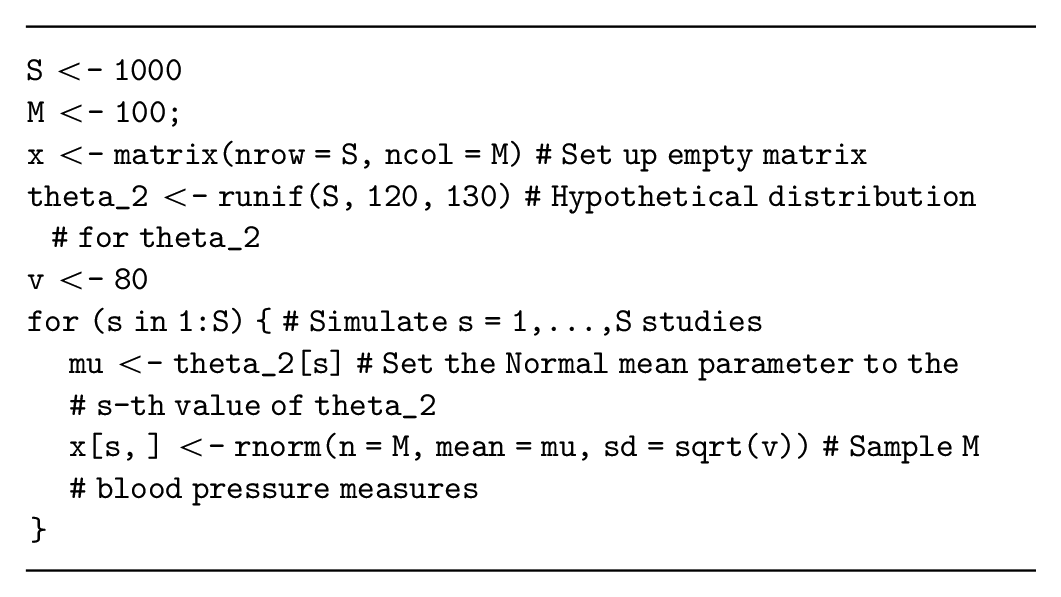
Alternatively, if the study is aiming to estimate the mean systolic blood pressure, then the summary statistic
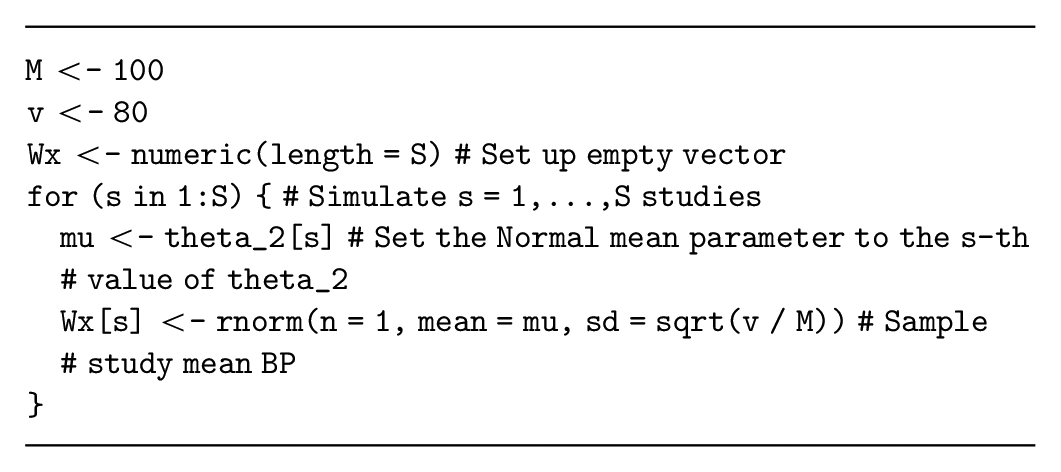
Many summary statistics are approximately normal (e.g., the log odds ratio or log hazard ratio), allowing us to potentially adapt this simulation method for other summary statistics. However, the standard error for these alternative summary statistics must be specified correctly, which can be challenging especially when considering variable sample sizes for the study. Thus, it may be more appropriate to generate individual-level data and then calculate the summary statistic from the simulated dataset by analyzing the simulated data as if it were collected during a study (see the data on relative effectiveness section below).
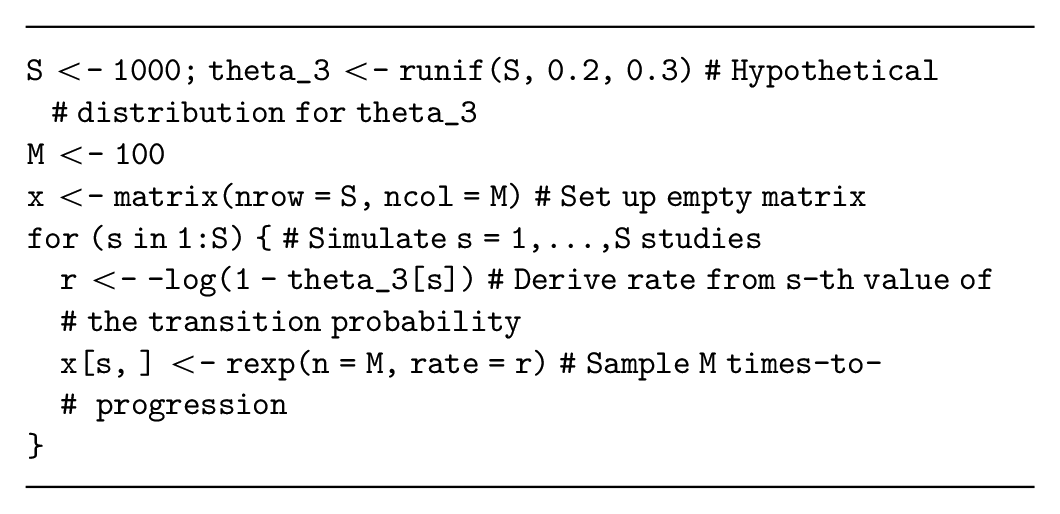
Generating time-to-event data
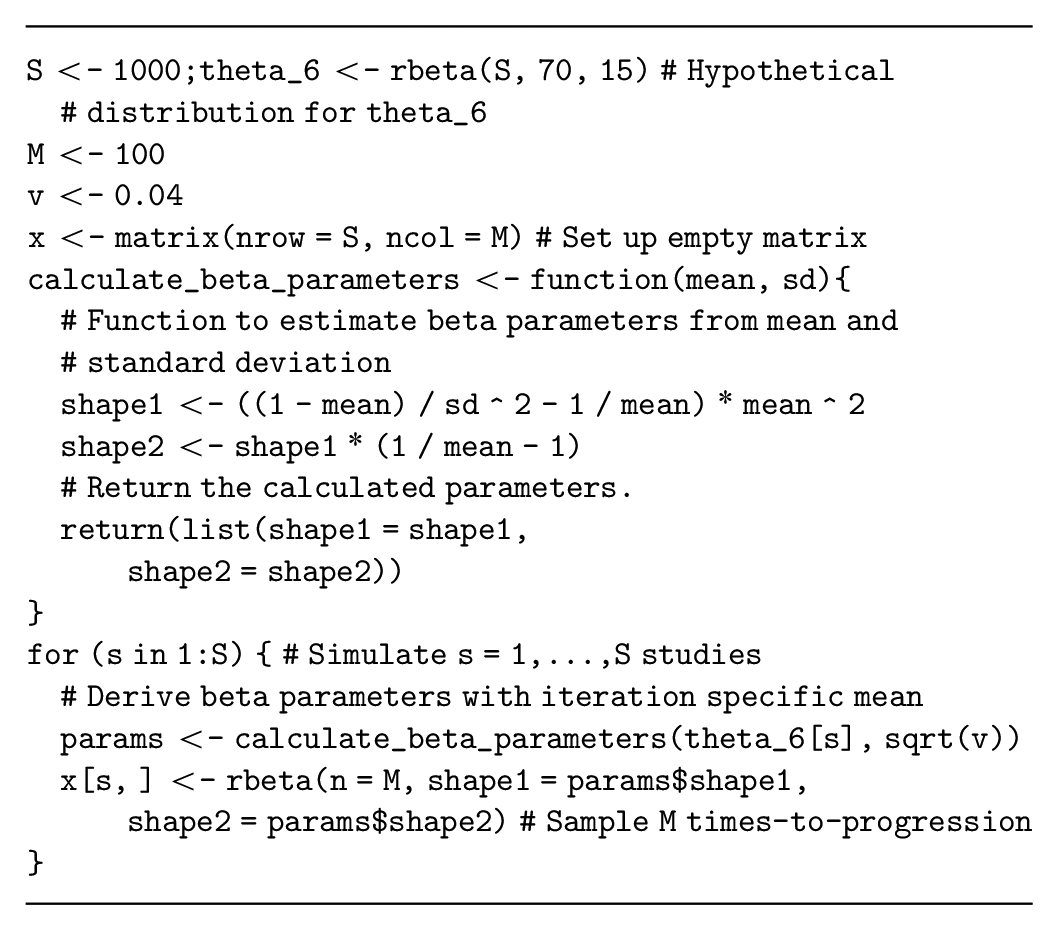
Assume that our decision-analytic model has a parameter,
Alternative time-to-event distributions are also available (e.g., Weibull, Gamma) but have different parameterizations of the data-generating process. These distributions are more complex because they also have more than 1 parameter. Assume that our decision-analytic model is a partitioned survival model with a Weibull distribution estimating progression-free survival times for the current standard treatment and parameterized in terms of
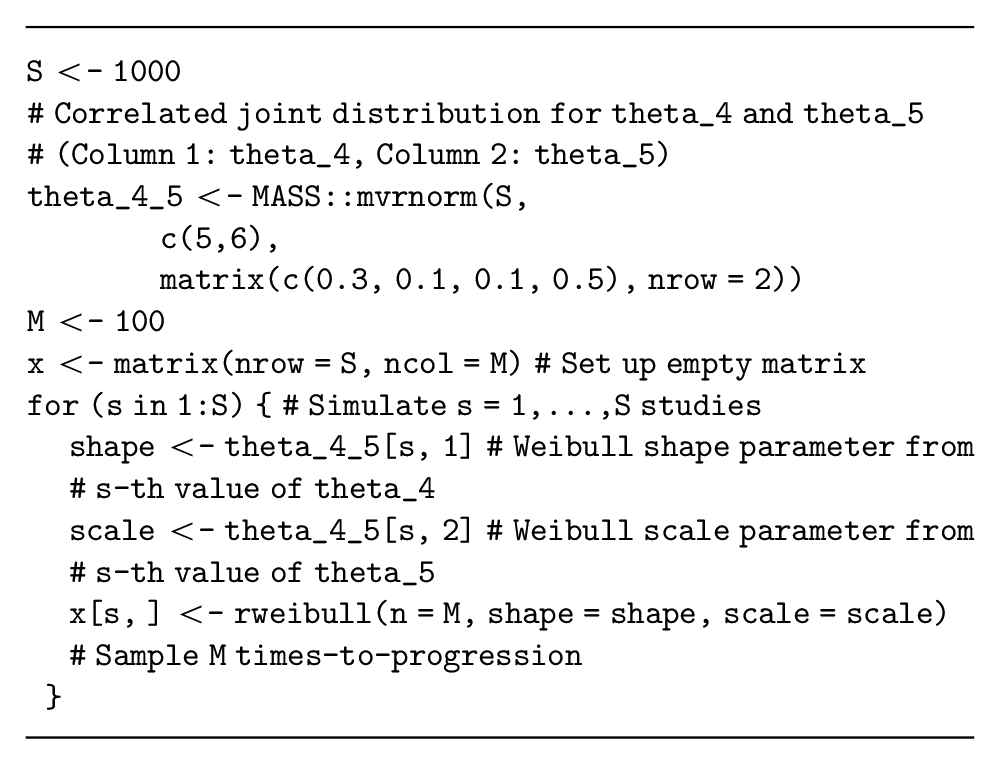
Note that choosing the appropriate individual-level distribution for this data simulation can be challenging, and methods are currently being developed to adapt the EVSI calculation method itself when the survival distribution is unknown. 33 However, these methods still need to simulate from a range of survival distributions and will thus require the methods presented here.
Generating utility data
Next, assume that our health economic model has a parameter,
There are a large range of study types (e.g., those that collect data on costs or resource use) that we are not able to address directly in this tutorial. However, the general-purpose algorithm can be adapted to simulate from the relevant distributions (e.g., log-normal distribution for costs). 1
Multivariate Data Simulation for Complete Datasets
If the proposed study collects more than 1 outcome for each study participant,
Independent multivariate data simulation
If the quantities generated for each participant are assumed to be independent, conditional on
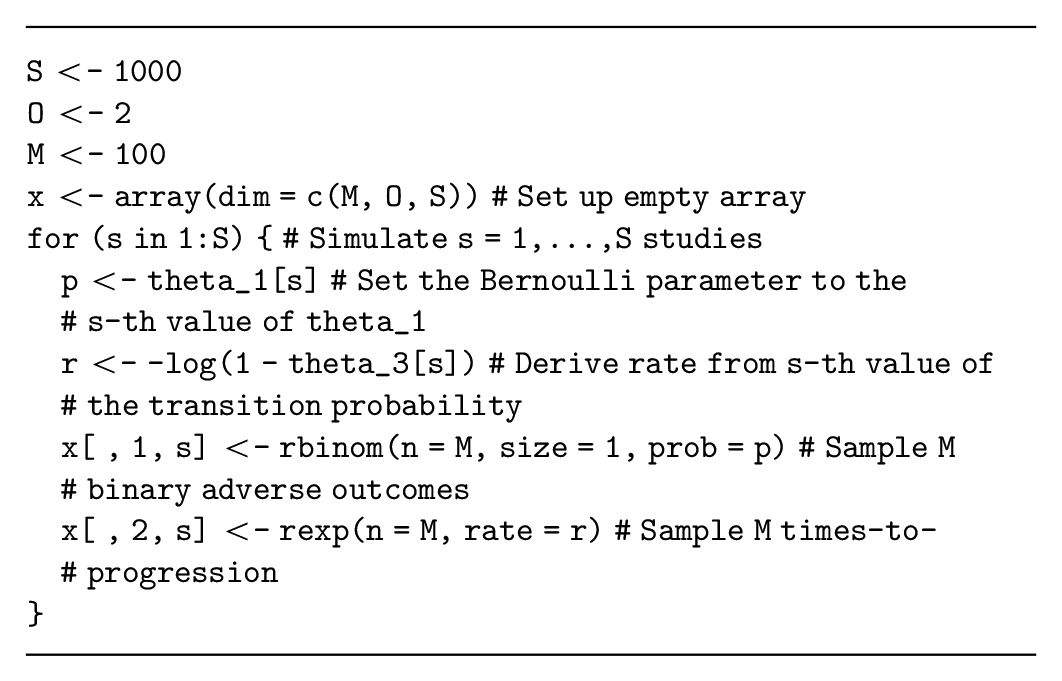
This code does not store the data using the spreadsheet structure demonstrated in Table 1, but it uses a 3-dimensional array with
Dependent multivariate data simulation
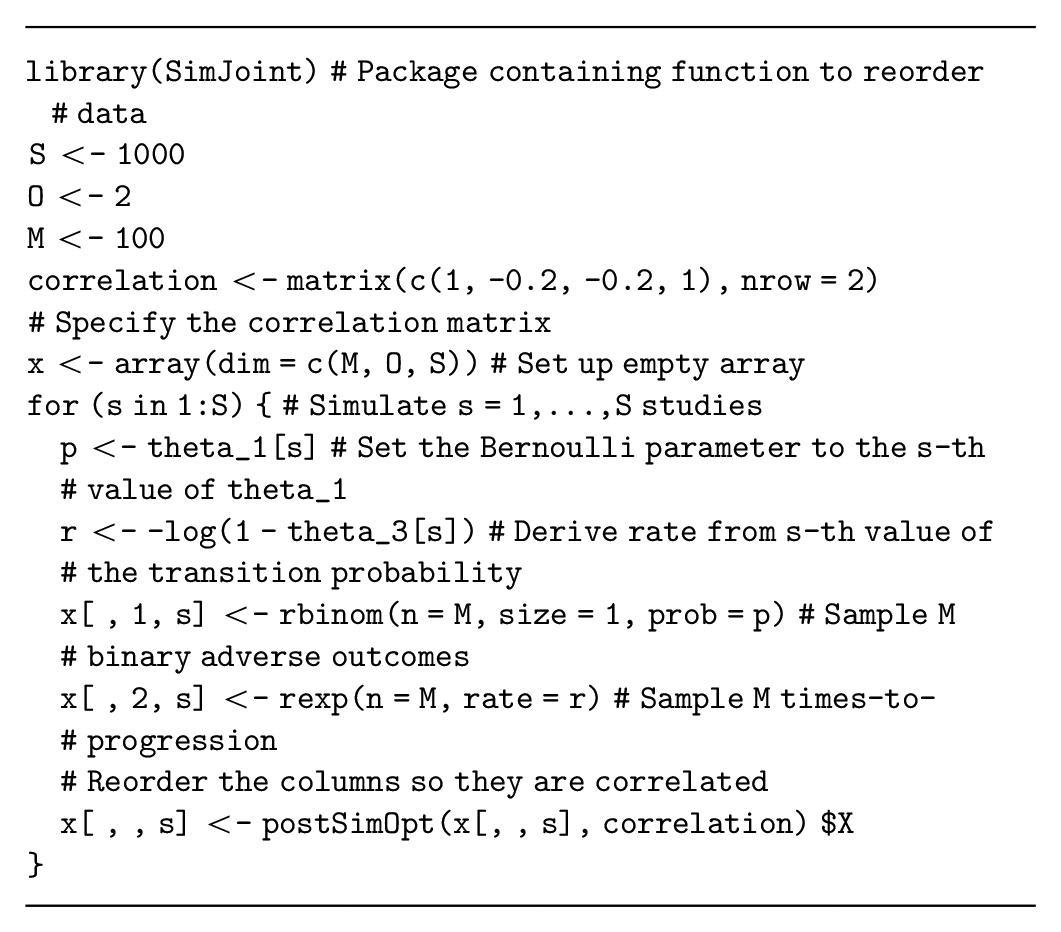
Multivariate data simulation is more complex when the simulated quantities are correlated for each participant (e.g., if participants with shorter survival times are more likely to experience adverse events). This correlation must be specified when we generate multivariate data and can either be assumed fixed or assigned a probability distribution that represents our uncertainty about the correlation. If we ignore the correlation, we are implicitly assuming that it is zero, with certainty. Thus, even if evidence about the correlation structure is lacking, it is important to assess whether this assumption of zero correlation is valid. In general, the correlation can be informed 1) by the literature, although reporting on correlation is often lacking, and you may need to request this information from the authors; 2) by calculating the correlation in available data; or 3) through expert elicitation. 34
One method to generate correlated data initially generates uncorrelated data and then reorders the simulated dataset to achieve the required correlation.35,36 These reordering methods are implemented in the
Correlated data can also be generated using regression to specify the dependencies between the quantities of interest. The regression method decomposes the joint distribution of these quantities into conditional and marginal distributions, where the conditional distributions are defined using regression models. This method can generate data for
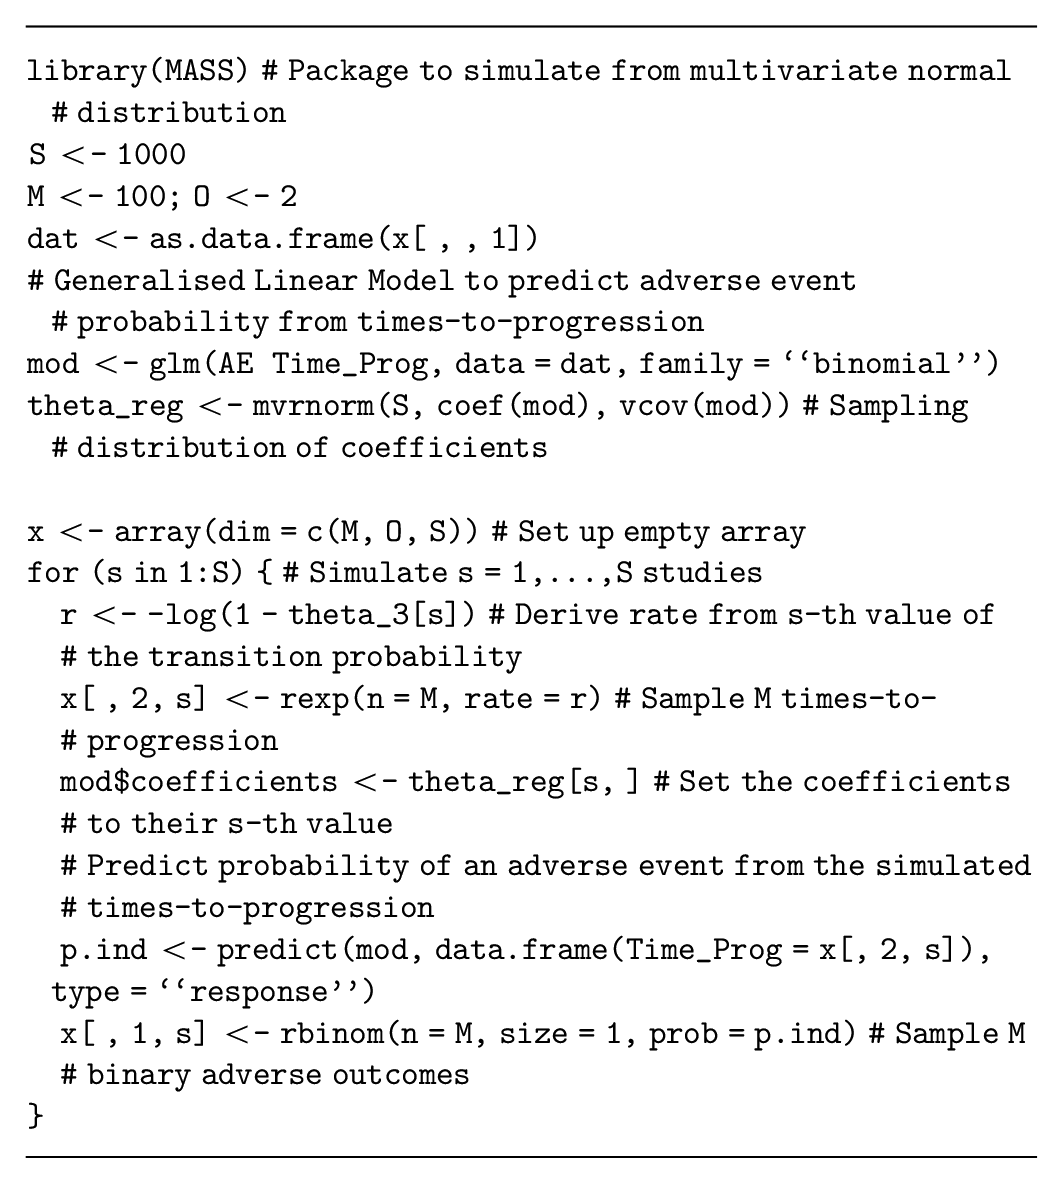
These methods can be combined with the uncorrelated data generation processes to generate both dependent and independent data for the proposed study.
Data on relative effectiveness
Data from a proposed randomized control trial, which updates uncertainty in the log odds ratio of an event on a novel intervention compared to the current standard treatment (
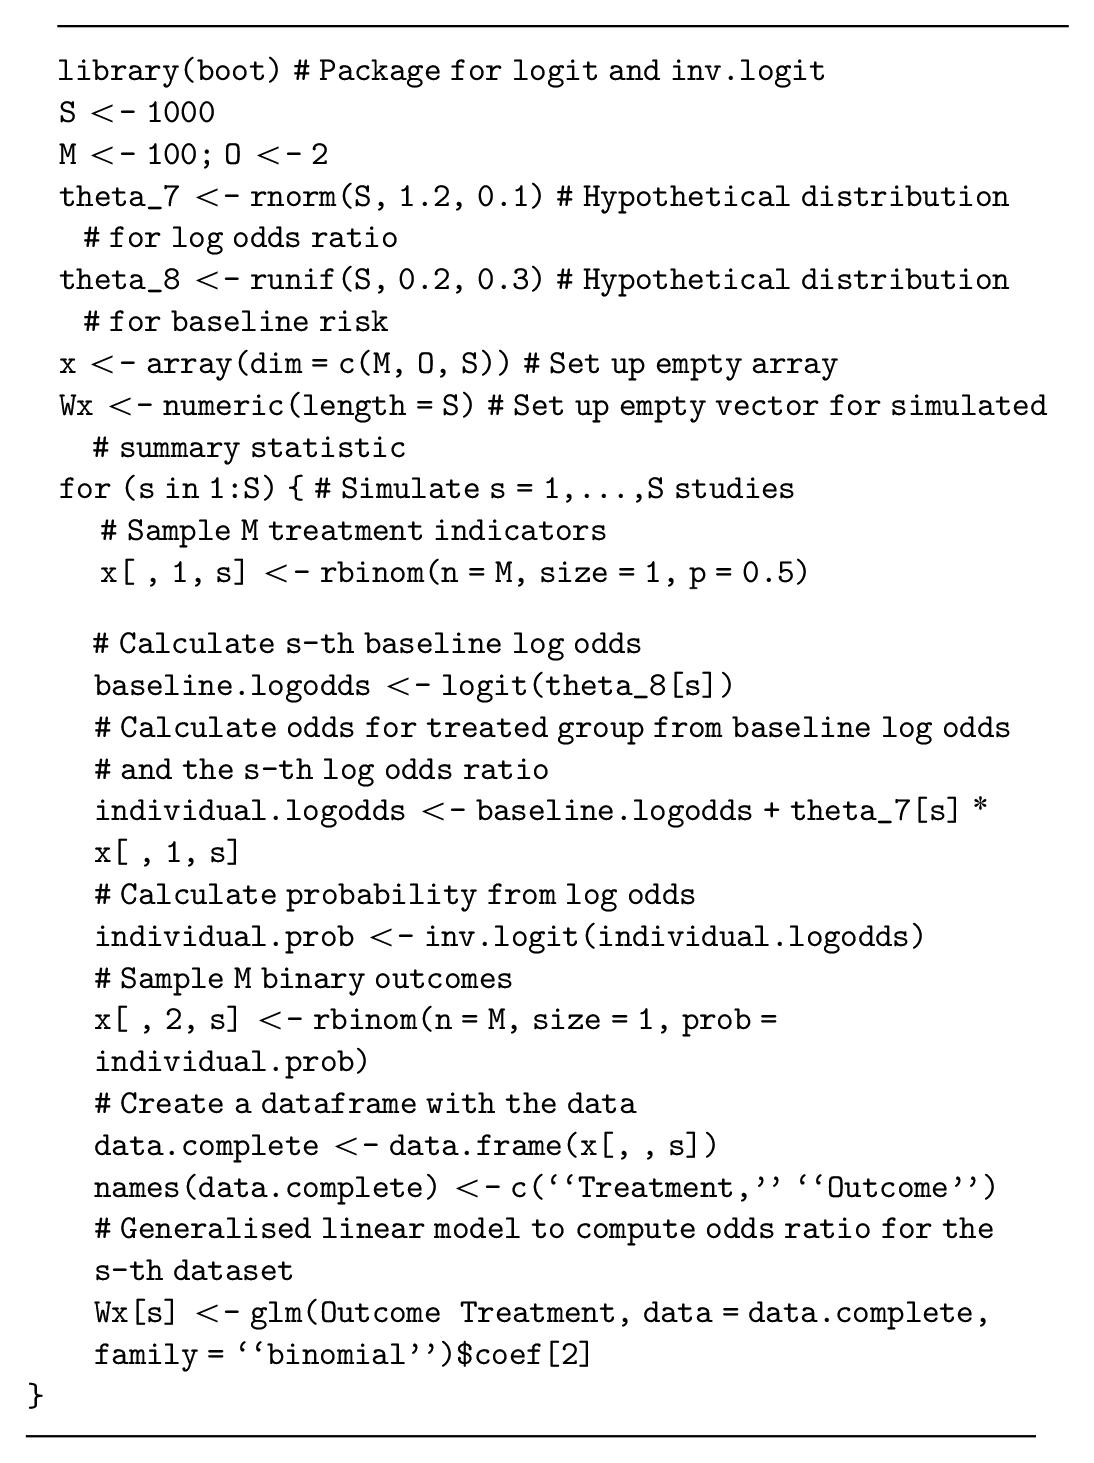
This example uses binary outcomes and log odds ratios as a measure of relative effect. If an alternative outcome type and/or measure of relative effect is used, then this method must be adapted to translate the parameters to the additive scale and back to generate the data. We provide code to implement this method for survival outcomes and log hazard ratios in the supplementary material.
Finally, there are many methods for generating correlated data that are not discussed in this tutorial. Copulas are a class of statistical models that combine univariate marginal distributions and a multivariate correlation structure and can generate correlated data. 38 Elsewhere, methods can ensure that simulated data preserve their rank (i.e., in situations where 1 outcome must be larger than another). 39 Microsimulation models or discrete-event simulations can also generate interrelated individual event data in a highly flexible but more computationally intensive manner.40,41
Realistic Study Designs
Realistic studies can encounter issues with missing values, loss to follow-up, and censoring, which should be included in our data simulation procedure. 6
Missingness
Data that are not recorded during a study (i.e., missing data) are commonly accounted for in study design and analysis. 42 Thus, simulating missing values based on knowledge about the potential rate of missingness will often be required. A “missingness indicator” equals 1 if the participant’s data are missing and 0 otherwise. This can be used to simulate missingness using a Bernoulli distribution with the probability equal to the expected level of missingness, obtained from the literature or expert opinion. Once the missingness indicator has been generated, participants with a missingness indicator of 1 are then “deleted” from the simulated dataset. If the study collects multivariate outcomes, then missingness can be considered separately for each outcome. The simplest type of missingness (i.e., missing completely at random) generates the missingness indicator independent of the quantities of interest 43 with an example assuming 10% missing data given as follows:
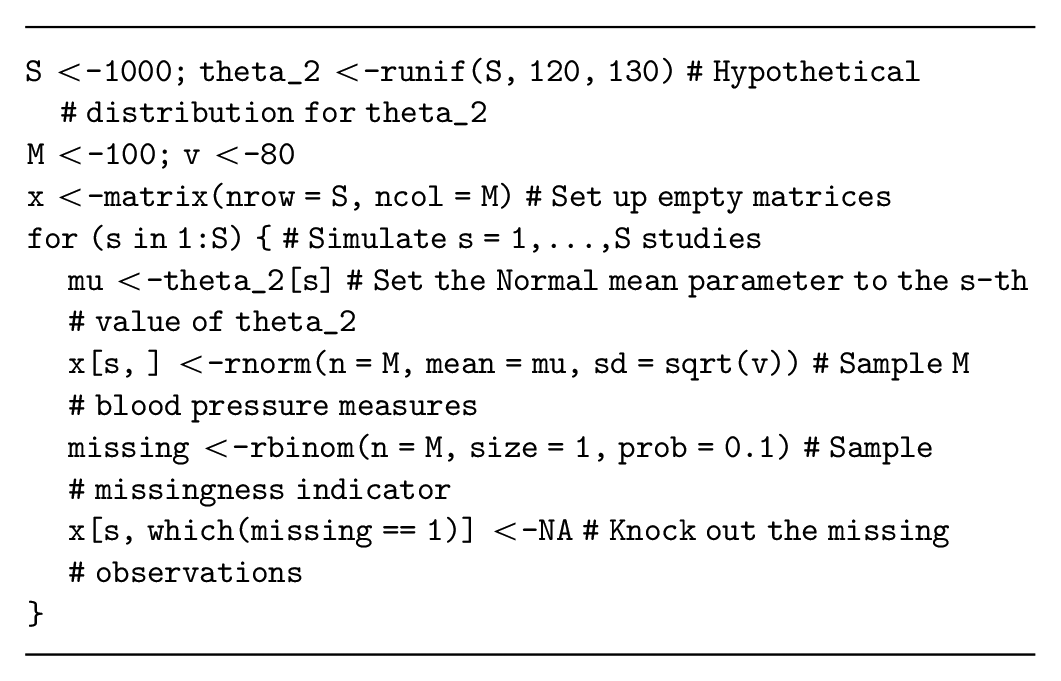
A correlation between the data and the missingness indicator (i.e., where participant outcomes or traits lead to higher levels of missingness) can also be assumed and would induce bias in estimates from the data and EVSI if it is not accounted for properly. If this type of missingness is used, then the method for updating the distribution of the model parameters, based on the data, would also need to be adjusted using common methods for addressing missing data. 42
Censoring in time-to-event data
Censoring is commonly encountered when working with time-to-event data; for example, right-censored data include the information that a participant did not experience an event during the study but do not record when (or if) the event is experienced after the study’s observation period ended. Censoring is modeled by adding a “censoring indicator” to the dataset, which equals 0 if the data point is censored and 1 if it is not. To generate censored survival data, we first generate the event time for each participant from a suitable uncensored model (cf. generating time-to-event data). We then generate a potential “censoring time” for each participant; this can either be a fixed number (i.e., all patients are censored at the end of the study follow-up) or simulated from a different time-to-event distribution with parameters estimated to reflect patterns of dropout or loss to follow-up seen in similar studies. 44 If the censoring event occurs before the event, we change the event time to the censoring time and the censoring indicator to 0. An example where time-to-progression data are censored at 6 months is given as follows:
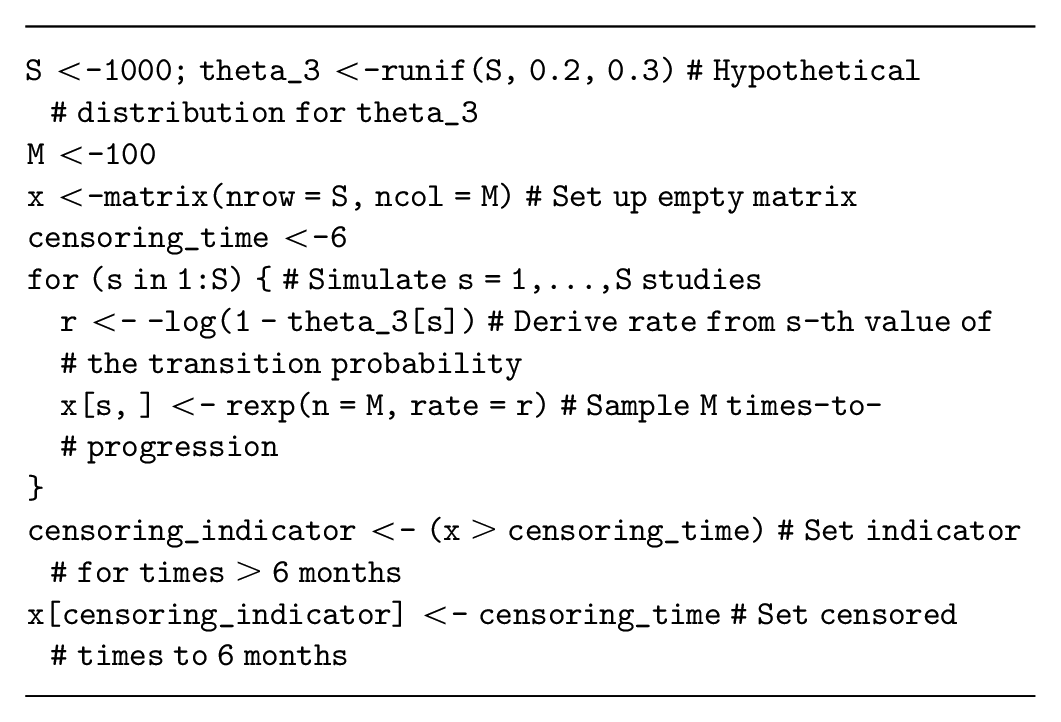
This code implements right-censoring, commonly seen in randomized control trials, but a similar method could simulate left-censored data, where the event time is not observed if it occurs before the censoring time. Finally, interval censoring, where only the time interval in which the event occurs is known, requires a more complex specification.
Simulating Study Outcomes Using Nonparametric Resampling
If the decision-analytic model is based on IPD, we could investigate whether there is value in collecting additional data with the same (or a similar) study design. Given IPD are available, we could generate data in this setting by resampling the IPD and avoid specifying parametric distributions for the data. Resampling from IPD, denoted
Representation of the Bootstrap Estimation Method for the Parameter
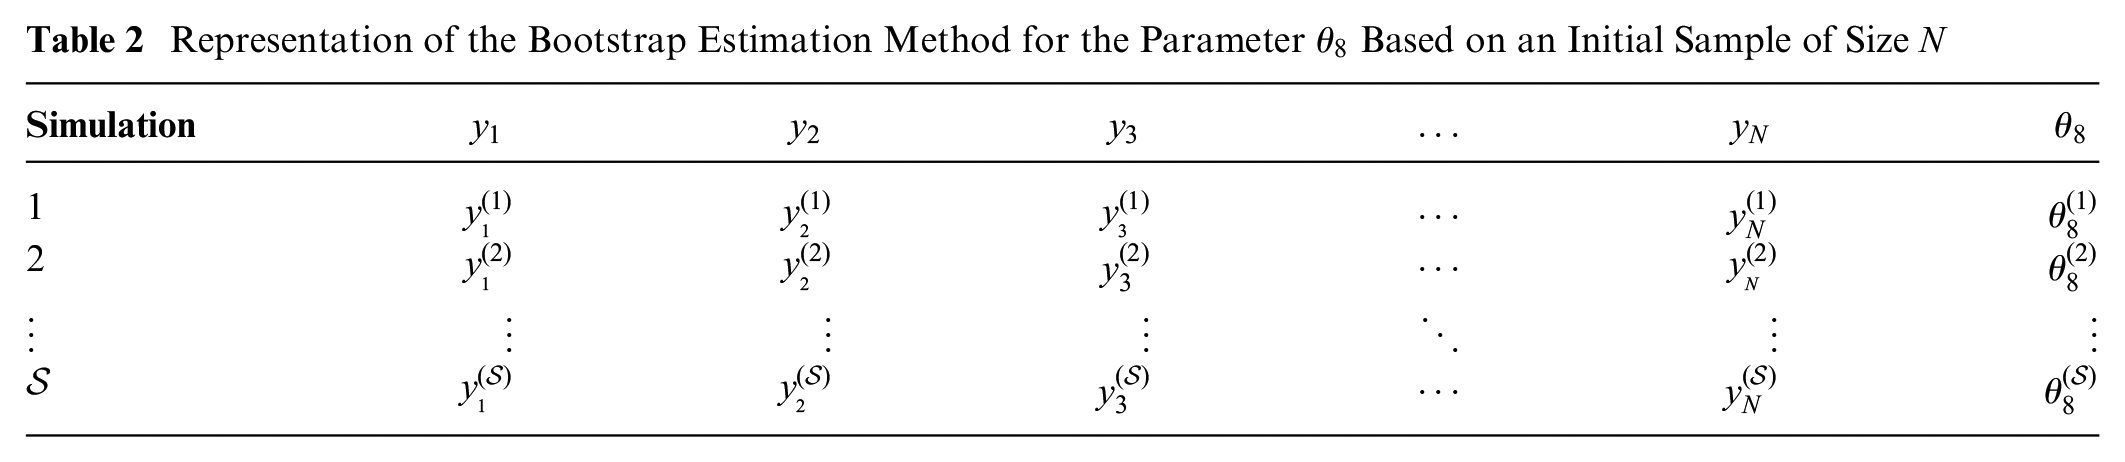
To simulate a dataset from
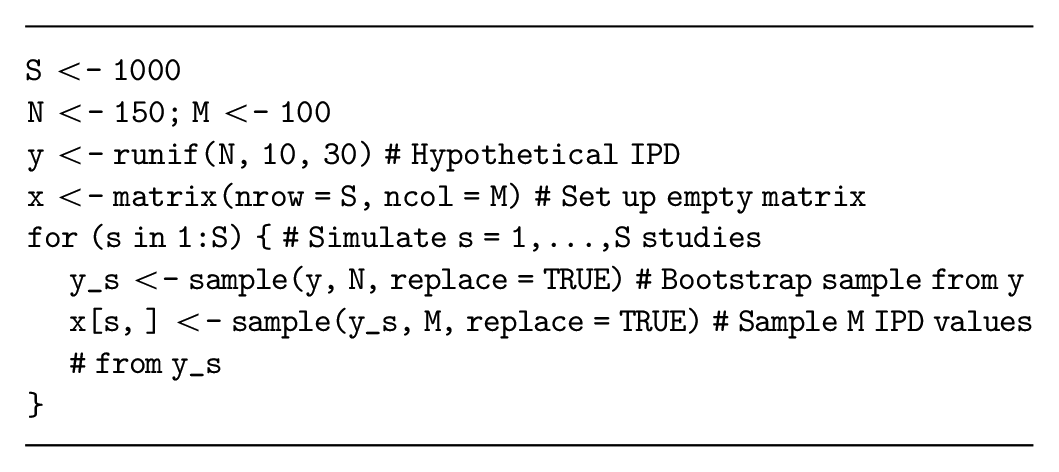
This resampling method can also generate datasets that are similar to the IPD. For example, if the proposed study targets younger participants than the previous study, we could perform a weighted resampling to sample the younger patients more frequently. We could also sample a subset of the quantities from the previous study to evaluate the value of a more targeted study or plan a study with a shorter follow-up.
Once we have generated our resampled datasets, the efficient EVSI estimation procedures require different adaptions to estimate EVSI. Methods that require Bayesian updating (e.g., the standard Monte Carlo method and the moment matching method)
46
must use an adapted bootstrap algorithm, which we are currently developing, to approximate the Bayesian updating without specifying
Discussion
EVSI can be used to optimize study designs to generate data to support decision making in HTA processes, which are often based on decision-analytic models. 47 EVSI can formalize the decision to collect additional information before making policy decisions in health, thereby ensuring that effective and efficient treatments are available to patients.48–50 This tutorial supports the increased use of EVSI by researchers, decision makers, and industry partners by presenting a range of methods to generate simulated datasets for EVSI calculation.
Recent research has allowed practical EVSI calculations through the development of efficient estimation methods,
21
which generally require simulated datasets from a proposed future study. The methods presented in this tutorial can be used to simulate datasets from randomized trials and observational studies with a range of outcome types, including uni- and multivariate datasets. Furthermore, they support the modeling of imperfect study conduct and incomplete data collection. Finally, they are applicable with and without individual patient-level data. We demonstrate these methods using
Accurate EVSI estimation requires realistic data simulation.
6
These datasets should reflect our judgments about the data, encoded in our chosen parameter distributions
As studies can be designed with almost infinite complexities, many study designs that are relevant to health economic decision making could not be included in this tutorial. For example, simulating data on utilities is potentially more complex than the method presented in this tutorial as health states are often ranked, and the data simulation should take this into account, potentially through previously developed methods. 39 Recent research has also proposed methods for EVSI calculation when the survival distribution is unknown and may change based on the future data. 33 Furthermore, studies based on long-term longitudinal cohorts will require complex multivariate data generation and missing data patterns. Finally, the estimation of study costs to compute ENBS and optimize study design has received limited discussion in the literature 3 despite its importance to ensure accurate research prioritization.
Conclusion
This tutorial presents a general-purpose algorithm for generating simulated datasets from a probabilistic analysis and explored common correlated and uncorrelated data types. This method is demonstrated in several examples but can be extended to more complex study designs, as required. Hence, this tutorial facilitates practical EVSI calculations and allows research design and prioritization based on ENBS.
Supplemental Material
sj-txt-5-mdm-10.1177_0272989X211026292 – Supplemental material for Simulating Study Data to Support Expected Value of Sample Information Calculations: A Tutorial
Supplemental material, sj-txt-5-mdm-10.1177_0272989X211026292 for Simulating Study Data to Support Expected Value of Sample Information Calculations: A Tutorial by Anna Heath, Mark Strong, David Glynn, Natalia Kunst, Nicky J. Welton and Jeremy D. Goldhaber-Fiebert in Medical Decision Making
Supplemental Material
sj-txt-6-mdm-10.1177_0272989X211026292 – Supplemental material for Simulating Study Data to Support Expected Value of Sample Information Calculations: A Tutorial
Supplemental material, sj-txt-6-mdm-10.1177_0272989X211026292 for Simulating Study Data to Support Expected Value of Sample Information Calculations: A Tutorial by Anna Heath, Mark Strong, David Glynn, Natalia Kunst, Nicky J. Welton and Jeremy D. Goldhaber-Fiebert in Medical Decision Making
Supplemental Material
sj-xlsx-1-mdm-10.1177_0272989X211026292 – Supplemental material for Simulating Study Data to Support Expected Value of Sample Information Calculations: A Tutorial
Supplemental material, sj-xlsx-1-mdm-10.1177_0272989X211026292 for Simulating Study Data to Support Expected Value of Sample Information Calculations: A Tutorial by Anna Heath, Mark Strong, David Glynn, Natalia Kunst, Nicky J. Welton and Jeremy D. Goldhaber-Fiebert in Medical Decision Making
Supplemental Material
sj-xlsx-2-mdm-10.1177_0272989X211026292 – Supplemental material for Simulating Study Data to Support Expected Value of Sample Information Calculations: A Tutorial
Supplemental material, sj-xlsx-2-mdm-10.1177_0272989X211026292 for Simulating Study Data to Support Expected Value of Sample Information Calculations: A Tutorial by Anna Heath, Mark Strong, David Glynn, Natalia Kunst, Nicky J. Welton and Jeremy D. Goldhaber-Fiebert in Medical Decision Making
Supplemental Material
sj-xlsx-3-mdm-10.1177_0272989X211026292 – Supplemental material for Simulating Study Data to Support Expected Value of Sample Information Calculations: A Tutorial
Supplemental material, sj-xlsx-3-mdm-10.1177_0272989X211026292 for Simulating Study Data to Support Expected Value of Sample Information Calculations: A Tutorial by Anna Heath, Mark Strong, David Glynn, Natalia Kunst, Nicky J. Welton and Jeremy D. Goldhaber-Fiebert in Medical Decision Making
Supplemental Material
sj-xlsx-4-mdm-10.1177_0272989X211026292 – Supplemental material for Simulating Study Data to Support Expected Value of Sample Information Calculations: A Tutorial
Supplemental material, sj-xlsx-4-mdm-10.1177_0272989X211026292 for Simulating Study Data to Support Expected Value of Sample Information Calculations: A Tutorial by Anna Heath, Mark Strong, David Glynn, Natalia Kunst, Nicky J. Welton and Jeremy D. Goldhaber-Fiebert in Medical Decision Making
Footnotes
Acknowledgements
The authors thank the Collaborative Network on Value of Information for their comments and discussion on this manuscript. In particular, the authors thank Ed Wilson, Christopher Jackson, and Fernando Alarid-Escudero for their comments on earlier versions of this manuscript.
The author(s) declared no potential conflicts of interest with respect to the research, authorship, and/or publication of this article.
The author(s) disclosed receipt of the following financial support for the research, authorship, and/or publication of this article: AH was funded in part by an Innovative Clinical Trials Multi-year Grant from the Canadian Institutes of Health Research (funding reference number MYG-151207; 2017–2020), as part of the Strategy for Patient-Oriented Research. MS has no funding to declare. DG has no funding to declare. NK reports funding from the Research Council of Norway (276146 and 304034) and Link Medical Research during the conduct of the study and personal fees from Thermo Fisher Scientific outside the submitted work.
NJW was supported by the NIHR Biomedical Research Centre at University Hospitals Bristol and Weston NHS Foundation Trust and the University of Bristol. JDGF was funded in part by a grant from Stanford’s Precision Health and Integrated Diagnostics Center (PHIND). The views expressed are those of the authors and not necessarily those of the NIHR or the Department of Health and Social Care.
References
Supplementary Material
Please find the following supplemental material available below.
For Open Access articles published under a Creative Commons License, all supplemental material carries the same license as the article it is associated with.
For non-Open Access articles published, all supplemental material carries a non-exclusive license, and permission requests for re-use of supplemental material or any part of supplemental material shall be sent directly to the copyright owner as specified in the copyright notice associated with the article.