
Abstract
Background
When selecting samples for patient preference studies, it may be difficult or impractical to recruit participants who are eligible for a particular treatment decision. However, a general public sample may not be an appropriate proxy.
Objective
This study compares preferences for rheumatoid arthritis (RA) preventive treatments between members of the general public and first-degree relatives (FDRs) of confirmed RA patients to assess whether a sample of the general public can be used as a proxy for FDRs.
Methods
Participants were asked to imagine they were experiencing arthralgia and had screening tests indicating a 60% chance of developing RA within 2 yrs. Using a discrete choice experiment, participants were offered a series of choices between no treatment and 2 unlabeled hypothetical treatments to reduce the risk of RA. To assess data quality, time to complete survey sections and comprehension questions were assessed. A random parameter logit model was used to obtain attribute-level estimates, which were used to calculate relative importance, maximum acceptable risk (MAR), and market shares of hypothetical preventive treatments.
Results
The FDR sample (n = 298) spent more time completing the survey and performed better on comprehension questions compared with the general public sample (n = 982). The relative importance ranking was similar between the general public and FDR participant samples; however, other relative preference measures involving weights including MARs and market share differed between groups, with FDRs having numerically higher MARs.
Conclusion
In the context of RA prevention, the general public (average risk) may be a reasonable proxy for a more at-risk sample (FDRs) for overall relative importance ranking but not weights. The rationale for a proxy sample should be clearly justified.
Highlights
Participants from the general public were compared to first-degree relatives on their preferences for rheumatoid arthritis (RA) preventive treatments using a discrete choice experiment.
Preferences were similar between groups in terms of the most important and least important attributes of preventive treatments, with effectiveness being the most important attribute. However, relative weights differed.
Attention to the survey and predicted market shares of hypothetical RA preventive treatments differed between the general public and first-degree relatives.
The general public may be a reasonable proxy for an at-risk group for patient preferences ranks but not weights in the disease prevention context; however, care should be taken in sample selection for patient preference studies when choosing nonpatients.
Keywords
Studies of patient preferences are increasingly used as part of patient-focused medical product development. Recent studies investigated how patient preferences might be incorporated in decision making.1–5 Patient treatment preferences are considered as supportive information when making health technology assessment (HTA) decisions relating to formulary and reimbursement 6 and when making benefit-risk decisions. 7 According to the Food and Drug Administration (FDA) guidance on the use of patient preferences, if a number of well-informed patients have preferences accepting the benefit-risk tradeoffs of a medical product, this might provide support of a favorable benefit-risk assessment. 7
Careful identification of the study sample in a preference study via inclusion criteria, sampling frame, and recruitment method is critical for ensuring generalizability of study findings to a target population. This can be straightforward using online or clinic-based recruitment for individuals with a condition and eligibility for a specific intervention. However, sample selection may present challenges in the case of a new treatment or preventive treatment, for example, when the disease is rare (e.g., progeria, a genetic condition) or when clinical screening is required to identify potential participants (e.g., amyloid plaques on the brain as a biomarker for future risk of Alzheimer’s disease). Embedding a preference study in a clinical trial may be possible with limitations on generalizability, as willingness to participate in a trial reveals risk tolerance and preferences for treatments that are unlikely to reflect the overall target population.8–12
Using general public samples in preference studies, participants are asked to assume a certain level of risk or disease status, which can have practical advantages over recruiting a patient sample. First, members of the general public are relatively easy to recruit. Second, this approach avoids burdening patients or high-risk groups by asking them to participate in research projects. Lastly, research companies can facilitate the recruitment and participation of representative samples of the general public efficiently in terms of time and budget.
Although general public samples could be representative of the target population in some decision contexts, such as screening or disease prevention, this representativeness might be impacted by characteristics that affect their investment in the decision at hand. Other studies have identified that psychological distance, defined as temporal distance or experience relating to the decision, affects patient preferences. 13 A general public sample (i.e., the taxpayer) whose preferences may differ from those who are directly affected (e.g., patients, at-risk individuals) may also be chosen for resource allocations in a health care system. 14 Research systematically comparing preferences of the general public versus either at-risk or patient populations is sparce.
Rheumatoid arthritis (RA) is a common progressive destructive condition of the joints.15,16 Long-term disease-modifying treatments can slow progression but are associated with side effects including infection and malignancy. 17 Early treatment of RA is associated with improved outcomes, including reduced joint damage.18,19 The risk of developing RA in first-degree relatives (FDRs) of RA patients is approximately 4 times higher than that of the general public. 20 There is increasing evidence that a time-limited course of treatment for individuals at risk of RA may prevent or delay its onset. 21 The objective of the current analysis was to compare preferences for RA preventive treatments between a general public sample and FDRs of confirmed RA patients to assess whether the former can be used as a proxy for the latter.
Methods
Participants and Recruitment
The RA preference study protocol has been published previously. 22 Briefly, members of the general public, aged 18 yrs and older, without RA, were recruited in the United Kingdom (UK) via an online survey panel (Survey Engine). 22 FDRs of patients with confirmed RA in the UK were invited to participate in the Web-based survey indirectly, through patients with RA. Patients with RA were approached at outpatient clinic visits or via mail and asked to provide the invitation to their FDRs. FDRs enrolled in a UK prospective cohort (PREVeNT-RA; http://www.preventra.net/), were also invited to participate via e-mail. Participants provided informed consent. Upon completion of the survey, the general public participants received £2 British Pounds Sterling in panel points, and FDRs received a £5 online shopping voucher.
Using an age- and sex-stratified sampling scheme based on the distribution from a prior RA prevention study in FDRs, 23 the general public sample was designed to be similar in age and sex demographic composition to the expected FDR sample. Recruitment of the general public via the survey panel continued until 1,000 surveys were completed (November 26, 2020, to December 15, 2020). The recruitment of FDRs remained open for 4 mo (November 26, 2020, to March 22, 2021) with approximately 250 participants expected. These sample sizes were chosen to have sufficient size to allow examination of preferences and preference heterogeneity.24,25 The London-Hampstead Research Ethics Committee approved this study.
Attributes, Levels, and Experimental Design
Attributes were identified using a rigorous process in line with good-practice guidelines, 26 based on a literature review 27 and a qualitative phase using focus groups and individual interviews with attribute-ranking exercises using the nominal group technique.22,28 The final selection of attributes and levels was determined by an international multidisciplinary team of clinical researchers, preference elicitation experts, and patient research partners (Table 1).
Discrete Choice Experiment Attributes and Levels
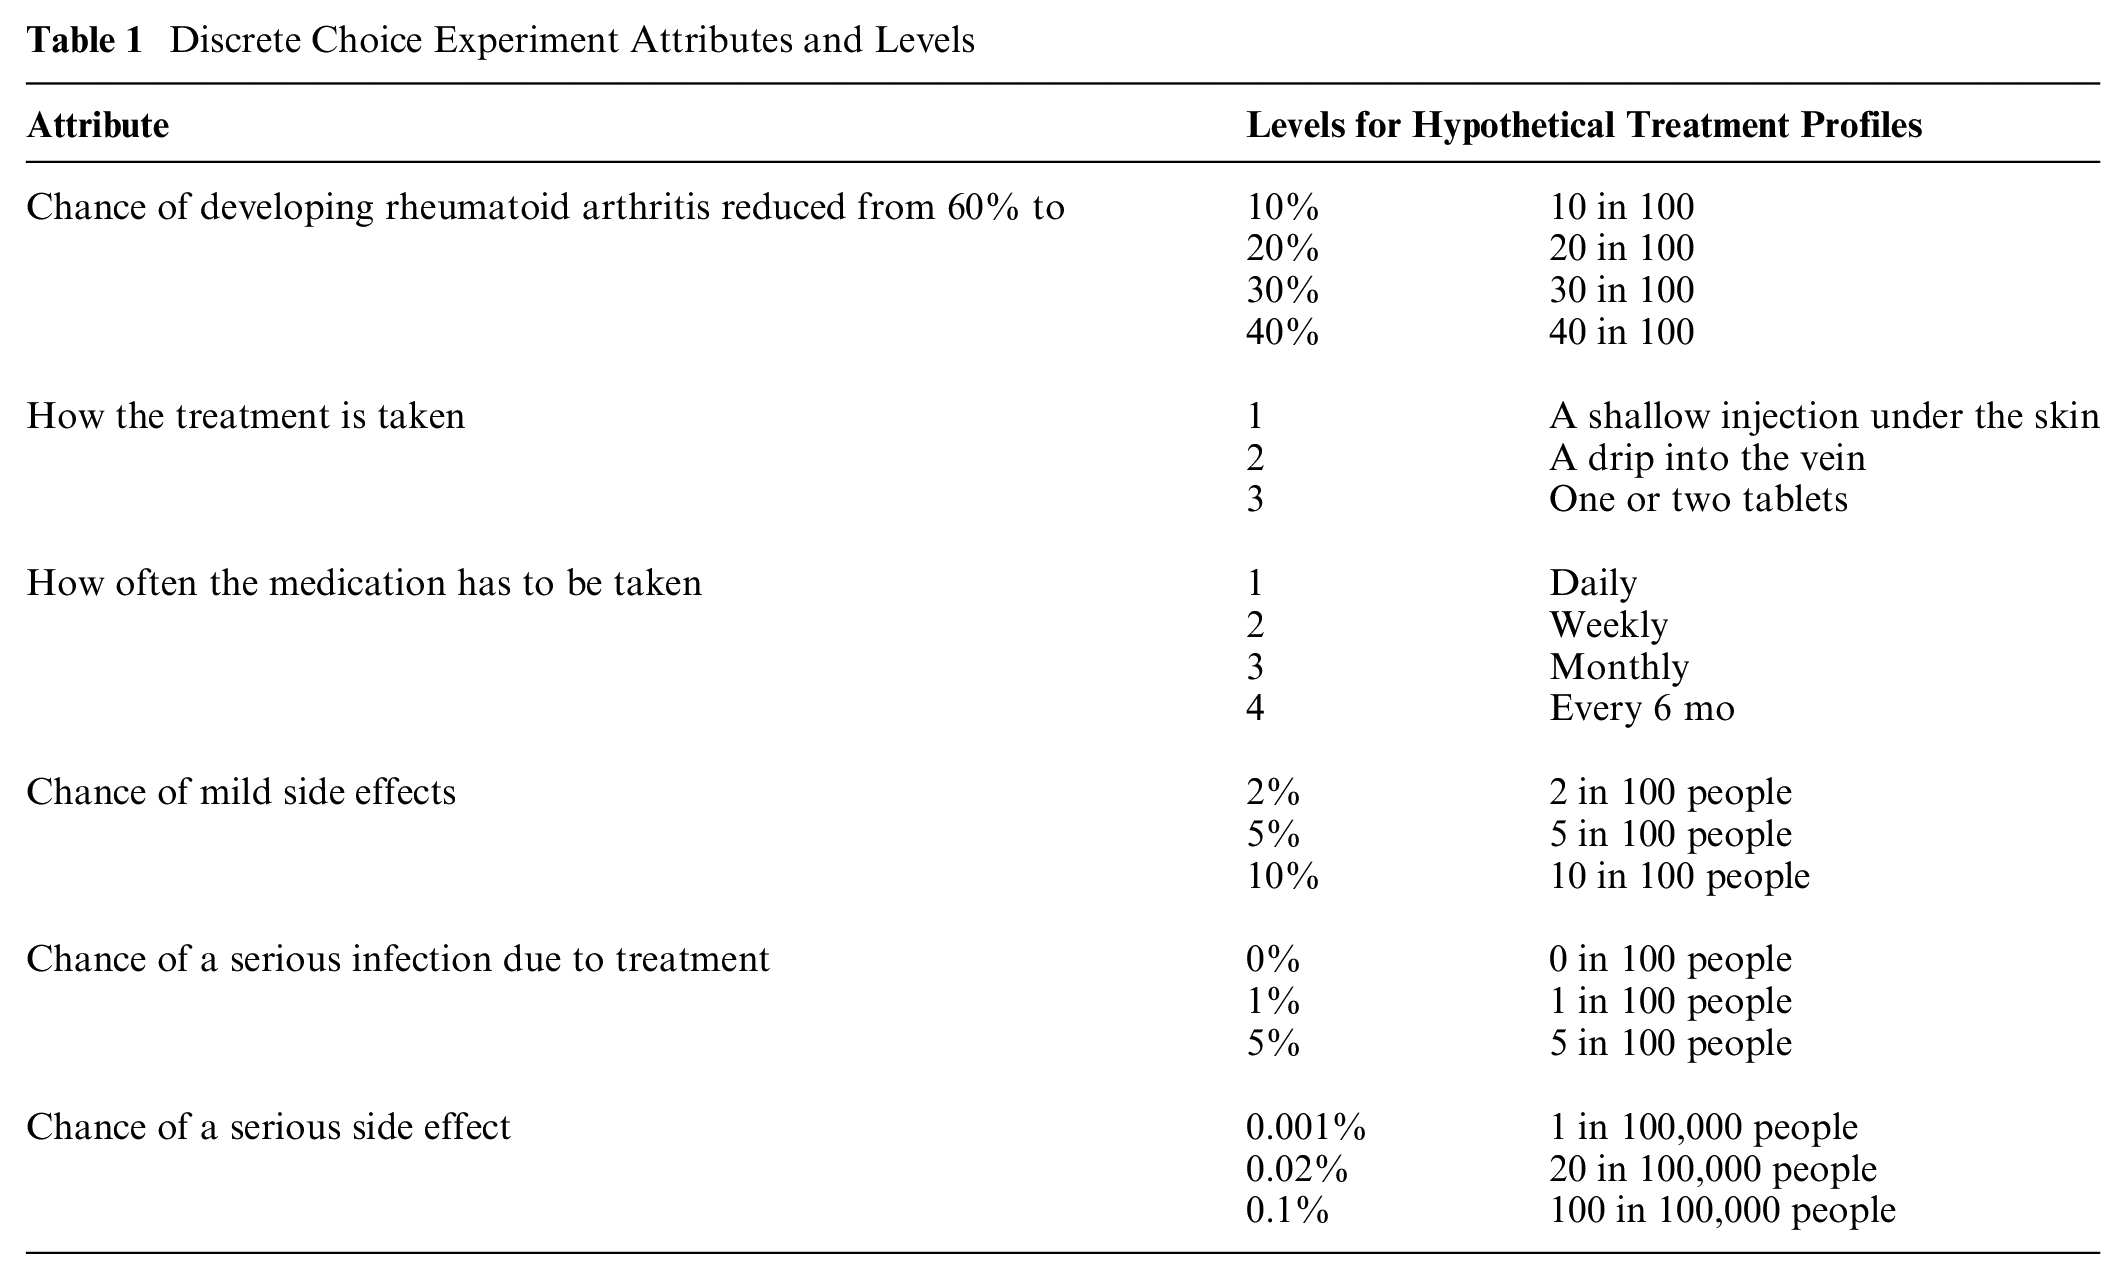
Participants were randomized to 1 of 4 blocks of 15 questions each (60 unique choice tasks) based on a prespecified Bayesian D-efficient design using Ngene software (ChoiceMetrics). 29 Each question included the choice between 2 treatment profiles and an opt-out profile (i.e., no treatment), the latter showing no reduction in the chance of developing RA and no side effects (Appendix 1). The design was restricted to exclude unrealistic combinations of attribute levels including taking a pill every month or every 6 mo, having an injection daily, or having a drip daily or weekly. In addition, interactions between effectiveness and chance of a serious infection and between effectiveness and chance of serious side effects were included in the design. Finally, the design was optimized for level and utility balance.
Survey, Pretesting, and Pilot Testing
The online survey consisted of 5 sections: 1) demographic questionnaire; 2) warm-up information about RA and RA risk factors and 3 questions checking comprehension of, as well as attention to, the provided information (see Appendix 1, Table 3 footnote; these questions related to understanding the risk grid [e.g., icon array with 60 red figures and 40 light gray figures] and choosing knowledge about RA risk factors and prevalence); 3) discrete choice experiment (DCE); 4) the Single Item Literacy Screener (SILS), 30 which measures health literacy, and the 3-item version of the Subjective Numeracy Scale (SNS-3), 31 which assesses participants’ perceived ability to work with fractions, calculate a discount, and perceived usefulness of numerical information (6-point Likert-type scales; sum range: 3–18 with higher scores indicate higher subjective numeracy); 5) feedback about how easy the DCE choice questions were to understand and to answer (5-point Likert-type ranging scale from very difficult to very easy, Appendix 1); and 6) perceived lifetime risk of developing RA on a 5-point Likert-type scale (very unlikely to very likely). Other items were also included in the survey but do not form part of the current analysis. 22 The survey instrument was developed in collaboration with patient research partners.
Prior to the DCE, attributes and levels were explained in detail, and examples of choice tasks were provided. Participants were asked to imagine they had started to develop joint pain and had received test results that indicated they had a 60% risk of developing RA in the following 2 yrs. During the choice task, participants could view explanations of the attribute and the levels using pop-up windows (Appendix 1).
The survey was pretested in a convenience sample (n = 15) of members from the general public, FDRs of patients with RA, and patient research partners in the UK using qualitative think-aloud interviews and written feedback forms with £20 renumeration in shopping vouchers. The purpose was to evaluate the online survey system, remove software bugs, and change the wording if necessary. To optimize the statistical efficiency of the final DCE experimental design, an online survey pilot was conducted on the first 100 members recruited into the general public sample. Outcomes were analyzed with multinominal logit models, and attribute-level estimates were used to update the priors included in the Bayesian efficient design.
Data Analysis
Data were analyzed using Nlogit 6, and outcomes were considered significant at P < 0.05. Data quality was examined for the general public and FDR samples separately, by examining the times for completing sections of the survey (overall survey, RA explanation, and attribute descriptions). In addition, quality was assessed based on flatlining behavior (e.g., always picking option “A” regardless of choices) and participant performance on the comprehension questions. Given the survey length and pretesting, the survey was felt to take at least 10 min. Surveys were excluded if completed in less than 5 min. Survey data were excluded if the respondent took between 5 min and less than 10 min and appeared to be nonattendant by answering 2 of the 3 comprehension questions incorrectly and by exhibiting flatlining behavior in the DCE tasks. Results were considered statistically significant if P ≤ 0.05.
Descriptive statistics and DCE modeling were conducted separately for the general public and FDR samples. For the SILS, the proportion in each sample that was considered to have low health literacy (SILS > 2, i.e., who answered they “sometimes,” “often,” or “always” need help with written health materials) was calculated. Chi-square tests of proportions (categorical data) and Mann–Whitney U tests (ordinal data) were conducted to examine differences between the 2 groups. Median values and the interquartile range were reported for ordinal data.
Random parameter logit (RPL) models were constructed to adjust for the multilevel structure of the data to be able to account for preference heterogeneity. 32 The linearity of all noncategorical attributes was assessed visually by plotting the coefficients and based on a dummy variable in a spline function. Variables were included as either linear or categorical (using effects codes33,34) in the utility function, except for effectiveness, for which linearity was assumed to facilitate maximum acceptable risk (MAR) calculations. The contributions of interaction terms that were prespecified in the experimental design were tested (i.e., effectiveness-serious infection and effectiveness-serious side effects) and included in the final model if they significantly contributed to model fit based on the likelihood ratio test.
All attributes were included as random parameters. Based on a model fit test, it was determined what distribution should be assumed for those parameters (normal, triangular, or lognormal). The best fitting model was determined for each data set. The final model specifications are provided in Appendix 1. When comparing the attribute-level estimates of 2 data sets, the role of the scale parameter was accounted for as the attribute-level estimates are a ratio of the true parameter estimates and a scale parameter. 35 Attribute-level estimates of different data sets were compared using a scale adjustment such that any differences due to the scale parameter were excluded. 36 For that reason, the Swait and Louviere test was applied. 36
When the risk attribute was linearly coded, the MAR was calculated by the ratio of efficacy and individual risk parameters, where MAR = [−(βChance if developing RA)/(βrisk)]. When a risk attribute was effects coded, linearity was assumed between the 2 highest risk levels; this was further extrapolated beyond the levels included in the DCE experiment. Calculations were made based on individual attribute level estimates retrieved from the RPL model.
Market shares were tabulated for 4 hypothetical RA preventive treatment profiles and a no treatment opt out, where attribute levels were estimated with input from researchers leading RA prevention studies to mimic plausible treatments. The mean of the individual market shares was calculated by estimating the individuals’ utility for each treatment compared with the individuals’ utility of the other treatments and the no treatment opt out. Thereafter, the probability of this choice was calculated and averaged across the full sample.
When comparing the level of agreement of preferences between samples, this was not a strict comparison of empirical results. Model results may vary between any 2 samples given modest differences in sample composition (i.e., patient characteristics that affect preferences), model specification, and/or sample size (i.e., precision). In our study, we considered the results (obtained when fitting the model appropriate for each sample as would be applied in usual practice) to agree between samples if they would lead to the same decision during medical product development. Decision making of this kind could include the following: “Which pharmaceutical product profile of several candidates is most in line with patient preferences?” “What treatment attribute is most important to patients?” or “Is the performance of a medical product consistent with patients’ tolerance of treatment risks?” The required precision for decision making depends on the question, for example, whether relative ranking versus relative weighting of treatment attributes might be needed for the decision. In addition, required precision may vary based on context; for example, decisions in earlier development (e.g., go/no go decisions) may require less precision than those in later development, such as submission to a health authority.
The funding agreement ensured the authors’ independence in designing the study, interpreting the data, writing, and publishing the report. The funding source for this study had no role in the study.
Results
Participant Characteristics
A total of 289 FDRs completed the survey (197 recruited from the PReVENT-RA cohort and 92 through RA patients in clinics). None of the 289 surveys completed by FDRs were excluded. In the general public, 1,003 completed the survey and 21 were removed from the analysis due to suspected low quality (i.e., speeding and/or flatlining behaviors). Most (n = 20) answered the survey in less than 5 min (i.e. speeding); 11 of those 20 also exhibited flatlining behavior, and 1 additional individual exhibited flatlining but not speeding behaviors. Forty percent of the general public (n = 403) answered 2 or 3 of 3 comprehension questions incorrectly in the first try (including all 21 of the speeders and flatliners removed from the analysis). This resulted in data being available from 982 surveys from the general public and from 289 FDR (Table 2). Most participants in both samples were female (≥66%), White (>85%), and employed full-time or part-time (≥59%). However, the general public sample had a higher percentage of male participants, a higher percentage of non-White participants, tended to be younger, and had lower educational attainment compared with the FDR sample. Both samples had relatively high health literacy and numeracy; however, on average, the general public had significantly lower numeracy scores (SNS-3) compared with the FDR sample, and a significantly larger proportion of the general population had a low health literacy score compared with the FDR sample (SILS > 2; 22.8% v. 3.8%; see also Table 2). The general public reported significantly lower perceived chance that they would develop RA in their lifetime relative to the FDR group. Self-reported family history of RA in the general public sample was about evenly split between 5 response categories, with the most common answer being “Don’t know” (definitely not: 21.4%; probably not: 20.9%; don’t know: 24.9%; probably: 16.6%; definitely: 16.2%). Among the one-third of participants reporting probably or definitely having a family member with RA (n = 328), most (n = 247, 75%) reported RA in a parent or a sibling.
Demographic Characteristics by Sample
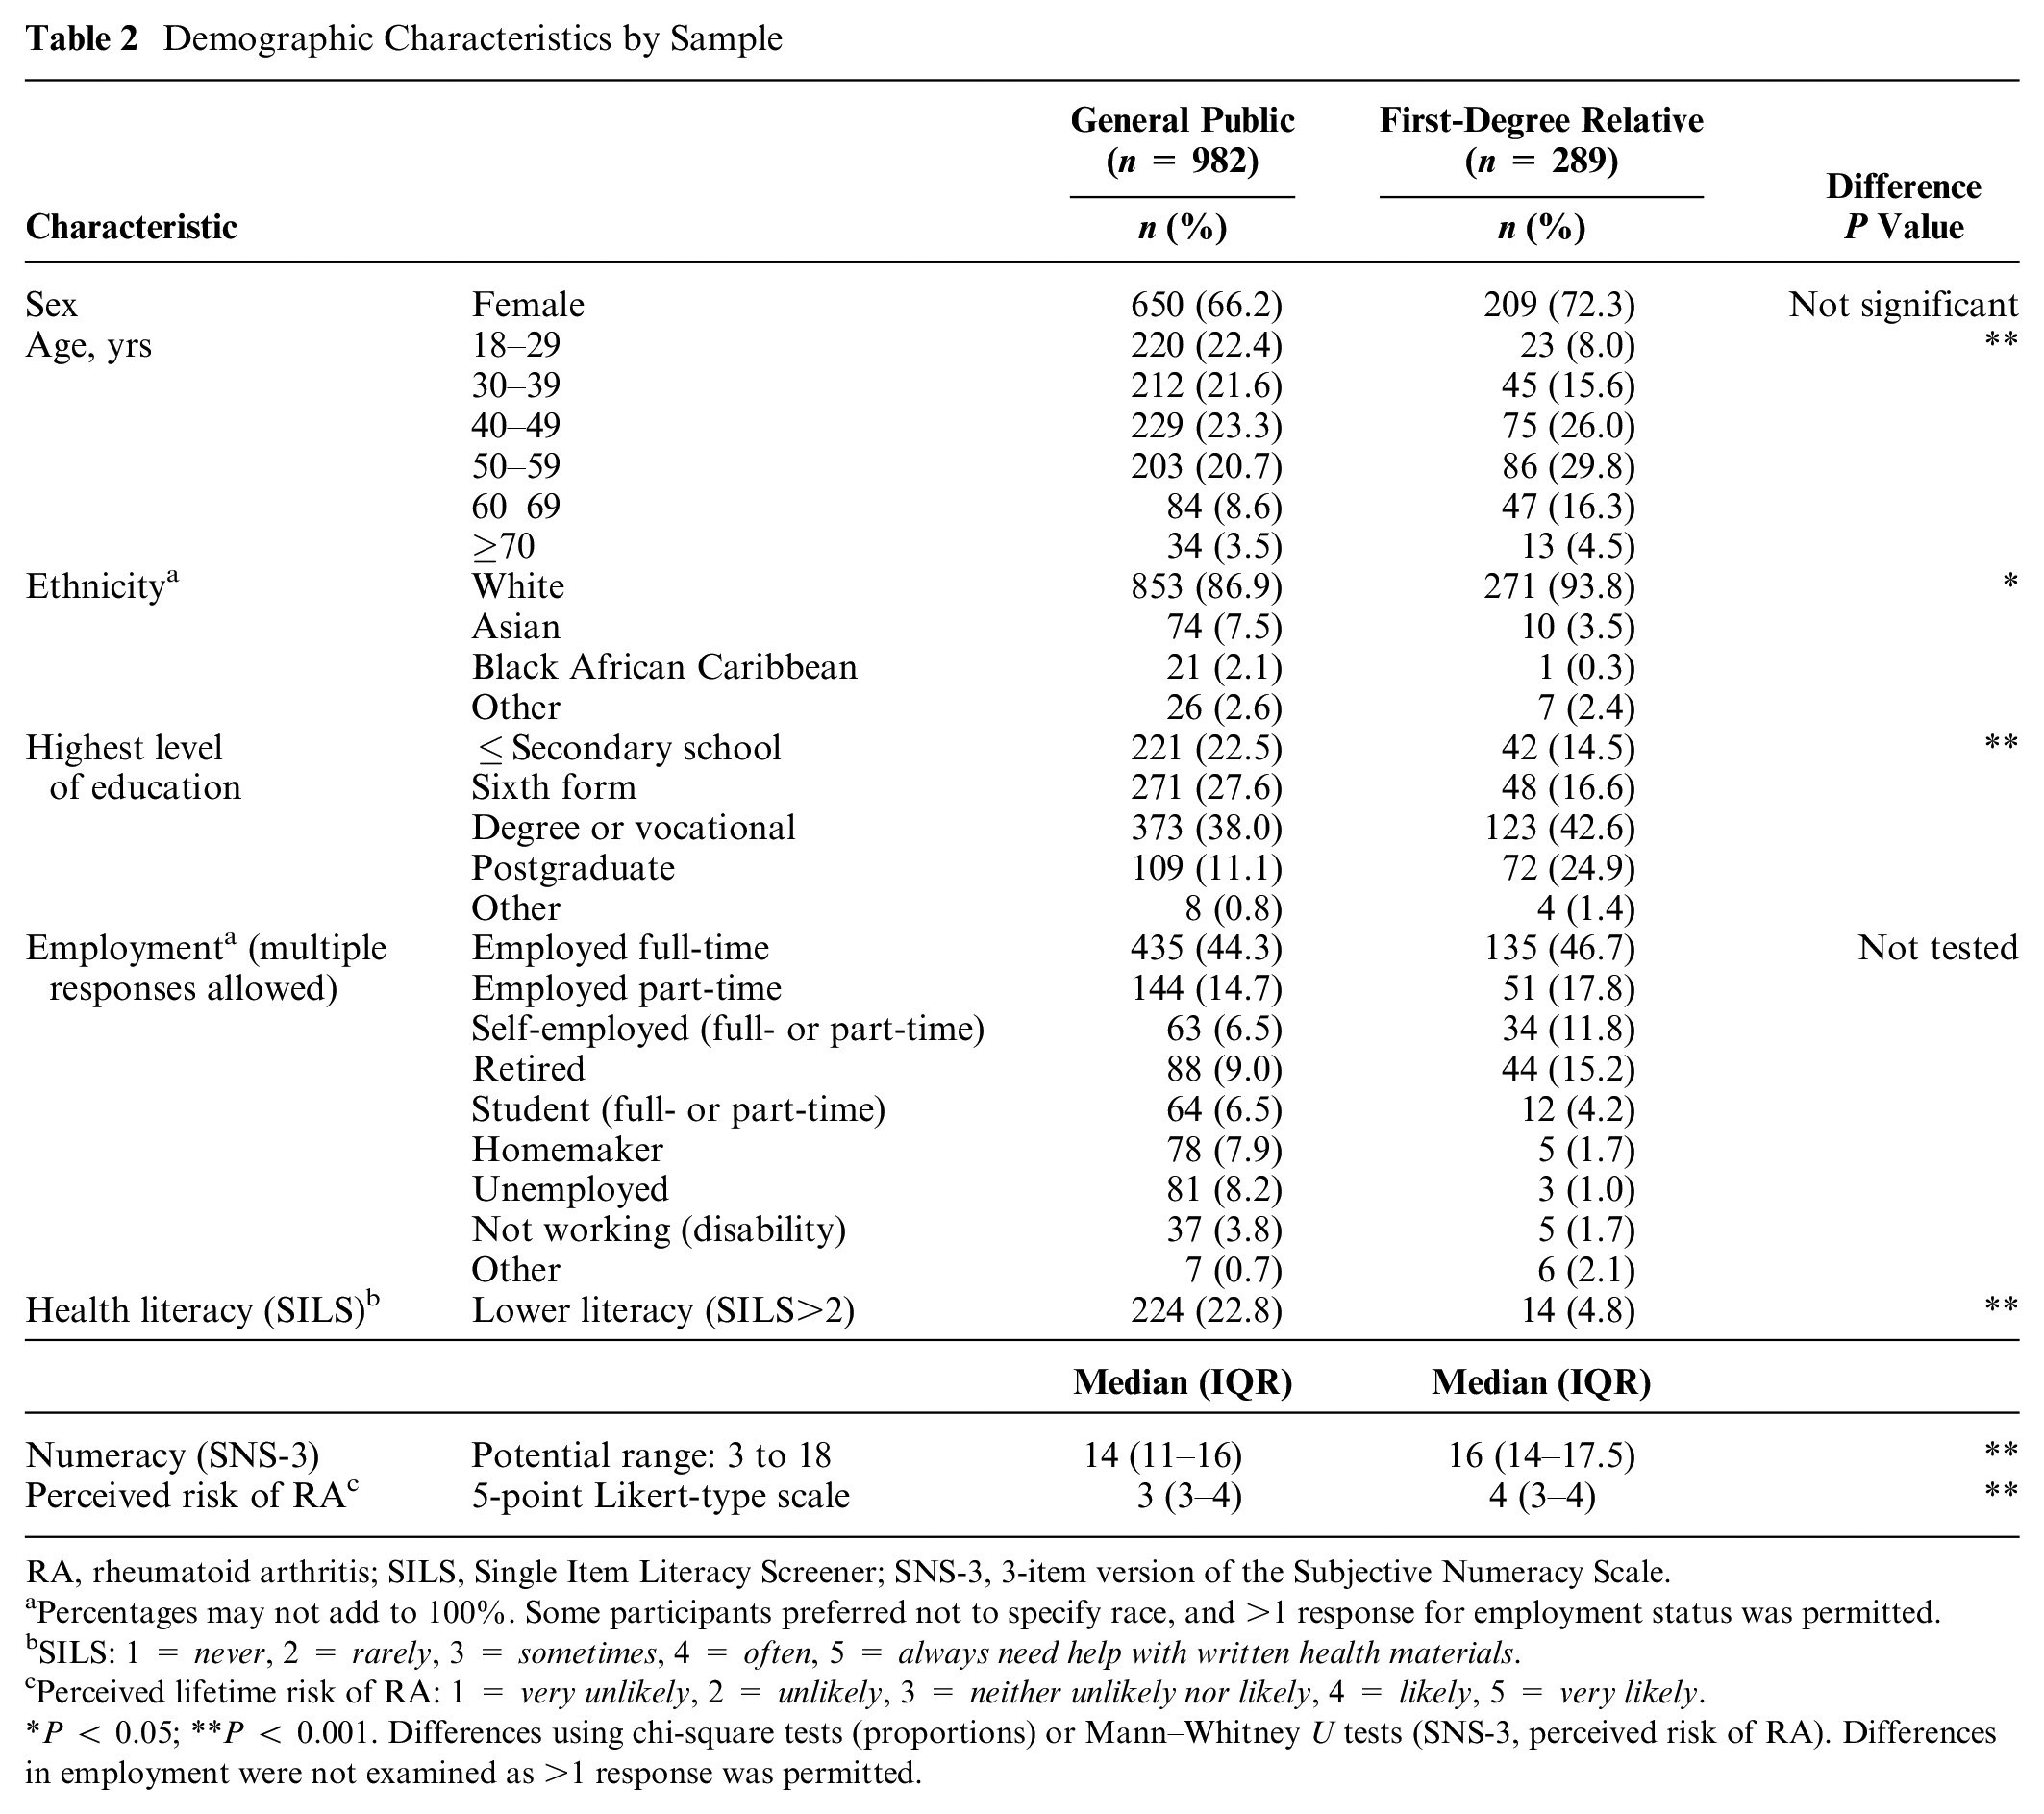
RA, rheumatoid arthritis; SILS, Single Item Literacy Screener; SNS-3, 3-item version of the Subjective Numeracy Scale.
Percentages may not add to 100%. Some participants preferred not to specify race, and >1 response for employment status was permitted.
SILS: 1 = never, 2 = rarely, 3 = sometimes, 4 = often, 5 = always need help with written health materials.
Perceived lifetime risk of RA: 1 = very unlikely, 2 = unlikely, 3 = neither unlikely nor likely, 4 = likely, 5 = very likely.
P < 0.05; **P < 0.001. Differences using chi-square tests (proportions) or Mann–Whitney U tests (SNS-3, perceived risk of RA). Differences in employment were not examined as >1 response was permitted.
Group Differences in Survey Response Time and Participant Feedback on Survey
The median time in minutes to complete the survey sections was shorter for the general public sample than the FDR sample for the survey overall (16.4 v. 29.8), the RA background section (1.5 v. 0.8), and the attribute description section (5.1 v. 3.2; Table 3). Furthermore, although most respondents from both samples correctly completed the first 2 comprehension questions, fewer participants in the general public sample answered the third question (37.7% v. 74.0%) or all 3 questions correctly (30.3% v. 71.3%) relative to the FDR sample.
Data Assessment: Time to Complete Survey, Comprehension, and Feedback Assessments a
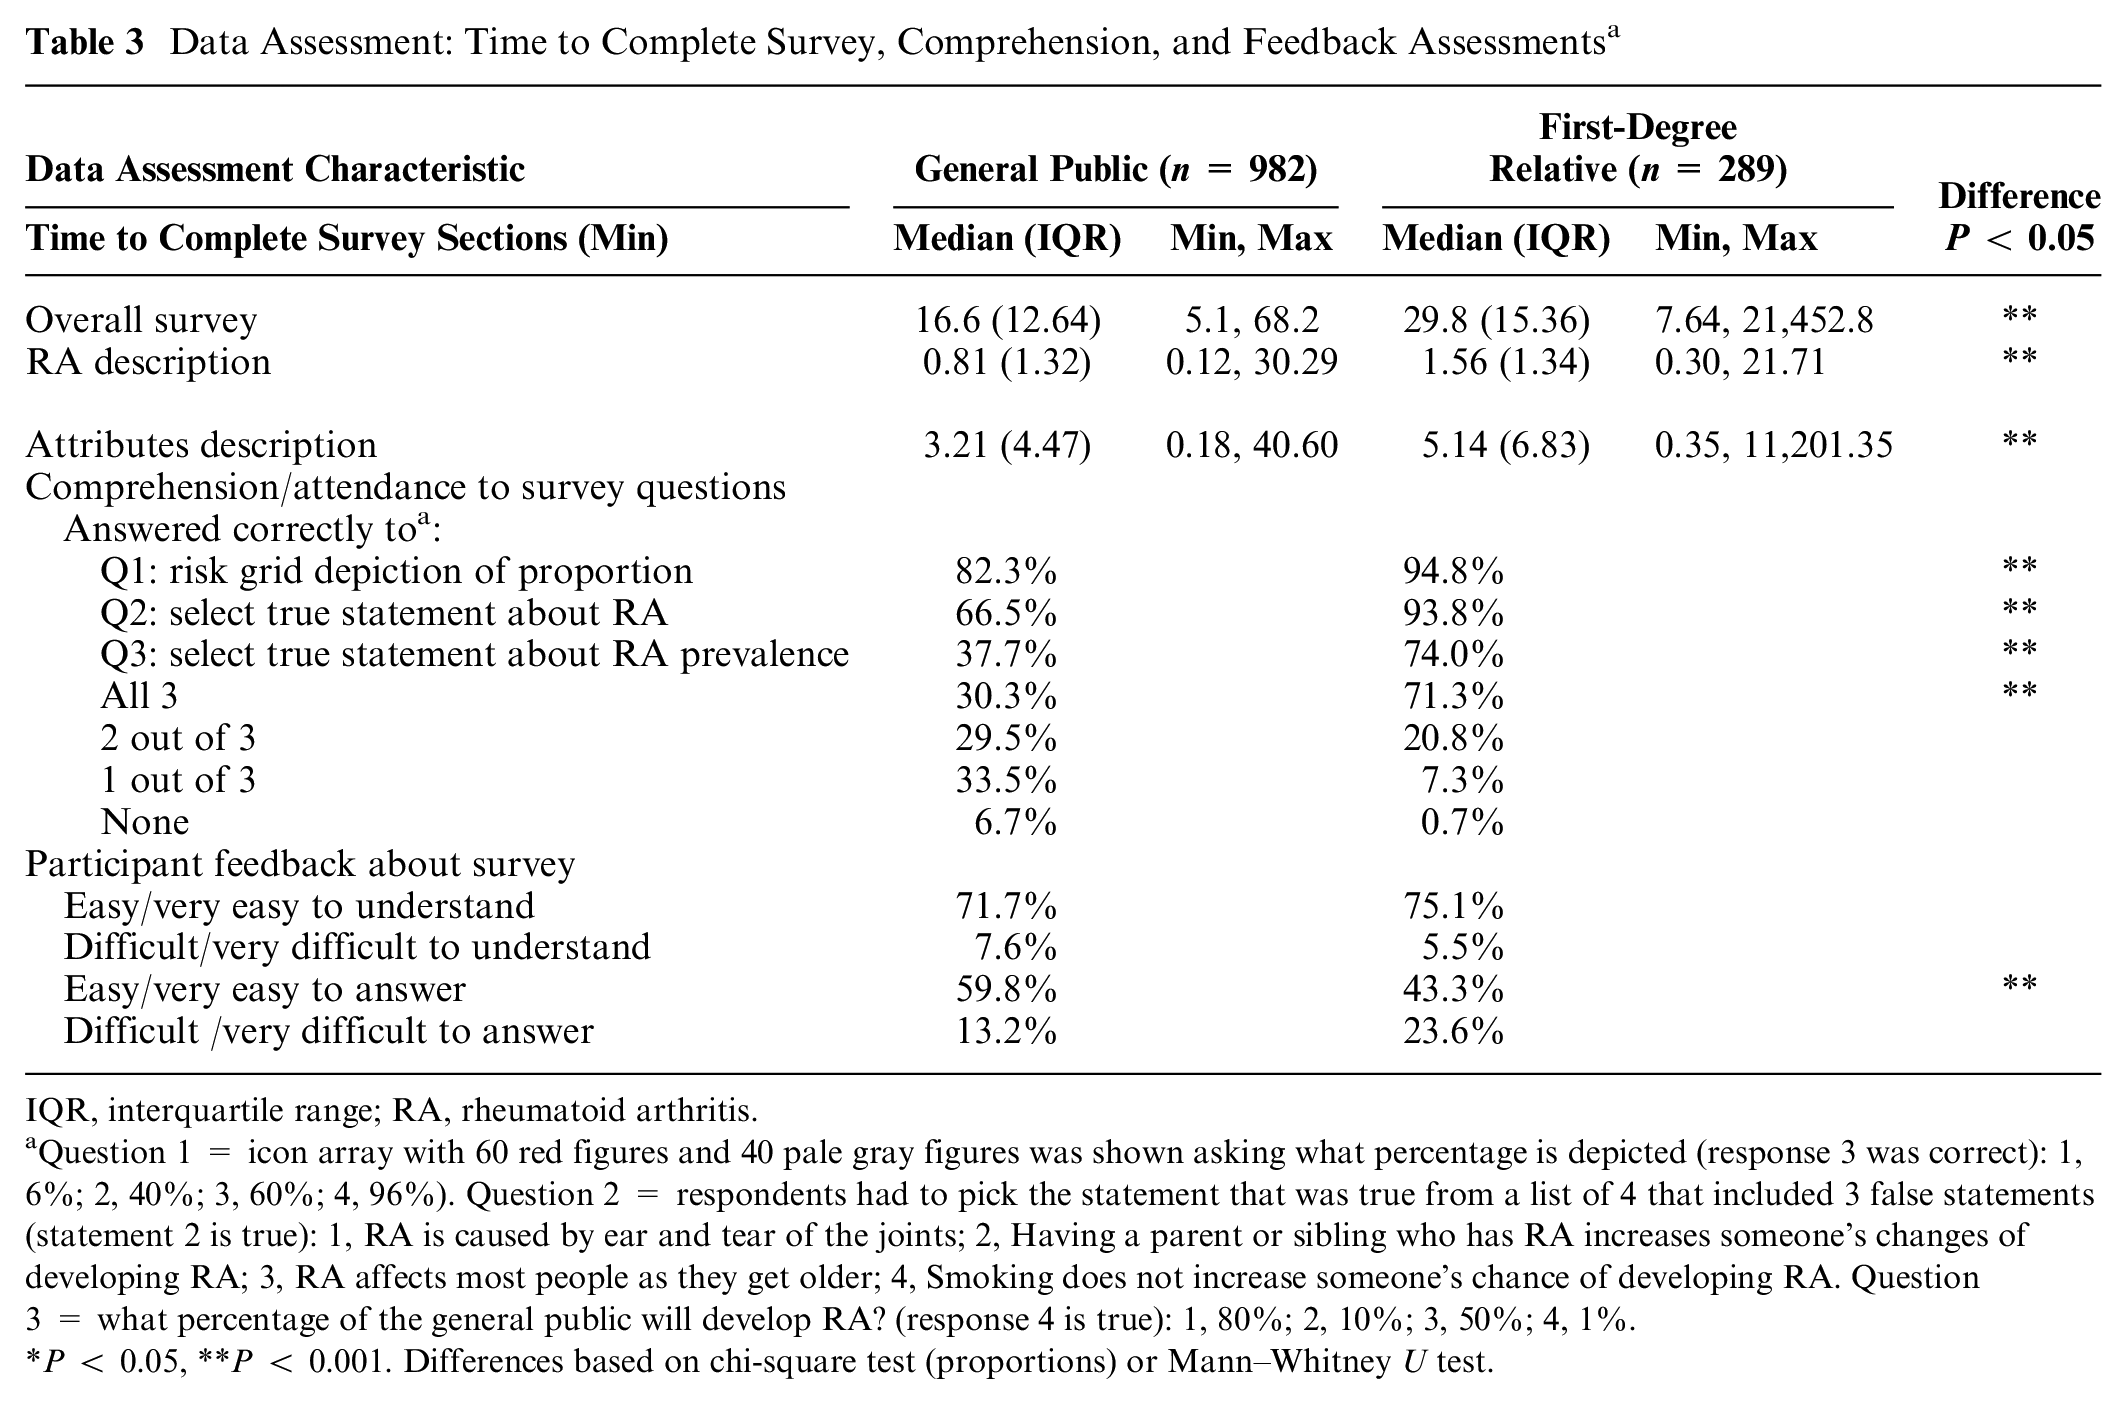
IQR, interquartile range; RA, rheumatoid arthritis.
Question 1 = icon array with 60 red figures and 40 pale gray figures was shown asking what percentage is depicted (response 3 was correct): 1, 6%; 2, 40%; 3, 60%; 4, 96%). Question 2 = respondents had to pick the statement that was true from a list of 4 that included 3 false statements (statement 2 is true): 1, RA is caused by ear and tear of the joints; 2, Having a parent or sibling who has RA increases someone’s changes of developing RA; 3, RA affects most people as they get older; 4, Smoking does not increase someone’s chance of developing RA. Question 3 = what percentage of the general public will develop RA? (response 4 is true): 1, 80%; 2, 10%; 3, 50%; 4, 1%.
P < 0.05, **P < 0.001. Differences based on chi-square test (proportions) or Mann–Whitney U test.
Most respondents in the general public (71.7%) and FDR samples (75.1%) thought the DCE was easy or very easy to understand; however, significantly fewer FDR respondents (43.3%) found the DCE easy or very easy to answer compared with respondents from the general public (59.8%).
Preferences for Preventive Treatment for RA
Table 4 shows the preferences of the respondents from the general public and FDR samples using RPL modeling. In both samples, the negative estimate for the opt out indicates that respondents a priori prefer taking a treatment to delay the onset of RA compared with not taking a treatment. On average, similar preference structures were found with ordering as expected. Respondents preferred treatment with a lower chance to develop RA, tablets over infusion, lowest frequency of administration, and lower chances of side effects to higher levels of these risks. In both samples, significant preference heterogeneity was found, as shown by the significant standard deviations for the different attribute-level estimates. In both samples, effectiveness was the most important attribute and chance of mild side effects was the least important attribute. For the general public sample, mode of administration was more important than for the FDR sample. The relative importance of the other attributes was comparable across the samples.
Preferences Based on Random Parameter Logit (RPL) Analysis of Data from Both Samples a
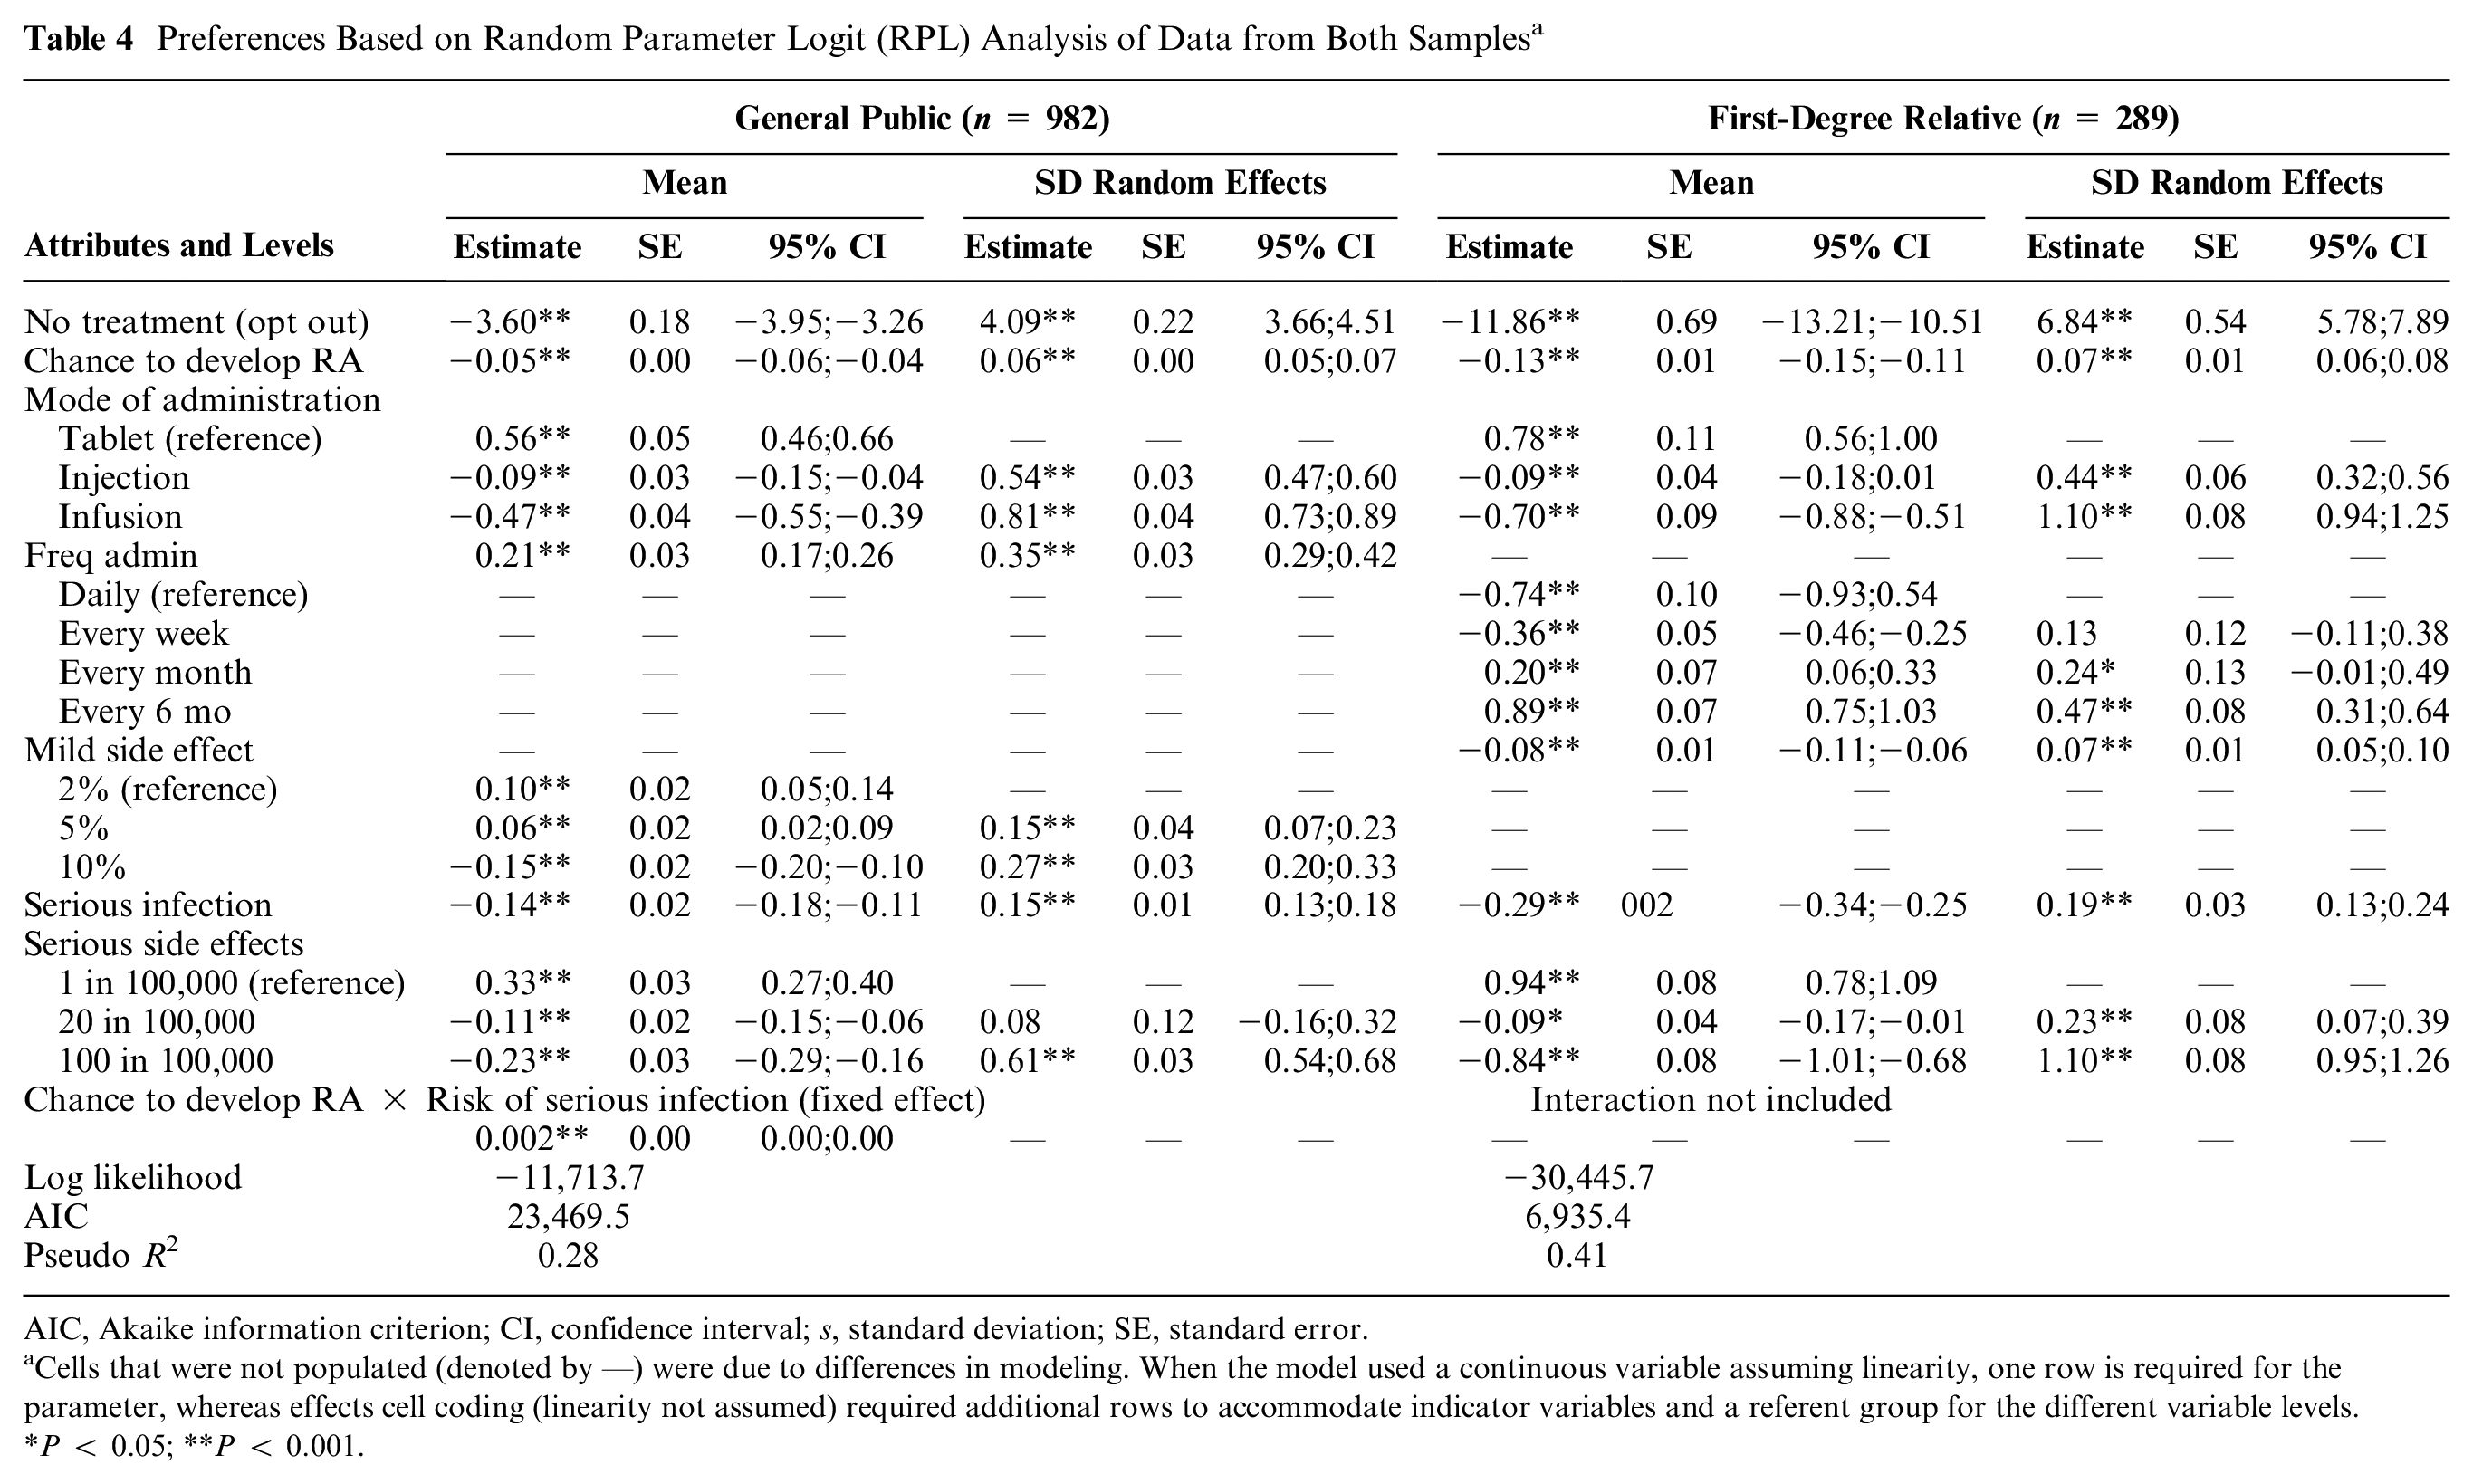
AIC, Akaike information criterion; CI, confidence interval; s, standard deviation; SE, standard error.
Cells that were not populated (denoted by —) were due to differences in modeling. When the model used a continuous variable assuming linearity, one row is required for the parameter, whereas effects cell coding (linearity not assumed) required additional rows to accommodate indicator variables and a referent group for the different variable levels.
P < 0.05; **P < 0.001.
Using the Swait and Louviere test, the scale parameter was estimated at 0.41. The differences in attribute-level estimates of the general population and FDRs were statistically significant after accounting for the scale effect in the pooled data set. The null hypothesis of equal attribute-level estimates was rejected (chi-square 362.3, P < 0.001).
The maximum risk in percentage points that respondents were willing to accept for a 40% reduction in the risk of developing RA in the upcoming 2 y is presented for each risk (Table 5). MAR was highest for 40% point reduction in getting RA in exchange for mild side effects (general public 42.6% v. FDR 80.7%), followed by serious infection (20.6% v. 25.0%) and serious side effects (2.19% v. 2.75%) in both samples. Although MAR values were numerically higher for the FDR sample, especially for mild side effects, differences were not statistically significant.
Maximum Acceptable Risk (MAR) Values Stratified by Sample a
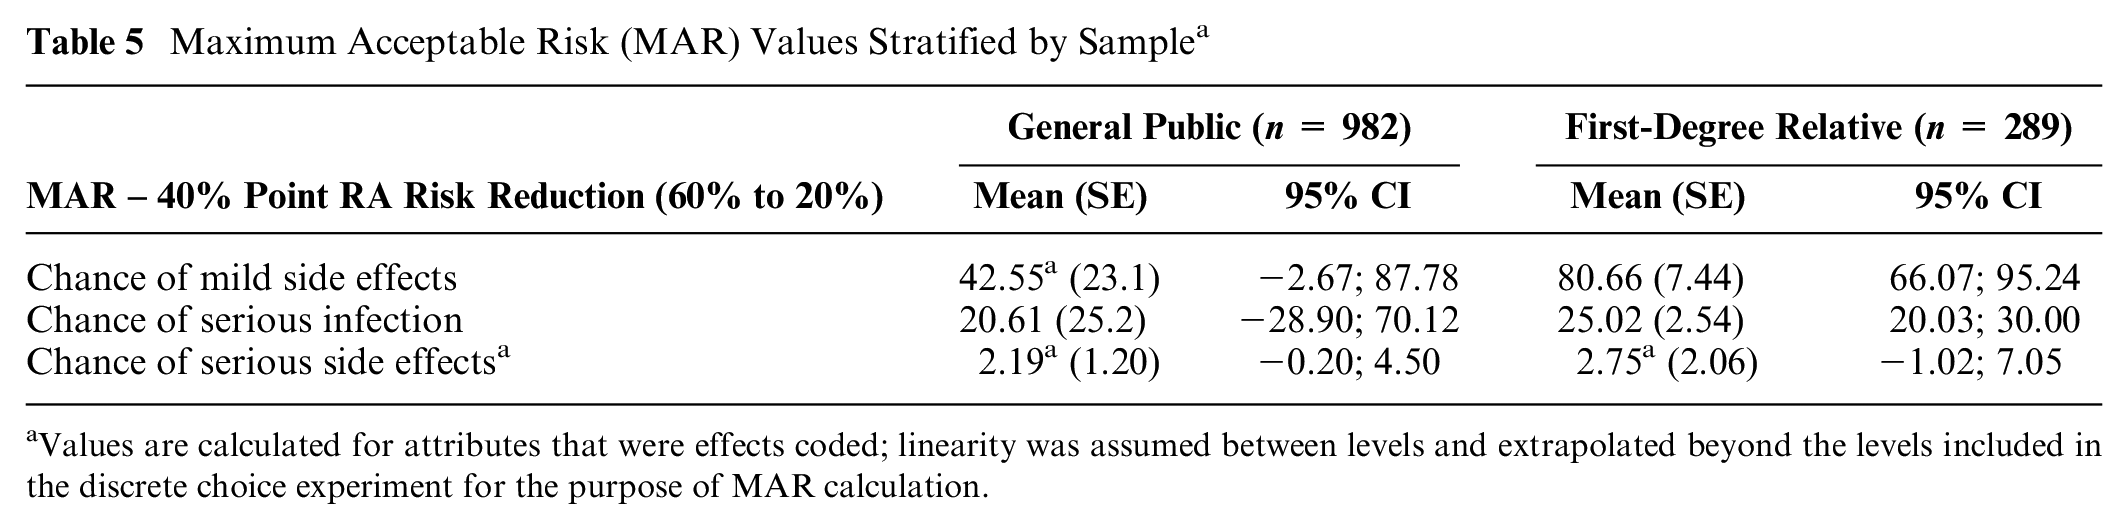
Values are calculated for attributes that were effects coded; linearity was assumed between levels and extrapolated beyond the levels included in the discrete choice experiment for the purpose of MAR calculation.
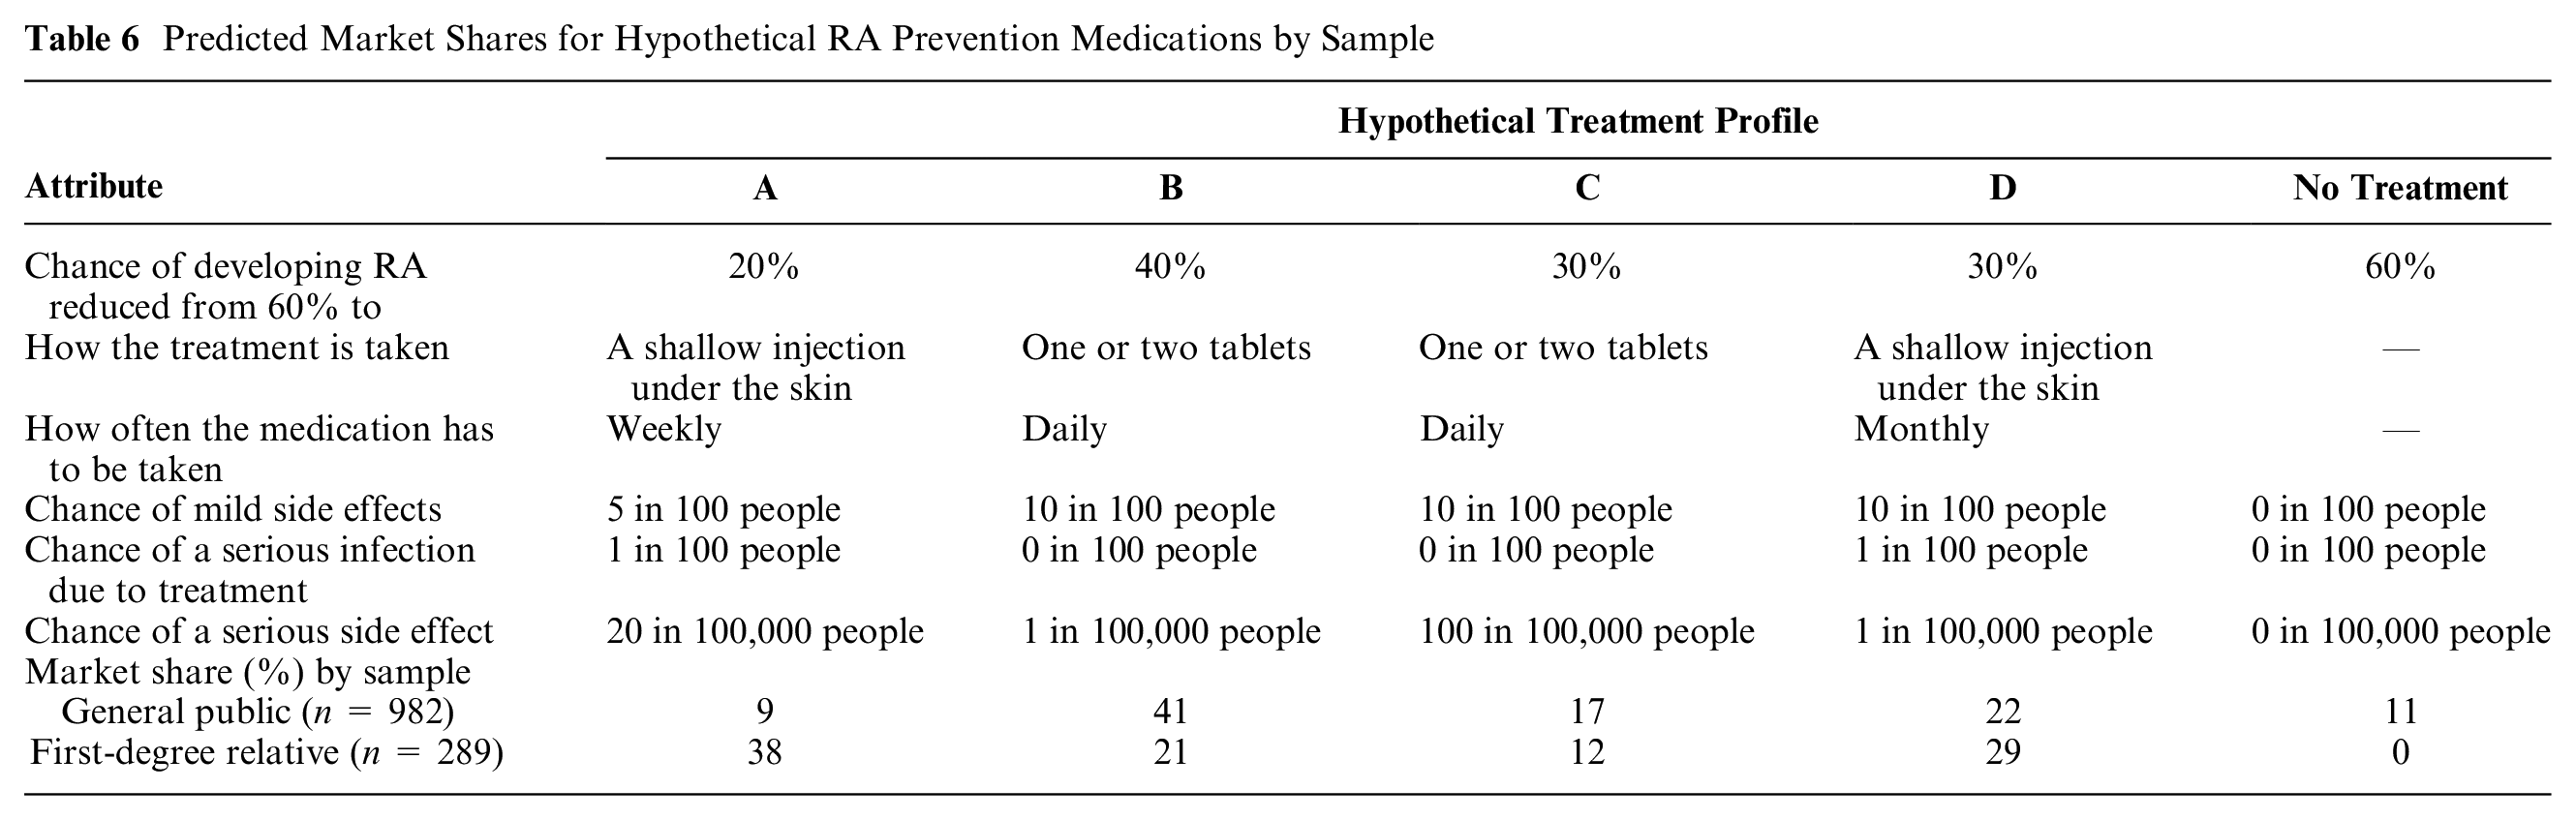
Predicted uptake for 4 hypothetical preventive medicines and a no-treatment alternative differed across the samples based on differences in preferences for treatment attributes between samples (Table 6). Predicted uptake for participants in the FDR sample was highest for a treatment with greatest effectiveness, more frequent side effects, and administered via injection (profile A: 38% v. 9% general public sample). On the other hand, the favored treatment with highest predicted uptake in the general public sample had lower efficacy, lower frequency of side effects, and oral administration (profile B: 42% v. 21% FDR sample). None of the FDRs considered no treatment, whereas 11% of the general public sample picked no treatment.
Predicted Market Shares for Hypothetical RA Prevention Medications by Sample
Discussion
This study examined the preferences of samples of the general public and FDRs for treatments to prevent RA using a DCE. Results suggest that in the context of RA prevention, the general public sample may be a suitable proxy for “at-risk” samples of FDRs depending on the metrics of interest. Results could be used to prioritize which medicines approved for RA treatment might be most acceptable for RA prevention. Relative preferences were generally similar between samples, with efficacy being most important in both groups and risk of mild side effects being the least important in both groups. The general public sample valued mode of administration more than the FDR sample, but values were otherwise similar for the remaining attributes. MAR in exchange for a 40-percentage point reduction in risk of RA (60%–20%) was not significantly different across the samples, but MAR for mild side effects and serious infection was numerically and appreciably higher for FDR relative to the general public. When using a general public sample, it appears that MARs in a general public sample might be considered a minimum and that individuals at greater risk and/or familiarity with the condition may have higher MARs, accepting higher risks in exchange for increased effectiveness.
Predicted market shares were different between groups, with more weight being placed on effectiveness and lower weights for side effects and mode of administration in the FDR sample relative to the general public sample. The general public sample was predicted also to select no treatment (11% of sample), whereas the FDR sample was predicted always to select a treatment. It is worth noting that RA preventive clinical trials reveal difficulties in recruitment of sufficient at-risk individuals37–41 and one study of a statin having to terminate early due to difficulty enrolling patients. Lack of uptake is seen in other areas relating to prevention, for example, where breast cancer chemoprevention (oral medication) is taken by very few people at risk despite significant demonstrated benefit among those at high risk. 42
Our findings suggest that the FDR sample was more engaged or invested than the general public sample, taking longer to complete the survey overall and sections explaining RA and attributes and levels. The FDR sample was also more than twice as likely to answer all 3 comprehension questions correctly. However, the FDR sample expressed more difficulty in answering the choice questions relative to the general sample despite higher numeracy, health literacy, and educational attainment. Taking longer and expressing more difficulty in answering the survey might also be attributable to less familiarity and experience with taking surveys or more deliberation due to their increased risk and knowledge of RA, relative to the general public sample recruited through a survey panel. Lastly, the FDR sample reported significantly higher perceived lifetime risk of RA than the general population sample, which may have also resulted in more engagement given closer psychological distance. 13
Whether a general public sample is an appropriate proxy for a more specific sample depends on the context of the study, for example, in resource allocation in the case of a national health care service. In addition, the general population might be considered a suitable sample in disease prevention, since they resemble the actual target at-risk population. To inform decisions earlier in the life cycle, for example, the general public may be reasonable if informing relative ranking of attributes when considering endpoint selection, a development decision (e.g., narrowing the list of treatment candidates) or developing a decision aid. It offers an efficient and cost-effective sample if this is an important criterion. 43 However, a general population might not be appropriate where weights may be required (e.g., MARs or market share) among potential patients. It might be plausible to assume than the general population sample provides lower MARs that a patient population does. Patients with the relevant diagnosis might be expected when preference studies inform benefit-risk decision making by a health authority or for a reimbursement decision. The tradeoffs and availability of different samples should be discussed among the research team as well as potential users of the results. 44
Preventive treatment preference studies in at-risk and general public samples have been conducted in other disease areas including genetic testing for colorectal cancer screening and delaying onset of type 1 diabetes mellitus in children.13,45 Generally, studies suggest that efficacy is the most important attribute across samples and that the ranks of the most and least important attributes are similar across groups; however, the relative weights, MAR, and predicted uptake could be quite different across at-risk and general public samples. For example, in colorectal cancer screening, the relative importance weights differed between the screened population compared with the general population. The screened population ranked survival as the most important attribute and showed dominant decision-making behavior for survival compared with the general population. 13 In a study of treatment delaying the onset of type 1 diabetes mellitus, the MAR were higher among children of parents whose children had type 1 diabetes mellitus versus those who did not have a child with type 1 diabetes. 45 Also, psychological distance (e.g., perceived risk of getting the condition, experience with the condition) strongly influenced preferences. 13 More research is needed to compare preferences, engagement, and quality of data from different at-risk populations (general public v. individuals at higher risk) in the disease prevention context for RA and other conditions. Further research is also needed to assess preferences of high-risk groups (e.g., clinically suspect arthralgia) that may have up to 60% chance of RA development as presented in our survey. 46
To our knowledge, this is the only study comparing preferences for RA preventive treatment in a general public sample (average risk of RA) to an FDR sample (at higher risk of RA). A strength of this study is that that FDR participants were related to patients with a confirmed diagnosis of RA. RA is often confused for osteoarthritis,47,48 and the accuracy of self-reported RA and osteoarthritic diagnoses is low.48–50 Indeed, almost a third of the general public sample in the current study reported a family history of RA, with a quarter of the sample indicating that they were an FDR, which is at odds with the prevalence of RA (approximately 1%). Selection bias and generalizability are potential limitations of the study. Participants completing our survey were recruited from convenience samples during the COVID-19 pandemic. The severity of RA in the first-degree relatives of participants was not tabulated and may have affected participant preferences. Demographic differences between samples in our study also could have affected differences in preferences. There was evidence of preference heterogeneity in our study, as demonstrated by the large standard deviations relative to the parameter estimates in our models (Table 4). Health literacy and perceived risk partly explained preference heterogeneity; however, no other patient characteristics explained heterogeneity. 51 Although scale was investigated, a scale-adjusted latent class model could have been suitable for this purpose but would have further complicated sample comparisons. 52
Despite the limitations, this study provides a starting point for discussion on using the general public as a proxy in the context of disease prevention. Although they have a potential lower investment in the decision at hand, the general public sample may be a suitable proxy to an at-risk FDR sample to understand relative rankings of preventive treatment attributes but not for weights and tradeoffs. First, the general public sample provided data that appear to be of good quality. Few participants (n = 21) were excluded for suspected data quality resulting from for speeding or flatlining. Both samples exhibited similar preferences (most and least important attributes). The general public sample was recruited relatively easily and quickly through a panel and without clinical recruitment, assessment, or supervision. Panel participants may be motivated by getting paid for participation, and different panels may have more curation or certainty around diagnosis and data quality. In this sample of the general public, the majority answered the first 2 comprehension questions correctly; however, the proportion answering correctly was significantly lower than in the FDR sample. When choosing a general public sample, one must acknowledge the strong potential for lower engagement and distance from the decision at hand.
Conclusions
The current study of preferences for preventive RA treatment suggests that preference study results for relative ranks of attributes were generally similar between the general public and the at-risk sample of FDR but diverged for weights used to tabulate MAR and estimated market share for 4 hypothetical profiles plus a no-treatment opt out. In the context of preventing a disease such as RA, sampling from the general public for relative ranks may be a reasonable and efficient proxy for a well-informed patient sample. Appropriate quality checks and rationale for the sample selection are strongly recommended given the potential for differences in preferences across groups.
Supplemental Material
sj-docx-1-mdm-10.1177_0272989X231218265 – Supplemental material for Can the General Public Be a Proxy for an “At-Risk” Group in a Patient Preference Study? A Disease Prevention Example in Rheumatoid Arthritis
Supplemental material, sj-docx-1-mdm-10.1177_0272989X231218265 for Can the General Public Be a Proxy for an “At-Risk” Group in a Patient Preference Study? A Disease Prevention Example in Rheumatoid Arthritis by R. L. DiSantostefano, G. Simons, M. Englbrecht, Jennifer H. Humphreys, Ian N. Bruce, K. Schölin Bywall, C. Radawski, K. Raza, M. Falahee and J. Veldwijk in Medical Decision Making
Footnotes
Acknowledgements
The authors are grateful to members of the extended PREFER RA case study team and the patient research partners involved with the case study for their important contributions to the development and design of this study. The authors would like to acknowledge Gayle Murray of Janssen Research & Development for her assistance in formatting for publication
Author Contributions
All authors contributed to the study conception and design. Material preparation was performed by J. Veldwijk, R. DiSantostefano, G. Simons, M. Englbrecht, C. Radawski, K. Raza, and M. Falahee. J. Humphreys and I. Bruce are in charge of the PREVeNT-RA cohort of first-degree relatives and coordinated access to the first-degree relatives. Data analyses were performed by J. Veldwijk. The first draft of the manuscript was written by R. DiSantostefano with substantial input from J. Veldwijk, G. Simons, and M. Falahee. All authors commented on draft versions of the manuscript, and all read and approved the final manuscript.
The authors declared the following potential conflicts of interest with respect to the research, authorship, and/or publication of this article: Rachael DiSantostefano is employed by Janssen Research and Development, LLC, and is a stockholder in Johnson & Johnson. J. Veldwijk, Gwenda Simons, K. Schölin Bywall, Marie Falahee, Jennifer Humphreys, and Ian Bruce declared no conflict of interest. Karim Raza declared personal fees from Abbvie and Sanofi and grant/research support from Bristol Myers Squibb. Matthias Englbrecht declared personal fees from AbbVie, Chugai, Eli Lilly, Novartis, Roche, Sanofi, and Mundipharma and grant/research support from Roche and Chugai. The authors disclosed receipt of the following financial support for the research, authorship, and/or publication of this article: Financial support for this study was provided in part by a grant the Innovative Medicines Initiative (IMI) 2 Joint Undertaking under grant agreement No. 115966. This Joint Undertaking receives support from the European Union’s Horizon 2020 research and innovation program and European Federation of Pharmaceutical Industries and Associations (EFPIA). K. Raza is supported by the National Institute for Health Research (NIHR) Birmingham Biomedical Research Centre. The funding agreement ensured the authors’ independence in designing the study, interpreting the data, writing, and publishing the report. This article and its contents reflect the view of the authors and not the view of PREFER, IMI, the European Union, or EFPIA.
Ethics Approval
The survey was conducted in accordance with the ethical standards of the institutional and/or national research committee and with the 1964 Helsinki Declaration and its later amendments or comparable ethical standards. This study was approved by the London-Hampstead Research Ethics Committee (19/LO/0407). Informed consent was obtained from all individual participants included in the study.
Consent to Participate
Participants provided informed consent.
Consent for Publication
Not applicable.
Research Data
The authors are open to collaborations involving additional analysis of this survey. The authors are open to sharing code for collaborations involving additional analysis of this survey.
References
Supplementary Material
Please find the following supplemental material available below.
For Open Access articles published under a Creative Commons License, all supplemental material carries the same license as the article it is associated with.
For non-Open Access articles published, all supplemental material carries a non-exclusive license, and permission requests for re-use of supplemental material or any part of supplemental material shall be sent directly to the copyright owner as specified in the copyright notice associated with the article.