
Abstract
Patients in the English National Health Service (NHS) have the right to choose among all qualified hospital providers for treatments that are deemed clinically appropriate and are publicly funded. To inform “patients … exercising choice,”1(p6) about the quality of care they are likely to receive, the English NHS routinely collects multidimensional health-related quality-of-life (HRQoL) data from patients before and after undergoing planned hip and knee replacement surgery as part of the national patient-reported outcome measures (PROMs) program. These data are then used to benchmark hospitals and calculate performance indicators in the form of case-mix adjusted average postoperative HRQoL, expressed as unidimensional composite scores, which are made publicly available on a regular basis.2,3
A normative question, and the focus of this article, is how to aggregate the multidimensional HRQoL data into unidimensional (single-number) scores for the purpose of hospital performance assessment and public reporting. The PROMs program collects HRQoL data using a generic health measurement instrument, the EQ-5D-3L, 4 which comprises both a direct and indirect measure of a patient’s health state. The direct measure, the EQ-VAS, asks patients to provide a summary assessment of their HRQoL by marking a position on a visual analog scale (VAS) ranging from 0 to 100, where the endpoints reflect the best and worst health states imaginable. The indirect measure uses the EQ-5D-3L descriptive system, in which patients are asked to describe their current health status according to 5 dimensions of health (mobility, self-care, usual activities, pain and discomfort, and anxiety and depression), each of which can be assigned 1 of 3 severity levels (essentially no, some, or extreme problems). The resulting health profile data are aggregated into unidimensional composite (“index”) scores using preference estimates of the UK general population, 5 rather than of those prospective patients the PROMs program seeks to inform. Previous research has shown many cases in which preference estimates derived from specific patient populations differ systematically from those derived from the general population,6–10 although some studies find no differences.11,12 The current practice therefore raises normative concerns and could be inconsistent with the notion of patient sovereignty if it leads to a mismatch between the decisions patients make based on official published data and those they would have made had the information reflected their own preferences more closely.
Ideally, the reported hospital performance should reflect prospective patients’ individual preferences over relevant health states. However, the elicitation of personal preference functions is a complex and time-consuming task 13 and has therefore not (yet) found widespread adoption in the public reporting of hospital performance. Furthermore, it would imply the need to recalculate public reports for each prospective patient based on their individual preferences, ruling out static performance reports (e.g., rankings published in newspapers) that are common currently. A pragmatic solution that avoids both issues is to develop a value set based on preferences elicited from a sample of patients. Such value sets are likely to reflect the preferences of prospective patients more closely than a general population value set because they are obtained from a sample of individuals with a similar age-sex structure, clinical condition, adaptation to their condition, and expectations of future health. At the same time, it would enable the calculation of EQ-5D index scores and hence unidimensional hospital performance indicators that could be presented alongside detailed dimension-by-dimension estimates 14 if desired.
In this article, we test whether the use of patient or general population valuations generates different hospital performance estimates for hip replacement surgery in the English NHS. We are not aware of a UK-based patient value set that mirrors the currently used general population value set in terms of 2 other important aspects, namely, respondents’ experience of the health state to be valued as well as the valuation technique employed. This precludes a direct test of the effect of the source of valuation on hospital performance estimates. Instead, we compare hospital performance estimates generated under 4 published and newly estimated value sets, out of 8 possible combinations of these value set attributes. This allows us to vary 1 aspect at a time, holding the other 2 constant. The results of this indirect comparison help to demonstrate the practical implications of the normative argument about the source of health state valuations in the context of informing prospective patients about where to have surgery.
Valuation of Health States
Among the desirable properties of a measure of the value of health is that it should unambiguously indicate whether a given health state, as defined by a multidimensional HRQoL profile, is better than, worse than, or equivalent to another health state. This property is most usually achieved by aggregating HRQoL data into a single number that represents the value of a health state by means of a set of preference weights. By convention, the value of a health state lies on a scale in which 1 represents health that is as good as possible and 0 represents health that is either as poor as possible or is equivalent to being “dead.” The latter allows for health states “worse than dead” with values below 0.
Any attempt to value health in this way requires consideration of the following questions: 1) what is being valued, 2) whose values are being sought, and 3) what technique is being used to obtain the values? These are each briefly summarized below, with interested readers being referred to detailed discussions elsewhere.15–17
What Is Being Valued
Health state valuations are obtained as part of elicitation tasks. In these, participants may be asked to value their own health, as experienced either currently or in the past, or a set of health states that they may not be currently experiencing. For the latter, they are usually asked to value a stylized description of health, which may take the form of a health state profile comprising a series of dimensions and severity levels defined by the descriptive system of a PROM instrument, such as the EQ-5D. Such profiles are often described as “hypothetical,” but this is misleading because they are intended to reflect real health states and therefore plausible ways in which someone might self-report their health using the instrument. Since, in most cases, respondents will neither be experiencing or ever have experienced a health state described in the profile, they would need to imagine living in that health state to evaluate it. We can therefore regard these as their estimate of how they would value the health state if they were experiencing it.
Whose Values Are Being Sought
Health state valuations can be obtained from selected subgroups, such as patients with a given medical condition, or a sample of the general population.16,18,19 Both approaches have merit, although advocates tend to argue their case on different grounds. Those in favor of using patient valuations typically point out that patients have first-hand experience of health states and therefore do not need to imagine the impact of an unfamiliar health state on their HRQoL.20,21 A common finding in the published literature —that valuations derived from specific patient populations tend to be higher than those elicited from the general population has been attributed to patients adapting to their impaired health state over time and/or providing a more accurate assessment of the health state based on their lived experience.6,7,21 Conversely, proponents of general population valuations typically argue their case not on the grounds of validity but based on the intended use of such valuations to inform resource allocation decision in collectively funded health services, where decisions should reflect the preferences of the general population paying into the system. 18
It is important to note that what is being valued and by whom are 2 separate issues. Patients may be asked to value health states that can occur as a result of their medical condition and that they may be able to imagine living in but that they have not (yet) experienced themselves. Equally, the general population can be asked to value their currently experienced health state. 22
What Elicitation Technique Is Being Used
There are a number of techniques for valuing health states such as VAS and time trade-off (TTO). 23 The VAS involves rating the health state on a scale with imposed interval properties and well-defined endpoints, conventionally 0 and 100 (which, in the EQ-VAS, represent the worst and best imaginable health, respectively). TTO involves making a series of choices between living for a fixed amount of time in the profile under evaluation and a shorter, variable amount of time in full health, where the point at which respondents are indifferent is used to infer valuations. TTO has become the method most often recommended for the generation of values. The 2 methods have different assumptions underpinning them and are subject to different types of framing effects; for example, VAS valuations are known to be subject to end-of-scale aversion, 24 whereas respondents’ time preference can have an effect on TTO valuations.25,26 VAS exercises are widely considered to be relatively simple and feasible to complete. 27 Previous research has shown that VAS and TTO yield different results. 28
Methods
Data
We analyzed EQ-5D-3L data from 2 independent samples. The first consisted of 272,445 NHS-funded total hip replacement (THR) patients aged 15 y or older who had primary surgery in public or private hospitals in England between April 2012 and March 2016, collected as part of the English national PROMs program. 1 Patients completed a paper questionnaire shortly before and 6 months after having surgery, containing the EQ-5D-3L, a condition-specific measure (the Oxford Hip Score), and other questions about their condition and treatment. The preoperative questionnaire was administered by hospital staff at admission or the last outpatient appointment preceding admission and forwarded to a central data processor. The postoperative questionnaire was mailed directly to the patient’s home address. Returned questionnaires were linked to administrative hospital records from the Hospital Episode Statistics (HES) database through a probabilistic matching algorithm. HES provides information on the patient’s age, place of residence, provider of care, and whether the surgery was a revision of a previous THR. Further details about the PROM data collection procedure are provided elsewhere.29,30 We excluded patients for whom pre- or postoperative responses were missing, either in part or completely, or for whom questionnaires could not be linked to HES. The sample used to estimate the patient value set in this study included 122,921 patients, which corresponds to 45.1% of all THR patients that were eligible to participate in the PROMs survey. Excluded patients were on average slightly younger and more likely to be female (Appendix Table A1). The linked HES-PROMs data set was provided by NHS Digital.
The second sample consists of 3381 randomly selected members of the UK general public who took part in the Measurement and Valuation of Health (MVH) study. 31 Each of the participants was asked as part of face-to-face interviews to rate their own health status using the EQ-5D-3L questionnaire and to value 8 of 42 stylized health states using TTO 32 and VAS. The valuation data were used to derive a TTO-based value set known as the MVH-A1, 5 but which we label the GP-TTO-VAL, and a VAS-based value set known as the MVH-A3, but which we label the GP-VAS-VAL (Table 1). 31 The former is used in the official calculation of the hospital performance estimates reported to the public. Both value sets are anchored at 1 (full health) and 0 (dead), with scores below 0 indicating states considered worse than being dead. The MVH data set was provided by the UK Data Services.
Overview of Value Set Characteristics
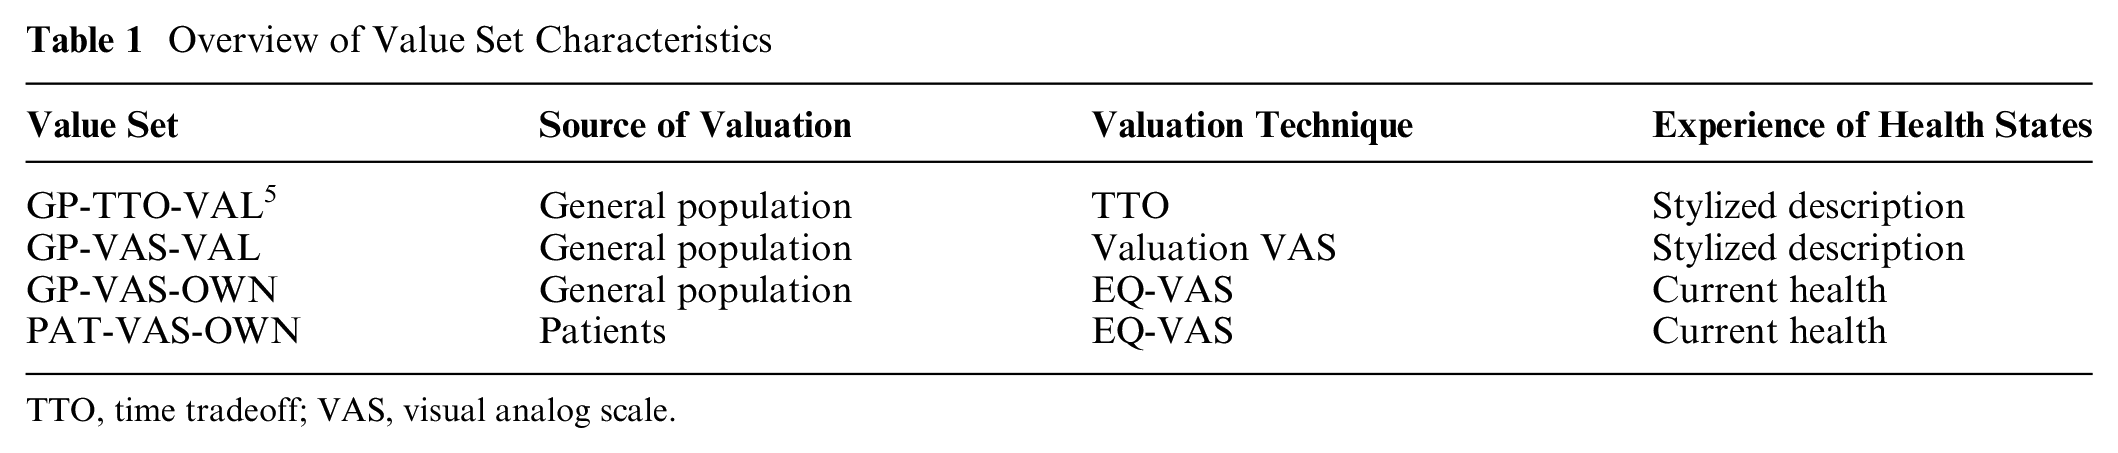
TTO, time tradeoff; VAS, visual analog scale.
Estimation of Experience-Based Value Sets
A patient, current health VAS value set, which we label the PAT-VAS-OWN, was derived from the national PROMs data set by regressing patient-reported EQ-VAS scores on variables representing the levels within each dimension of the EQ-5D descriptive system, using ordinary least squares. The regression model underpinning the MHV value sets includes dummy variables for the main effects, a constant term reflecting any deviation from full health, and an N3 term indicating extreme problems (level 3) on any dimension. 5 To ensure comparability with these, we used the same specification. We also estimated more saturated models allowing for pairwise interactions between dimensions at level 2 and 3 but found these added little to overall fit (results available on request).
The PAT-VAS-OWN value set was estimated on data for the period April 2012 to March 2015, leaving 1 year of data to assess the impact of the value set on hospital rankings. It has been observed that patients’ valuations of the same description of their health state may change from pre- to postsurgery, which may lead to inconsistencies when estimating patient-based value sets. 33 We focus our analysis on preoperative survey responses because these are more likely to reflect patients’ preferences at the point in time when a choice is to be made.
We also estimated a general population, current health VAS value set, which we labeled the GP-VAS-OWN, using the MVH study participants’ EQ-VAS and self-classifier responses and the same modeling structure as for the PAT-VAS-OWN value set.
Table 1 summarizes the characteristics of the 4 value sets that we compared.
All standard errors are robust to heteroscedasticity and, in the case of the PAT-VAS-OWN value set, are clustered at hospital level. All computations were performed in Stata 14 (StataCorp LP, College Station, TX).
Deriving Hospital Performance Estimates
Hospital performance assessment aims to identify the systematic contribution that providers make to their patients’ health outcomes. 34 To allow for fair comparisons, these assessments need to adjust for differences in hospital case-mix and sampling uncertainty.
Our analysis followed the published adjustment methodology of NHS England,
35
in which the case-mix adjusted performance

where
The expected postoperative index score is based on the official case-mix adjustment methodology developed by NHS England. 35 The adjustment takes account of age, gender, ethnicity, living arrangements, the income deprivation profile of the patients’ local small areas of residence (lower-layer super output area [LSOA]) as approximated by the 2010 Index of Deprivation, 36 main diagnosis and comorbid conditions, whether patients lived alone, whether they required assistance when filling in the PROMs questionnaire or considered themselves to be disabled, the duration of symptoms, and their preoperative EQ-5D index score. We estimated the case-mix adjustment model separately for each of the 4 value sets using data from April 2012 to March 2014.
To account for sampling uncertainty in performance scores, we followed standard practice37–39 in the NHS and calculated the z-score statistics for each hospital as

where
Assessing the Impact of Different EQ-5D Value Sets on Hospital Performance Estimates
We assessed the impact of different value sets on hospital performance estimates for the period between April 2015 and March 2016 through a series of head-to-head comparisons. For each hospital, we compared their performance status (i.e., whether they were judged to perform well, poorly, or average) under different value sets and quantified discrepancies. The strength of association between hospital performance rankings generated with different value sets was measured using Spearman’s rank correlation coefficient
One motivation for considering patient valuations in assessing hospital performance is the desire to provide prospective patients with information that will inform their choice of hospital. Yet most patients are unwilling to travel far for health care treatment,40–42 with a recent study 43 suggesting that more than 92% of THR patients in the English NHS chose to attend 1 of their 5 closest hospitals in the period 2010 to 2012. We therefore also explored the impact of value sets at the local level; for each patient, we assessed how many of their 5 closest hospitals would be flagged as performing well or poorly under the different value sets. This “choice set” was determined by the straight-line distance between the centroid of the patient’s LSOA of residence and the hospitals’ postcodes. 43
Results
Descriptive Statistics
Table 2 reports descriptive statistics of the data samples. Patients in the national PROMs program sample were, on average, 68 y old, and 58.7% were female. Most patients had suffered from joint-related symptoms for 1 to 5 y prior to surgery. The average improvement in HRQoL 6 months after surgery was equivalent to an increase of 0.43 value points (from 0.37 to 0.80; GP-TTO-VAL value set), and patients’ overall assessment of their health as measured by the EQ-VAS increased by 12 points (from 65 to 77). Patients described their preoperative HRQoL using 148 of the 243 possible EQ-5D-3L health states. The relative frequency of these health states was consistent with the severity of the conditions that require major joint replacement. More than 46% of patients reported extreme limitation (i.e., level 3 problems) on at least 1 HRQoL dimension before surgery, and >2% reported extreme limitations on 3 or more dimensions.
Descriptive Statistics of PROMs and MVH Samples
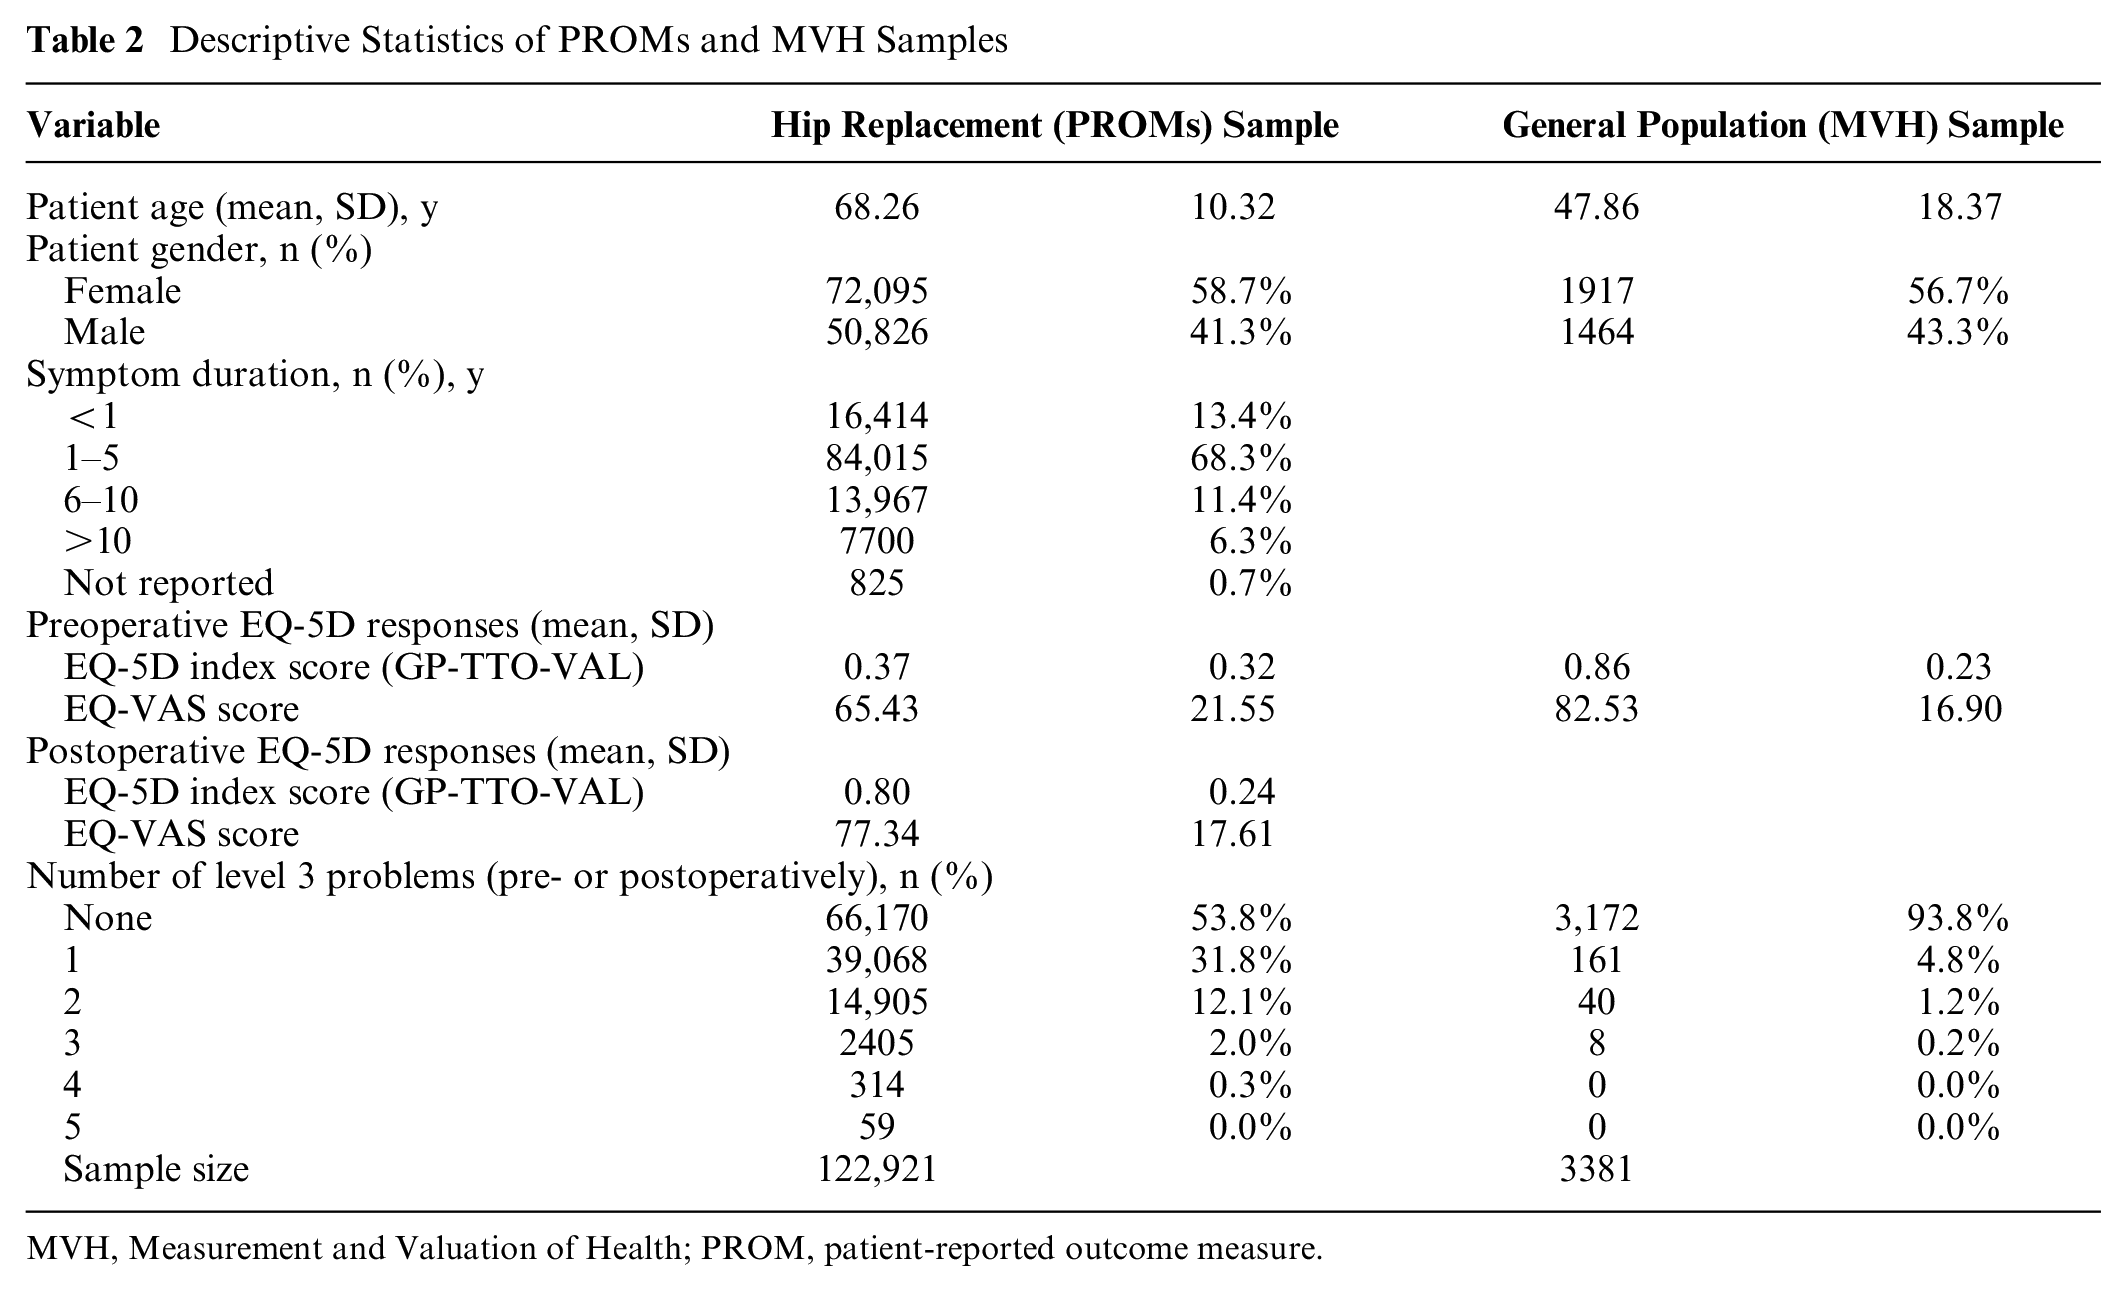
MVH, Measurement and Valuation of Health; PROM, patient-reported outcome measure.
Unsurprisingly, MVH study participants reported better health on average than the patient sample, both before and after surgery. They were, on average, significantly younger (mean age = 47.9 y) than the patient population but showed a similar sex split (56.7% female). Participants described their health using 77 of the 243 EQ-5D-3L health states, with 4.8% of participants having at least 1 extreme limitation on any of the 5 health dimensions. The average VAS score was 82.5, and the average EQ-5D value based on the GP-TTO-VAL value set was 0.86.
Value Sets
Table 3 reports the estimated PAT-VAS-OWN and GP-VAS-OWN value sets alongside the published GP-TTO-VAL and GP-VAS-VAL value sets. Coefficient estimates represent decrements associated with some or extreme limitations on a given health dimension. The constant and the N3 term reflect global decrements that are applied in the presence of any limitations on any health dimension and at least 1 extreme limitation on any health dimension, respectively.
Estimated EQ-5D Health Dimension Decrements and Standard Errors
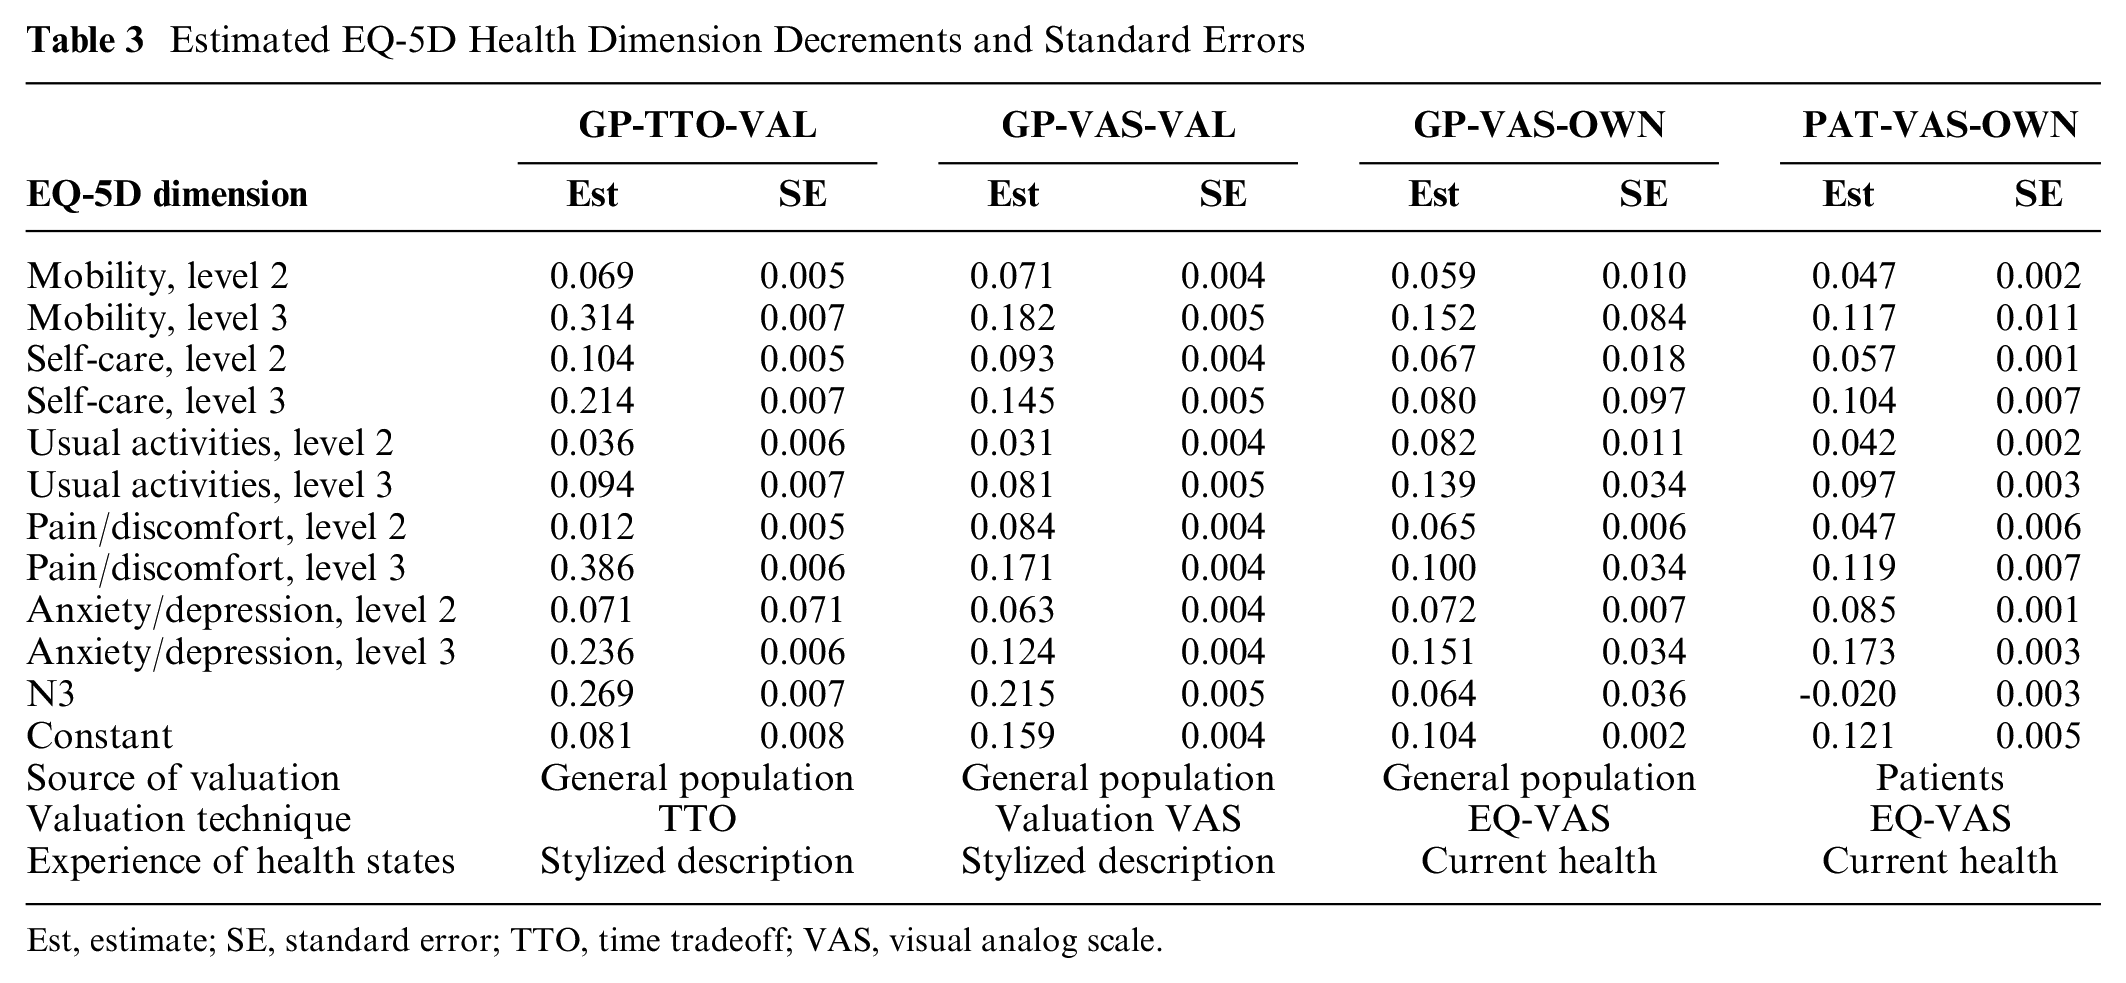
Est, estimate; SE, standard error; TTO, time tradeoff; VAS, visual analog scale.
Figure 1 shows the values generated by the different value sets for the 42 stylized health states valued in the MVH study.
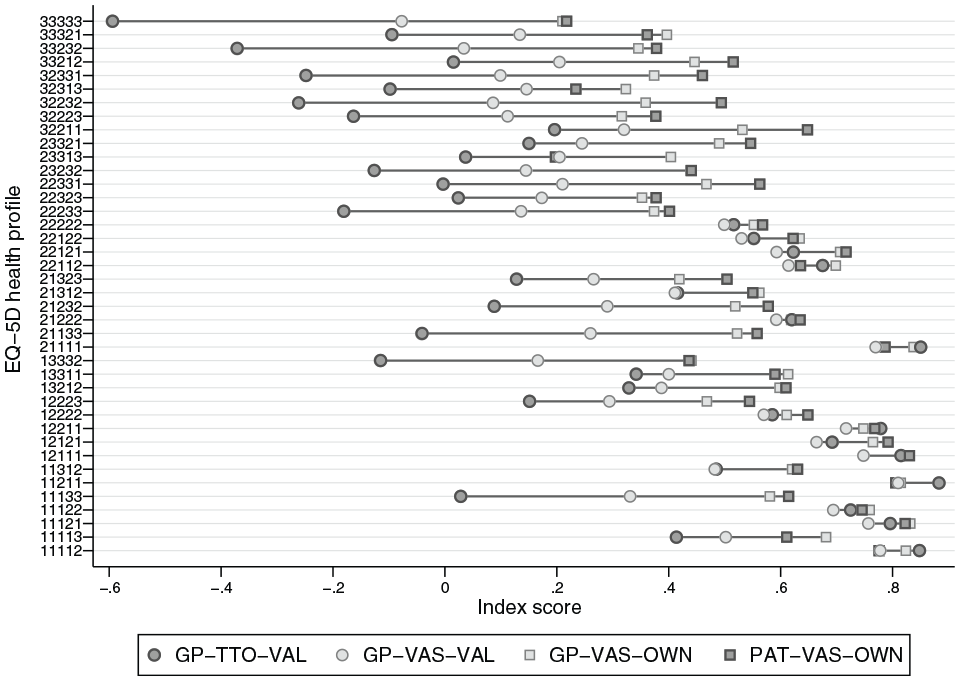
Selected health state valuations under different value sets.
Both PAT-VAS-OWN and GP-VAS-OWN value sets were found to be internally consistent; that is, more severe limitations are associated with larger decrements for each dimension. Patients assign approximately equal or smaller decrements to health problems on a given dimension than the general public, but they attach a larger global decrement to the presence of any health problems, as reflected in the coefficient on the constant term. Differences are more pronounced on level 3 decrements than on level 2 decrements, thus generating a wider spread of index scores across the 4 value sets for health states for which respondents reported at least 1 extreme problem. These results are consistent with previous evidence from other patient populations.7,44 It should be noted that because of the smaller sample size, the GP-VAS-OWN data have sparse observations in some of the levels within dimensions, particularly mobility level 3, which means that the coefficient estimates have very large standard errors.
Table 4 reports descriptive statistics of the pre- and postoperative index scores reported at patient level (mean, SD) as well as the range of hospital average scores calculated using the 4 value sets. Differences in average index scores are more pronounced prior to surgery than afterward, which reflects the low number of patients reporting any extreme problems after surgery. The 2 value sets based on direct valuations of own, currently experienced health (GP-VAS-OWN, PAT-VAS-OWN) generate, on average, higher index scores as well as a smaller spread of hospital average index scores that are relevant for performance assessment. Histograms of case-mix adjusted hospital scores are presented in the supplementary online appendix.
Index Scores at Patient Level (Mean, SD) and Range of Scores at Provider Level under 4 Value Sets

Impact on Judgments about Hospital Performance
Figure 2 presents scatter plots of hospital z-scores derived under different EQ-5D value sets. Each scatter point represents 1 hospital, with dashed lines indicating the lower and upper boundaries at which performance estimates are deemed to be statistically significantly different from the national average. Performance estimates that would lead to differential judgment under the 2 value sets being compared are highlighted as diamonds (significant under the first but not the second value set) or squares (vice versa).
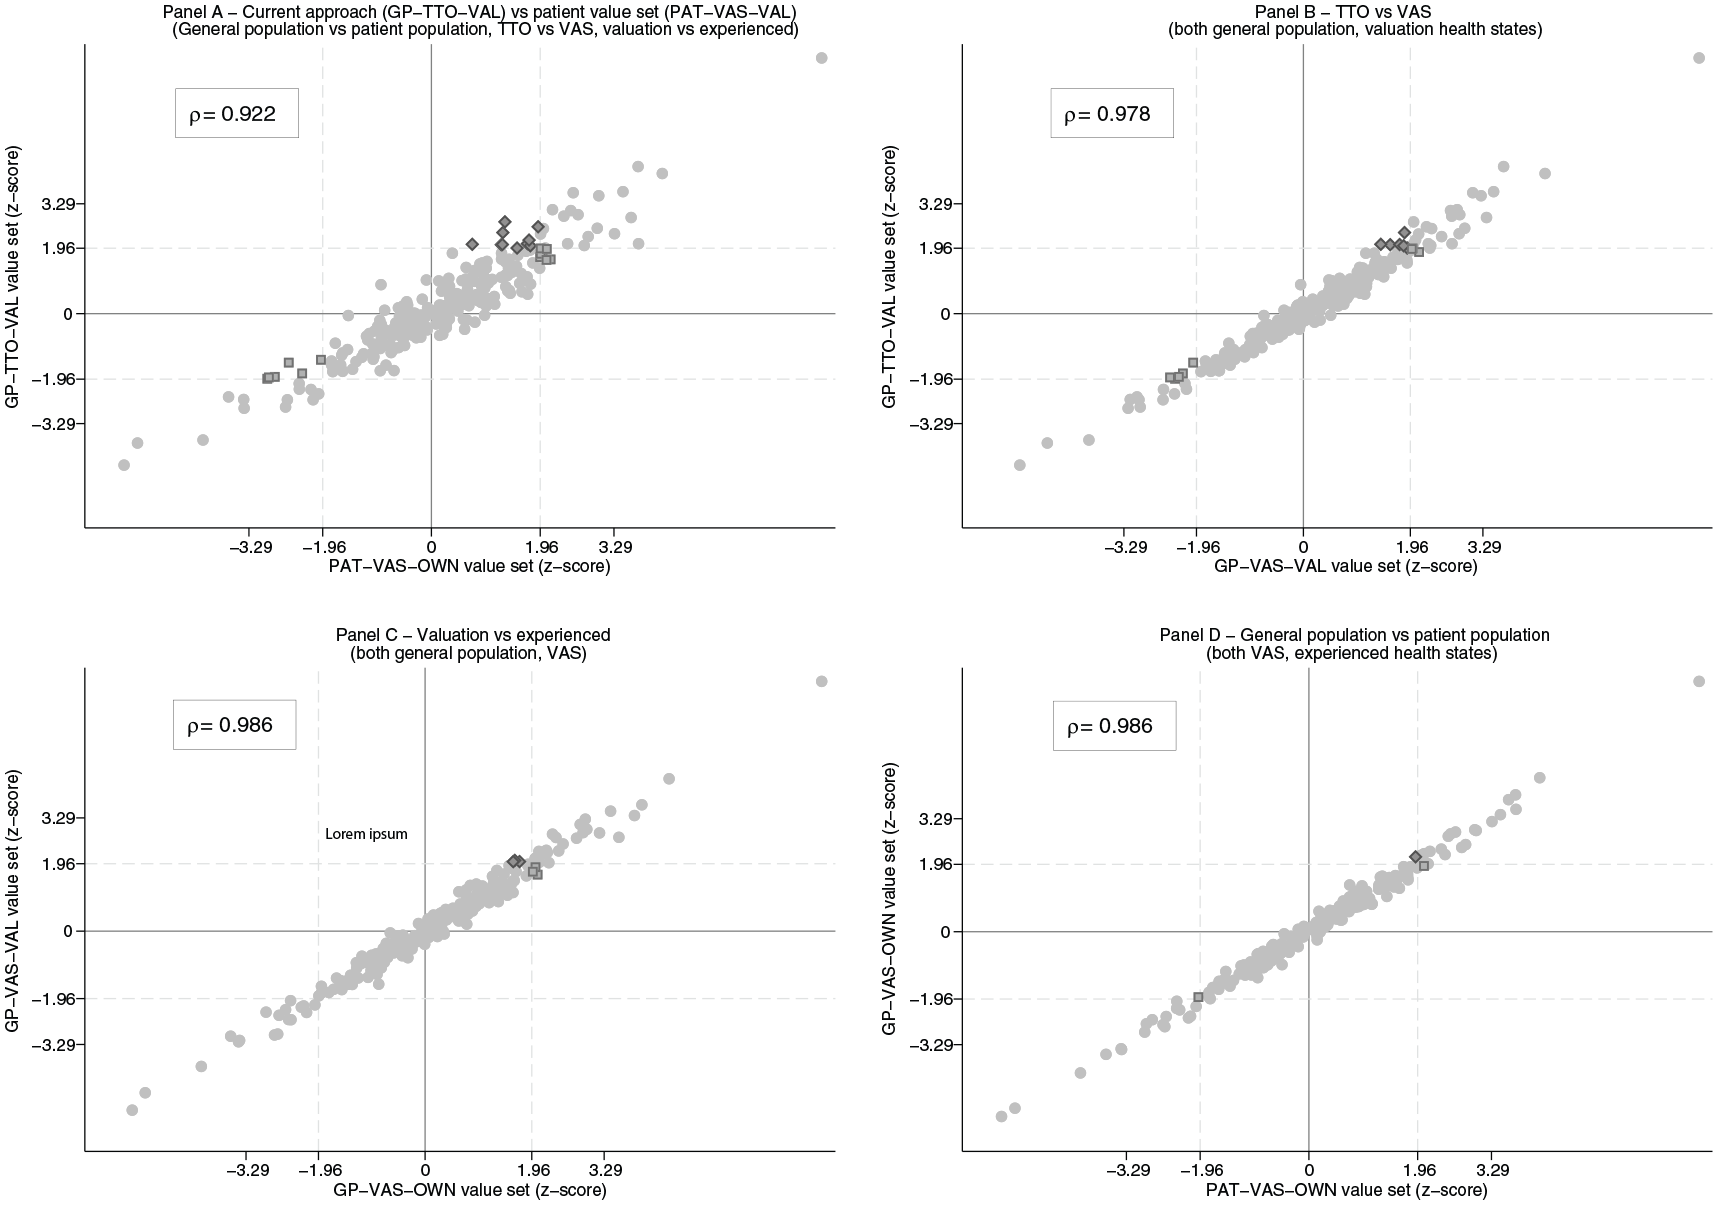
Relationship between hospital performance estimates under different value sets.
The GP-TTO-VAL and PAT-VAS-OWN value sets generate performance estimates that are highly correlated (
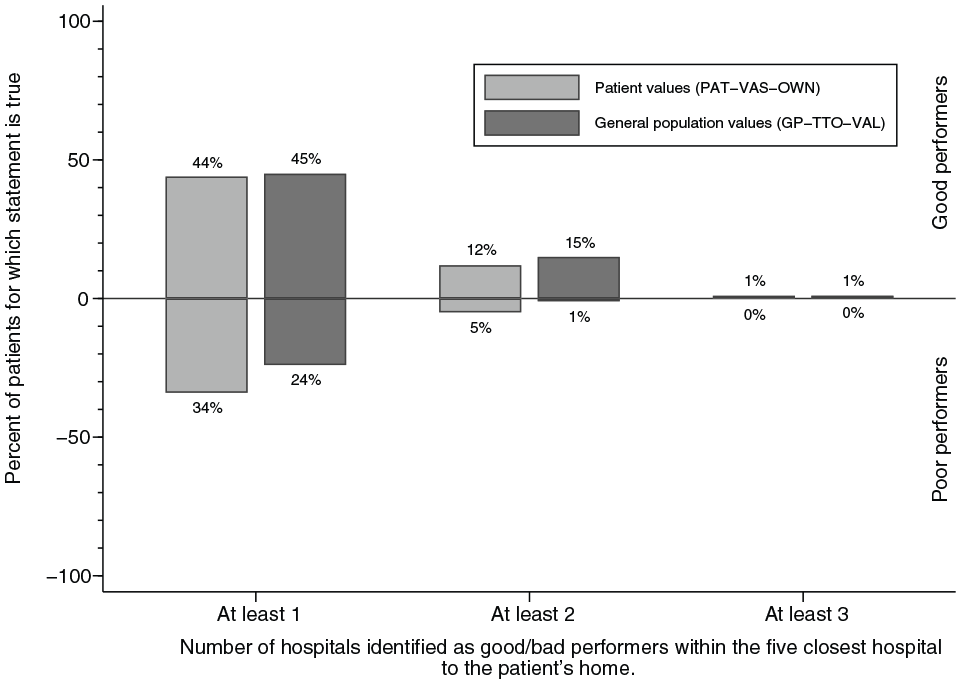
Number of statistically significant good/bad performers within patients’ 5 closest hospitals under different value sets.
To further explore the reasons for this divergence, we compared hospital performance estimates derived varying 1 value set design characteristic (i.e., source of valuation, valuation technique, or experience with health state) while holding the others constant (Figure 2B–D). The results of this marginal analysis suggest that neither the source of valuation nor the level of experience with a health state drive the observed differences in hospital performance classifications. Instead, these differences can be explained nearly entirely by the choice of valuation technique employed, with Figure 2B showing many more changes in outlier status than Figures 2C and D.
Discussion
There is a strong normative rationale for using patient values to aggregate multidimensional HRQoL instruments when developing performance indicators to inform prospective patients’ choices of hospital. However, the standard practice in the English NHS has been to publish hospital performance indicators based on EQ-5D scores aggregated using general public values. The present study explores whether this practice may be distorting patients’ choice of hospital for hip replacement surgery given that there is some evidence of discrepancies between patient and general public values. We find a larger number of hospitals are deemed to perform poorly when a patient VAS tariff (PAT-VAS-OWN) is used compared with when the UK general population TTO tariff (GP-TTO-VAL) is used. Conversely, we find only slightly fewer hospitals are deemed to perform well when using the PAT-VAS-OWN instead of the GP-TTO-VAL value set. The choice of value set therefore appears to be more important for patients seeking to avoid poorly performing hospitals. Moreover, we find that the GP-TTO-VAL tariff overvalues the relative performance of hospitals that deliver improvements in pain/discomfort and mobility compared with the PAT-VAS-OWN tariff while undervaluing those that perform relatively well at addressing anxiety/depression problems. Importantly, these differences appear to be driven almost entirely by the difference in the health state valuation technique employed (TTO v. VAS) rather than the source of valuations. Therefore, our results provide little empirical support for a change in reporting practice in the English PROMs program because of normative concerns about the source of valuations.
In recent years, there has been considerable interest in the use of values that reflect individuals’ own health, rather than their estimated valuations of stylized health states, to derive value sets.22,45 The purported rationale for using experience-based’values is that they avoid some of the focusing effects that can occur in the valuation of stylized health states. 20 Furthermore, any need to reflect the preferences of the tax-paying general population, which mainly arises in the context of economic evaluation of new health technologies for use in publicly funded health systems, can be addressed by using a population survey. 22 One concern with this approach is that the data collected for the purposes of developing an experience-based value set may contain only a limited range of responses to the health state descriptive system. Our study provides further evidence to demonstrate the feasibility of developing an experience-based value set from large-scale, routinely collected PROM surveys. Patients in the hip replacement sample report their HRQoL according to 148 of the 243 possible EQ-5D-3L health states, covering a broad range of the instrument’s spectrum. By design, these are also the most commonly encountered health states in this population, limiting the need to extrapolate beyond the set of valued health states in most applications.
Although not the focus of our study, our findings also provide additional context to the debate about the comparability of EQ-5D-3L value sets developed in different countries. A study by Nemes and colleagues 46 developed an experience-based VAS value set for the EQ-5D-3L using data from patients undergoing elective total hip replacement in Sweden. The valuations of health dimensions in the Swedish study and those in our study are similar in that the most important dimension—both in terms of the decrements associated with the level 2 and 3 responses—is anxiety/depression (see Appendix Table A2 for estimates). Aside from this similarity, the relative importance of the various health dimensions differs systematically for the 2 value sets. This casts doubt on the ability to pool experienced-based value sets across countries, as recently suggested for TTO value sets based on valuations of health states derived from valuation studies. 47
There are a number of limitations to our analysis and proposed approach. First, a single patient group value set still requires aggregating valuations over a large number of patients with potentially heterogeneous preferences. Although it is reasonable to assume that the mismatch between the average patient value set and individual patients’ preferences is smaller than the mismatch with average general population preferences, there may be room for further refinement. Some existing work has explored how health state valuations vary with observable characteristics of the respondent, and this line of inquiry should be expanded. 48 Second, the relationship between direct valuations of health states as reflected in EQ VAS scores and patients’ EQ-5D-3L health profiles has been found to change from before to after surgery. 33 The reason for this discrepancy remains unclear. We have chosen to estimate patient valuations from their preoperative data since this reflects their ex ante valuations at the time of their decisions. However, one may also argue that postoperative valuations are appropriate as they reflect patients’ preferences over different outcomes once they have started to experience the benefits of treatment. This distinction is not the focus of this article, although we note that it appears to have little effect on hospital performance estimates, which are highly correlated under both value sets (ρ > 0.99; see Appendix Table A3 for the postoperative PAT-VAS value set and the supplementary online appendix for hospital performance scatter plots). Third, while we find that the source of valuation is not a major driver of hospital performance estimates when valuing health states using VAS, we cannot generalize this statement to other valuation techniques such as the TTO valuations currently used in the NHS. To test this, we would require TTO data from a sample of hip replacement patients, which we do not currently have access to. Fourth, the generalizability of the findings in our study is limited to the medical condition and the decision problem under consideration. Finally, the limited amount of provider variation in both intake and health gain following THR surgery may limit the role that valuations play in determining hospital performance estimates. 49 As routine PROM collection becomes more prevalent, this hypothesis will become testable.
In conclusion, the choice of value set to aggregate EQ-5D-3L health profiles in the context of the English PROMs program may have real implications for patients choosing hospitals for their THR surgery. This is particularly relevant when choices are based on simple heuristics (e.g., selection based on dichotomized performance status rather than index scores). However, this divergence does not appear to be driven by the source of health state valuations, a normative concern, but rather by the valuation technique employed, a technical matter.
Supplemental Material
MDM-19-321_online_supp – Supplemental material for Using EQ-5D Data to Measure Hospital Performance: Are General Population Values Distorting Patients’ Choices?
Supplemental material, MDM-19-321_online_supp for Using EQ-5D Data to Measure Hospital Performance: Are General Population Values Distorting Patients’ Choices? by Nils Gutacker, Thomas Patton, Koonal Shah and David Parkin in Medical Decision Making
Footnotes
Acknowledgements
The authors thank Helen Dakin, John Brazier, Matthijs Versteegh, 3 anonymous referees, and participants at the 2017 PROMs conference in Oxford and the EuroQol 34th Scientific Plenary Meeting (Barcelona, 2017) for useful comments and suggestions. The patient-reported outcome measures data are copyright 2012–2019, reused with the permission of NHS Digital. All rights reserved. No ethical approval was required for analysis of anonymized, secondary data.
The authors declared the following potential conflicts of interest with respect to the research, authorship, and/or publication of this article: NG, KS, and DP are members of the EuroQol Group.
The authors disclosed receipt of the following financial support for the research, authorship, and/or publication of this article: Financial support for this study was provided entirely by a grant from the EuroQol Research Foundation. The funding agreement ensured the authors’ independence in designing the study, interpreting the data, writing, and publishing the report.
References
Supplementary Material
Please find the following supplemental material available below.
For Open Access articles published under a Creative Commons License, all supplemental material carries the same license as the article it is associated with.
For non-Open Access articles published, all supplemental material carries a non-exclusive license, and permission requests for re-use of supplemental material or any part of supplemental material shall be sent directly to the copyright owner as specified in the copyright notice associated with the article.