
Abstract
Background
After curative treatment of primary non–small-cell lung cancer (NSCLC), patients undergo intensive surveillance with the aim to detect recurrences from the primary tumor or metachronous second primary lung cancer as early as possible and improve overall survival. However, the benefit of surveillance is debated. Available evidence is of low quality and conflicting. Microsimulation modeling facilitates the exploration of the impact of different surveillance strategies and provides insight into the cost-effectiveness of surveillance.
Methods
A microsimulation model was used to simulate a range of computed tomography (CT)–based surveillance schedules, differing in the frequency and duration of CT surveillance. The impact on survival, quality-adjusted life-years, costs, and cost-effectiveness of each schedule was assessed.
Results
Ten of 108 strategies formed the cost-effectiveness frontier; that is, these were the strategies with the optimal cost-health benefit balance. Per person, the discounted QALYs of these strategies varied between 5.72 and 5.81 y, and discounted costs varied between €9892 and €19,259. Below a willingness-to-pay threshold of €50,000/QALY, no scanning is the preferred option. For a willingness-to-pay threshold of €80,000/QALY, surveillance scanning every 2 y starting 1 y after curative treatment becomes the best option, with €11,860 discounted costs and 5.76 discounted QALYs per person. The European Society for Medical Oncology guideline strategy was more expensive and less effective than several other strategies.
Conclusion
Model simulations suggest that limited CT surveillance scanning after the treatment of primary NSCLC is cost-effective, but the incremental health-benefit remains marginal. However, model simulations do suggest that the guideline strategy is not cost-effective.
After curative intent treatment, with either surgery or radiotherapy, of operable stage I non–small cell lung cancer (NSCLC), a large proportion of patients still die of recurrences from the primary tumor or metachronous second primary lung cancer (SPLC). Regular surveillance scans are advised to detect recurrent or new cancers as early as possible. In the past, the scanning interval advised by the international guidelines issued by the European Society for Medical Oncology (ESMO), American Society of Clinical Oncology (ASCO), American College of Chest Physicians (ACCP), American College of Radiology (ACR), and National Comprehensive Cancer Network (NCCN) has varied widely because of low grades of evidence. Current recommended intervals are the same for all guidelines, but the level of evidence remains low.1–5 However, clinical practice still varies considerably.6,7
Currently, the evidence for surveillance scanning is low. The only large randomized controlled trial (RCT) in this field compared X-ray with computed tomography in 1775 patients, but it was stopped when its primary endpoint was not met. 8 Other available RCTs are very small and consist of very heterogeneous patient groups.1,2,9,10 Most surveillance studies are observational, retrospective, small-sized studies with follow-up that stopped after 5 y. These studies show conflicting results ranging from a significant survival benefit for frequent surveillance scanning to studies that show that symptom-based follow-up is more cost-effective than surveillance scanning.11,12
There are 2 important reasons for these conflicting results. First, some studies have been criticized as confusing lead-time bias with survival benefit.9,13 Second, there is a large variation in imaging equipment used, and it has been shown that such differences in equipment lead to stage migration and lead time bias.6,7,14
In theory, early detection can increase overall survival (OS) after resection of a primary stage I NSCLC tumor in 2 ways. 9 First, patients with oligo recurrence, defined as a limited amount of metastases with the primary site controlled, and patients with metachronous SPLC can still be treated curatively with surgery or radiotherapy.15,16 Delayed detection allows the SPLC or metastases to grow further, possibly having a negative impact on treatability and 90-d mortality after treatment. However, oligo recurrences and SPLC occur in only approximately 10% of the patients; thus, the expected survival advantage from early detection in patients with early-stage NSCLC is small.
Second, it has been suggested that early detection and treatment of metastatic disease can increase postrecurrence survival (PRS). In the absence of RCT data, this is difficult to confirm; it is almost impossible to separate PRS from lead-time bias.9,13
Given the limited availability of high-quality evidence to inform decision making, the framework of a microsimulation model is useful to explore the theoretical boundaries of surveillance scanning on patients’ survival and on cost-effectiveness. 17 Besides the surveillance schedules suggested by the guidelines, many other strategies of varying intensity can be simulated, which cannot all be studied in clinical trials. Microsimulation modeling allows the exploration of the potential impact of many different surveillance strategies and ranks them according to their relative cost-effectiveness.
Therefore, we used a previously developed microsimulation model for early-stage NSCLC to investigate the costs, life-years gained, and quality-adjusted life-years (QALYs) for different surveillance strategies. Our objective was to identify the optimal surveillance strategy in terms of cost-effectiveness in the Dutch setting.
Methods
Microsimulation Model
A previously developed microsimulation model was extended for the purpose of this cost-effectiveness analysis (CEA). 18 The model consists of 2 components that closely interact: the disease model and the clinical pathway (Figure 1). The disease model simulates underlying tumor growth to determine recurrence-free survival and the OS for each patient. The clinical pathway describes clinical actions and keeps track of the life-years, QALYs, and costs accumulated by patients in the model.
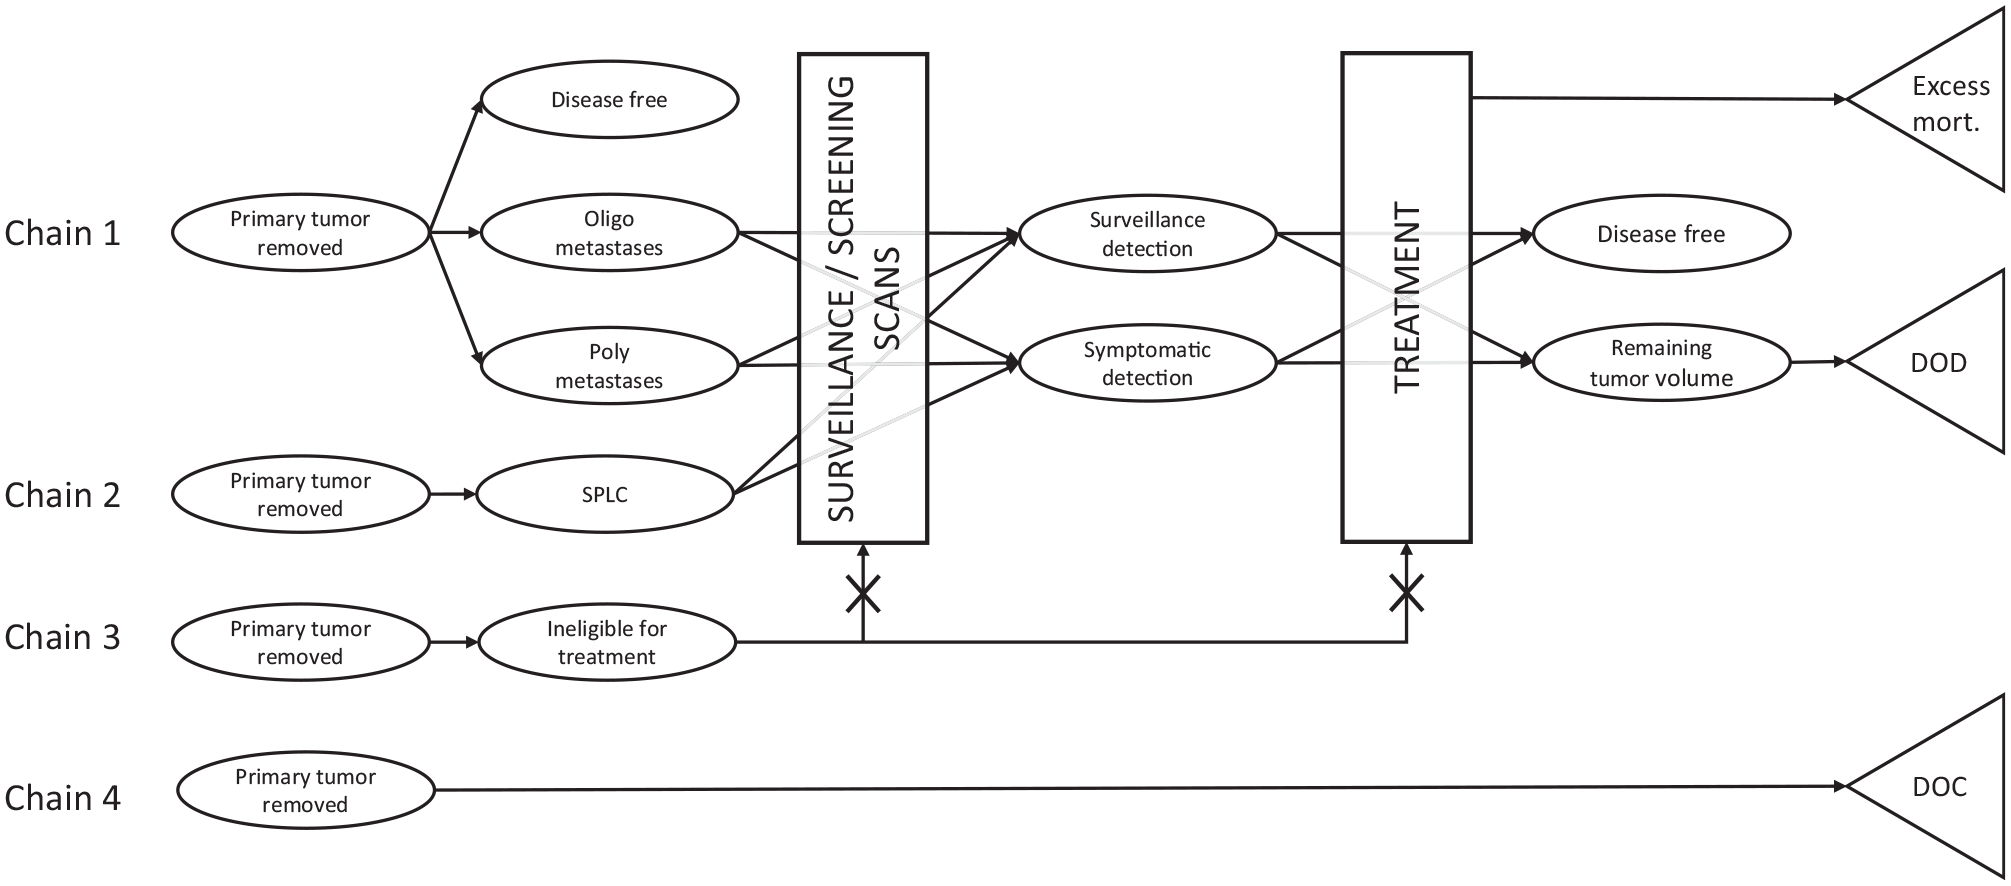
The disease model (ovals) interacts with the clinical pathway (rectangles). Death states are shown with triangles. This combination determines the timing of detection on a scan or symptomatic detection of metastases and second primary tumors. There are 4 parallel chains that operate simultaneously: 1) recurrences of the primary tumor, 2) the hazard of developing a second primary tumor (SPLC), 3) the hazard of becoming ineligible for surgery or chemotherapy, and 4) the hazard of death from other causes (DOC). As a result, patients can for instance simultaneously have recurrences, and a second primary tumor, and be untreatable. Patients can also die of cancer (DOD), or from the treatment (excess mortality). Death states are mutually exclusive. Example life histories are shown in Appendix 1.1.
Simulations start by generating a hypothetical population of 100,000 treatable stage I NSCLC patients. For this purpose, a life table for the simulated stage I NSCLC population was used, containing statistics on age, sex, and remaining life-years until death due to other causes than cancer, adjusted for smoking. 18 In the simulated patient population, all primary tumors are assumed to be successfully treated, without complications or mortality. However, a proportion of the population (Pmicrometa) has undetected metastases after treatment of their primary tumor. The remaining patients cannot get recurrences. Simultaneously, all patients are at risk for developing a SPLC, with a constant lifelong hazard per year λSPLC. Recurrences or SPLC can be detected either symptomatically or with a surveillance scan. The most important parameters for this study and their source are found in Table 1. Model details, such as the mathematical functions that determine the transitions in the model, and the evidence used for parameter estimation can be found in the Supplementary Appendix Section 1. Model details particularly relevant for the current evaluation are described below. The model was programmed in C++, and model output was analyzed using the dampack package in R hosted on GitHub available at https://github.com/DARTH-git/dampack and IBM SPSS statistics version 22. 19
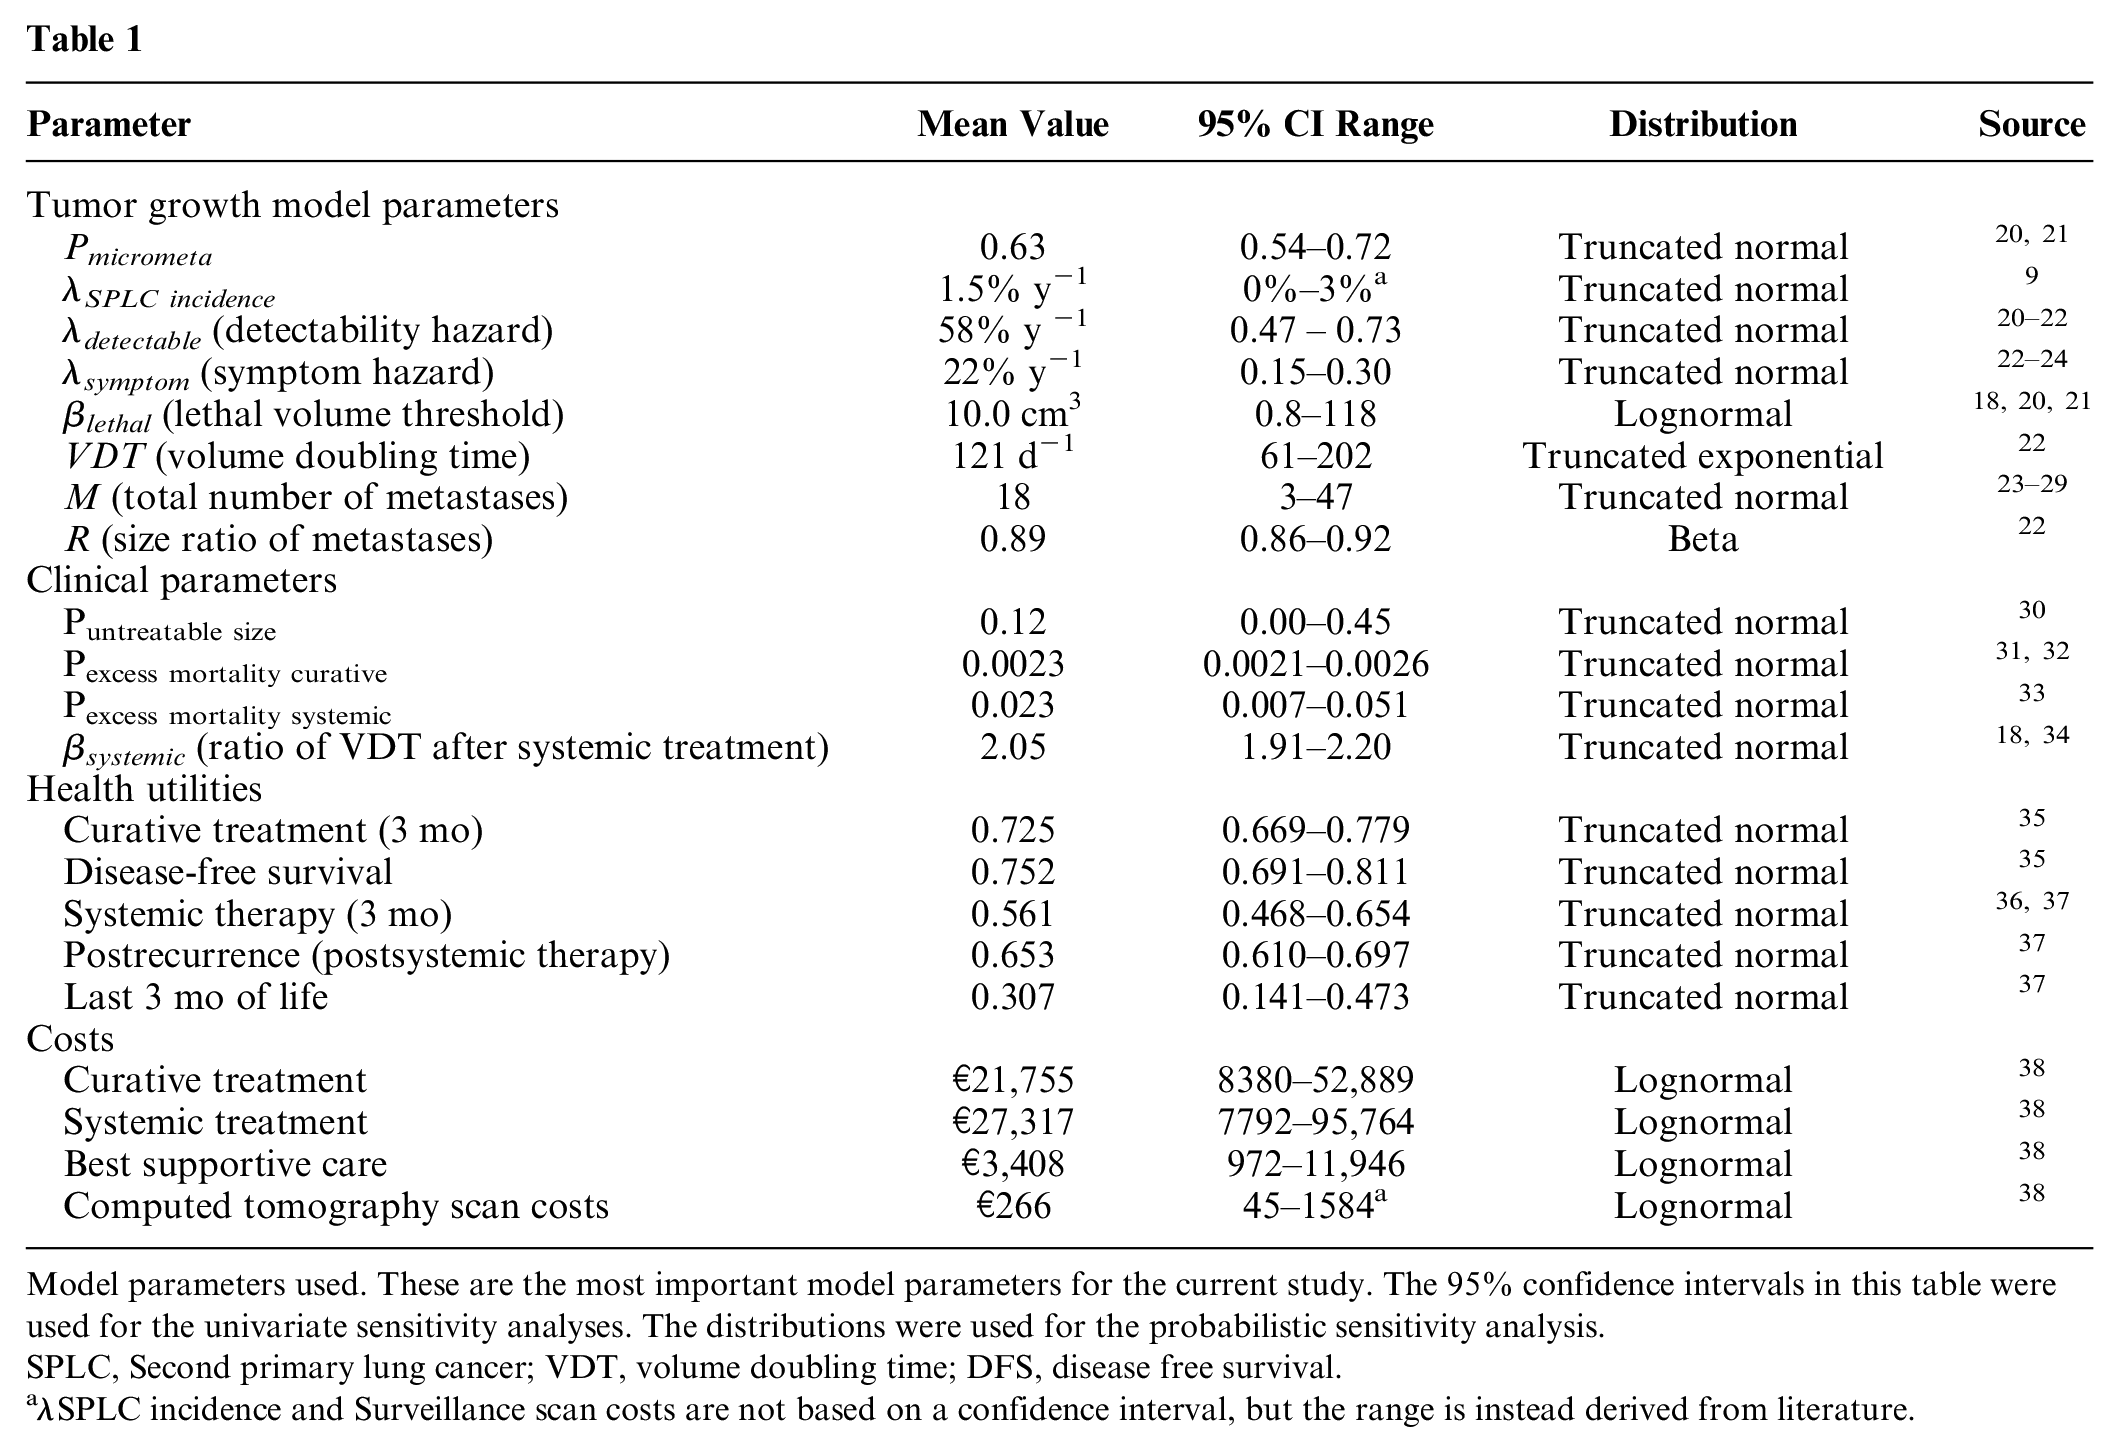
Model parameters used. These are the most important model parameters for the current study. The 95% confidence intervals in this table were used for the univariate sensitivity analyses. The distributions were used for the probabilistic sensitivity analysis.
SPLC, Second primary lung cancer; VDT, volume doubling time; DFS, disease free survival.
λSPLC incidence and Surveillance scan costs are not based on a confidence interval, but the range is instead derived from literature.
Tumor Growth and Detection
The core of the model consists of underlying tumor growth after curative treatment for the primary tumor. Some tumor growth parameters are patient specific: volume doubling time (VDT), number of metastases (M), and ratio of the sizes of each of the 2 consecutive metastases (R). These are drawn separately per patient for the metastases of the primary tumor and for SPLC and its metastases. For a detailed description of the growth functions, see the supplementary material (Appendix 1.2).
Once metastases grow to the minimum detectable size (a sphere of 5-mm diameter), they become detectable on a scan. This is also assumed to be the minimum size at which metastases can become symptomatic. The time at which the largest metastasis reaches the detectable size is governed by a constant hazard λdetectable. Similarly, the time for each metastasis to become symptomatic is governed by λsymptom. The combination of the hazards for detection of the largest metastasis, either through symptoms or surveillance; the VDT of all metastases; the size ratio between consecutive metastases; and the timing of surveillance scans together determine whether a patient is diagnosed with metastatic recurrence of disease and the number of metastases found. λdetectable was calibrated to progression-free survival in curatively treated stage I NSCLC patients,20–22λsymptom was calibrated to the percentage of patients with symptomatic detection,22–24 and the number of detected metastases was calibrated against the prevalence of detected oligo recurrences supplemented with expert opinion.23–29
Surveillance Schedules
The ESMO and other guidelines (ASCO, ACCP, ACR, and NCCN)1–5 suggest performing surveillance scans every 6 mo for 2 y and 1 scan per year afterward. In the past, the guidelines also generally split surveillance schedules into an early and a late phase, with different scanning frequencies. The early phase is often more intensive, because recurrence rates decrease over time. Most guidelines keep lifelong annual surveillance in the late phase for detection of late recurrences and SPLC. To determine the optimum strategy, 108 strategies were generated and compared.
These strategies were generated by combining early surveillance scanning frequencies (none, every 3 mo, every 6 mo, every 9 mo, or yearly) and late surveillance scanning frequencies (none, ½ yearly, yearly, 1½ yearly, or 2 yearly) and switching from early to late surveillance scanning after a fixed number of years (1, 2, 3, 4, or 5; Supplementary Appendix Figure 3). Identical schedules were removed, and the remaining 108 strategies are subsequently compared for cost-effectiveness.
In the article, we will use compact coding of the strategies as follows. An early surveillance frequency of every 3 mo, with switch after 5 y, and a late surveillance frequency of once every half year will be denoted by EARLY_3_Switch_5_LATE_0.5. Strategies are also numbered in the figures and tables.
Curative Treatment of Recurrences and SPLC
The micro-simulation starts right after curative treatment of the primary tumor, when the surveillance schedule starts. When, during the surveillance, either oligo recurrences (3 or fewer recurrences) or SPLC is detected and the patient is considered treatable, curative therapy can be given. Treatability is determined by 3 factors: 1) whether both SPLC and oligo metastases are present, 2) a patients’ general health, and 3) tumor size. Curative treatment is not an option when either both SPLC and oligo recurrences are detected at the same time or when a patient already has received a curative treatment for either SPLC or oligo recurrences before. In those cases, it is assumed that the patient has become too frail for further curative treatment, because of loss in lung or other organ function.
Second, a proportion of the patients will deteriorate in health and become ineligible for treatment, for instance because of comorbidities or when their Eastern Cooperative Oncology Group score becomes greater than 2. However, data on the deterioration of a combination of such factors are not available. Data of Dutch stage I NSCLC patients showed a linear decline in the proportion of individuals treated with surgery between the ages 65 and 90 and can be used as a proxy for health detoriation. 39 In the model, the time of health deterioration is randomly drawn between the ages 65 and 90, but after treatment of the primary tumor. Once this occurs, the patient is no longer eligible for curative treatment or chemotherapy. At each surveillance time point, the patient’s general health is also monitored. Untreatable patients are no longer eligible for surveillance scans and are instead referred to best supportive care when symptoms occur.
The third reason to refrain from curative treatment of SPLC or oligo recurrences is a tumor size larger than 180 cm3. Those tumors have a chance to be untreatable (Puntreatable size), corresponding to the reduction in curative treatments performed between T2N0MO and T3N0M0 tumors in the Dutch population. 30
The location of SPLC or oligo metastases may also have an effect on the prognosis and outcomes of a patient. Analyses of a number of small retrospective studies that report numbers of metastases per site showed large differences. This may be explained by the use of surveillance computed tomography (CT) of the thorax with or without the abdomen, which can affect the frequencies of detected oligo adrenal metastases and oligo liver metastases, making it impossible to calculate an average frequency per site. For this reason, we have chosen to pool and average the curative treatment of oligo metastases and SPLC to a single curative treatment “health state” with its own average prognosis, quality of life, and costs.
If a patient receives curative treatment for oligo recurrences or SPLC, there is a risk of dying from this treatment. Both oligo recurrences and SPLC are rare, and excess mortality risk is therefore assumed to be the same as for the primary tumor. The probability for excess mortality after curative treatment (Pexcess mortality curative) was estimated using linear regression combining primary tumor sizes and probabilities of excess mortality from the literature.31,32
After curative treatment, all detected oligo recurrences or SPLC are assumed to be removed. Undetected recurrences, that is, those recurrences that were below the minimum detectable size, can again be detected on a scan or become symptomatic in time. For this reason, patients repeat the same surveillance schedule after their second curative therapy.
Systemic Treatment
Patients with more than 3 detected metastatic recurrences, a second oligo metastatic recurrence, or a second SPLC may receive systemic therapy such as chemotherapy. In patients receiving systemic therapy, the VDT is reduced because of the treatment (βsystemic) from the time of receiving systemic therapy onward (Supplementary Appendix 1.2). Systemic therapy also has a fixed risk of excess mortality (Pexcess mortality systemic).
Costs and Health Utilities
Costs and health utilities were taken from a previous study and inflated to 2019. No costs or disutilities were included for curative treatment at baseline, as the simulation starts after this treatment. Because, to our knowledge, no costs and utility estimates for curative treatment of SPLC and oligo metastases are available, we used the estimates for surgical treatment of the primary tumor instead. 18 Costs and health utilities of systemic treatment for multiple recurrences were assumed to be the same as for patients who receive systemic treatment in stage IV. The available data on costs for stage IV patients was split between patients who received systemic therapy and those that did not 38 (Supplementary Appendix Table 1). Utilities of patients with systemic therapy were lowered for 3 mo, after which they were assumed to be the same as patients without systemic therapy. The total costs and health utilities for each state are shown in Table 1.
Probabilistic Analysis
The CEA was carried out using a lifelong time horizon and a health care perspective. Dutch discounting rates of 4% for costs and 1.5% for effects were used, and analyses were repeated using the international World Health Organization (WHO) discount rates of 3% (Supplementary Appendix 2.3). 38
During the simulations, the model keeps track of the following outcomes: disease-free survival (DFS), life-years lived, QALYs, and health care costs incurred.
Current guidelines for health-economic evaluations advise using the mean of a probabilistic sensitivity analysis (PSA) to obtain the average cost and effect estimates for each strategy, instead of simulating a cohort of patients using point estimates for all model parameters. 40 Therefore, discounted costs and QALYs of all 108 strategies were analyzed in a PSA.1–5 The distributions used in the PSA are provided in Table 1 for all model parameters. Most parameters remained the same as in the previous publications.18,22 Many parameters were drawn from a truncated normal distribution, to prevent negative parameters from being drawn, even though the frequency of this occurring was low. As such, we do not expect truncation to affect the mean values of the parameters and outcomes. A Latin hypercube algorithm was used to randomly draw 1000 parameter sets consisting of a specific combination of parameters. Each parameter set was used to simulate each of the strategies. The appropriateness of using 1000 parameter sets in the PSA was explored using a convergence test in Supplementary Appendix 2.2.
Average values for the discounted costs and QALYs were used to create a cost-effectiveness plane and a cost-effectiveness frontier, depicting which strategies are cost-effective. To visualize the impact of uncertainty in the model parameters on model outcomes, a cost-effectiveness acceptability curve (CEAC) and an expected loss curve (ELC) were created.19,41,42 Both curves are based on the net monetary benefit (NMB) of each strategy, given the willingness-to-pay (WTP) threshold. The NMB is calculated from the PSA output of discounted costs and discounted QALYs as follows:
An ELC depicts the expected difference between the NMB of each specific strategy and the maximum NMB achieved within the same PSA parameter set as a function to the WTP threshold. Thus, the ELC reflects the average loss in monetary terms that would result from choosing a specific strategy instead of the one that has the highest net benefit.
The efficiency frontier of optimal strategies that can be depicted both within an ELC plot and a CEAC (where it is called the cost-effectiveness acceptability frontier, or CEAF) shows which strategies have the maximum expected NMB. These are by definition the risk-neutral decision options.
As many strategies are compared, the differences can be small. Therefore, additional analyses were performed to investigate the proximity of strategies to the frontier. The WTP regions in which ELCs were less than €100 from the efficiency frontier in the ELC plot were registered. This €100 distance is extremely conservative, as most NMB values of the strategies in the PSA are larger than €106 (see Supplementary Appendix 2.1).
Additional univariate sensitivity analyses were performed to explore parameter uncertainty and how this affects the model outcomes, as described in Supplementary Appendix 2.3 and 2.4.
Results
Average Model Outcomes
For Dutch discount rates, the expected costs and QALYs for all 108 strategies are shown in Figure 2 (see also Supplementary Appendix 3) together with the cost-effectiveness frontier connecting the set of potentially cost-effective strategies that dominate all other strategies directly or via extended dominance. Table 2 details the strategies that form this efficiency frontier and provides their incremental cost-effectiveness ratios. The results for the WHO discount rates can be found in Supplementary Appendix 2.1.
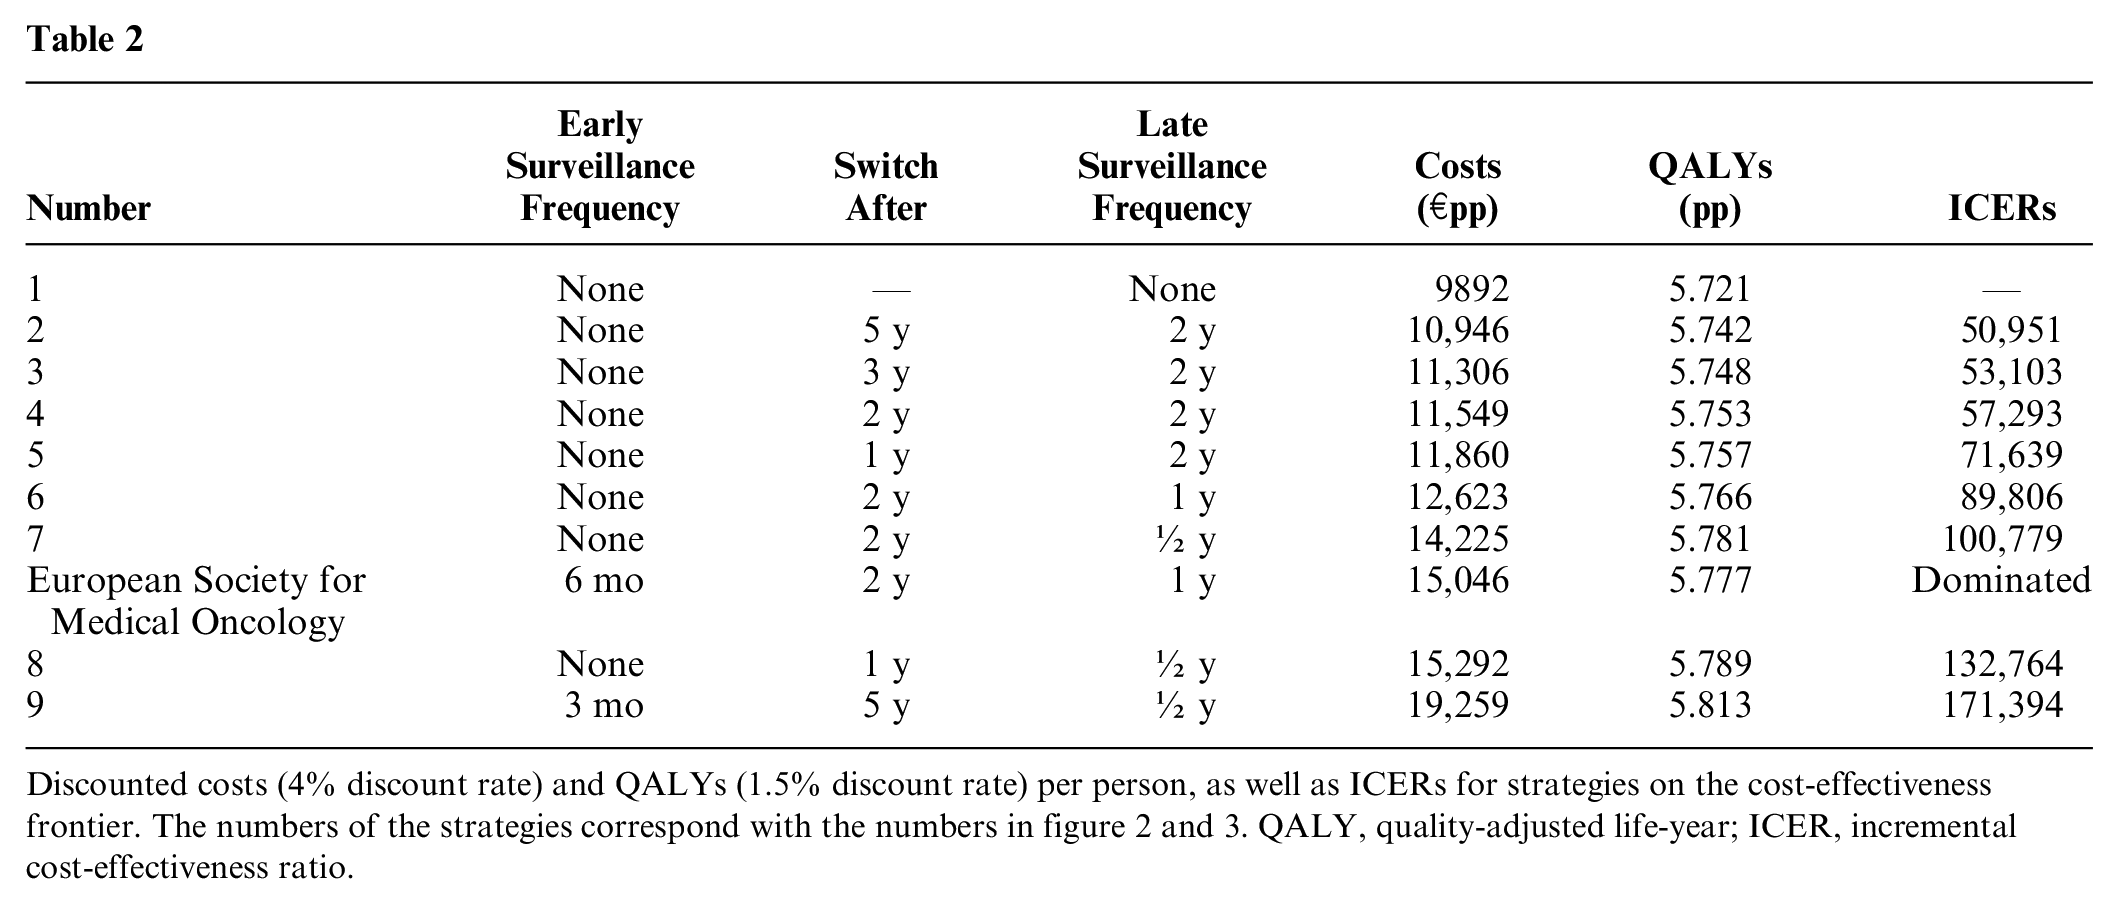
Discounted costs (4% discount rate) and QALYs (1.5% discount rate) per person, as well as ICERs for strategies on the cost-effectiveness frontier. The numbers of the strategies correspond with the numbers in figure 2 and 3. QALY, quality-adjusted life-year; ICER, incremental cost-effectiveness ratio.
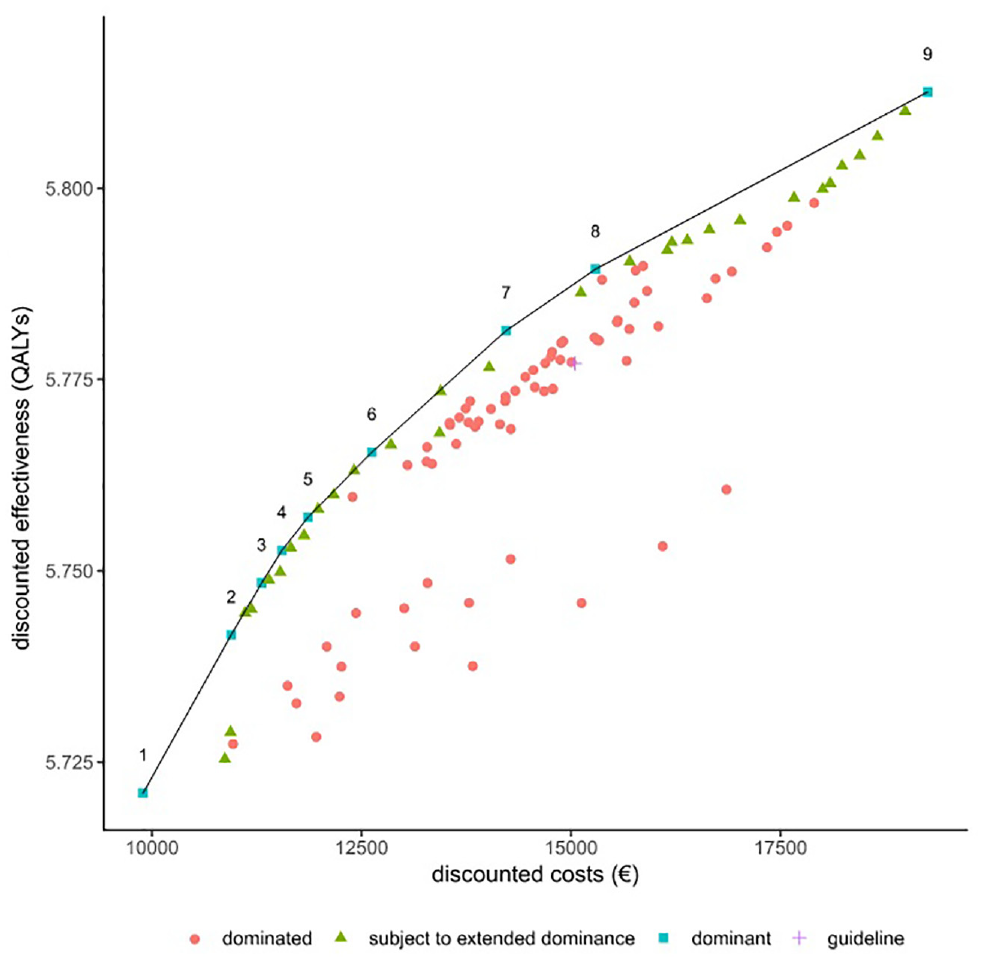
Cost-effectiveness plane and frontier (using Dutch discounting rates of 4% for costs and 1.5% for effects). The cost-effectiveness frontier (line) connects all potentially cost-effective strategies that dominate all other strategies directly (squares). All other strategies are either dominated (circles), meaning that they are more expensive and less effective than a strategy on the frontier, or subject to extended dominance (triangles), meaning that a combination of strategies on the frontier can be found that leads to higher effectiveness at the same costs or lower costs at equal effectiveness. The European Society for Medical Oncology guideline strategy (cross) is also dominated. The numbers of the strategies on the frontier correspond to the numbering of the strategies shown in Table 2.
As can be seen from Figure 2, as well as in Table 2, the difference in QALYs between strategies on the cost-effectiveness frontier are very small (between 5.721 and 5.813 QALYs pp). Cost differences are substantially larger, with a difference of €9367 per person between the cheapest and the most expensive strategy. As can be seen in Table 2, none of the strategies on the frontier include early surveillance, except for strategy 9, in which surveillance every 3 mo is performed for 5 y, after which CT surveillance continues every 6 mo (EARLY_3_SWITCH_5_LATE_0.5). All other strategies on the frontier effectively start scanning at the switch point. In strategy 1, no surveillance is done at all. This is the reference strategy and the preferred option for WTP values less than €50.000/QALY.
At increasing costs (€10,946 to 11,860 pp), cost-effective strategies are those that consist of surveillance scanning every 2 y, with the timepoint to start surveillance decreasing from 5 to 1 y after treatment as the WTP increases. The incremental cost-effectiveness ratios (ICERs) of strategies 2 (EARLY_0_SWITCH_5_LATE_2) to strategy 4 (EARLY_0_SWITCH_2_LATE_2) are close to the commonly used threshold of €50,000/QALY and can therefore be considered as good options for decision makers that consider €50,000/QALY as the societal WTP threshold.
At increasing costs per person (€ 12,623 to € 19,259 pp), the frequency of late surveillance increases to every one or two y starting one or two y after treatment of the primary tumor. EARLY_0_SWITCH_1_LATE_2, with surveillance scanning every 2 y starting 1 y after treatment of the primary, is the optimal strategy around a willingness-to-pay threshold of € 80,000/QALY. EARLY_3_SWITCH_5_LATE_0.5 is the most effective and most expensive strategy on the frontier. This is the only strategy with early surveillance scanning. However, the associated ICER is higher than commonly accepted thresholds, at € 171,394/QALY.
The strategy suggested by ESMO (EARLY_6_SWITCH_2_LATE_1) 1 is more expensive and less effective than strategy EARLY_0_SWITCH_2_LATE_0.5, and is therefore dominated.
Probabilistic Analysis
Figure 3 shows the outcomes of the PSA in a CEAC and an ELC. The frontiers (dashed black lines) in Figure 3A and B show which strategies have the highest expected NMB at each WTP. This corresponds to the strategies that one should adopt under a risk-neutral attitude to decision making.
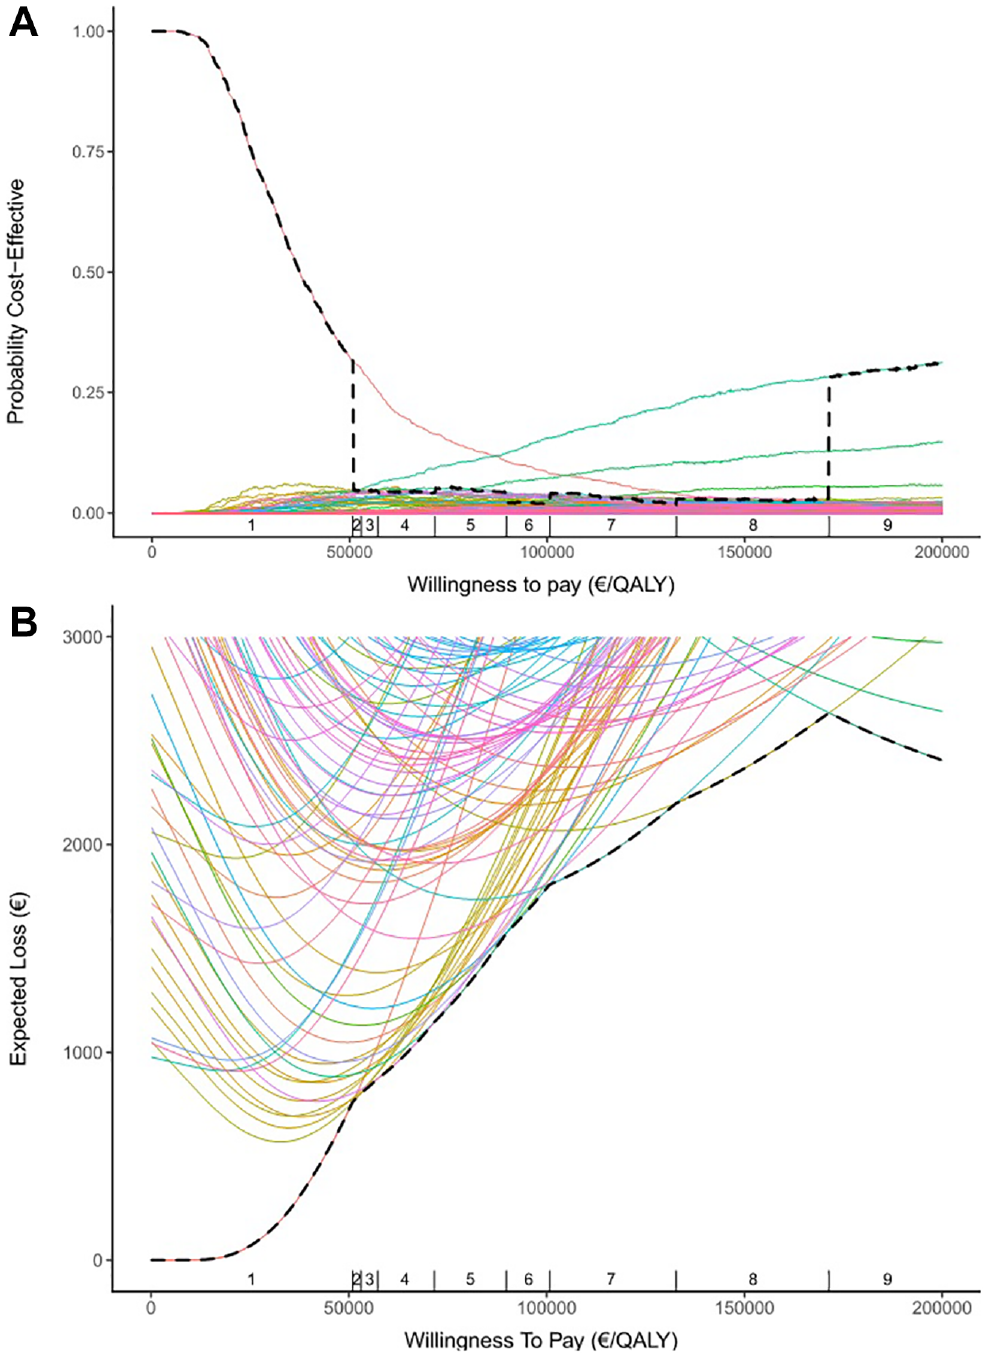
Graphical representations of the output from the probabilistic sensitivity analysis. (A) The cost-effectiveness acceptability curve (CEAC) shows for each strategy the proportion of simulations in which this strategy has the highest net monetary benefit (NMB), given the willingness to pay (WTP) in €/quality-adjusted life-year on the x-axis. (B) The expected loss curve shows for each strategy the expected difference between the NMB of that strategy and the maximum achieved NMB as a function of the WTP threshold. The frontier (dashed black line) follows the CEAC and expected loss curve of the strategy that has the highest expected NMB at each WTP and fully corresponds to the cost-effectiveness frontier in Figure 2. The vertical dashes on the x-axis correspond to the incremental cost-effectiveness ratios in Table 2 and depict the optimal strategy (numbers).
Figure 3A shows that the strategy no surveillance (EARLY_0_SWITCH_LATE_0) has the highest probability of having the highest NMB for a WTP of <€86,800/QALY, after which the most intensive strategy on the frontier, EARLY_3_SWITCH_5_LATE_0.5 (strategy 9 in Figure 3 and Table 2), has the highest probability. However, this does not necessarily correspond with the strategies that have the highest expected NMB at each WTP, as shown by the cost-effectiveness frontier and Figure 3B. These switch from strategy EARLY_0_SWITCH_LATE_0 to strategy EARLY_0_SWITCH_5_LATE_2 at €50,951/QALY, which corresponds to a large drop in the probability of having the highest NMB in the frontier of Figure 3A. It can be seen that between €50,951 and €171,394/QALY, all strategies on the frontier have a low probability to have the highest NMB, as is actually the case for most strategies. The reason for these results lies in the presence of “competition” between the strategies; that is, most strategies are correlated, and many of those also have extremely small differences in expected loss, favoring the most extreme strategies EARLY_0_SWITCH_LATE_0 (no surveillance) and EARLY_3_SWITCH_5_LATE_0.5 (most intensive surveillance) in the CEAC. As a result, there are several competing strategies that would be an approximately equally good (loss <€100) alternative as the optimal strategy at a specific WTP (Supplementary Appendix Table 2).
Additional Analyses
Repeating the same analyses with WHO discount rates of 3% for costs as well as effects results in lower QALYs and higher costs. As a consequence, strategies EARLY_0_SWITCH_5_LATE_2, EARLY_0_SWITCH_3_LATE_2, and EARLY_0_SWITCH_2_LATE_1 were no longer on the cost-effectiveness frontier, although they remained extremely close to the frontier on the CE plane. Instead, another strategy (EARLY_0_SWITCH_1_LATE_1.5) was added to the frontier (Supplementary Appendix 2.1).
Univariate sensitivity analyses show that the difference in costs and QALYs between no surveillance and the most intensive surveillance strategy (EARLY_3_SWITCH_5_LATE_0.5) are not much affected by changing individual model parameters. The incidence of SPLC has the largest effect on the effectiveness of surveillance scanning, while the scan costs have the largest effect on the total costs per patient (Supplementary Appendix 2.2).
Comparing the different strategies in terms of survival revealed that the largest difference in DFS between no surveillance and the most intensive surveillance strategy on the frontier is made in the first 2 y after treatment of the primary tumor. However, this does not translate in a substantial difference in OS between the 2 surveillance strategies (Supplementary Appendix 2.3).
Discussion
Main Findings
A microsimulation model of the growth of recurrent or incident tumors in curatively treated stage I NSCLC was used to analyze the cost-effectiveness of 108 different surveillance scanning strategies. Model projections showed that no surveillance scanning is the most cost-effective strategy for a WTP threshold below €50,000/QALY with 5.72 discounted QALYs and €9892 discounted costs. Surveillance scanning every 2 y starting 1 y after treatment of the primary is the most cost-effective strategy for a WTP threshold of €80,000/QALY with 5.76 discounted QALYs and €11,860 discounted costs. Overall, the differences in QALYs between the strategies were very small.
Findings Compared with Guidelines and Literature
Our findings stand in contrast to the ESMO guideline strategy (CT surveillance every 6 mo for the first 2 y after curative treatment, followed by annual CT surveillance) and other similar guidelines (ASCO, ACCP, ACR, and NCCN).1–5 Our model projections showed that the ESMO strategy is dominated by surveillance every 6 mo starting 2 y after treatment, which is both cheaper and more effective.
These guidelines advise more intensive surveillance in the early period after treatment of the primary tumor, as most recurrences from the primary tumor occur within the first 2 y. The guidelines’ general rationale is that intensive scanning causes a small increase in the early detection of recurrences and SPLC. Although the data vary on the impact of surveillance on OS, the assumptions are made that scanning causes no physical harm, and early detection must have some benefit on survival. 5
However, model simulations suggest that survival benefits of early detection can mostly be explained by lead-time bias. This explains the conflicting findings in the literature, as most retrospective studies that compare different frequencies of scanning do not show any significant increased OS with more intensive surveillance. Examples are Younes et al., who compared a very intensive surveillance strategy with “symptom detected” surveillance in 130 patients, and both Subramanian et al. and McMurry et al., who showed that increased surveillance intensities do not lead to improved survival when comparing postsurgery follow-up intervals of 3, 6, and 12 mo in 2442 and 4463 patients, respectively.11,12,43 This is in line with our survival curves, which show extremely small differences in OS between no surveillance scanning and scanning every 3 mo. Such small differences are difficult to detect in a clinical study with small numbers of patients and a relatively short follow-up time. One study shows that earlier detection of recurrences does not lead to clinically significantly longer survival. 44 Some studies do report significant survival benefits from more intensive surveillance13,24,45; however, these results are argued to be caused by lead-time bias rather than survival benefit, because of study designs that use postrecurrence survival. 9
In addition, from a cost-effectiveness perspective, the costs of more frequent scanning should be justified by the increased effectiveness of scanning. It should be noted that, in our study, for WTP thresholds less than €171,394/QALY, the set of cost-effective strategies, that is, those on the cost-effectiveness frontier, does not contain intensive early surveillance strategies. The reason for the better model-predicted cost-effectiveness balance for late versus early surveillance can be explained by the much higher health benefits from early detection of SPLC than from metastases of the primary tumor, which predominantly occur in the first 2 y. Furthermore, patients cannot benefit from early detection and curative treatment of SPLC if they also have metastases of the primary tumor.
Theoretical Limits to the Benefits of Surveillance
Furman et al. 46 made the argument that surveillance scanning should be considered only if meaningful treatment options exist. In the case of NSCLC, the most effective treatment option is curative treatment for oligo recurrences and SPLC. Unfortunately, both are relatively uncommon, and not all patients are amenable for curative treatment once oligo recurrences or SPLC are detected. 30 The treatment options for patients with polyrecurrences offer limited survival benefit, if any, rendering the benefit of early treatment of polyrecurrences questionable.
To be able to make any meaningful predictions on this topic, a model should therefore include these potential survival benefits. For this reason, curative treatment options for oligo recurrences and SPLC were included in the model, as well as the general notion that early detection of oligo recurrences and SPLC reduces the risk of inoperability and excess mortality. Furthermore, systemic therapy reduces the growth rate of the metastases in the model; thus, early detection of metastases in the model will lead to a longer survival time.
However, even with these model assumptions, we found that although more scanning leads to earlier detection, thereby affecting DFS, OS was hardly affected (Supplementary Appendix Figure 5). There are 4 explanations for this model finding.
First, tumors are not detected on a scan if they are below the minimum detectable size and are per definition detected when they become symptomatic. The potential shortening of the time until detection is therefore limited (Supplementary Appendix Figure 5). Second, the survival advantage of systemic therapy is small. Third, oligo recurrences and SPLC are rare. Therefore, the survival advantage for the average patient is low. Univariate sensitivity analyses show that DFS and OS are most affected by increased scanning when the SPLC incidence rate is high. Finally, in the model, unnecessary surgery on those oligo recurrences and SPLC with additional undetected metastases may be performed. Overdiagnosis is a potential harm of surveillance scanning, which can drive up costs and excess mortality after surgery. Intensive surveillance schedules will increase this risk.
Limitations
There are some limitations to this study.
By default, a limitation of decision modeling is the fact that a mathematical approximation of reality is constructed because the true problem cannot be easily studied. Although the best sources of evidence may be combined in a decision model to support evidence-based decision making, any model contains assumptions and extrapolations that may be difficult to verify or validate. For the current study, model validation would ideally be done using evidence from randomized clinical trials comparing different surveillance schedules. However, to compare surveillance schedules with respect to survival outcomes, large trials would be required. Westeel et al. 8 investigated surveillance with X-rays and CT scans by following the OS of 1775 patients for 8 y in an RCT. CT scans can detect smaller tumors, which can result in the earlier detection of metastases and SPLC similar to early detection when scanning with a higher frequency. However, significant differences in OS were not found. This study suggests that very large numbers of patients (about 10,000) might be needed to validate our model-simulated findings in an RCT setting. The model has been previously validated on real-world data 18 ; however, this was before the inclusion of second primary tumors in the model. Although it is not a formal validation, comparing our model-based results to smaller trials and observational studies confirm the general validity of our conclusions.11,12,30,43,44,47
We did not include in the model the quality-of-life impact of surveillance scanning. Undergoing a scan and waiting for the results may affect mental well-being and the fear of cancer recurrence and then lead to decreased quality of life of patients. On the other hand, surveillance scans could also lead to relief in cases in which no recurrence of disease is found. 48 It is unlikely that patients would be willing to accept a no-surveillance strategy, but whether patients are willing to wait 1 y for a first scan is unclear. As such, more research and patient involvement are needed to include this aspect into cost-effectiveness analyses.
Potential harms of radiation exposure by CT scans have not been included in the model. Estimates of these harms are 1 additional cancer death per 2500 patients in screening, which may be a similar number for surveillance scanning. 49 If more intensive surveillance would result in a relevantly higher SPLC incidence rate, this would decrease the benefits of surveillance even further.
New or other treatments and diagnostic technologies can affect the outcomes of this study. As scanning technology improves, smaller recurrences may become detectable on scans. However, at a diameter of less than 2 mm, it may become difficult to differentiate between benign nodules and new malignancies, resulting in a higher false-positive ratio. 9 Furthermore, our results show that small changes in the time of detection of metastases caused by using other scanning equipment are unlikely to lead to longer OS.8,9
Conclusion
Acknowledging the limitations that are inherent to decision modeling, our model-based findings suggest that limited CT surveillance scanning after treatment for primary NSCLC is cost-effective, but the incremental health benefit remains marginal. Surveillance scanning every 2 y starting either 2 y or even 1 y after treatment of the primary seems to be an acceptable alternative to no scanning for WTP thresholds of €50,000/QALY and €80,000/QALY, respectively.
Supplemental Material
sj-pdf-1-mdm-10.1177_0272989X20978167 – Supplemental material for Cost-Effectiveness of Surveillance Scanning Strategies after Curative Treatment of Non–Small-Cell Lung Cancer
Supplemental material, sj-pdf-1-mdm-10.1177_0272989X20978167 for Cost-Effectiveness of Surveillance Scanning Strategies after Curative Treatment of Non–Small-Cell Lung Cancer by Henri B. Wolff, Leonie Alberts, Elisabeth A. Kastelijn, Sherif Y. El Sharouni, Franz M. N. H. Schramel and Veerle M. H. Coupé in Medical Decision Making
Supplemental Material
sj-xlsx-2-mdm-10.1177_0272989X20978167 – Supplemental material for Cost-Effectiveness of Surveillance Scanning Strategies after Curative Treatment of Non–Small-Cell Lung Cancer
Supplemental material, sj-xlsx-2-mdm-10.1177_0272989X20978167 for Cost-Effectiveness of Surveillance Scanning Strategies after Curative Treatment of Non–Small-Cell Lung Cancer by Henri B. Wolff, Leonie Alberts, Elisabeth A. Kastelijn, Sherif Y. El Sharouni, Franz M. N. H. Schramel and Veerle M. H. Coupé in Medical Decision Making
Footnotes
The authors declared no potential conflicts of interest with respect to the research, authorship, and/or publication of this article.
The authors received no financial support for the research, authorship, and/or publication of this article.
References
Supplementary Material
Please find the following supplemental material available below.
For Open Access articles published under a Creative Commons License, all supplemental material carries the same license as the article it is associated with.
For non-Open Access articles published, all supplemental material carries a non-exclusive license, and permission requests for re-use of supplemental material or any part of supplemental material shall be sent directly to the copyright owner as specified in the copyright notice associated with the article.