
Abstract
We introduce the series of 7 tutorial papers on evidence synthesis methods for decision making, based on the Technical Support Documents in Evidence Synthesis prepared for the National Institute for Health and Clinical Excellence (NICE) Decision Support Unit. Although oriented to NICE’s Technology Appraisal process, which examines new pharmaceutical products in a cost-effectiveness framework, the methods presented throughout the tutorials are equally relevant to clinical guideline development and to comparisons between medical devices, or public health interventions. Detailed guidance is given on how to use the other tutorials in the series, which propose a single evidence synthesis framework that covers fixed and random effects models, pairwise meta-analysis, indirect comparisons, and network meta-analysis, and where outcomes expressed in several different reporting formats can be analyzed without recourse to normal approximations. We describe the principles of evidence synthesis required by the 2008 revision of the NICE Guide to the Methods of Technology Appraisal and explain how the approach proposed in these tutorials was designed to conform to those requirements. We finish with some suggestions on how to present the evidence, the synthesis methods, and the results.
This paper is the first of 7 tutorial papers on evidence synthesis methods in decision making, which are based on the Technical Support Documents (TSDs) in Evidence Synthesis prepared for the National Institute for Health and Clinical Excellence (NICE) Decision Support Unit and available from http://www.nicedsu.org.uk/. The TSDs are intended to support the appraisals process, which examines new pharmaceutical products in a cost-effectiveness framework, 1,2 by explaining the requirements in the 2008 revision of the NICE Guide to the Methods of Technology Appraisal, 3 by showing how analyses can be implemented so that they have the required properties, and by giving concrete, worked examples. Although aimed at those making, reviewing, and appraising submissions to NICE, the TSDs do not attempt to “prescribe” the form that analyses must take or the methods that must be used. Any methods fulfilling the required properties are valid. It should be noted that the 2008 methods guide will shortly be replaced by the 2013 revision, currently only available as a draft for consultation. The main changes in this draft, which have been largely anticipated by the TSDs, relate to trial inclusion criteria and presentation of the evidence and results. 4
This series of tutorial papers is intended primarily to introduce the proposed Bayesian evidence synthesis methods to a wider audience and to address evidence synthesis issues concerning the relative and absolute efficacy of interventions. In this introductory paper, we suggest how to use the tutorial series in practice, set out the key properties of evidence synthesis for decision making in NICE Technical Appraisals, and explain the reasons why the proposed approach is particularly suited to this context. We finish with some suggestions on how to present the evidence, the synthesis methods, and the results.
The methods used in NICE Technical Appraisals have tended to set a benchmark for methods used in other work that NICE undertakes. For example, the methods advocated in the 2008 Guide to Methods of Technology Appraisal are referred to in NICE’s 2009 Clinical Guidelines Manual, 5 and the 2012 update 6 refers directly to TSDs on which this tutorial series is based. Thus, the methods proposed are equally relevant to clinical guideline development and to comparisons between medical devices or public health interventions. The series does not, however, cover questions arising from the synthesis of data on diagnostic test performance 7 or general synthesis of epidemiological data, 8 largely because issues in diagnostic technologies, screening, and public health are outside the remit of the NICE appraisals process.
Using the Tutorial Series
The tutorial series can be used as a learning tool for anyone wishing to carry out evidence synthesis in the context of decision making, whether on clinical grounds or for cost-effectiveness. The methods can clearly be extended further into comparisons that set benefits against side effects and analyses based on multicriteria decision analysis. 9
The second tutorial in this series 10 sets out the proposed Bayesian framework and provides an extensive appendix with WinBUGS code for the core pairwise and Network Meta-analysis (NMA) model, with worked examples for various types of outcomes. This includes details of how to set up data, obtain key outputs, and present and interpret the results. Because of the modular nature of the code, once readers are familiar with the core NMA model for binomial data and how it needs to be changed for other data types, they will be able to adapt the code in the remaining tutorials (e.g., for meta-regression 11 or inconsistency checking 12 ) to suit their own data. Table 1 sets out the examples and data sets presented in the other tutorials in this series and summarizes what can be learned from studying them. However, before one attempts the Bayesian evidence syntheses proposed, a thorough grounding in Bayesian statistics and the use of WinBUGS 13 is required. The WinBUGS manual 14 and its online tutorial, particularly the “Blocker” example in the Help menu, as well as many other examples available elsewhere, 15,16 are key resources, as is an introduction to Bayesian methods. 16,17 Proper attention to the technical aspects of WinBUGS, such as convergence and burn-in, is essential.
List of Examples Used in the Tutorial Papers in This Series, with Details on the Type of Analysis Used and What Readers Can Learn from Each of the Examples
Note: NMA = network meta-analysis.
Having completed these preliminaries, readers will be ready to start analyzing their own data set. We strongly recommend starting with the simplest analysis, a pairwise meta-analysis, before attempting an NMA, using the code provided. 10 Once this has been mastered, one can step up to NMA and then to shared parameter models. 10 The methods for meta-regression including bias adjustment and inconsistency checking, described in the third 11 and fourth 12 tutorials in this series, can be attempted next, but at each stage it is essential that readers monitor all relevant parameters (nodes) and make sure they understand every aspect of the outputs and procedures for checking convergence before moving on to the next stage.
Readers interested in evidence synthesis for the baseline natural history model and in using the results of the synthesis in a probabilistic cost-effectiveness analysis (CEA) should also consult the fifth and sixth tutorials in this series. 18,19
All readers, whether experienced or not, may benefit from the checklist, 20 as this sets out what journal reviewers and the general reader are likely to question.
Evidence Synthesis in NICE’s Guide to the Methods of Technology Appraisal
Principles of Evidence-Based Decision Making and Distributive Justice
The 2008 methods guide, like all other documents and procedures at NICE, follows a set of basic principles. Some of these are derived from the legislation governing NICE’s establishment, others from one of its key foundational documents concerning social value judgments. 21 This sets out the principles of evidence-based decision making and directs that NICE must consider the “broad balance of clinical benefits and costs.” It also spells out principles of distributive justice. What emerges from these basic principles is a need to allocate scarce resources fairly, in a way that gives patients “equal access” to care, regardless of whether they have cancer, arthritis, or any other condition. This, in turn, leads to CEA based on optimizing expected net benefit, seen as monetized health gain minus cost.
The emphasis on consistency of approach, both across conditions and across appraisals, has implications for evidence synthesis, which we have interpreted as a requirement for a uniform approach to synthesis, that can be applied to trials in any area of medicine. This underlies our adoption of a generalized linear modeling (GLM) framework, 10 with a uniform set of criteria for model fit, model selection, and model diagnostics, 10 -12 regardless of the type of outcome (continuous, rate, proportion, etc.) that is recorded and reported. It also leads to “shared parameter models,” 10 because the synthesis method and results should not be affected by a trial’s reporting format. For example, one should be able to derive the same estimates whether trials report mean treatment differences or arm-based summaries, or whether events and time at risk or numbers of patients reaching end points are reported. Similarly, and for the same reason, it leads us to more complex models for synthesis of multiple outcomes 10,19 that may be reported differently in different trials.
Transparency
The social value document 21 also emphasizes procedural justice: Recommendations must be based on a transparent process, one that is open to challenge and revision. Related to this, NICE follows a principle of “inclusiveness”: different stakeholders, whether manufacturers, patients, or health care professionals, must all have an opportunity to comment on the scope of the recommendations and to challenge them. Comments must be responded to, and there are provisions for appeal. Although courts have not challenged the appraisal committee’s scientific reasoning or its decisions, they have intervened to insist that the basis for the decisions be fully explained. This degree of accountability and transparency, as well as the need for consistency between appraisals, has led us to advocate a relatively limited set of modeling options, 10,11,18 some criteria for choosing between them, 10 and liberal use of sensitivity analysis when there are insufficient grounds for choosing one option over another. 20 Although there is nothing to prevent those making submissions to NICE from using other methods if this can be reasonably justified, the fact that the apparatus for choosing one model over another can be made uniform across different types of data and models 10 is an essential prerequisite to meet requirements of transparency and consistency.
Role of Indirect Comparisons and Network Meta-analysis
The 2008 methods guide sets out the role of indirect comparisons and NMA in a somewhat disconnected, but consistent, way. The main principle is that “direct” evidence is strongly preferred, which means that the NICE “reference case” or default analysis should be based only on trials directly comparing the new treatments with standard comparators. Then analyses based on indirect evidence, or combined direct and indirect evidence (i.e., mixed treatment comparison or NMA), can be presented as an additional analysis.
In practice, it is well recognized that this advice can only be precisely applied where the decision facing the Appraisals Committee is between just 2 treatments. As soon as there are 3 or more treatments in the same decision problem, a method is required that constructs a coherent set of comparisons based on all the available trial evidence, ruling out a reliance on purely “direct” comparisons in modeling (unless all trials have arms for all the relevant treatments). This is precisely what NMA models are designed to achieve.
Relation between Pairwise and Network Meta-analysis
NICE has 2 appraisal processes, multiple- and single-technology appraisal (MTA, STA). In an MTA, a set of competing new products are compared with each other and with standard comparators, whereas in an STA a single new product is under scrutiny. Although an NMA is almost always used in MTAs, STAs may be based on pairwise synthesis or NMA. However, the methods guide requires that the methods of assessment be the same. The evidence synthesis models and the WinBUGS software for implementing them presented throughout this tutorial series 10,11 have precisely this property: The software will run either type of analysis without distinction, and the pairwise model is simply a special case of the NMA model in which only 2 treatments are being compared. This is not necessarily the case in other models, or software, for NMA. The Lumley model 22 for NMA cannot be run on pairwise meta-analysis or on indirect comparisons, nor in its published form can it deal correctly with trials comparing more than 2 treatments. These are serious shortcomings, as manufacturers, clinicians, and decision makers will want to be assured that there is a single, fair way of estimating treatment effects, regardless of the structure of the evidence.
Trial Inclusion and Exclusion Criteria in Construction of the Comparison Network
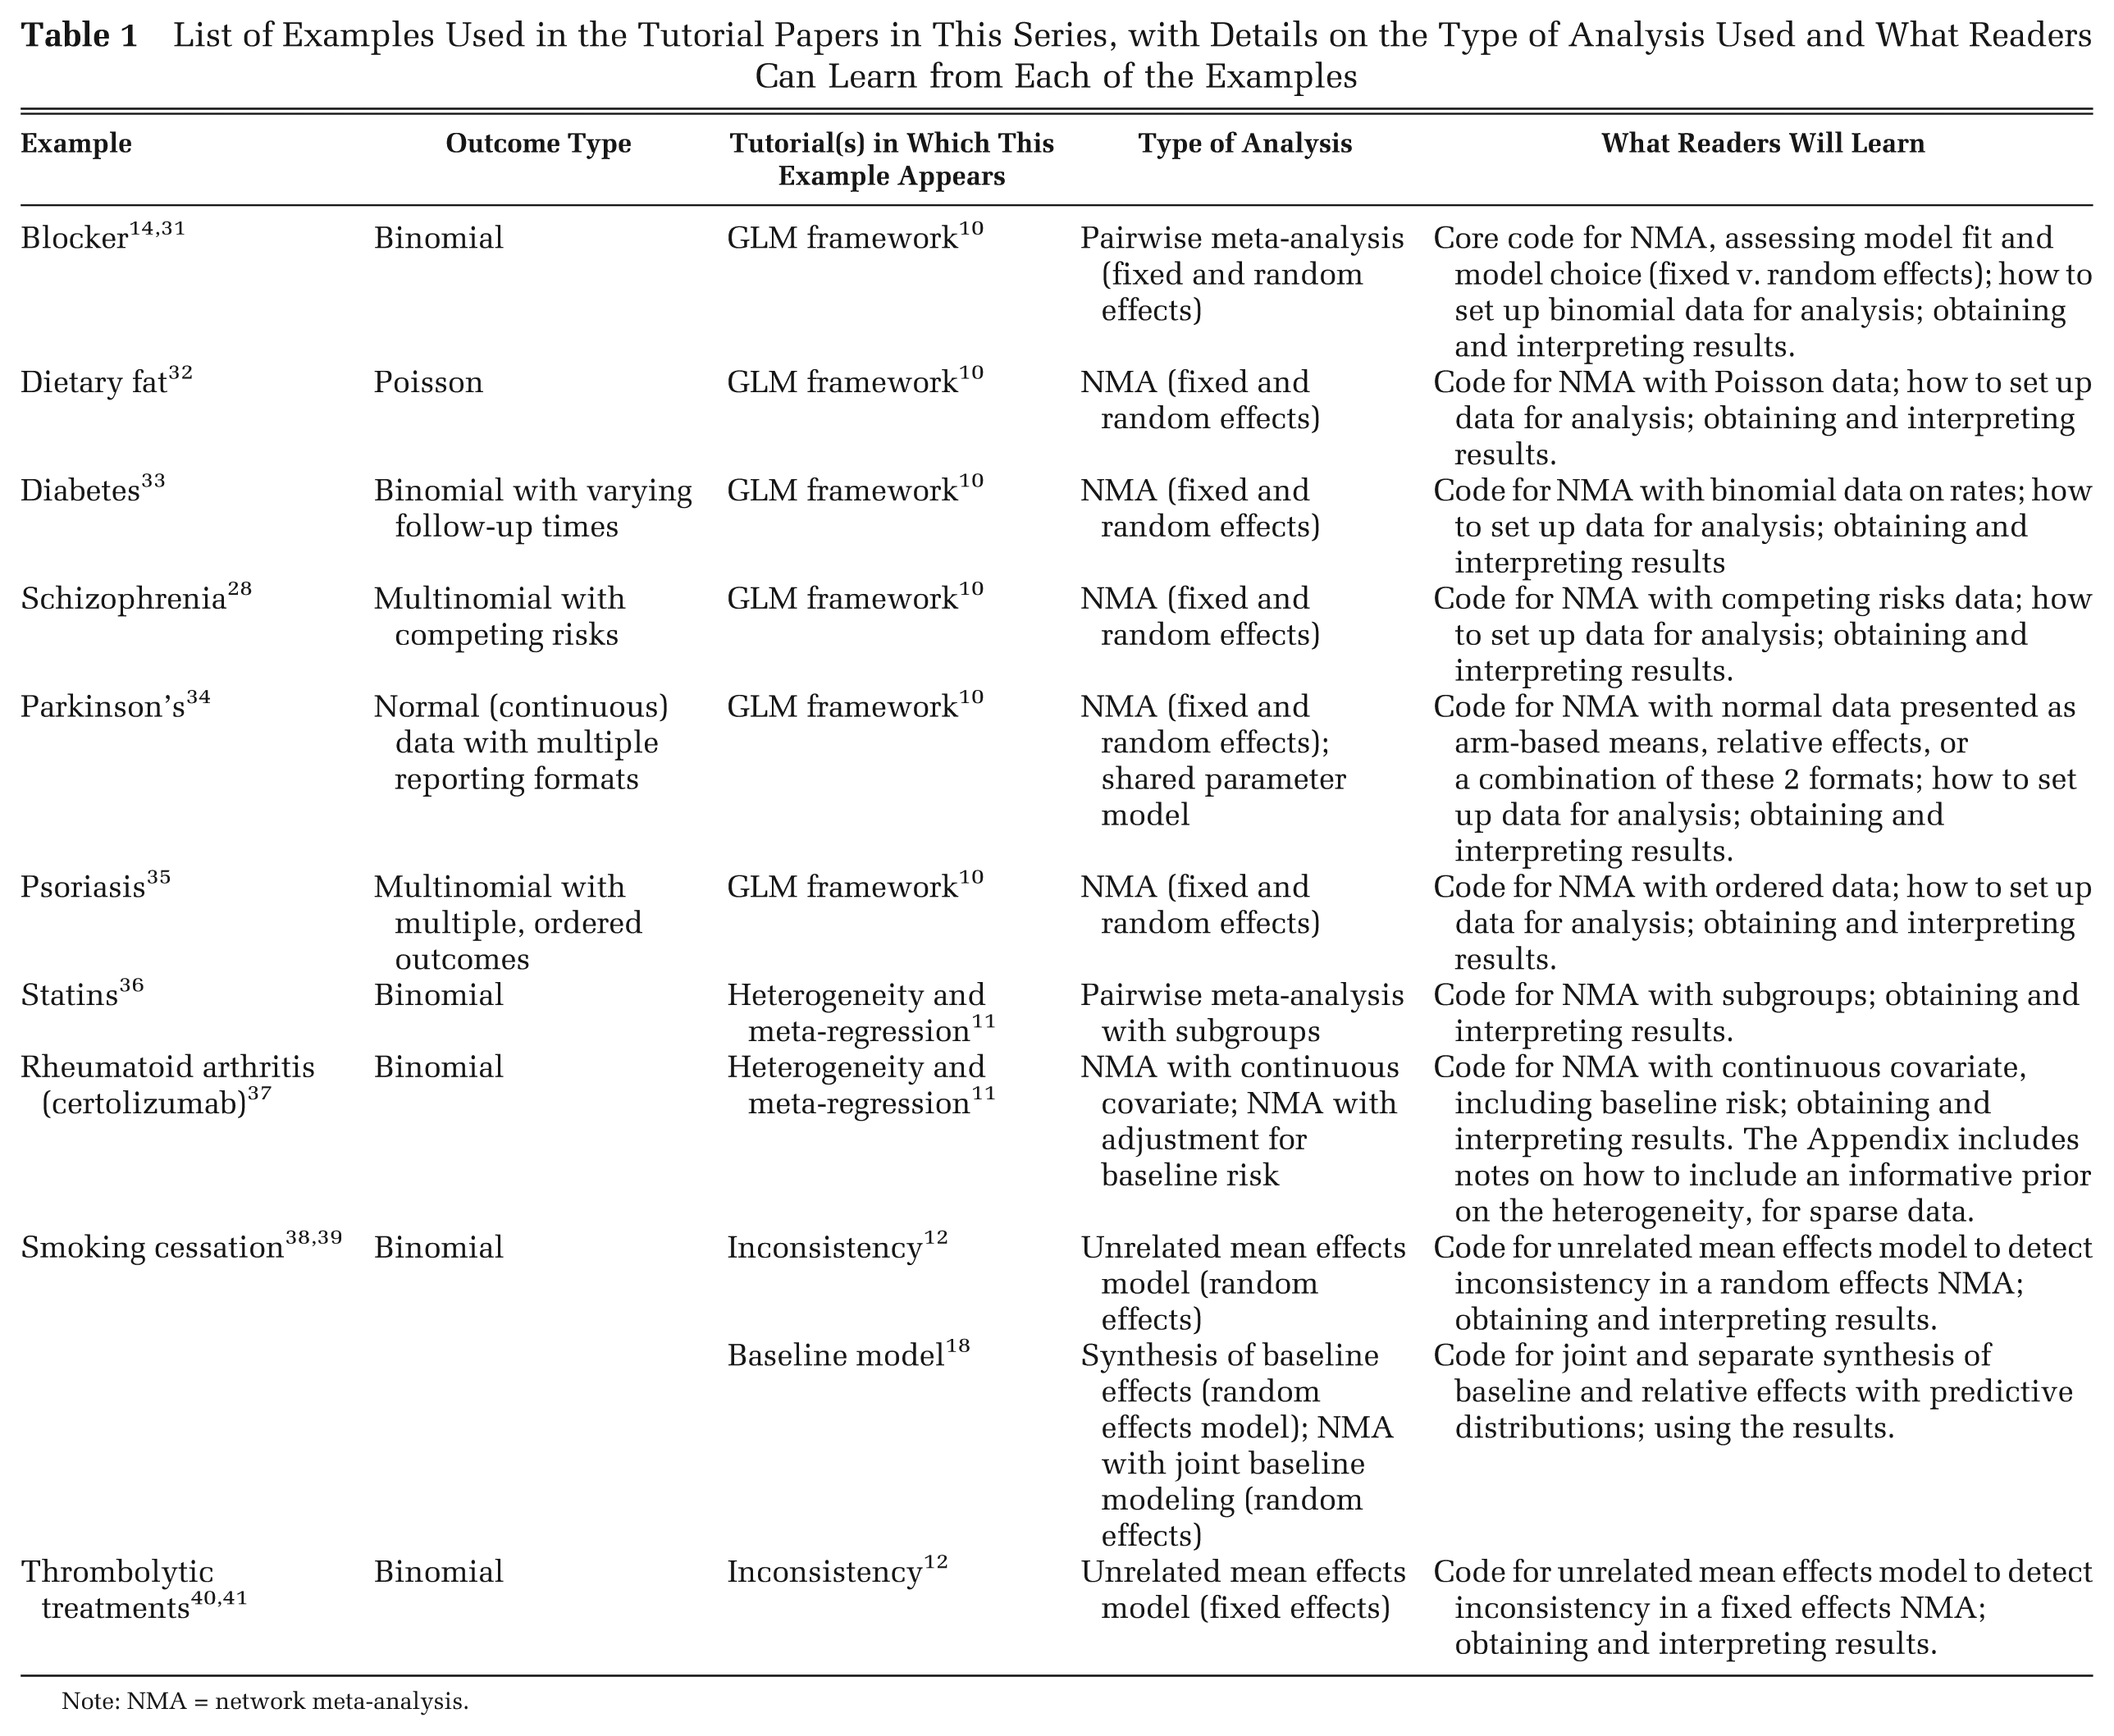
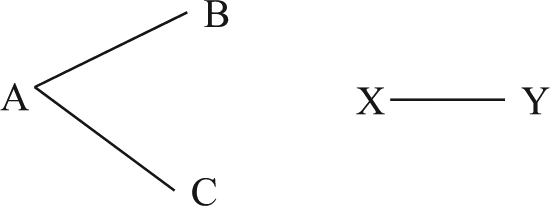
The 2008 methods guide explicitly allows submissions to present indirect treatment comparisons that include treatments that are not part of the decision problem, if their inclusion makes a “connected” network of randomized trials. Beyond that, however, little guidance is given on the size of a network or its construction. A connected network is one in which a direct or indirect comparison can be made between every treatment, based on randomized data, therefore allowing relative effects of every treatment relative to every other to be estimated (Figure 1). The draft of the 2013 revision to the methods guide 4 suggests the following simple rules for network construction. First, in Figure 2a, three treatments A, B, and C are of interest but an additional treatment X has been included because there are trials comparing A v. X and C v. X, thus forming a connected network. If treatments could also have been connected by the addition of A v. Y and C v. Y trials, then both X and Y should be added to the comparator set (Figure 2b). Next, every trial on the target population involving 2 or more members of the comparator set should be included. These rules are in the spirit of the preference for direct evidence and both limit the network to a minimum and identify a unique set of trials. However, this means that trial searching and treatment inclusion decisions may become an iterative process when the initial treatment network is not connected.
Disconnected treatment network. Lines represent a comparison of the connected treatments in at least one trial. The network formed by treatments A, B, and C is not connected to the network formed by treatments X and Y.
Treatment network in which the treatments relevant for the decision and for synthesis differ. Lines represent a comparison of the connected treatments in at least one trial. Treatments relevant to the decision are in bold. (a) Treatment X has been added to the synthesis because it links treatment C to the rest of the network (dashed lines); (b) Treatment Y also links treatment C to the network and needs to be added to the synthesis (long-dashed lines).
Bias in Randomized and Nonrandomized Evidence
The 2008 methods guide recognizes that randomized evidence is subject to potential biases regarding its internal and external validity and that nonrandomized evidence, which may be needed if trial evidence is weak, is even more vulnerable to these problems. At the same time it calls for all the available evidence to be integrated. This opens the possibility of various approaches to bias and covariate adjustment as part of the synthesis, which are described in the third tutorial in this series. 11
Modeling Natural History and Relative Treatment Effects
The 2008 methods guide envisages a “baseline” model that represents the patient’s natural history and care pathway on a standard treatment (e.g., usual care or placebo), to which relative treatment effects based on randomized evidence will be applied. It is envisaged that the natural history model will often be based on nonrandomized evidence and that there will be a need to extrapolate beyond the trial outcomes, as the default NICE base-case model requires lifetime benefits and costs. This kind of modeling approach, and relevant forms of synthesis, are described in the fifth tutorial in this series. 18
Subgroups and Meta-regression
Both effectiveness and cost-effectiveness of treatments can differ by patient subgroup, and this may occur because of differences in natural history or because of differences in relative treatment effects. Models based on differences in relative treatment effects 11 are permitted by the methods guide but need to be supported by a priori biological plausibility and statistical evidence for interactions and must be safeguarded against data dredging. Post hoc identification of subgroups is not precluded, but identification at the scoping stage is preferred. Individual participant data (IPD) are preferred for estimation of subgroup effects, and we describe meta-regression methods that can be used with aggregate data, individual data, or a combination of both. 11
Any proposed subgroup differences in general natural history require full documentation and justification although they present no additional synthesis or modeling challenges. However, NICE’s obligations under human rights, discrimination, and equality legislation prevent it from issuing guidance that denies patients access to treatments on the basis of age, gender, race, disability, socioeconomic status, or geographical location, except where these factors directly affect the efficacy of treatment. This rules out, for example, approval of a treatment in 65-year-olds but not in 75-year-olds just because the expected health gain is less in the latter group.
Uncertainty: Analytic Methods Compatible with Probabilistic Cost-Effectiveness Analysis
It is essential that evidence synthesis methods are fully compatible with the probabilistic CEA, as this is the NICE reference case. The methods guide emphasizes the need for correctly propagating parameter uncertainty and parameter correlation structure through to decision uncertainty, as the latter is a major consideration in appraisal committee decisions. The syntheses methods proposed throughout this series of papers, based on Bayesian posterior simulation from joint parameter distributions, are specifically designed to meet these requirements. However, other methods that also meet the requirements, at least under some circumstances, are described in the sixth paper in this series. 19
Sensitivity Analysis
Throughout the methods guide there is an emphasis on the use of sensitivity analyses in the presence of structural uncertainties of different types. Of particular relevance in evidence synthesis are the inclusion or exclusion of specific trials in an evidence network; the choice between fixed and random effects models, especially when this cannot be decided on the basis of goodness of fit; and the choice between models with and without various adjustments. Suggestions about the circumstances in which sensitivity analyses should be presented are mentioned throughout the tutorial series and also in the reviewer’s checklist. 20
Presentation of the Evidence, Results, and Methods of Evidence Synthesis
There is a need to present the input data for the CEA, the summary statistics of the parameters used in it, and the incremental costs and effects. The 2008 methods guide gives little detail on how to do this, but we suggest that when there are more than 2 treatments in the comparator set for synthesis, it is helpful to show a network diagram (such as Figure 2). Software for automatically drawing such diagrams is available as stand-alone programs with multiple capabilities (e.g., Pajek 23 ) or as packages and routines developed for R 24 among other programs.
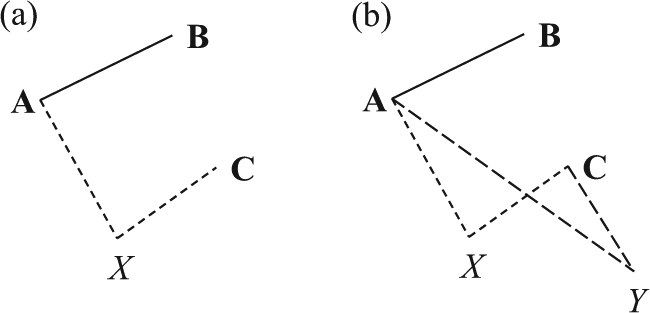
Further refinements in network diagrams that can be implemented in various software include 1) adding the number of studies making that comparison to each connecting line (Figure 3) and 2) having the thickness of the connecting lines reflect the number of trials on that contrast and the size of the vertices reflect the number of patients randomized to that treatment. 25 A second useful presentation of the data is as a table of the sort shown here in Table 2. It is also convenient to add columns indicating trial-level covariate values or whether IPD are available.
Parkinson network. 34 Each edge represents a treatment, and connecting lines indicate pairs of treatments that have been directly compared in randomized trials. The numbers on the lines indicate the numbers of trials making that comparison, and the numbers in brackets represent the treatment coding used in the analysis.
Certolizumab Pegol (CZP) for Rheumatoid Arthritis
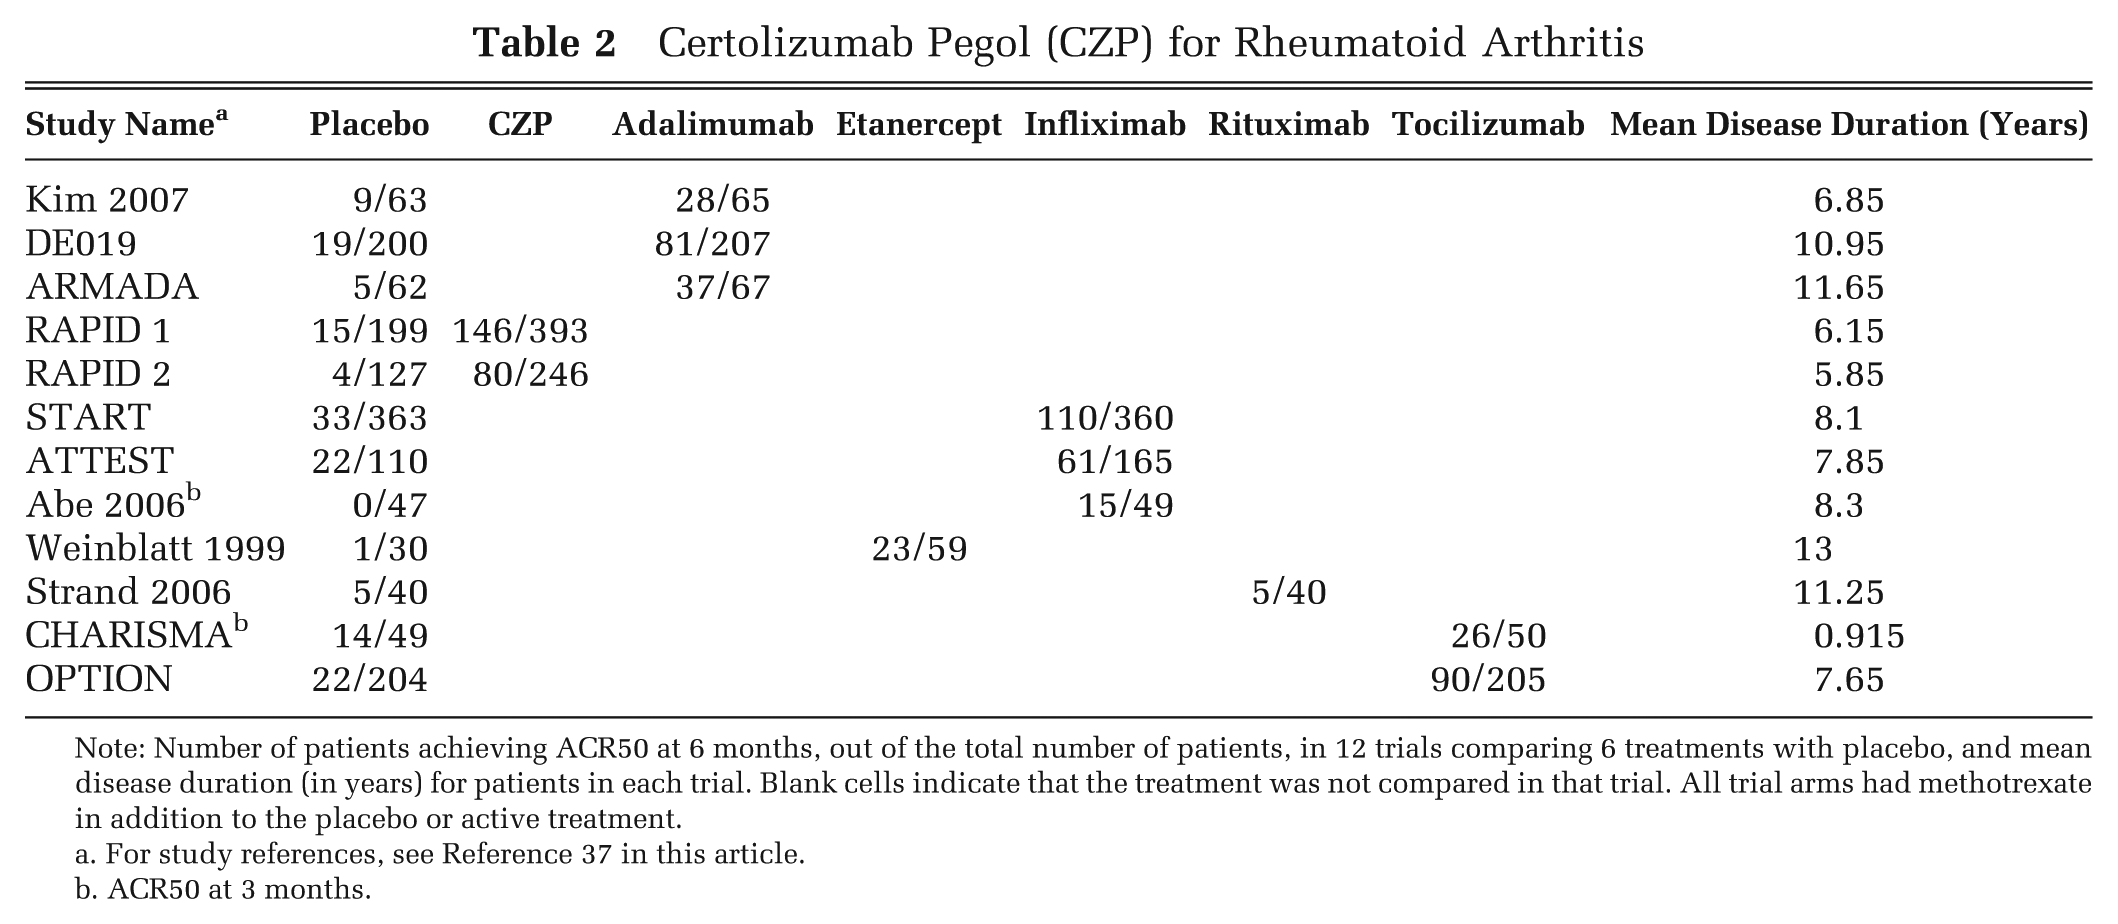
Note: Number of patients achieving ACR50 at 6 months, out of the total number of patients, in 12 trials comparing 6 treatments with placebo, and mean disease duration (in years) for patients in each trial. Blank cells indicate that the treatment was not compared in that trial. All trial arms had methotrexate in addition to the placebo or active treatment.
For study references, see Reference 37 in this article.
ACR50 at 3 months.
Similarly, in the interests of transparency, reviewers and general readers must be provided with sufficient information to allow them to reproduce the analyses, if they had access to the data. If possible, journal citations for the precise model of the data being assumed, and/or citation of the source of software code, must be provided. Otherwise the statistical model for the synthesis should be set out fully in algebraic form and the software code used for the synthesis should be annotated and made available, along with the data used. When confidentiality requirements prevent the data from being released, a dummy data set with the same structure as the original should be provided.
A clear discussion of the underlying statistical and clinical assumptions implied by the model, and their impact on the final decision, should also be included. In particular, reasons for choosing to model the outcomes on a particular scale (e.g., odds ratio, hazard ratio, risk difference etc.) and the assumptions implied in any transformation from the relative to the absolute effects should be clearly presented. 10,18 Transparency also requires that the choice of statistical model (e.g., fixed or random effects) and the use of an NMA, bias adjustment, or meta-regression be justified on statistical and/or clinical grounds. 10 -12
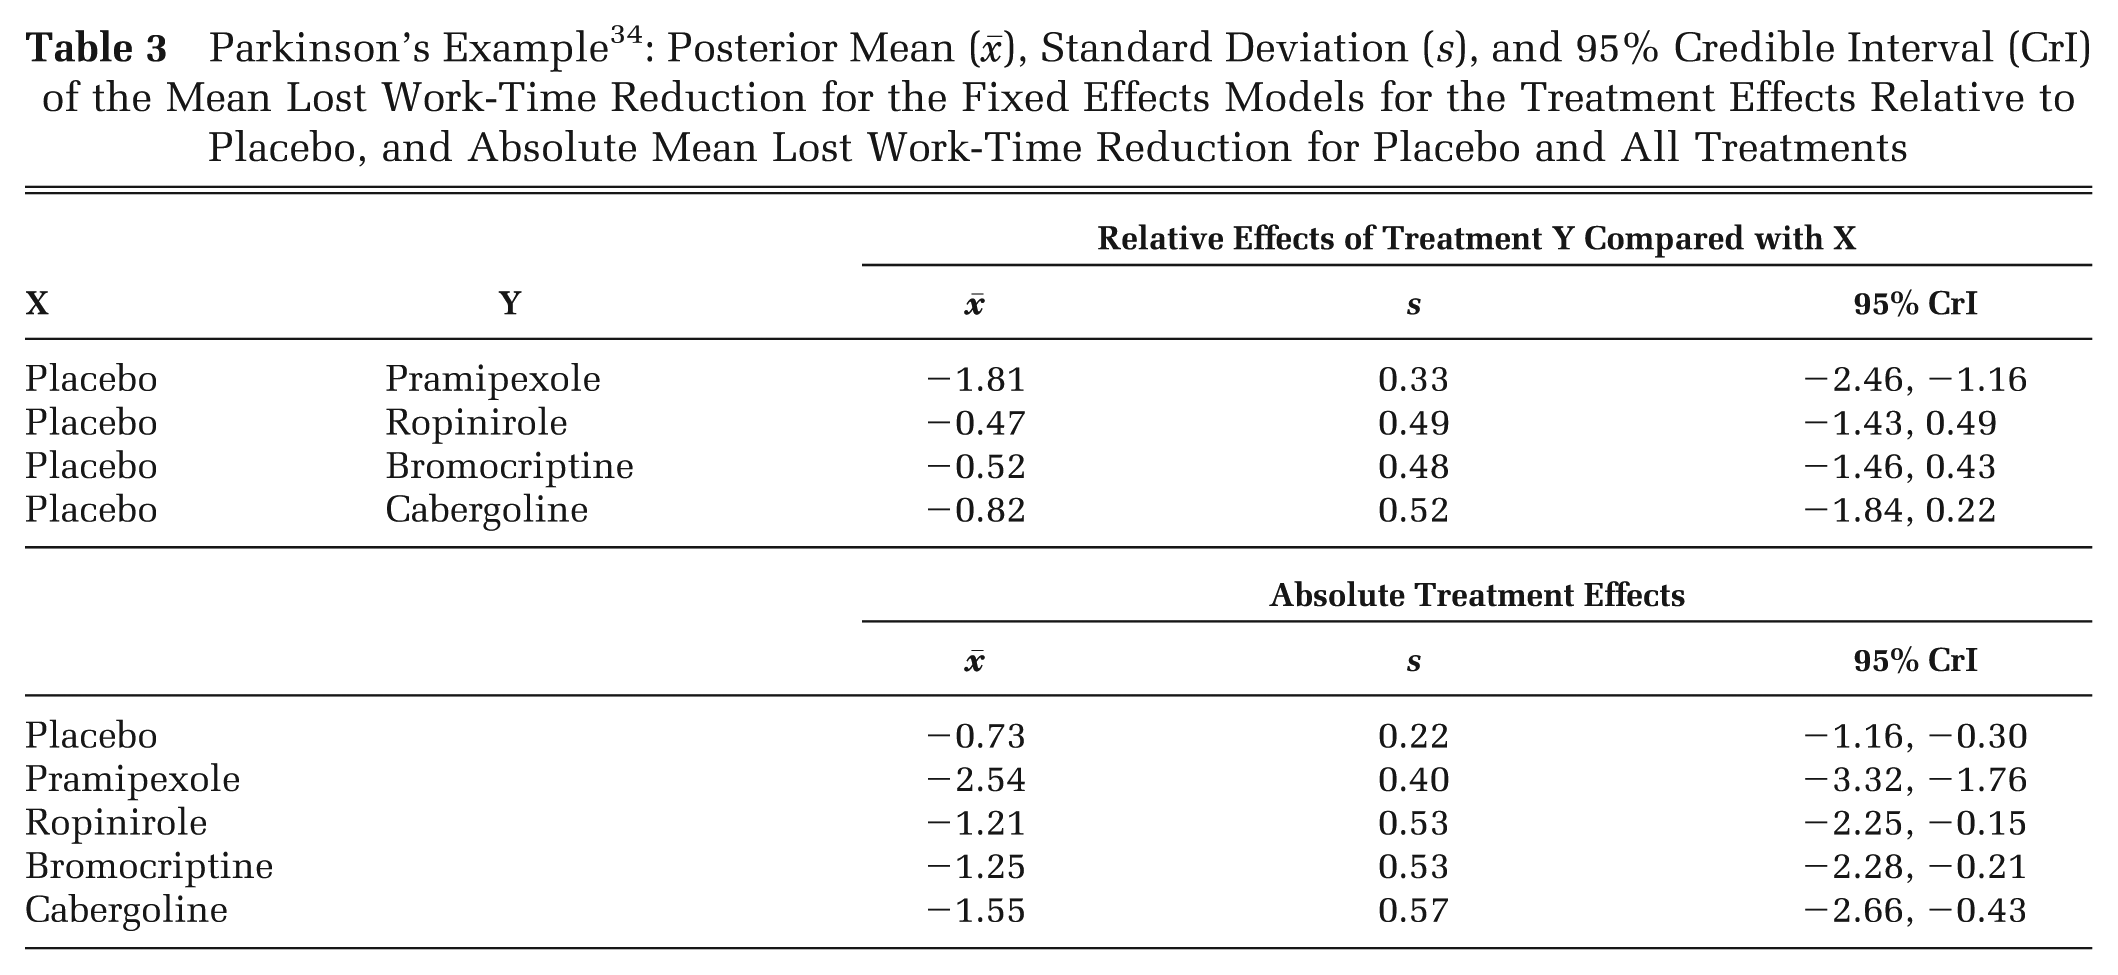
Although the parameters required by the CEA tend to be the absolute treatment effects of each treatment, 18 it is essential to present both the relative treatment effects, which are the outputs from the evidence synthesis, and the absolute effects on which the CEA is based. It is important for those reviewing and evaluating submissions that there is absolute clarity and transparency about exactly what relative efficacies between treatments are being assumed and exactly what absolute effects are going forward into the CEA. This can be achieved in a number of ways. Perhaps the simplest method is a table of the mean treatment effect with 95% credible interval (CrI) of every treatment relative to placebo or to a standard comparator. Table 3 gives an example of the relative and absolute mean lost work-time reduction in patients given 4 dopamine agonists and placebo as adjunct therapy for Parkinson’s disease. 10 The treatment network is presented in Figure 3.
Parkinson’s Example 34 : Posterior Mean (), Standard Deviation (s), and 95% Credible Interval (CrI) of the Mean Lost Work-Time Reduction for the Fixed Effects Models for the Treatment Effects Relative to Placebo, and Absolute Mean Lost Work-Time Reduction for Placebo and All Treatments
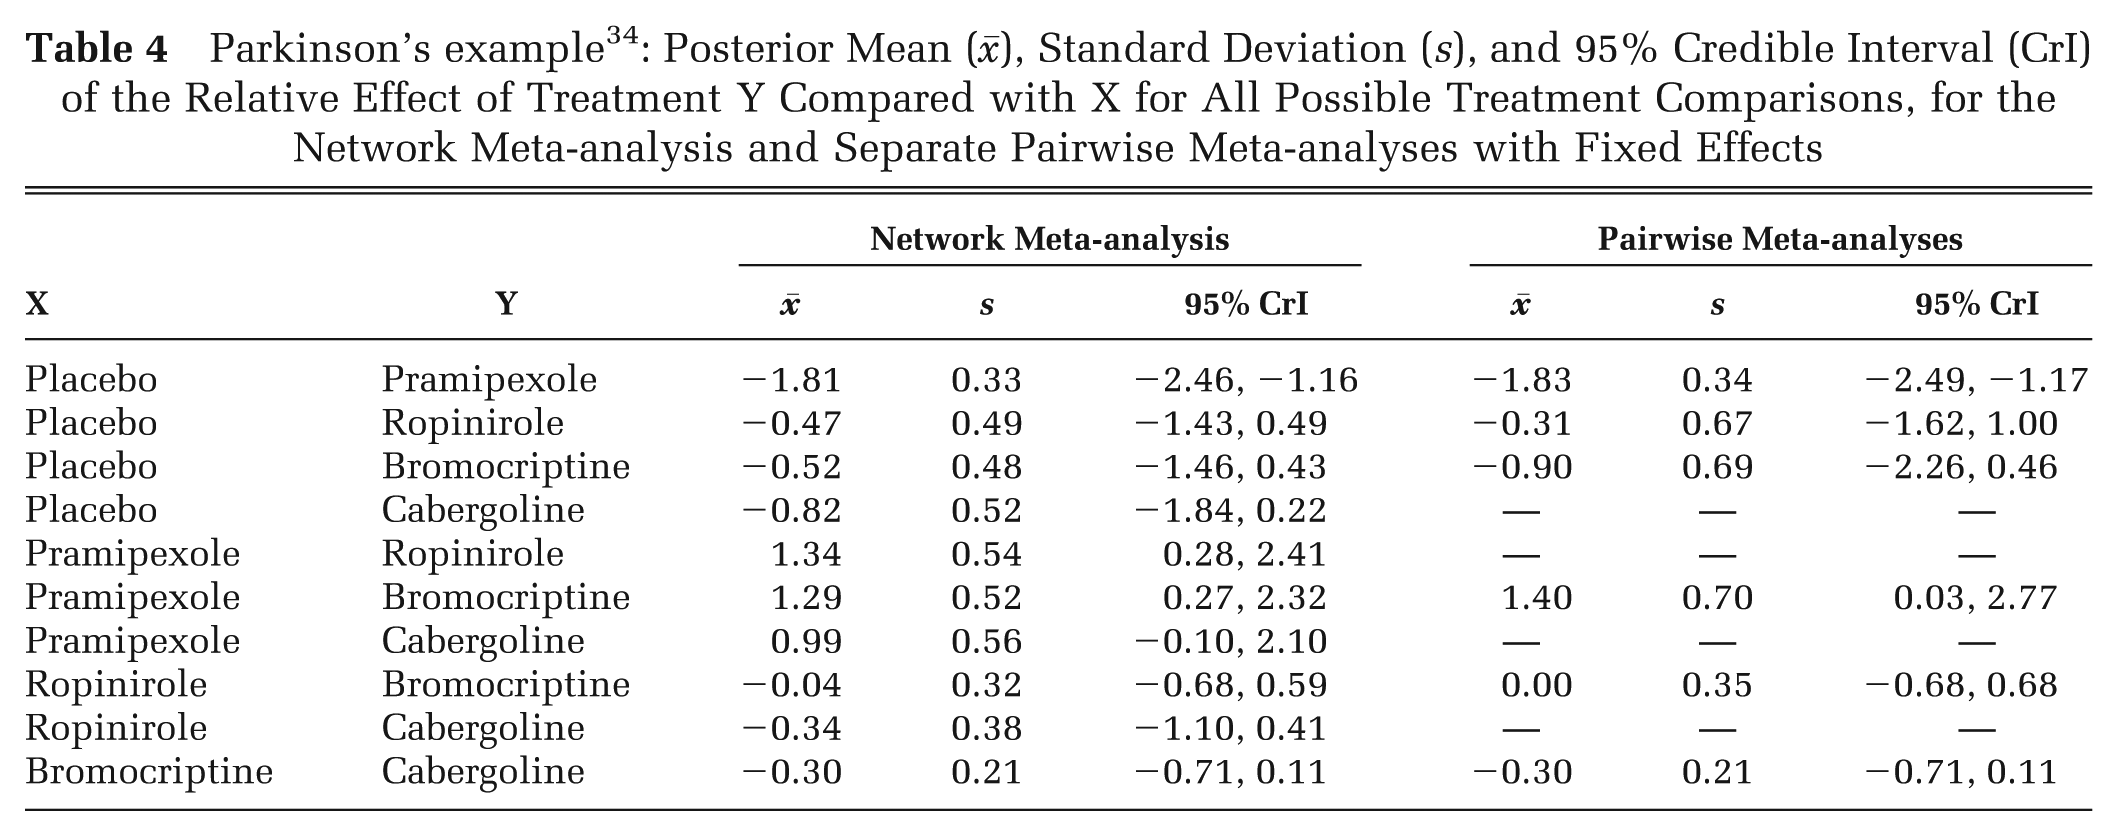
Another format (Table 4) allows investigators to contrast results of pairwise meta-analyses with the results of the NMA. Although this table does not constitute a formal analysis of inconsistency in the network, 12 if the direct estimates are very close to their network counterparts, there may be no need to proceed with further consideration of inconsistency. Similarly, graphical displays that summarize the results in the tables can be presented (Figure 4). The draft of the 2013 methods guide 4 also emphasizes the use of forest plots to examine agreement between the direct and indirect estimates of treatment effects, which could be generated through node-splitting methods. 26
Parkinson’s example 34 : Posterior Mean (), Standard Deviation (s), and 95% Credible Interval (CrI) of the Relative Effect of Treatment Y Compared with X for All Possible Treatment Comparisons, for the Network Meta-analysis and Separate Pairwise Meta-analyses with Fixed Effects
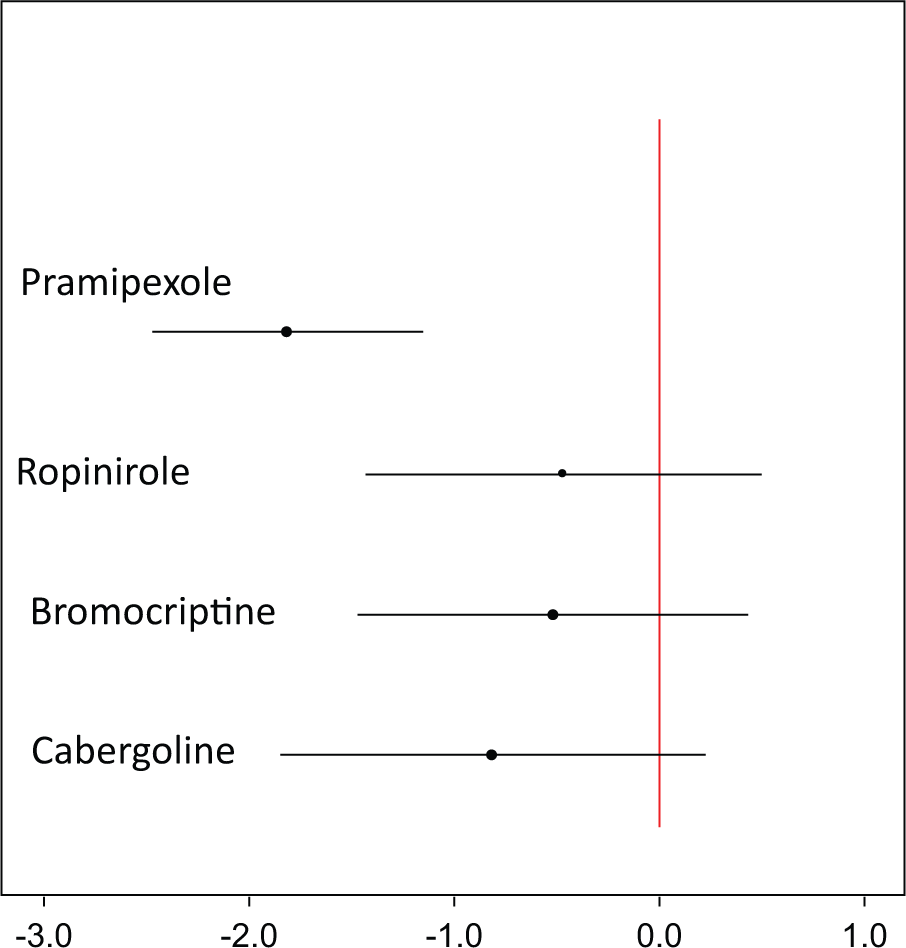
Mean lost work-time reduction on treatments for Parkinson’s disease relative to placebo. The horizontal lines represent the 95% credible intervals with the dot representing the posterior mean relative treatment effect. The vertical line represents no treatment effect.
A number of authors tabulate the probability that each treatment is most effective, which is an output available from Bayesian or other simulation-based approaches. This should be treated with great caution, particularly when there are many treatment alternatives. A treatment whose mean effect ranks quite low may still have a high probability of being best if there is relatively more uncertainty in its mean effect. This is misleading because for a given set of expected (mean) treatment effects, greater uncertainty may flatter a treatment. Differences between treatments in probability of being best of less than 90% cannot be given much credence. A more reliable indicator is a plot of the rankings of each treatment, or “rankograms.” When there are multiple outcomes (e.g., remission, relapse, discontinuation due to side effects), separate rankograms for each treatment, plotting the ranks on each outcome, can be very informative. 27,28 Other graphical presentations of results that are useful in different circumstances have been suggested. 29
Conclusion
As far as we know, an overall account of evidence synthesis has not been attempted before. In this series of papers we present a single framework that covers fixed and random effects models, in which pairwise meta-analysis, indirect comparisons, and 2-arm trials are special cases of networks, and indeed of multiarm trials, and in which outcomes expressed in several different reporting formats can be analyzed without recourse to normal approximations that are known to be problematic. 30 Although the tutorials in this series conform to a set of principles and requirements originating from NICE’s decision-making process, many of these principles—accountability, fairness, transparency—are desirable in all evidence synthesis and decision-making settings. Therefore, we hope that these papers will be useful for a far wider community in medical decision making.
Footnotes
Acknowledgements
The authors thank Jenny Dunn at NICE DSU and Julian Higgins, Alec Miners, Georgia Salanti, Mike Spencer, and the team at NICE, led by Janet Robertson, for reviewing earlier versions of this paper, as well as reviewers at MDM for many useful suggestions.