
Abstract
The Lassen plot filter (LPF) is a novel quantitative approach for generating voxel-level parametric images of half maximal effective concentration (EC50) and maximum occupancy (Occmax) from PET brain occupancy data. We applied LPF to an occupancy study of a 5HT6 selective antagonist, PF05212377 (SAM760) using the non-selective 5HT6/5HT2A tracer, [11C]GSK215083. We now introduced the occupancy derived Bmax ratio (ODBR) as a new parameter reflecting receptor density ratios in vivo. Ten healthy subjects underwent baseline, post-drug, and washout PET scans after single oral doses (2–60 mg). LPF-derived occupancy images were produced in the striatum, yielding Occmax values of 0.74 in the caudate and 0.87 in the putamen. The ODBR for 5HT2A receptors was calculated from incomplete occupancy (1 − Occmax) and binding potential ratios (ODBR = 2.88; Bmax caudate (5HT2A)/Bmax putamen (5HT2A)). This result is consistent with published postmortem Bmax ratio (1.50–2.41). In general, our approach allows estimation when occupancy studies are performed with a selective drug and a non-selective tracer.
Introduction
PET occupancy studies can be useful in drug development by providing valuable insights into drug–target interactions and guiding dosing strategies for early-phase clinical trials. These studies typically require a tracer that binds to the same site as the experimental drug under investigation. In cases where there is no reference region for the PET tracer, the standard approach to estimating occupancy is via the Lassen plot. 1
Recently, we have extended the Lassen plot from the whole brain level, which provides a single occupancy estimate, to the voxel level. This advance, known as the “Lassen plot filter” (LPF), enables a more comprehensive analysis of drug occupancy and affinity by providing local drug binding information in many different brain regions. 2 The LPF generates voxel-wise parametric images which can reveal heterogeneity of drug distribution and receptor occupancy across the brain.
The LPF filter, followed by modeling, generates one or two parametric output images depending on the Emax (dose–response) model used. In cases where complete occupancy cannot be achieved or when the drug binds to more than one receptor subtype, the method produces two primary parametric images: EC50 and Occmax. EC50 represents the plasma drug concentration that produces 50% occupancy of the target receptor, while Occmax indicates the theoretical maximum occupancy that can be achieved by the drug.
In cases of a highly selective drug and a partially selective tracer (e.g. one that binds to two receptor subtypes), the Occmax may be estimated as <100%. This incomplete occupancy occurs because the tracer binds to both the same receptor as the drug and to another, off-target, subtype of the receptor. As it happens, the Occmax image can provide valuable insights into the distribution of the off-target receptor subtype. This secondary modeling endpoint, Occmax, allows us to investigate indirectly the regional distribution of the off-target receptor subtype and offers a new means of examining receptor subtype distributions in the brain.
While receptor subtype distributions are most directly assessed using fully selective tracers, such approaches are not always feasible in practice due to limitations in tracer availability, reference regions, or study design. In this context, we sought to develop a more practical approach to extract as much information as possible under such constraints and to evaluate its utility by applying it to data previously acquired in an occupancy study.
In this paper, we introduce a new parametric image, termed “incomplete occupancy (InOccmax),” defined as (1 − Occmax), image. Under the right circumstances, this new image provides a means of calculating a ratio of the density, Bmax, of the off-target receptor subtype between two different regions. We refer to this new regional endpoint as the occupancy derived Bmax ratio (ODBR). To evaluate the LPF approach, generally, and the findings of this work, specifically, we applied the LPF and Emax model pipeline to occupancy data acquired with a 5HT6-selective drug but a 5HT6/5HT2A non-selective tracer and compared the results with previously published autopsy studies.3,4
Materials and methods
Drug and tracer
PF-05212377 (SAM760) is a 5HT6 antagonist 5 that selectively targets the 5HT6 receptor. [11C]GSK215083 tracer is a PET tracer with a high affinity for 5HT6 and a lower affinity for 5HT2A receptors. The synthesis and preparation methods are detailed in a previous paper. 6
Study design and participants
Ten healthy subjects participated in the study. Healthy males and non-childbearing females 18–55 years old with a body mass index of 17.5–30.5 kg/m2 and total body weights >50 kg were included. On day 1, following an 8-h fast, subjects received a baseline scan before dosing of PF-05212377. The second scan was conducted at the time of anticipated maximal drug plasma concentration, Tmax (4–6 h) after a single drug dose (2–60 mg), and the third scan was performed after a long washout time (between 24 and 168 h). The following doses were administered: 60 mg (n = 3), 10 mg (n = 3), 5 mg (n = 2), 3 mg (n = 1), and 2 mg (n = 1). The specific scan times relative to drug dosing are diagrammed in (Figure 1).
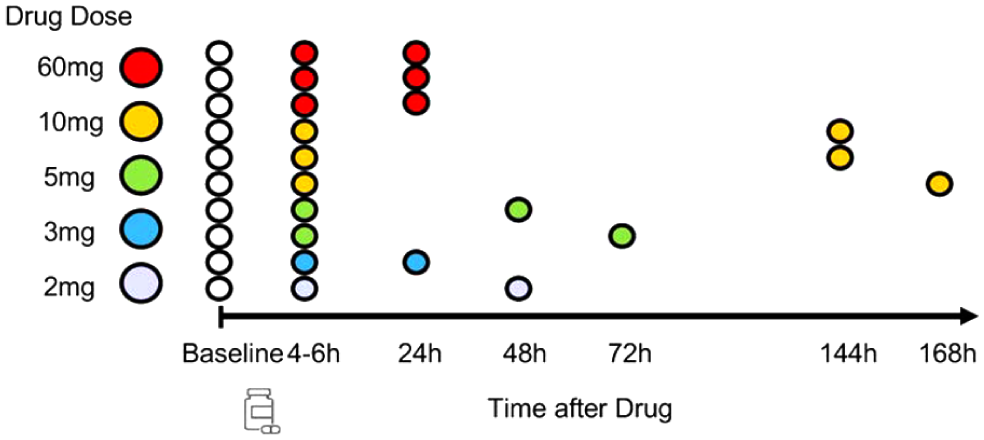
Study design. Each subject was scanned at baseline (open circles) followed by a single oral dose (designated by pill bottle on time axis), then scanned at Tmax (4–6 h on time axis), and then again between 24 and 168 h post dose; colors indicate the different dose groups.
Ethical approval and informed consent
The data analyzed in this study were obtained from a previously published first-in-human PET occupancy study of PF-05212377 (NCT01258751; Pfizer internal study B2081007; doi:10.1002/bdd.2351). 6 The original clinical study was approved by the Yale Human Investigation Committee and related institutional review boards, and conducted in accordance with the Declaration of Helsinki and International Conference on Harmonisation Good Clinical Practice (ICH–GCP) guidelines. Written informed consent was obtained from all participants.
PET acquisition and pre-processing
The radiotracer [11C]GSK215083 (740 MBq) was administered via intravenous infusion over 1 min, immediately followed by a 120-min dynamic acquisition on a Siemens HR+ PET scanner (spatial resolution 6 mm FWHM in all directions). Arterial blood was withdrawn continuously with a peristaltic pump (4 mL/min) during the first 7 min after tracer injection, and whole-blood radioactivity was measured with a calibrated online radioactivity monitor. Discrete arterial samples were then collected at 3, 5, 7, 10, 15, 20, 25, 30, 40, 50, 60, 75, 90, 105, and 120 min. Samples were centrifuged to obtain plasma; plasma radioactivity was measured with a calibrated gamma counter (PerkinElmer Wizard 1480). Plasma collected at 5, 15, 30, 60, and 90 min was used to determine the parent fraction and radiometabolites over time. PET images were reconstructed into 33 frames (6 × 30, 3 × 60, 2 × 120, and 22 × 300 s), each consisting of 63 axial slices with dimensions of 128 × 128 voxels (2.1 × 2.1 × 2.4 mm3). Reconstruction was performed using OSEM (four iterations, 16 subsets) with corrections for decay, attenuation, scatter, and normalization. Motion correction was applied to the PET dynamic images using a mutual information algorithm (FSL-FLIRT version 3.2, Analysis Group, FMRIB, Oxford, UK) for frame-by-frame registration to an initial 10-min summed image. A motion-corrected 10-min summed image was registered to the subject’s 3 T MRI, which was then registered to an MR template using a non-linear transform in BioImage Suite. 7 To minimize noise-induced bias in voxel-wise VT estimation, only the first 90 min of data were used for the analysis. The distribution volume (VT) was calculated using the relative equilibrium graphical plot (RE-GP) method 8 (t* = 40 min) with the metabolite-corrected arterial input function. For occupancy data, LPF was applied using a local spatial kernel of 5 × 5 × 5 voxels, such that occupancy estimates were derived from local linear regressions over multiple voxel pairs (i.e. 125 data points/Lassen plot) within the kernel. The same kernel-based approach was applied throughout each region; within each kernel, voxel pairs deviating by more than two standard deviations from the fitted LPF line were treated as outliers and excluded, and the regression was refit using the remaining voxels. Region-based LPF analysis was performed within the caudate and putamen regions of interest (ROIs) derived from the AAL template. 2
Theory
Occupancy images using the Lassen plot filter (LPF)
The Lassen plot filter (LPF) 2 applies the Lassen plot to local neighborhoods in PET images, not entire regions of interest, to produce local estimates of drug occupancy at the voxel level. The LPF is a moving kernel that operates simultaneously on a VT image from the baseline scan and a VT image from a post-drug scan. The estimated slope from the Lassen plot in each kernel position is used as the occupancy value for an individual voxel corresponding to the location of the origin of the kernel (Figure 2). Occupancy images are produced for every plasma drug concentration.
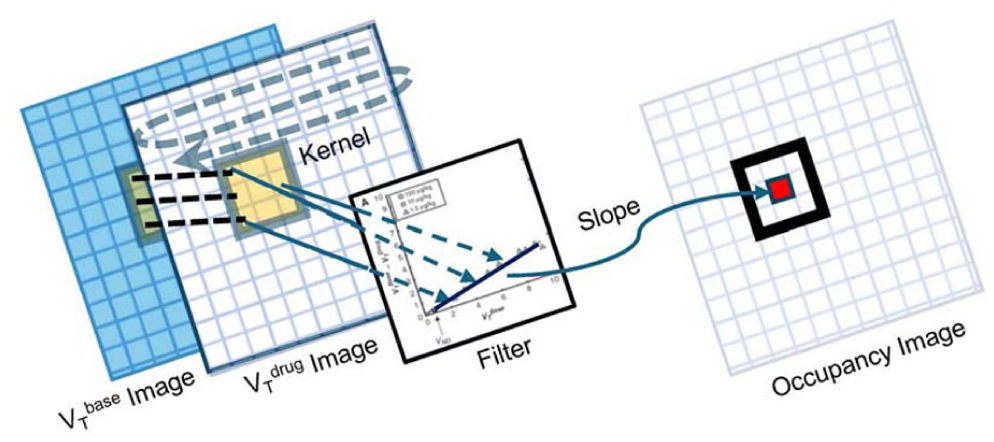
Lassen plot filter schematic. The Lassen plot kernel (small yellow square) operates simultaneously on the local voxel values at the same locations in the baseline VT image and the post-drug VT image. The filtering process is the application of the Lassen plot and estimation of slope based on the local voxel values. The estimated slope is recorded in the new occupancy image in the voxel corresponding to the site of the origin of the Lassen plot kernel.
Comparison of Emax model
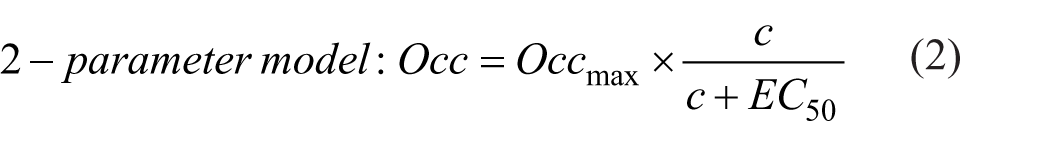
We compared two Emax models: a one- and a two-parameter model. The drug is highly selective for 5HT6 receptors, and therefore a single EC50 value is assumed across the whole brain. However, Occmax may vary among regions due to differences in the distribution of serotonin receptor subtypes. Consequently, the one-parameter model used a shared single EC50 value, while the two-parameter model assumed that the drug is not fully selective in vivo, allowing both EC50 and Occmax to vary independently. The one- and two-parameter Emax models were used to fit the occupancy versus plasma concentration plot at every voxel. 9 The goodness of (nonlinear) fits was evaluated at every voxel using the corrected Akaike Information Criterion (AICc).
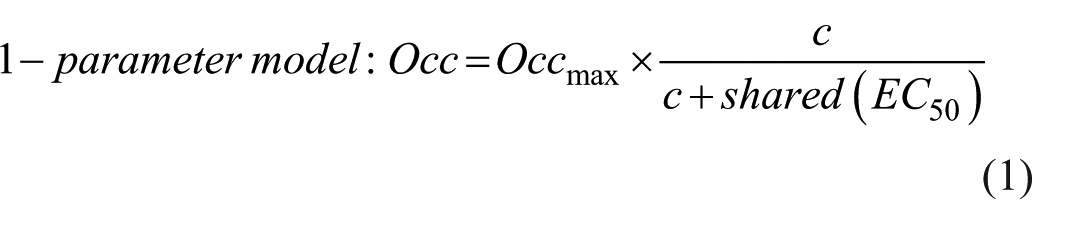
Occ denotes the fractional occupancy value at a given voxel in the occupancy image. C represents the drug concentration in plasma, typically averaged over the duration of the scan. Occmax indicates the maximum occupancy attainable at each voxel.
In the one-parameter model, a shared EC50 is estimated by fitting the occupancy–concentration relationship within the caudate and putamen. This shared EC50 value is then applied voxel-wise to fit the occupancy data across the entire brain, yielding the Occmax image. The two-parameter model generates an EC50 image in which each voxel value corresponds to the plasma concentration predicted to produce half-maximum occupancy in that specific voxel. Based on the calculation of AICc, a model preference image was created to determine which model was preferred for each voxel. After inspecting the model preference Image, a single model was selected and applied to all voxels for subsequent analysis.
Occupancy derived Bmax ratio (ODBR)
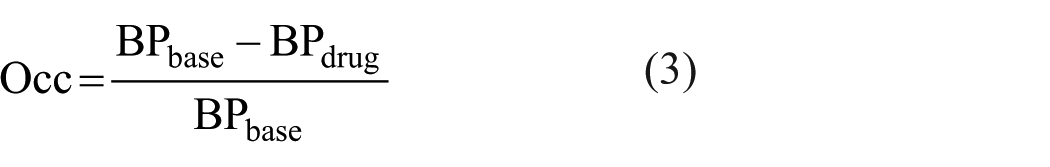
In this study, we present a new method for indirectly obtaining the Bmax ratio of 5HT2A receptors in two regions using maximum occupancy data of 5HT6 receptors. To derive our desired endpoint, we note that the occupancy of the drug is equivalent to the relative difference between the binding potential calculated at baseline (BPbase) and after drug administration (BPdrug; equation (3)).
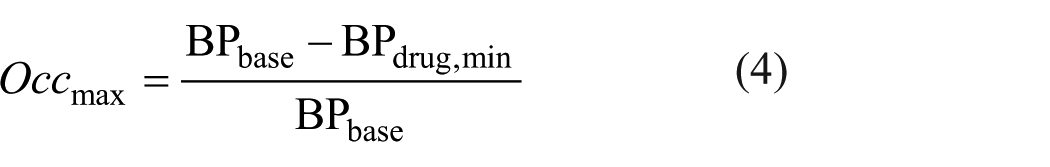
Maximum drug occupancy (Occmax) occurs when 5HT6 receptors are fully saturated by the drug. At this point, we denote the BPdrug as BPdrug,min. This state is described by equation (4).
At baseline, the tracer binds to both 5HT6 and 5HT2A receptors. As shown in equation (5), the BPbase is the sum of the binding potentials for these two receptor types:

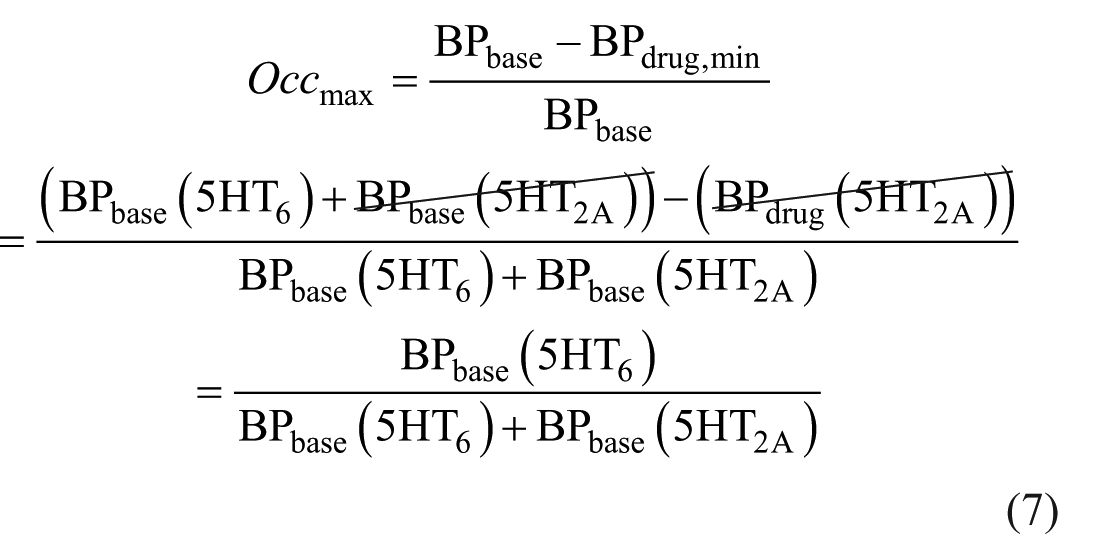
However, when the drug reaches maximum occupancy, the BPdrug value reflects only binding to 5HT2A receptors (BPdrug (5HT6) = 0), as illustrated in equation (6). This occurs because the drug fully occupies the 5HT6 receptors, leaving no binding sites available for the tracer.

The Occmax can be expressed as in equation (7) by substituting equations (5) and (6) into equation (4). Since BPbase (5HT2A) and BPdrug (5HT2A) are equal (as the drug does not affect 5HT2A binding), these terms cancel out, simplifying the expression.
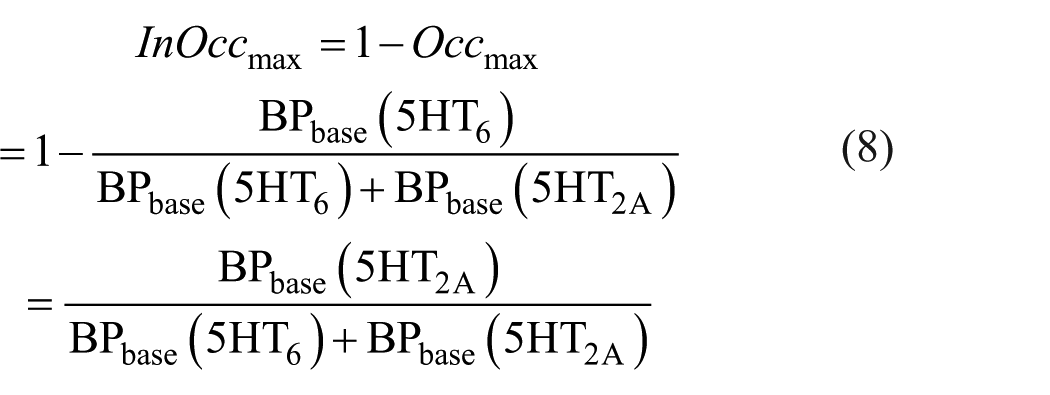
We now define the term (1 − Occmax) to be the “incomplete occupancy (InOccmax),” as shown in equation (8). Once we express InOccmax in terms of BP, we see that only BPbase (5HT2A) is retained in the numerator.
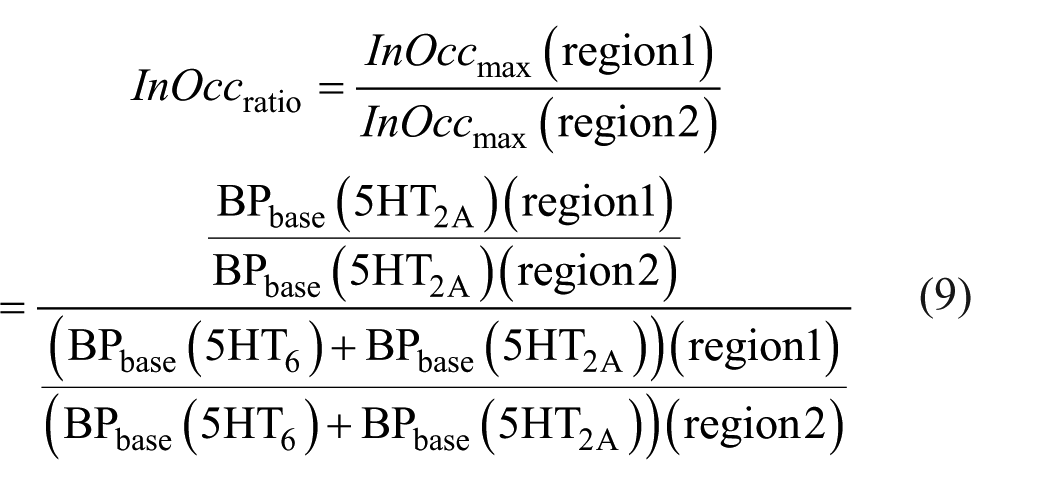
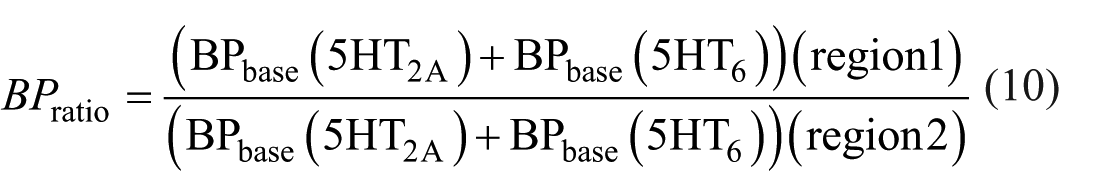
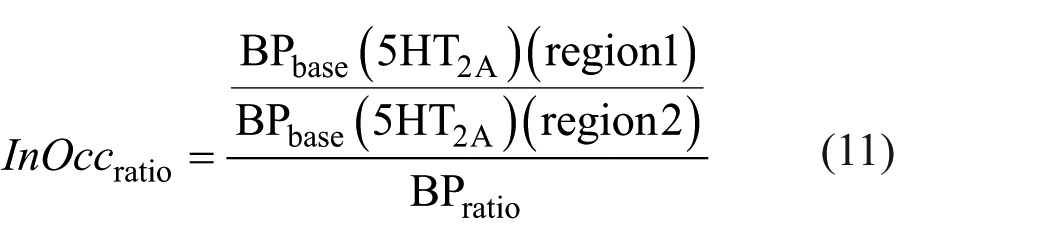
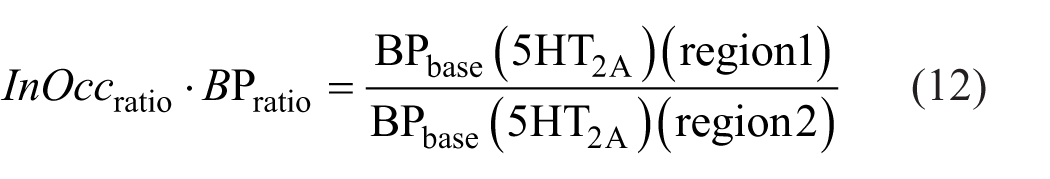
As described in equation (9), the ratio of InOccmax between two regions can be formulated such that the denominator includes the ratio of total BP at baseline (as shown in equation (10)), while the numerator reflects the ratio of 5HT2A at baseline. By multiplying both sides of this equation by the baseline BP ratio from the denominator, the right-hand side simplifies to the BP ratio of 5HT2A alone, and the left-hand side becomes the product of the InOccmax ratio and the baseline total BP ratio. We define this left-hand side expression (equation (12)) as the occupancy-derived Bmax ratio (ODBR).
The denominator’s BP ratio (BPratio) value is calculated based on the VT values obtained from PET imaging and the VND values derived from region-based LPF in two regions.
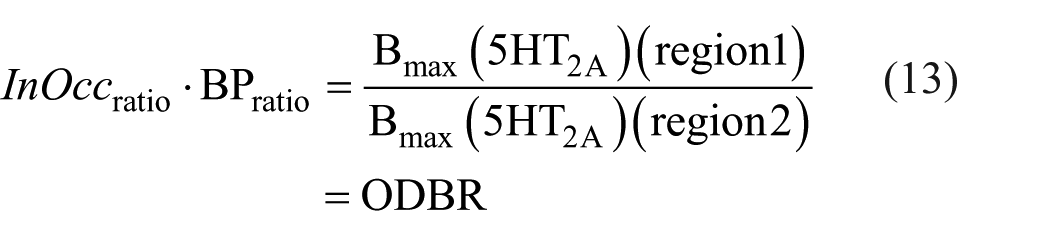
Recall the BP is also the ratio of receptor density to affinity (BP = Bmax/KD). If the equilibrium dissociation constant (KD) for tracer from the 5HT2A site is consistent across both regions, the ODBR serves as an estimate of the receptor density ratio (i.e. the Bmax ratio) between the two regions (equation (13)).
This study focused on comparing the 5HT2A Bmax ratio between the caudate and putamen regions of the striatum. In practice, occupancy images were created with the LPF, which applies to cases when BP is not directly estimable.
Autopsy data
To validate our findings, we compared the ODBR calculated from our PET occupancy results with Bmax ratios determined from previously published 5HT2A data from human autopsies. We used two studies for this comparison. Pazos et al. 3 employed [ 3 H]ketanserin as a ligand to label and visualize serotonin-2 (5HT2) receptors in human brain tissue via autoradiography. Their study included 22 subjects (13 males, nine females, aged 29–92 years) with postmortem delays ranging from 3 to 13 h. Varnäs et al. 4 used [ 3 H]M100907, which has a higher affinity to 5HT2A receptor than ketanserin, to map the distribution of 5HT2A receptors. The Varnäs study involved five subjects (four males, one female, aged 53–63 years) with postmortem delays ranging from 6 to 48 h.
Results
VT image
Figure 3 shows VT images at baseline and after 2, 10, and 60 mg doses of SAM760. At the highest dose of the drug, uptake in the striatum was almost completely blocked. Lower doses resulted in partial blocking, demonstrating a dose-dependent response in the striatum. Because this dose-dependent response was observable only in the striatum, subsequent voxel-based analyses were conducted using data masked to the striatum region.
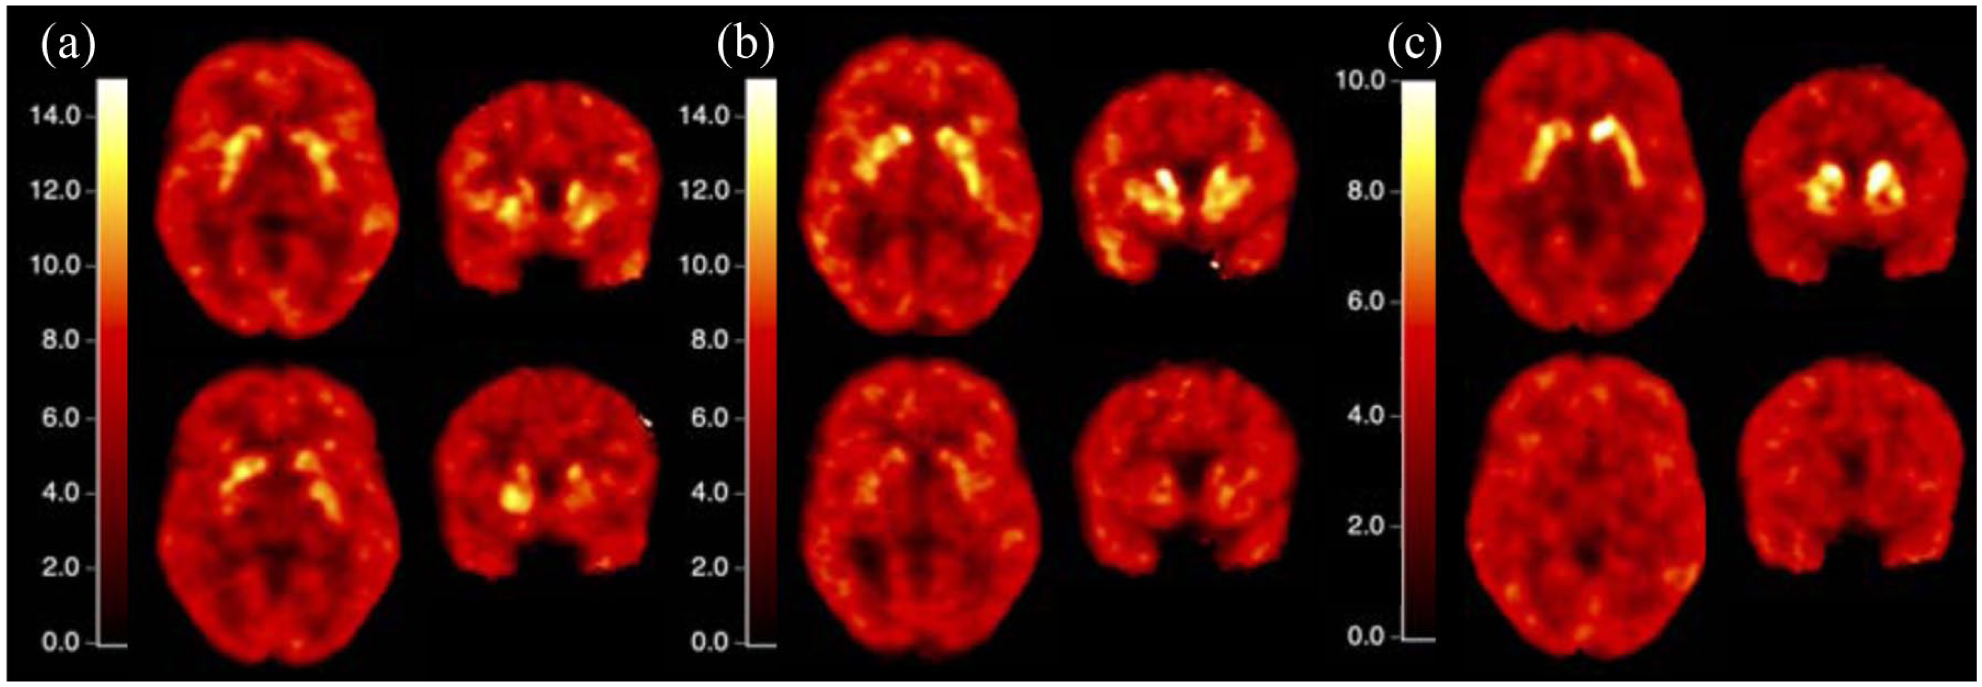
VT images. VT images are the inputs to the Lassen plot filter. The top row in each panel represents the baseline scan. The bottom row in each panel represents the VT image following (a) 2 mg, (b) 10 mg, and (c) 60 mg drug doses, respectively. Post-dose VT images were derived from dynamic PET data acquired at Tmax (4 h) after drug administration.
Occupancy image
Figure 4 displays occupancy images in the striatum with increasing plasma drug concentration. At 47 ng/mL, the occupancy value in most parts of the putamen approaches 100%. In contrast, the caudate shows some regions with occupancy below 100%. Additionally, occupancy in the caudate increases more gradually with increasing plasma concentration compared to the putamen.
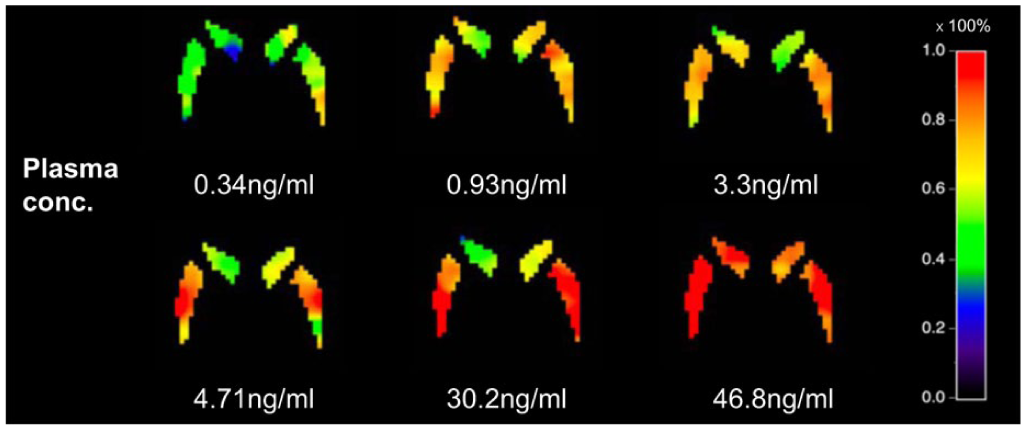
Occupancy images of the striatum for varying plasma drug concentrations (given in the text below each image). Each voxel represents the occupancy value at that location, calculated using the LPF. Increasing occupancy with increasing plasma drug concentration is evident. Note also that occupancy (which varies from 0% to 100%) appears to be spatially heterogeneous.
Emax model comparison
Figure 5(a) shows Model Preference images for each location, determined by the corrected Akaike Information Criterion (AICc). The one-parameter model (green) fit is generally preferred in the most of caudate and putamen, while the two-parameter model fit (red) is preferred in some limited areas. Consequently, the one-parameter model was used for subsequent data analysis in all voxels and regions. Average fitting curves and the one standard deviation envelope for all voxels within the putamen and caudate regions show that these two areas have distinct maximum occupancy (Occmax) values (Figure 5(b)). A representative example of voxel-level Emax fitting in each region is shown in Figure 5(c) and (d). Notably, the maximum occupancy in the caudate is less than putamen.
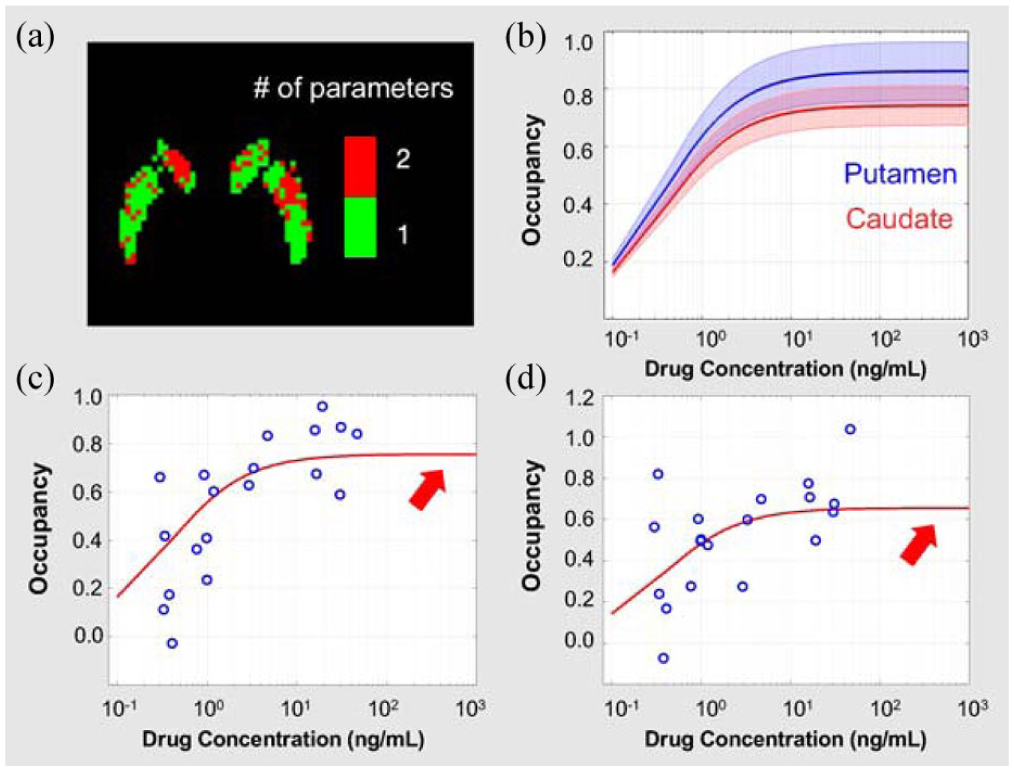
(a) “Model preference” image for each voxel location as determined by the AICc. Red indicates that a two-parameter Emax model is preferred. Green indicates that a shared EC50 one-parameter model provides the best fit, (b) average fitted Emax model curves (blue solid line: putamen, red solid line: caudate) and one standard deviation envelopes (blue area: putamen, red area: caudate) for all voxels within the putamen and caudate regions, and (c, d) examples of Emax model fits (red curves) for single voxels in the putamen and caudate, respectively. Thick red arrows indicate theoretical maximum occupancy levels that could be achievable at sufficiently high drug doses. The concentration axis was extended to 103 to illustrate that the fitted curve never reaches 100% even at very high concentrations.
Occmax, InOccmax parametric images
Figure 6(a) and (b) show sequential slices of the maximum occupancy (Occmax), and incomplete drug occupancy (InOccmax) images derived from voxel-level Emax fitting to occupancy data across plasma concentration using a one-parameter model to occupancy data across all plasma drug concentrations. Shared EC50 value was 0.359 in the striatum regions. The caudate demonstrated a mean Occmax of 0.74, whereas the putamen exhibited Occmax = 0.87. Occmax and InOccmax values (Figure 6(a) and (b)) were distinct between these two regions. The CV (Occmax) is consistently below 0.1 across the striatal region.
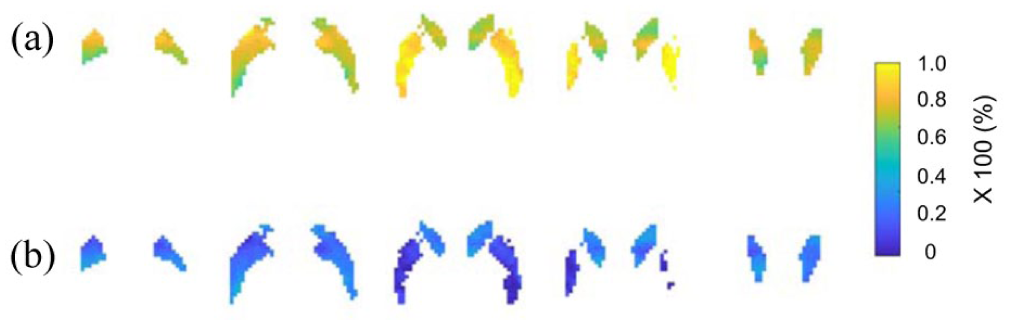
Sequential slices of parametric images in the striatum of Occmax (a) and InOccmax (b) for the 5HT6 antagonist drug.
Comparing ODBR in PET data and Bmax ratio in autopsy data
The BP ratio (caudate/putamen) was calculated using baseline VT values from 10 subjects, with an average VND value applied across individuals. The resulting value was 1.44 ± 0.44. VND values were estimated from the high-dose condition (60 mg, n = 3), in which the linearity of the LPF was most prominent in both regions. The mean VND values obtained under this condition were as follows: caudate, 3.41 ± 0.39; putamen, 4.63 ± 0.88. Our PET data yielded an ODBR of ~2.86 between the caudate and putamen. This finding is in reasonable agreement with the average ratio of 1.96 from two autopsy studies (Table 1).
Comparison of ODBR and autopsy results. The PET column represents the InOccmax values and the ODBR, which is the product of InOccmax ratio between Caud and Put, indirectly obtained from the maximum occupancy values of the 5HT6 antagonist and BP ratio. The BP ratio (Caud/Put) is calculated as the VT/VND − 1 in the Caud and Put. ODBR uncertainty was estimated using first-order error propagation and is reported as estimate ± SE. The autopsy column presents the 5HT2A Bmax values and Bmax ratios between Caud and Put from two previously published studies.3,4
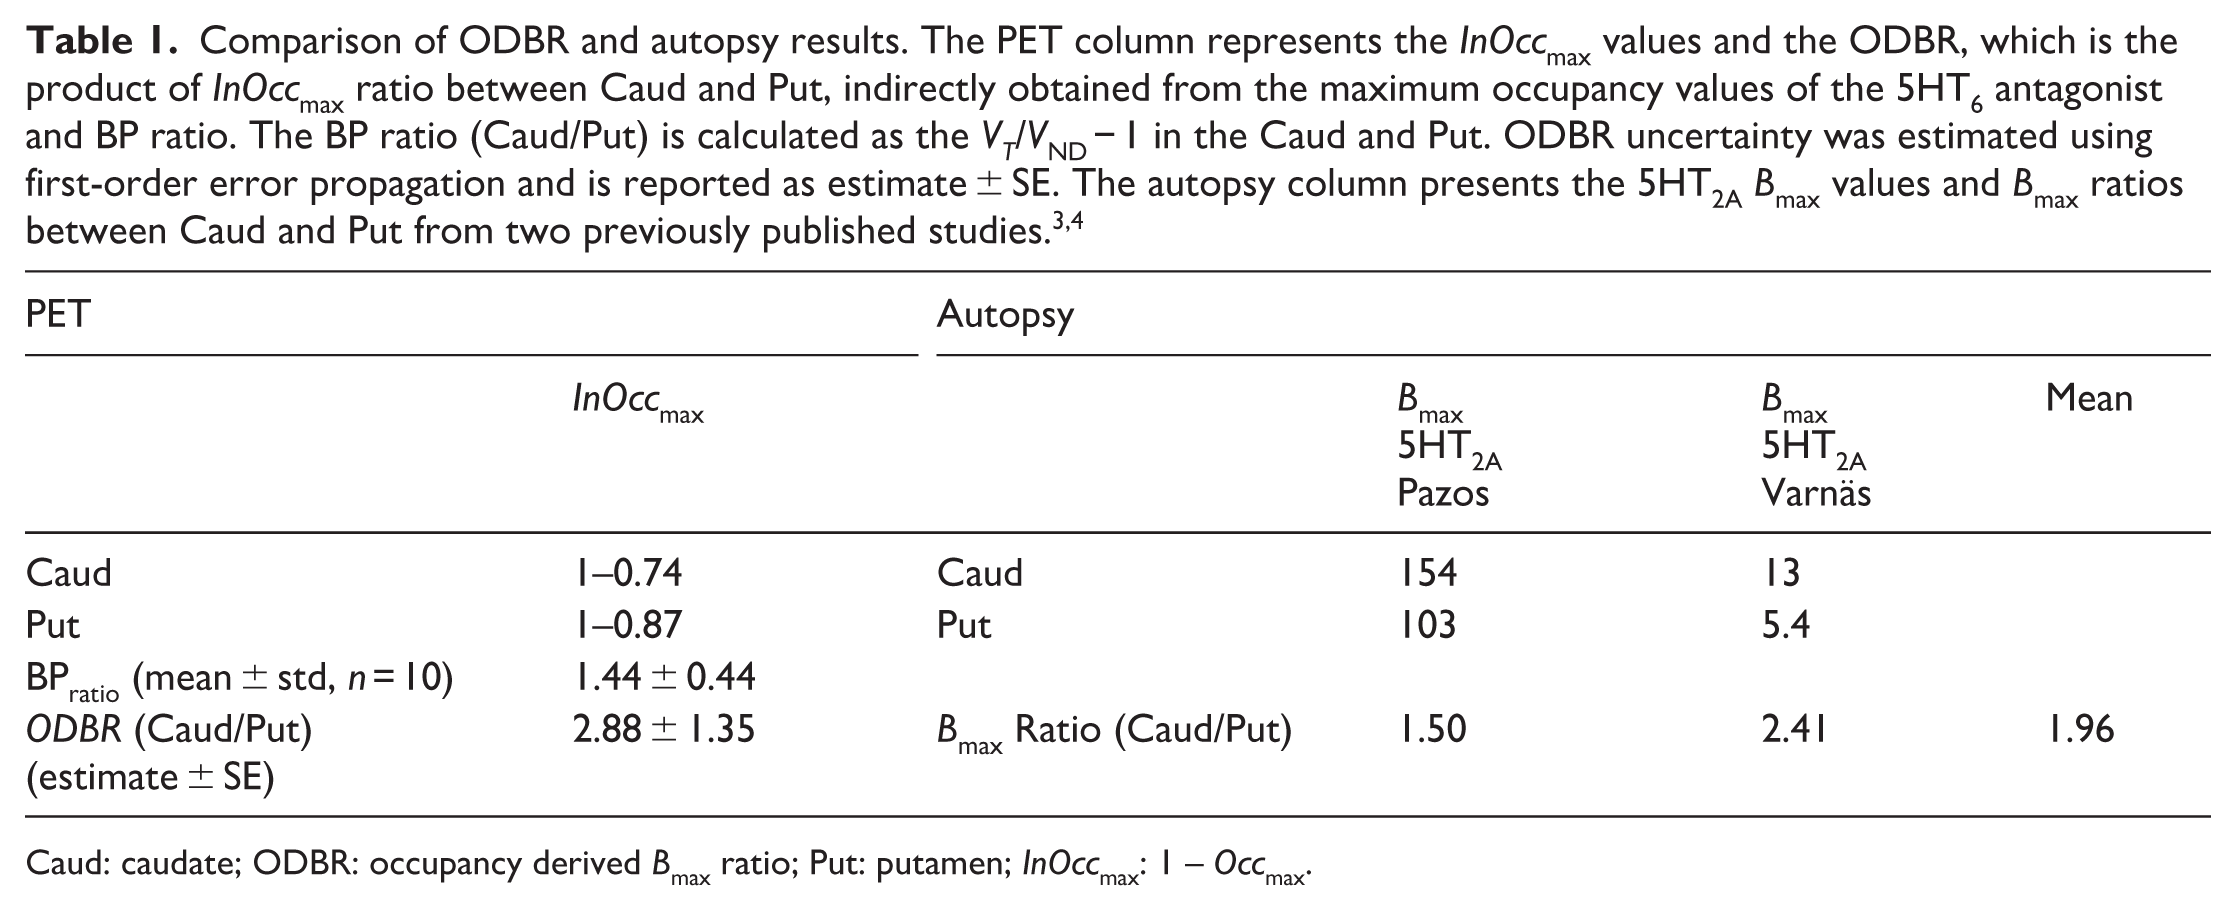
Caud: caudate; ODBR: occupancy derived Bmax ratio; Put: putamen; InOccmax: 1 – Occmax.
Discussion
This study presents a new approach to analyzing PET occupancy data of PF-05212377 (SAM760), a selective 5HT6 antagonist, using the Lassen plot filter (LPF) and Emax modeling. By generating parametric images of Occmax, we were able to visualize spatial variations in drug occupancy across and within brain regions, specifically focusing on the caudate and putamen of the striatum. Our findings from a study with a non-selective tracer offer an independent measure of receptor subtype distribution, and in this specific case, provide a surrogate for the Bmax ratio.
Inference of ODBR
A key discovery of our study is the ability to infer the relative density of 5HT2A receptors between the caudate and putamen using PET data, by leveraging the properties of a non-selective tracer. While direct estimation of absolute Bmax values from the newly introduced InOccmax parametric image is not feasible, we were able to estimate the ratio of regional Bmax values by applying the occupancy-derived Bmax ratio (ODBR) between regions. ODBR is formulated as the product of two parameters: the InOccmax ratio and the baseline BP ratio. The InOccmax ratio reflects the drug’s selectivity between regions, effectively representing the ratio of regions where the drug does not bind. In contrast, the BP ratio reflects the selectivity of the tracer between regions. Therefore, the ODBR parameter inherently captures the combined effect of both drug selectivity and tracer subtype selectivity. This means that the estimated receptor distribution considers not only where the drug does not act, but also where the tracer may selectively bind to specific subtypes.
As the BP ratio approaches unity, the InOccmax parametric image reflects the Bmax ratio, that is, the relative distribution of receptor subtypes. However, our data demonstrate that the BP ratio exceeds 1. This ratio depends on two factors: the relative receptor densities and the relative receptor affinities. A previous study has reported that [11C]GSK215083 exhibits approximately five-fold higher affinity for 5HT6 receptors compared to 5HT2A receptors in vitro and in vivo. 10 Despite this, selective blockade experiments by Parker et al. 11 suggest that the striatal binding of this tracer is predominantly associated with 5HT6 receptors. If the in vivo retention of [11C]GSK215083 in the striatum is primarily driven by 5HT6 receptor binding, and if the distribution of 5HT6 receptors is relatively uniform across the caudate and putamen—as indicated by in vitro data 12 —then the BP ratio would be expected to approach unity. Contrary to this expectation, our findings suggest that [11C]GSK215083 binding in the striatum, in the absence of a competing ligand, likely reflects measurable contributions from both 5HT6 and 5HT2A receptors.
Use of VND in LPF
For [11C]GSK215083, previous studies have typically used the cerebellum as a reference region to compute BPND. However, our analysis revealed a significant difference in cerebellar VT between baseline and postdrug scans (paired t-test, p = 0.02), indicating that the cerebellum may not have been a suitable reference region under our experimental conditions. In contrast, the LPF method offers the advantage of estimating VND for each region independently. To minimize voxel-level variation in VND, we employed high-dose data, which exhibited strong linearity in LPF plots and used region-based LPF. 2 Specifically, when applying the LPF method to all voxel values from the caudate and putamen under high-dose conditions, we observed high linearity, with mean correlation coefficients (r) exceeding 0.88. Moreover, VND estimates showed relatively small inter-subject variability (caudate, 3.41 ± 0.39; putamen, 4.63 ± 0.88). If [11C]GSK215083 binding in the striatum primarily reflects 5HT6 receptor availability then the VND estimated via LPF would be expected to approximate the true VND, and the BP ratio to approach unity. However, the observed BP ratio indicates that residual 5HT2A receptor binding in the caudate and putamen may still have influenced the VND estimates.
PF-05212377 selectivity for 5HT6 versus 5HT2A
The method proposed in this study is applicable under the condition that the drug exhibits high specificity toward a single receptor subtype. In this study, PF-05212377 was used as a highly selective antagonist of the 5HT6 receptor. This compound exhibits high affinity for human 5HT6 receptors, with reported Ki values ranging from 0.32 to 0.98 nM depending on the assay format, as previously described in the literature. In contrast, its affinity for the 5HT2A receptor is substantially lower, with Ki values ranging from 7.9 to 26 nM based on various in vitro assays (Pfizer internal data).5,6 Importantly, a previous in vivo PET receptor occupancy study using the selective 5HT2A tracer [11C]MDL100907 demonstrated negligible 5HT2A occupancy by PF-05212377, even at an oral dose of 70 mg. 13 These findings support the conclusion that PF-05212377 is a highly selective ligand with minimal pharmacological activity at 5HT2A receptors in the striatum.
Possible uses for ODBR
Previous studies have investigated receptor subtype distributions of other systems using non-selective tracers. For example, research using [11C]PHNO, which binds to both D2 and D3 receptors, 14 applied single-site or two-site competition models to estimate D2/D3 receptor fractions in regions containing both subtypes. In contrast, our approach is distinct in that it allows the assessment of subtype receptor distribution without the need for a reference region. Moreover, the method is equally applicable to tracers that do possess a valid reference region. It should be noted that models relying on reference regions for BP calculation are inherently susceptible to bias. Our approach also shares this limitation when calculating the BP ratio; however, it offers a key advantage in that occupancy images and subtype-specific receptor distribution estimates can still be derived from VT and VND estimates even when no reference region is available. This expands the applicability of receptor subtype quantification in scenarios where traditional reference-based modeling is infeasible.
Limitations
Several methodological limitations should be acknowledged. First, the LPF method requires sufficient local variation in baseline VT to obtain stable occupancy estimates. As shown in the original LPF validation study, 2 an adequate spread of baseline VT values within the local neighborhood is necessary for reliable linear regression in the Lassen plot, and low-dose conditions may therefore lead to increased variability in Emax fitting. In the present study, the primary endpoint was Occmax, which is driven mainly by high-occupancy data and depends on the inclusion of sufficiently high drug doses. Under these conditions, parameter estimates can be obtained with reasonable stability, as observed in the present dataset.
Second, VND estimates derived from the LPF may be influenced by partial volume effects, which arise from the limited spatial resolution of PET imaging and can introduce bias through spillover between regions with different tracer uptake characteristics. The caudate, owing to its smaller size and proximity to the white matter, may be more susceptible to partial volume contamination than the putamen. To mitigate this potential bias, a region-based LPF analysis restricted to eroded ROIs can be considered; however, for more accurate quantification, future studies would benefit from incorporating explicit partial volume correction.
Third, the interpretation of ODBR may be influenced by regional differences in endogenous serotonin occupancy and receptor coupling states, which can vary across subtypes and regions. These factors may partly explain the discrepancy between the ODBR estimates and post-mortem Bmax ratios. Although modeling these effects explicitly is beyond the scope of this work, as long as baseline occupancies of receptors by endogenous ligands are small or similar across regions, ODBR should still provide a reasonable approximation of the relative Bmax ratio.
Fourth, the present results were not validated against separate in vivo measurements using two fully subtype-selective PET tracers, which would represent the gold standard for quantifying receptor subtype distributions. In practice, however, such studies are challenging because truly selective tracers for each receptor subtype are not always available, and conducting multiple dedicated PET studies in the same subjects is often logistically and ethically difficult. These limitations motivated the development of the present approach, which aims to extract as much information as possible on receptor subtype distribution from occupancy data acquired with a selective blocking drug and a non-selective tracer. Nevertheless, validation against separate subtype-selective PET studies, when feasible, would provide the most rigorous confirmation of the proposed method.
Conclusion
This study supports the use of the Lassen plot filter (LPF) method as a means of generating and analyzing voxellevel occupancy images of PF-05212377 (SAM760), a 5HT6 antagonist, using only a non-selective tracer. Our analysis revealed spatial variation in Occmax across striatum regions. Our new approach offers a way to estimate 5HT2A receptor density ratios between the caudate and putamen using a non-selective tracer and the occupancy derived Bmax ratio (ODBR), which can be compared directly to post-mortem findings. We believe our method may generate valuable new information on receptor subtype distribution patterns, in vivo, without requiring separate, subtype-specific tracers, particularly in regions where direct measurement is challenging. Future research could refine this approach, potentially expanding its application to other non-selective tracers and brain regions.
Footnotes
Acknowledgements
We gratefully acknowledge the contributions of the Yale PET Center chemistry team, imaging technologists, and nursing staff, whose expertise and support were essential to this work. We extend our special thanks to Dr. Laigao Chen of Pfizer for generously providing the PET data.
Author contributions
SJK and JH pre-processed the data and analyzed the data. SJK, AI, CCC, JH, GES, MS, EAR, and EDM interpreted the results. SJK and EDM drafted the manuscript. SJK, CCC, GES, MS, EAR, and EDM edited and approved the final version of the manuscript.
Funding
The authors disclosed receipt of the following financial support for the research, authorship, and/or publication of this article: This work was supported by research grant R01EB032658.
Declaration of conflicting interests
The authors declared no potential conflicts of interest with respect to the research, authorship, and/or publication of this article.