
Abstract
The NeuroEXPLORER (NX), a next generation brain-dedicated PET scanner, has demonstrated improved spatial resolution and sensitivity compared with previous PET scanners. In this study, we performed synaptic vesicle glycoprotein 2A (SV2A) PET, an in vivo marker of synaptic density, to evaluate the performance of the NX in both fetal and maternal brains of four pregnant rhesus macaques. Results were compared with the previously acquired PET images using miniEXPLORER and Biograph mCT for fetal and maternal brains (four pregnant monkeys per scanner). The NX demonstrated superior performance compared with the other scanners, providing improved image clarity and higher distribution volume ratios (DVRs), which were significant in the occipital region and putamen of the fetal brain (p < 0.05, FDR uncorrected), as well as across all regions in the maternal brain (p < 0.05, FDR corrected). The percentage difference in mean regional DVR between maternal and fetal brains ranged from 36.1% in the amygdala to 78.3% in the occipital lobe in the NX, which may reflect regional differences in the phase of synaptic development. This study highlights the NX as a promising non-invasive tool for investigating in utero synaptic development. The presence of in utero motion emphasizes the necessity of motion correction for reliable PET quantification.
Introduction
Estimating synaptic density is critical for understanding brain development, plasticity, and function. During the perinatal period, the brain undergoes rapid synaptogenesis, followed by activity-dependent pruning that refines neural circuits and supports the emergence of higher-order cognition and behavior.1,2 This dynamic remodeling establishes the foundation for sensory processing, motor control, and learning. Disruptions in the timing or magnitude of synaptic changes during this window have been linked to a range of neurodevelopmental disorders, including autism spectrum disorder, intellectual disability, and schizophrenia. 3 Moreover, alterations in perinatal synaptic density may confer long-term vulnerability to psychiatric and neurological diseases,4,5 underscoring the importance of accurately characterizing these trajectories in vivo. Traditional histological studies have revealed critical milestones in the dynamic changes of synapses, but these methods remain limited to postmortem tissue. Noninvasive approaches that enable longitudinal quantification of synaptic density during development are therefore essential for advancing our understanding of typical and atypical brain maturation.
Synaptic vesicle protein 2A (SV2A) is a membrane protein localized on presynaptic vesicles in neurons and is recognized as a biomarker for synaptic density. Novel PET tracers, [11C]UCB-J and [18F]SynVesT-1, enable the noninvasive quantification of SV2A in vivo. The rhesus macaque is a widely used translational model for human brain development due to its close evolutionary proximity and similar patterns of prenatal and postnatal neurodevelopment. 6 We previously conducted an initial in utero SV2A PET study with [11C]UCB-J and [18F]SynVesT-1 in rhesus macaques, which demonstrated dynamic changes in synaptic density during pregnancy. 7 However, this earlier study was performed with relatively low-resolution PET scanners, limiting the ability to accurately assess perinatal brain development, particularly in smaller brain regions. To address these limitations, we employed the NeuroEXPLORER (NX), a next-generation brain-dedicated PET scanner. The NX provides unprecedented PET imaging performance, with significantly improved spatial resolution and signal-to-noise ratio compared with conventional scanners.8,9
In this study, we leverage the advanced performance of the NX to conduct PET scans with [18F]SynVesT-1 in pregnant rhesus macaques. For pregnant monkeys, we systematically compare these results with images acquired using the mini-EXPLORER 10 (miniEX; UC Davis) and Biograph mCT PET/CT 11 (mCT; Siemens) in a previous publication. 7 In the initial performance evaluation studies, transaxial spatial resolution was estimated to be ~<2, 3, and 4 mm full width at half maximum (FWHM) for the NX, miniEX, and mCT scanners, respectively, using simple structured phantoms. Although local contrast within complex anatomical structures, such as the brain with its gyri and sulci, is known to affect the convergence speed of iterative reconstruction algorithms, improved spatial resolution is expected to enhance contrast between regions, thereby facilitating more accurate quantification of tracer binding. By comparing scanner performances on in utero fetal and maternal brains, our study aims to validate the utility of NX for in vivo assessment of SV2A density during primate brain development and to inform future applications in translational neuroscience research.
Material and methods
SV2A PET and MR imaging
A total of 12 pregnant rhesus macaques were included in this study. All pregnant monkeys were scanned during the third trimester (~145 days of gestation). The new set of scans acquired using the NX was compared with the previously acquired images obtained at two sites, Yale PET Center and UC Davis. At Yale PET Center, pregnant monkeys were scanned with mCT (n = 4, maternal age: 10.4 ± 3.6 years) using [11C]UCB-J (154.4 ± 52.2 MBq). At UC Davis, pregnant monkeys were scanned with [18F]SynVesT-1 using miniEX (n = 4, maternal age 8.8 ± 3.7 years, 107.8 ± 6.9 MBq). CT was performed prior to PET acquisition for attenuation correction. The sedation and anesthesia protocols for those scans were described previously. 7 Briefly, at Yale PET center, pregnant monkeys were sedated with ketamine (7–10 mg/kg) + glycopyrrolate (0.01 mg/kg) and maintained under gas anesthesia (isoflurane; 0.75%–2.5%). At UC Davis, animals were sedated with telazol (5–8 mg/kg) supplemented with ketamine. For the new scans in this study, pregnant monkeys were provided by the Rakic Breeding colony at Yale University. [18F]SynVesT-1 PET imaging was performed on the pregnant monkeys (n = 4, maternal age 9.0 ± 6.1 years, 180.5 ± 1.7 MBq) using the NX at Yale PET Center. The 0–60 min post-injection data were reconstructed and processed with the following procedures. The NX images were reconstructed using time of flight (TOF) + point spread function (PSF) + depth of interaction (DOI) modeling and ordered subset expectation maximization (OSEM) algorithm with seven iterations of 10 subsets with 0.5 × 0.5 × 0.5 mm3 voxel size. 8 The image reconstructions for the other scanners were consistent with the previous study. The animals scanned in NX also underwent anatomical MRI scan, T2 weighted image in 2D for in utero fetuses, performed within 6–9 days either before or after PET scan. One in utero fetus underwent an additional sequence that was previously developed for real-time dynamic cardiac imaging12,13 to evaluate in utero motion. Each image frame was reconstructed with a 192 × 192 × 60 matrix and a voxel size of 1.1 × 1.1 × 1.2 mm3. All procedures were carried out under approved animal protocols by the Yale University Animal Care and Use Committee (IACUC) and in strict accordance with the guidelines set forth in the Animal Welfare Act and the Guide for the Care and Use of Laboratory Animals. Because only one experimental group was studied at a single imaging time point, randomization, blinding, and allocation concealment were not applicable. The study is reported in accordance with ARRIVE 2.0 guidelines.
PET data analysis: Registration, ROI analysis, and kinetic modeling
For fetal brain, PET images were registered to the 2-week-old Neonate Rhesus Monkey template space14,15 using a 12-degree-of-freedom (DOF) transformation estimated in FSL. 16 The registration was guided by minimizing mutual information with an averaged fetal SV2A image acquired on miniEX in the previous study that has been aligned to the same template space with 12 DOF. 7 For the maternal brain, a reference PET image for the adult brain was generated in a template space by averaging 10 previously acquired [11C]UCB-J PET 0–60 min images obtained on the Focus 220. For those PET images, transformations to the template space were first estimated linearly between each PET and its corresponding individual MR, and then nonlinearly between individual MR and the template MR. 17 The maternal brain PET images in this study were then registered to the reference PET image using a 12 DOF transformation. The estimated transformations between individual PET and the template spaces were applied to extract PET time activity curves (TACs) from the following brain regions: frontal, occipital, temporal, insula, hippocampus, amygdala, caudate, putamen, cerebellum, and centrum semiovale. Distribution volume ratios (DVRs) were estimated for the nine regions of interest (ROIs) using the Logan graphical analysis method with the centrum semiovale as the reference region. The maternal centrum semiovale was used for both maternal and fetal brain ROIs. The fitting start time (t*) was set to 30 min for fetal brain, 10 min for maternal brain, based on validation of the linearity in the individual plots (Figure 1). Although results from the miniEX and mCT datasets were previously published, 7 all data were reanalyzed in the present study to ensure a consistent analysis pipeline across scanners. One fetal data acquired on miniEX was excluded due to large fitting errors resulting from significant in utero motion.
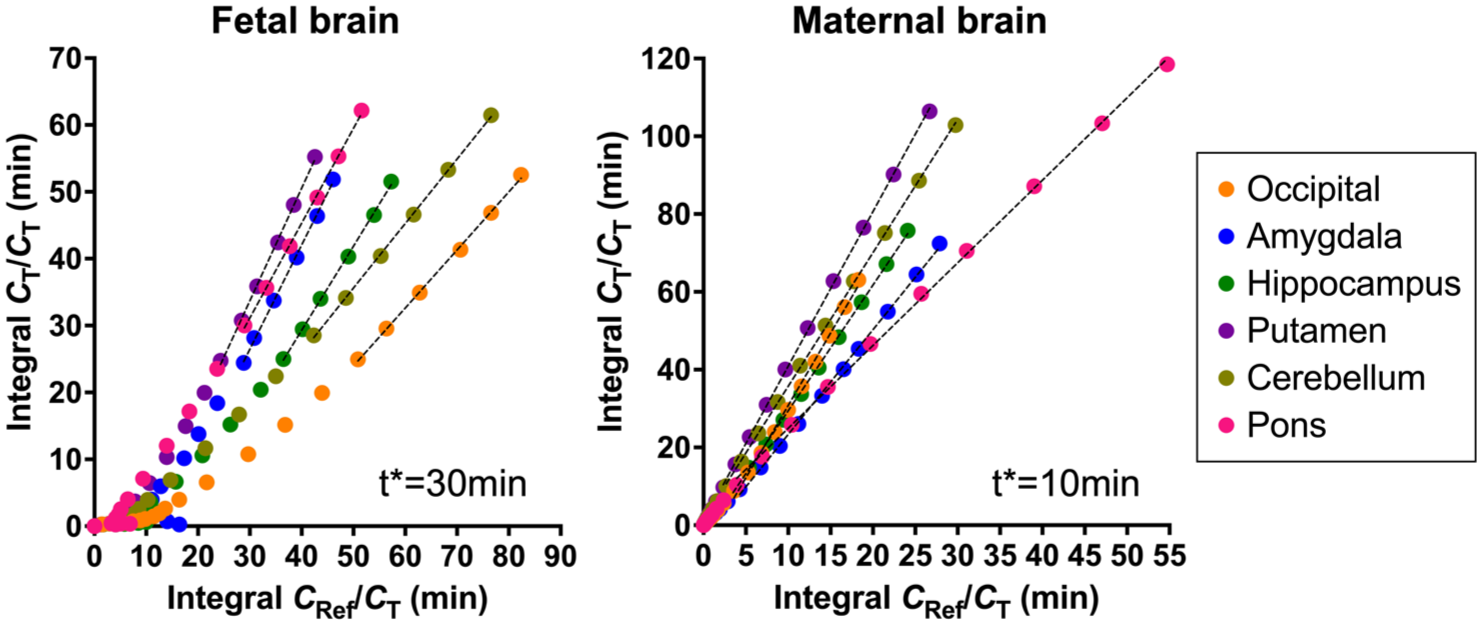
Example of Logan graphical analysis with a NX data. The x-axis represents the ratio of the time integral of the reference region radioactivity to the target region radioactivity at each time point. The y-axis represents the ratio of the time integral of the target region radioactivity to the target region radioactivity at each time point. The dotted lines indicate the fitted data. The fitting start time (t*) was 30 and 10 min for fetal and maternal brain regions, respectively.
In utero motion estimation with center-of-distribution (COD)
The center-of-distribution (COD) is a quantitative measure that represents the average spatial location of detected PET events, or the weighted average position of all voxel intensities within a reconstructed image. It has been used to evaluate motion during the image acquisition.18,19 Two types of COD were analyzed in this study to evaluate in utero motion, an event-based COD derived from PET list-mode data, and a volume-based COD derived from reconstructed PET and MR images. The event-based COD was calculated directly from PET list-mode data to capture high temporal resolution motion information. For each annihilation event, the line of response was determined from the detector pair, and the central spatial coordinate of the TOF bin was computed. The events located within a bounding box in the image space were used to calculate mean COD coordinates over 100 ms intervals and COD motion traces were generated in three directions: lateral, anterior-posterior, and superior-inferior. In this study, two separated event-based CODs were derived for maternal liver and fetal brain, respectively. To correct for sporadic fetal motion, the COD trace of the fetal brain was evaluated. An in-house self-adaptive algorithm 20 was applied to the event-based COD to identify motion-free frames, which were then reconstructed separately. The motion-free frames longer than 6 min were divided into two frames. The reconstructed images were subsequently coregistered to the 0–10 min summed image with six degrees of freedom transformation. For comparison, dynamic images reconstructed using predefined frames underwent the same coregistration procedure. Respiratory motion was identified using the maternal liver COD trace, in which periodic motion was observed. Using the respiratory phase-gating method,21,22 the 40–60 min list-mode data were divided into five respiratory phase gates and reconstructed separately. Volume-based CODs were then calculated from the respiratory-gated PET images cropped to the maternal liver and fetal brain, and from the time-binned real-time dynamic MR images cropped to the fetal brain. For each reconstructed image, the COD coordinates were computed, and the three-dimensional Euclidean distances between COD coordinates were calculated to quantify spatial offset resulting from motion.
Statistical analysis
All statistical analyses were conducted with R (version 4.3.1). Regional differences in maternal and fetal DVR values across scanners were evaluated using a one-way analysis of variance (ANOVA). For each predefined ROI, DVR values were entered into a model with scanner (NX, miniEX, and mCT) as the between-group factor. Additionally, we conducted two-sample t-tests for each brain region between maternal and fetal DVR collected by NX, miniEX, and mCT scanners, to confirm whether NX captured patterns of maternal–fetal DVR differences consistent with those observed in the other scanners (see Supplemental Results). To correct for multiple comparisons across regions, p values were adjusted using the Benjamini–Hochberg (BH) procedure for False Discovery Rate (FDR) correction, with significance defined as FDR-adjusted p < 0.05. For regions showing a significant main effect of scanner, post hoc pairwise comparisons were conducted using Tukey’s test.
Results
In utero imaging in NX
The NX scanner provides the longest axial field of view (FOV) coverage (49.5 mm), followed by the miniEX (45.7 mm) and mCT (22.1 mm). The FOVs of NX and miniEX were wide enough to cover adult monkey’s head to thigh in a single bed position while the mCT requires continuous bed motion to cover the whole body (Figure 2(a)). The detailed visualization of various brain regions in the fetal brain was captured through in utero NX PET images. The PET 45–60 min summed images highlighted higher uptake in key areas including the striatum, amygdala, hippocampus, motor/somatosensory/auditory cortex, thalamus, cerebellum, midbrain, and pons. These regions exhibit distinct patterns suggesting a comparatively faster phase of synaptic development compared to the other regions. Corresponding anatomical MRI scans confirmed the anatomical locations of these high-uptake regions (Figure 2(b)). NX images demonstrated superior performance for both maternal and fetal brain images compared with miniEX and mCT. NX provided a clear visualization of fine anatomical structures (Figure 3).
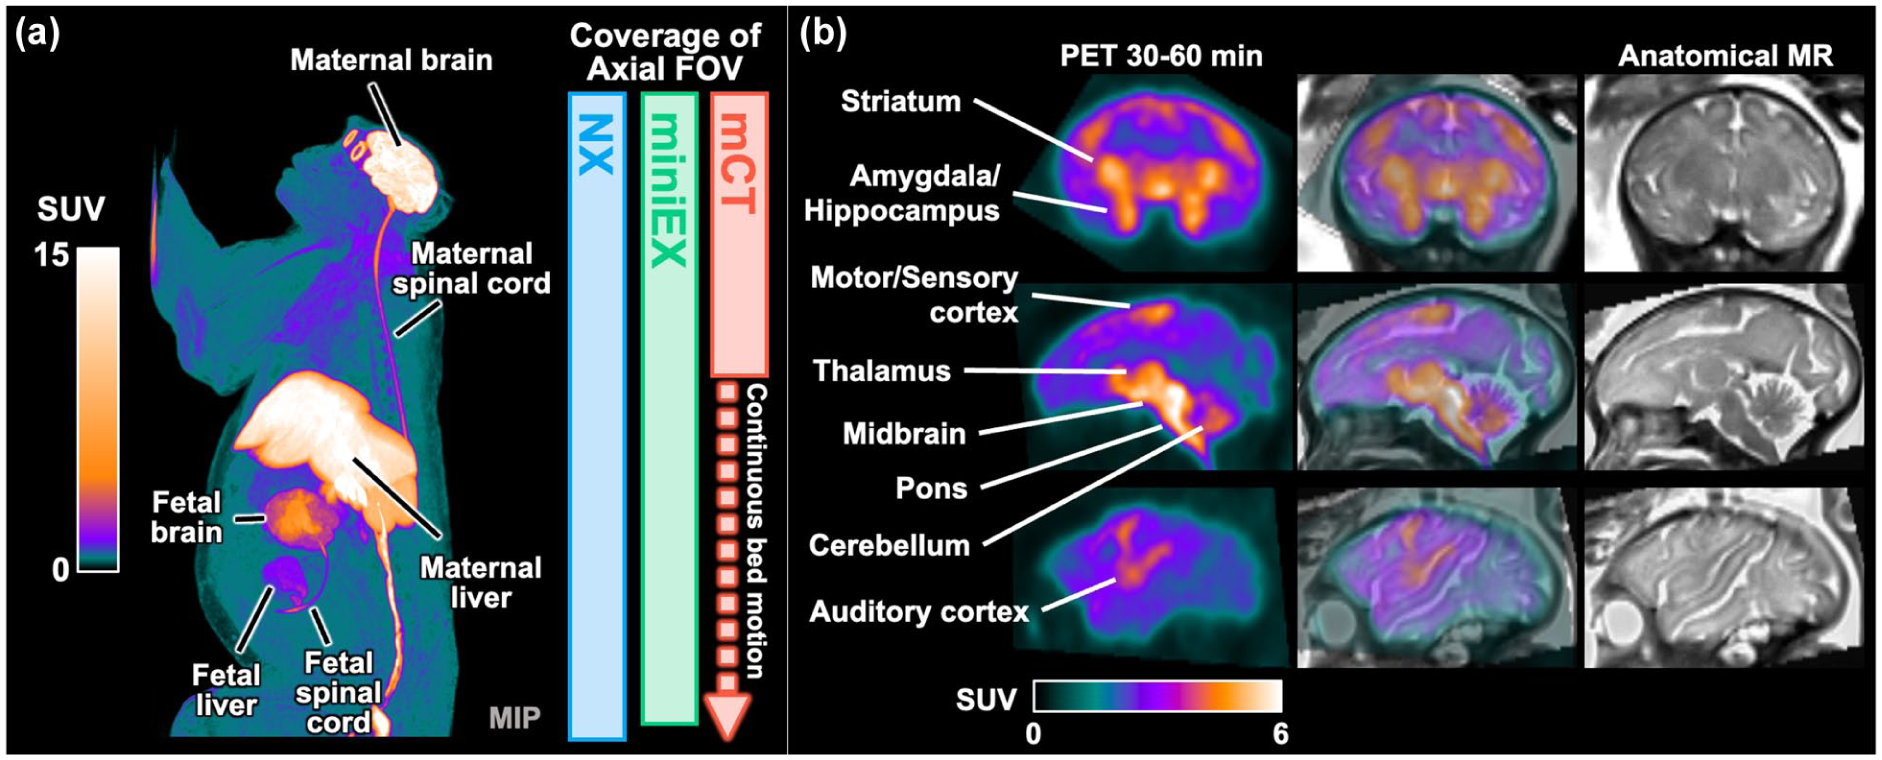
Overview of PET imaging on gravid rhesus monkey: (a) summed 30–60 min [18F]SynVesT-1 PET MIP image of a gravid monkey acquired on the NX, showing the animal’s body size relative to each scanner’s FOV. The bars represent the axial FOV coverage of each scanner. The long axial FOV of NX and miniEXPLORER are essential for imaging of both maternal and fetal brains within a single scan and (b) fetal [18F]SynVesT-1 PET image (30–60 min summed) acquired using NX and corresponding anatomical MR image of the fetal brain. With high spatial resolution and sensitivity of the NX, higher tracer uptake was observed in the medial temporal regions, striatum, thalamus, midbrain, pons, cerebellum, and portions of the neocortex. Guided by the anatomical MR images, the neocortical uptake was localized primarily to the motor, somatosensory, and auditory cortices.
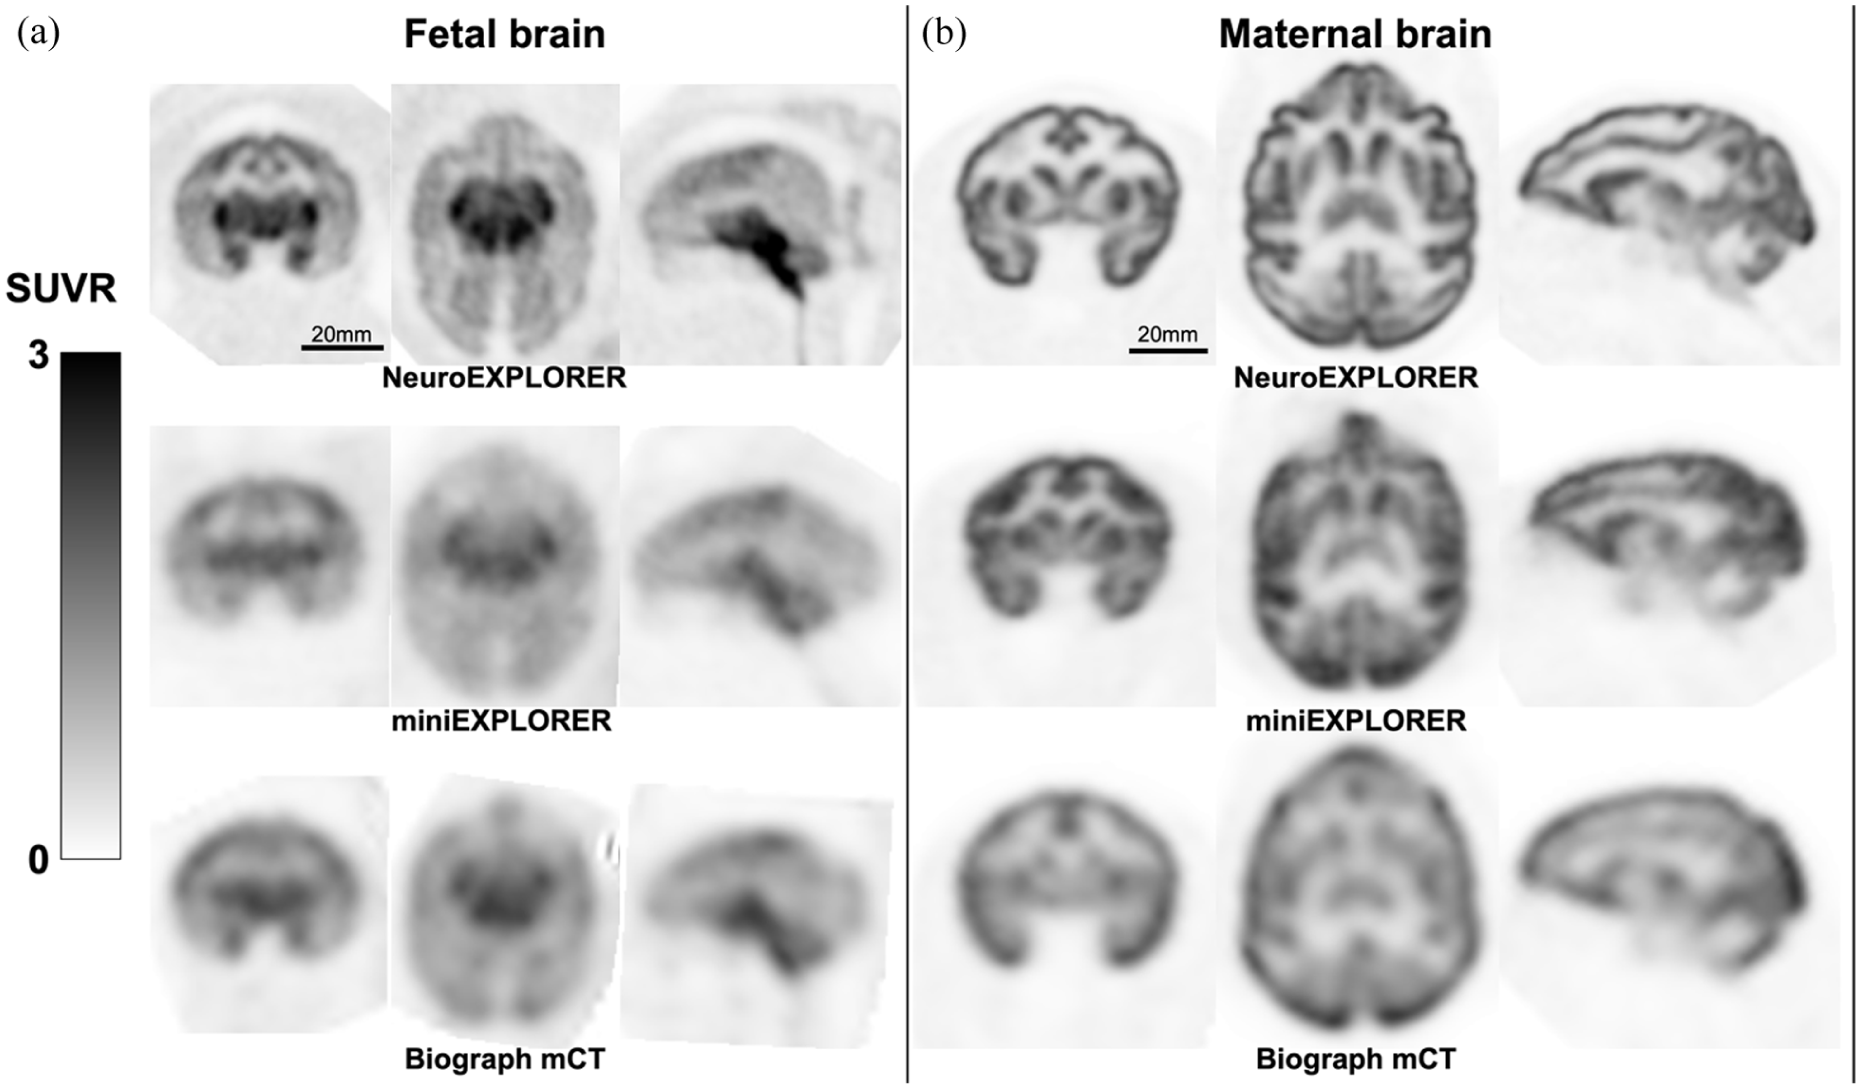
Representative reconstructed images for fetal and maternal brains acquired on the NeuroEXPLORER ([18F]SynVesT-1), miniEXPLORER ([18F]SynVesT-1), and Biograph mCT ([11C]UCB-J): (a) summed images from 30 to 60 min post-injection for the fetal brain. Voxel intensities were normalized to the whole-brain mean of each scan to generate SUVR images. For visualization purpose, all images were co-registered into a same space using six DOF transformations, and the same spatial scale was used across the three images and (b) maternal brain SUVR images from 30 to 60 min post-injection. The images were normalized to the whole-brain mean and co-registered to a same space using six DOF transformations. The three images were shown with the same spatial scale.
PET kinetic modeling for in utero fetal and maternal brain across three scanners
The fetal DVR was significantly different between the three scanners for the frontal (p = 0.016, uncorrected), putamen (p = 0.024, uncorrected), and occipital region (p = 0.020, uncorrected; Figure 4), though, the fetal DVR results did not survive multiple comparison correction (frontal: p = 0.080, putamen: p = 0.080, occipital: p = 0.080, FDR corrected). The maternal DVR was significantly different between the three scanners across all the regions (Figure 5; p < 0.05, FDR corrected). NX showed higher DVR compared to minEX and mCT across each region (p < 0.05, FDR corrected). When DVRs in the maternal and fetal brains were compared, the amygdala showed the smallest % difference, with fetal DVRs lower than maternal DVRs by an average of 35.2%, 37.3%, and 46.3% on the NX, miniEX, and mCT, respectively. The pons showed second-smallest difference, with fetal DVRs lower by 37.3%, 46.4%, and 46.5% on the NX, miniEX, and mCT, respectively. Neocortical regions exhibited larger % differences and the occipital lobe showed 78.3%, 83.9%, and 75.7% differences on the NX, miniEX, and mCT, respectively. The average % difference was similar across scanners, however the variation was smaller on the NX compared with the other scanners (Table S1 and Figure S1). These regional differences may reflect the anatomical variations in the phase of brain development.
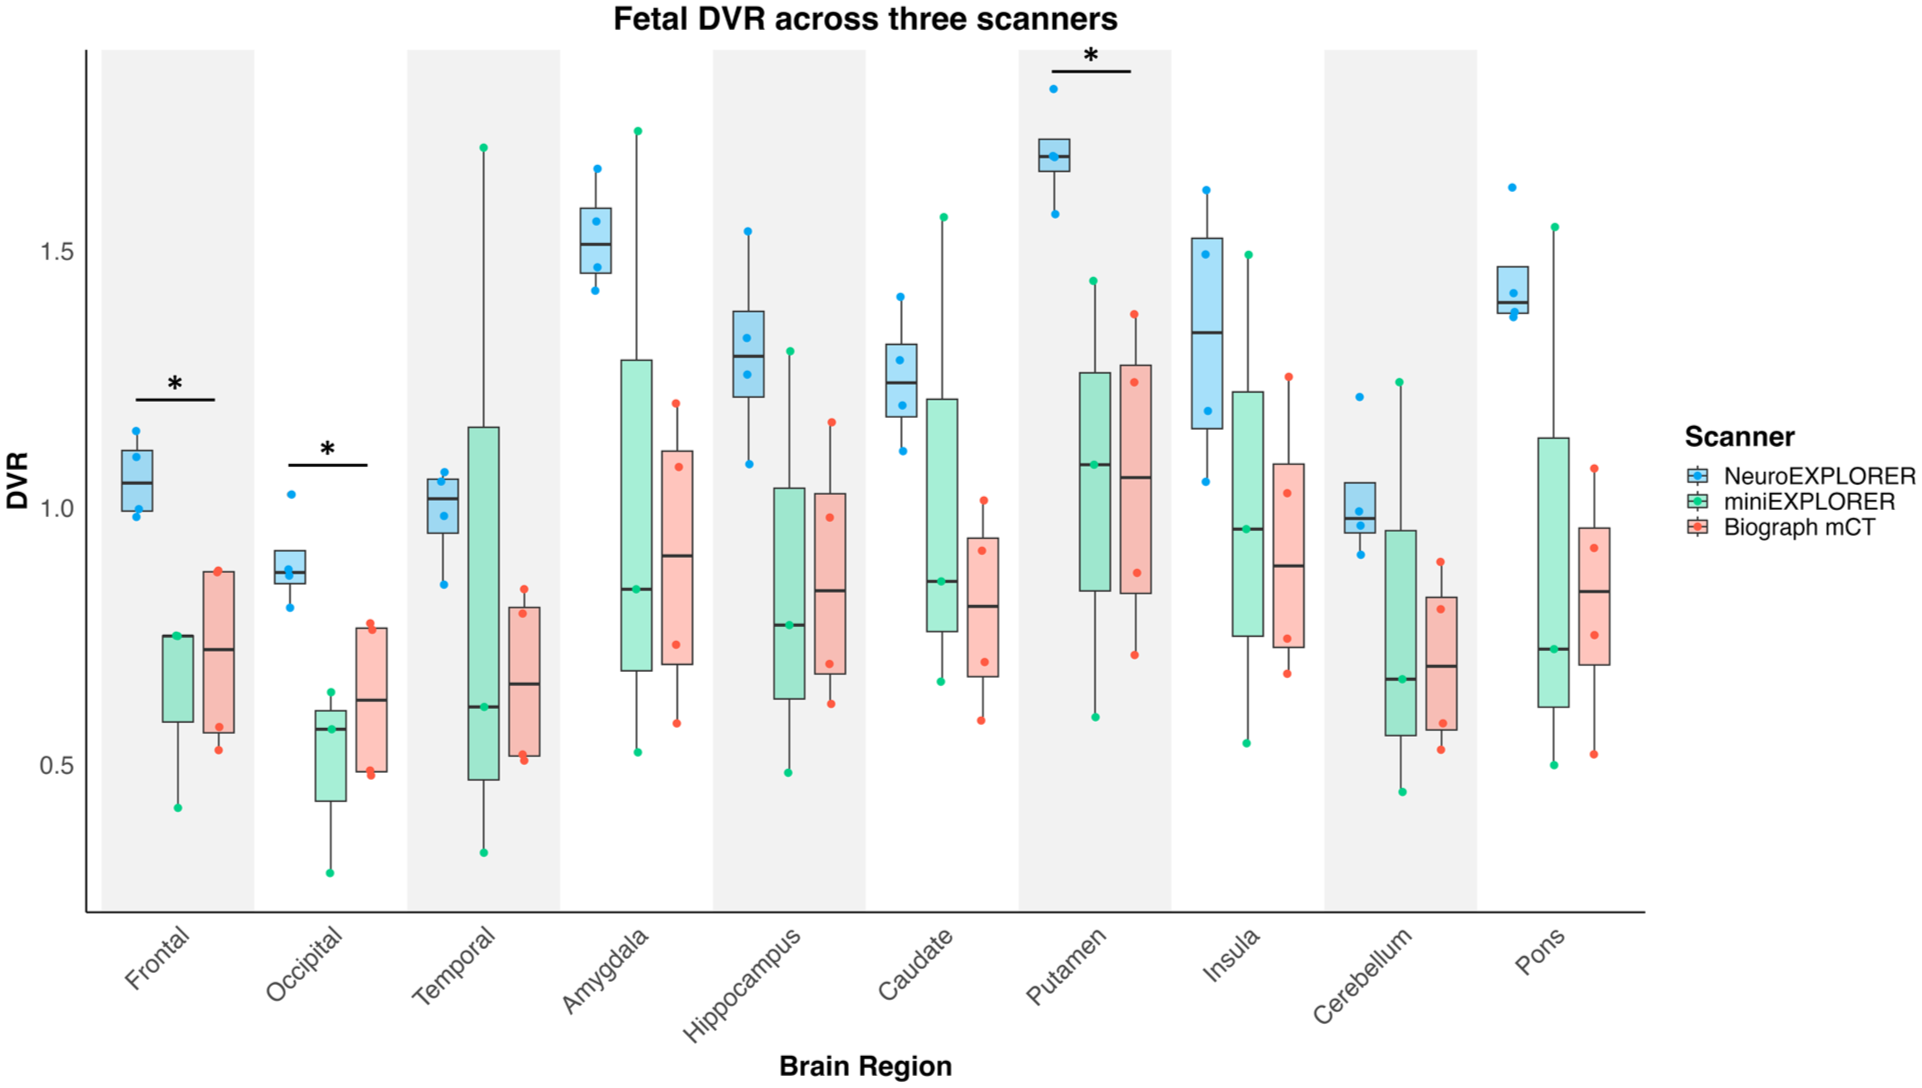
Regional DVR in the fetal brains from data acquired with the NX (n = 4, [18F]SynVesT-1), miniEXPLORER (n = 3, [18F]SynVesT-1), and biograph mCT (n = 4, ([11C]UCB-J). NX DVR was significantly higher in the frontal, occipital region, and putamen compared with the other two scanners (p < 0.05, uncorrected). In all other regions, the NX showed higher DVR in average compared with the other two scanners.
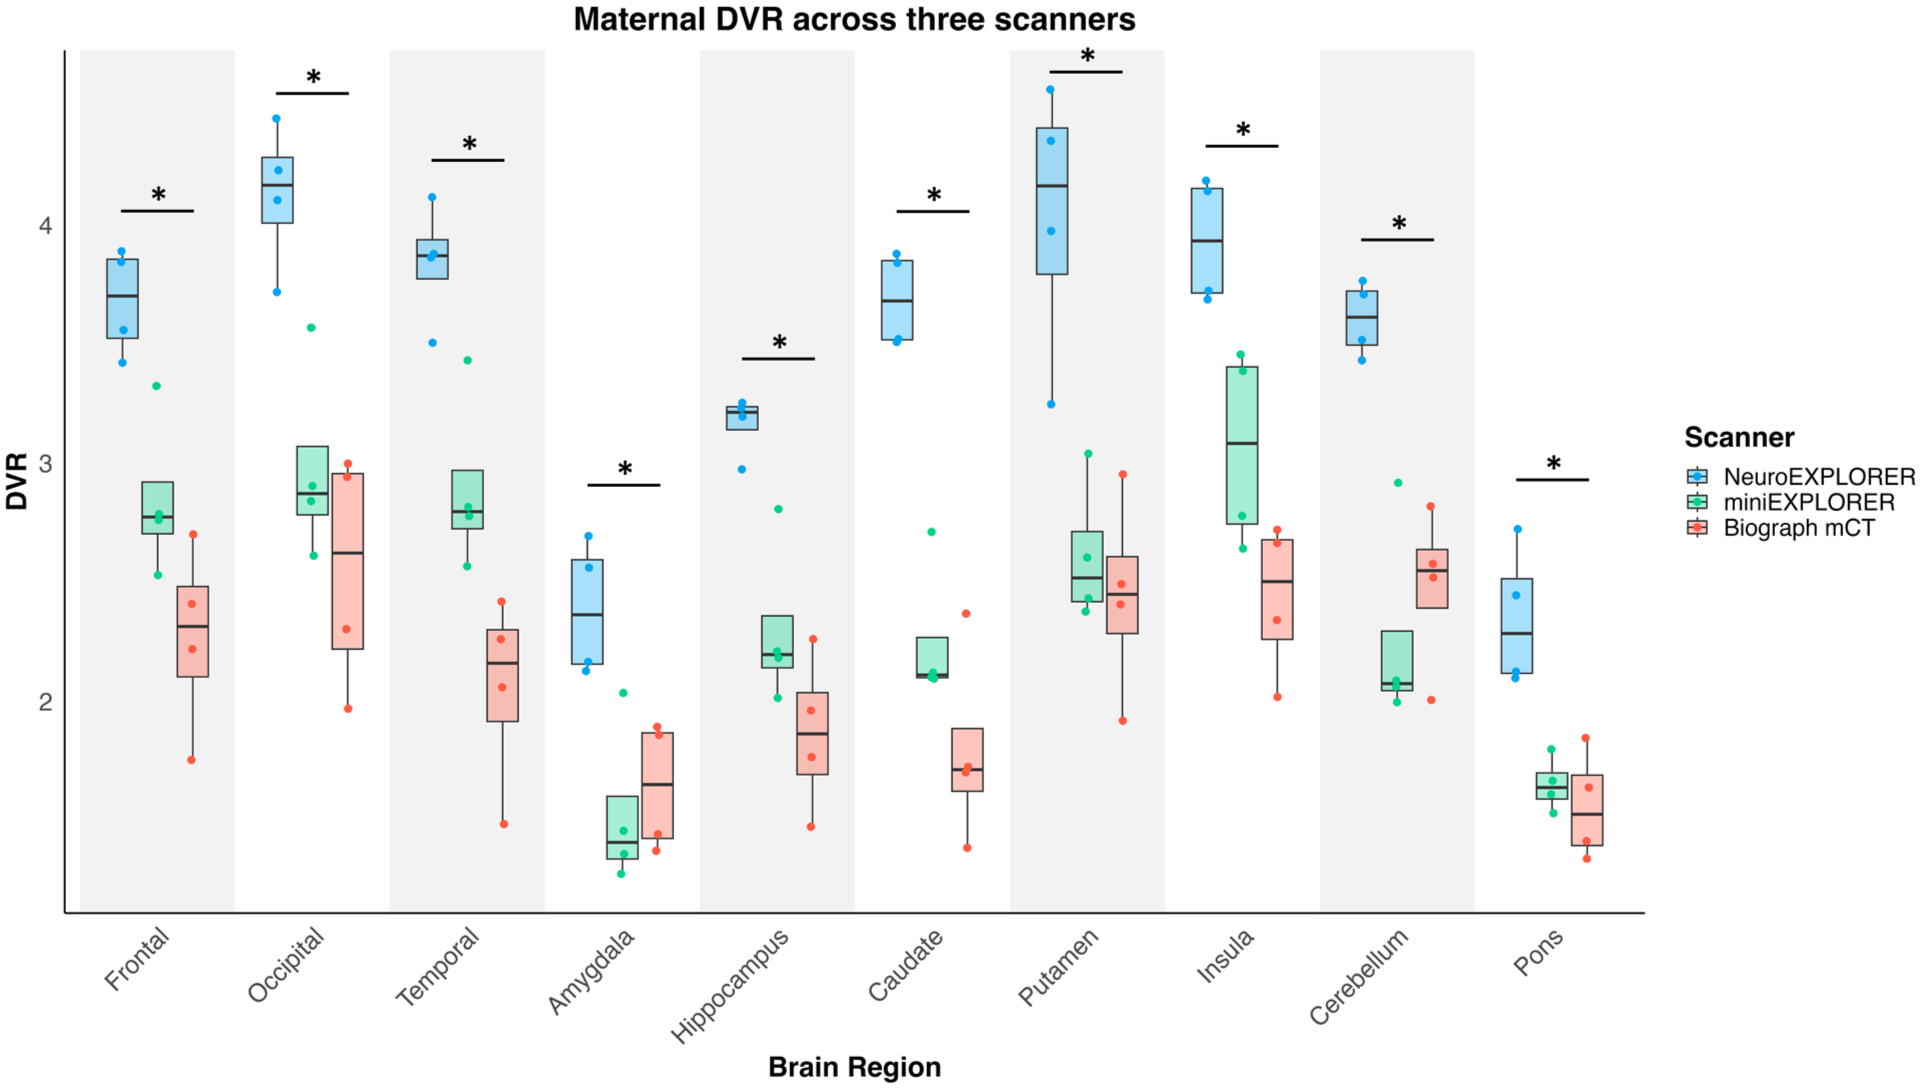
Regional DVR in the maternal brains estimated from data acquired with NX (n = 4, [18F]SynVesT-1), miniEXPLORER (n = 4, [18F]SynVesT-1), and biograph mCT (n = 4, ([11C]UCB-J). NX results were significantly higher than the other two scanners across all brain regions (p < 0.05, FDR correct).
In utero motion during imaging
A potential confound in interpreting these data is in utero motion. To estimate in utero motion, one pregnant monkey [18F]SynVesT-1 PET data obtained on NX was analyzed to calculate the local event-based COD. The event-based COD for fetal brain from 30 to 85 min data revealed a noticeable motion between 60 and 70 min (Figure 6(a)). This motion did not affect the results reported above, as the Logan graphical analysis used only the 0–60 min data. Two separate images were reconstructed for the 45–60 and 70–85 min, showing a 2.1 mm offset in volume-based COD coordinates (Figure 6(b)). The 55–75 min summed image without motion correction was degraded by this motion, and the putamen TAC showed a clear discontinuity after 60 min. Inter-frame registration applied to predefined dynamic frames recovered image contrast in the 55–75 min summed image, however, residual motion artifacts remained in the putamen TAC. In contrast, images reconstructed using motion-free frame followed by inter-motion-free frame registration showed further improvement in image contrast and produced a smoother putamen TAC, indicating more effective mitigation of motion artifacts. Line profiles across amygdala demonstrated the highest peak-to-valley ratio with motion correction using motion-free frame registration (Figure 6(c)). The event-based COD focused on the maternal liver showed a repetitive motion frequency of 0.42 Hz, corresponding to maternal respiration. The volume-based COD calculated from the cropped maternal liver images showed a maximum coordinate distance of 3.6 mm between phase gates #2 and #5. The images from gates #2 and #5 showed clear misalignment between the two (Figure S2). For the fetal brain images, the largest difference in volume-based COD coordinates was estimated to be 0.48 mm. Respiratory motion was also evident in the real-time in utero MR images obtained from one of the pregnant monkeys. The volume-based COD traces demonstrated 0.23 Hz repetitive motion and the coordinate distance between the fetal brain images at the end of inhale and end of exhale phases was 0.82 mm (Figure 7).
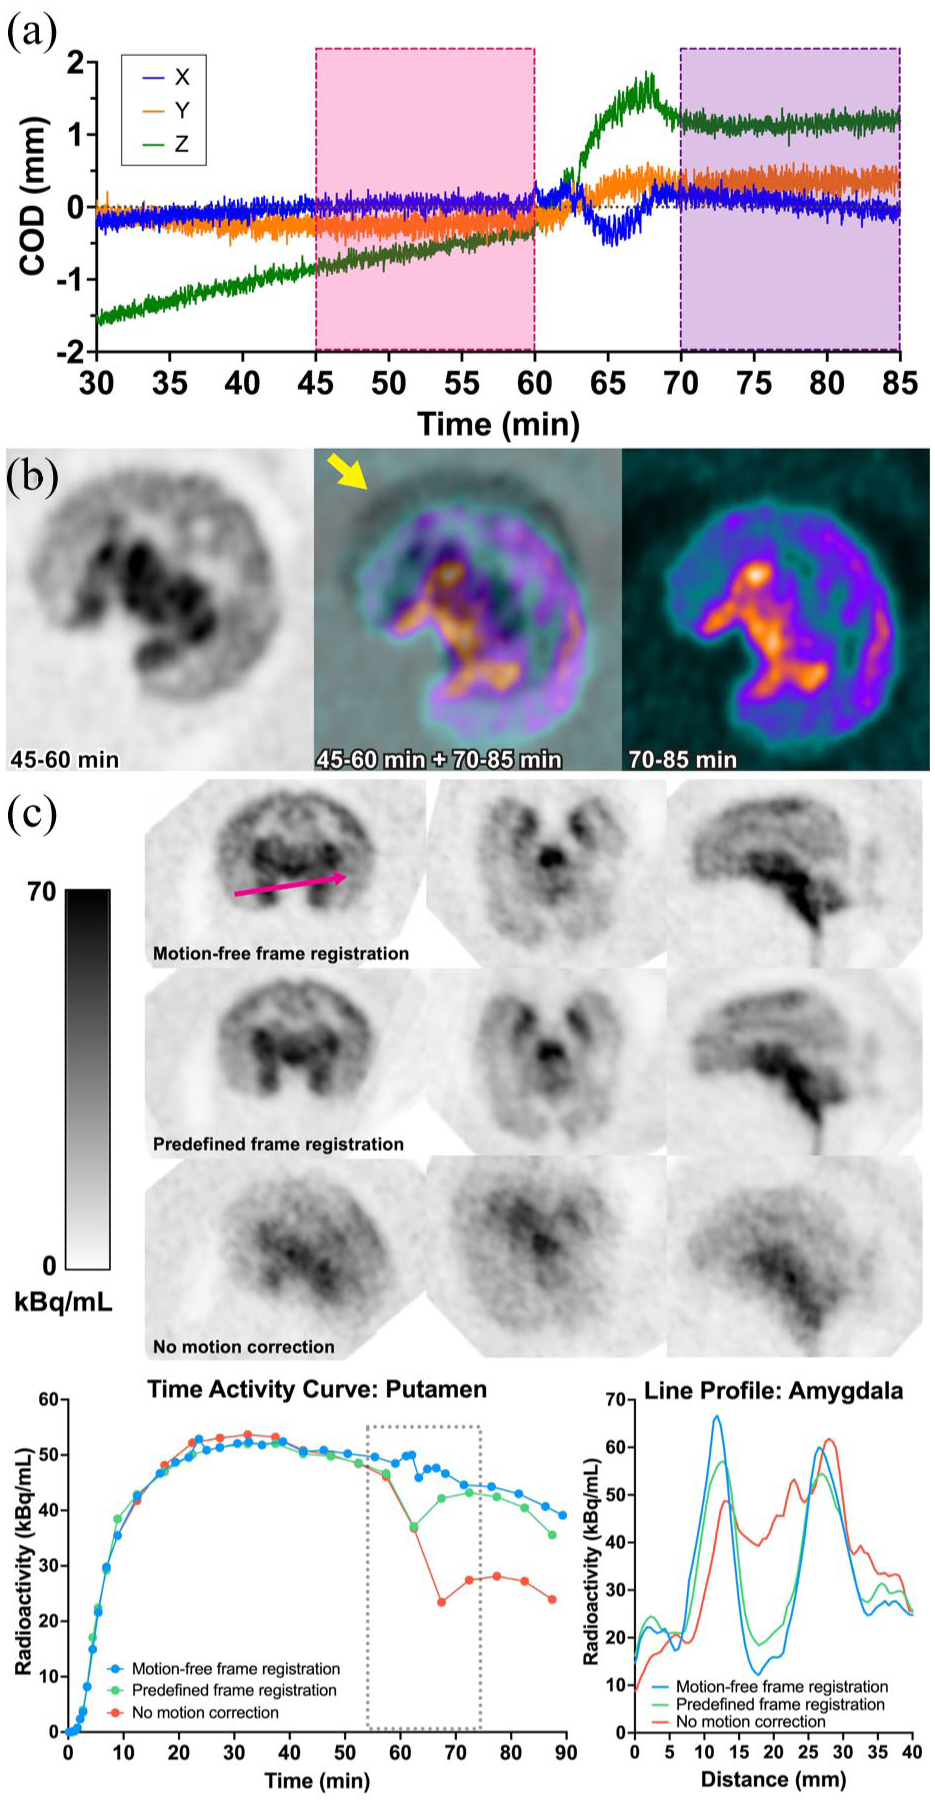
Motion estimation and correction for in utero PET imaging on the NeuroEXPLORER: (a) COD traces. The COD traces exhibit a transient peak or valley between 60 and 70 min, (b) images reconstructed from 55 to 75 min data using motion-free frame registration, predefined frame registration, or no motion correction. Time activity curves from the putamen and line profiles across the amygdala in the 55–75 min images demonstrate the feasibility of the proposed motion correction approach, and (c) PET images reconstructed separately from 45 to 60 and 70 to 85 min data were superimposed, revealing noticeable in utero motion (yellow arrow).
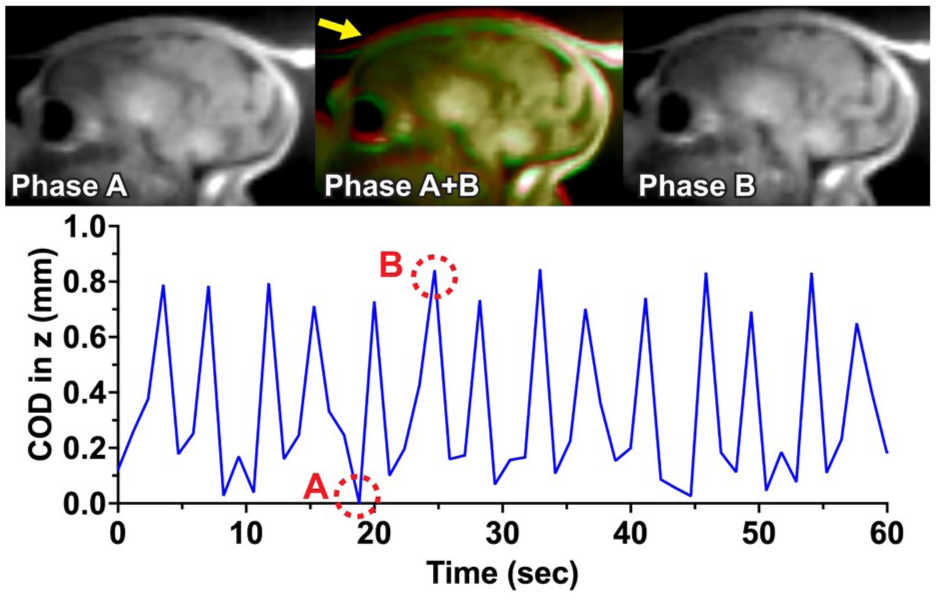
Motion trace obtained from the real-time dynamic MR imaging sequence. Three-dimensional volume images were reconstructed every 1.176 s. The volume-based COD trace in the z-direction shows submillimeter periodic in utero motion corresponding to maternal respiration. Images corresponding to two distinct COD positions A and B are shown here, highlighting a small displacement (yellow arrow).
Discussion
This study evaluated the performance of the NX for assessing SV2A in maternal and fetal nonhuman primate brains. NX demonstrated superior spatial resolution and significantly higher DVR across all regions in the maternal brain compared with miniEX and mCT. Fetal results followed the same trend, with NX providing improved image clarity and higher DVRs, with statistically significant in the putamen, frontal lobe, and occipital lobe. Variability in the regional DVRs was greater for the miniEX and mCT, particularly in the fetal data which reduced statistical power. This increased variability may be due to several factors, including scanner performance, fetal motion, and lower radioactivity at later time frames. The high performance of the NX enabled detailed visualization of fetal brain structures such as hippocampus, striatum, thalamus, and the motor, somatosensory, and auditory cortices. These regions play critical roles during the developmental period, as they undergo rapid changes and are highly susceptible to prenatal exposures, and effects of preterm birth.23–25 The higher DVR reflects the improved spatial resolution of the NX. The reduction in partial volume effects contributed to greater gray-white matter contrast, minimizing the spill-out from the gray matter regions that exhibit high SV2A expression and spill-in to the white matter, which served as the reference region for DVR estimation. In our previous work, we used maternal whole gray matter as the reference region to estimate fetal brain DVR. 7 However, in the present study, we strategically used the maternal CS to highlight differences in partial volume effects between scanners. The goodness-of-fit of the Logan plots in the fetal brain regions indicates that maternal CS can serve as an appropriate reference region for fetal brain analysis. As a preliminary validation, fetal white matter was defined for the NX data by modifying the white matter ROI in the template atlas and regional DVRs relative to fetal white matter were estimated using Logan plot. The linear fit slopes and intercepts, estimated separately for each animal ranged from 0.95 to 1.51, and −0.14 to −0.09, respectively, in the correlation analysis between DVRs referenced to maternal CS and fetal white matter (data not shown). Because substantial fetal motion remains, definitive conclusions will require dedicated motion correction, which we defer to future studies. One limitation of the comparison in this study is the difference in tracers. [18F]SynVesT-1 was used for the NX and miniEX data, whereas [11C]UCB-J was used for the mCT data. Previous human studies have reported that VT for [18F]SynVesT-1 is slightly lower (<10%) across gray-matter regions. A larger difference has been observed in the centrum semiovale, where VT is ~20% lower for SynVesT-1. Consequently, DVR and BPND values calculated using the centrum semiovale as the reference region are higher for SynVesT-1. Therefore, differences between mCT and the other scanners may not be attributable solely to differences in spatial resolution.
While NX has clear strengths, including long FOV, high sensitivity, and improved spatial resolution, still several challenges remain for the application of SV2A PET in in utero brain development studies. First, fetal movement and maternal respiration may have caused motion artifacts on the fetal brain images. The COD traces derived from a PET list-mode data identified one instance of sporadic fetal motion, resulting in a 2.1 mm COD coordinate mismatch. Although this particular motion did not affect DVR estimation in this study, since DVR was estimated using the 0–60 min PET data, it is noteworthy that such movements can occur unpredictably, even when the mother is under stable anesthesia. Maternal respiratory motion was detected in both PET event-based COD traces and MR volume-based COD. The volume-based COD of fetal brain images showed more than 0.4 mm mismatch. Given the relatively small size of the fetal brain, even such small motion could have a substantial impact on the image quality. The position of the fetal head in utero may influence how maternal respiration affects fetal brain motion. Because attenuation correction was based on a CT acquired before the PET scan, motion during PET acquisition can cause PET-CT misregistration, leading to attenuation correction errors. As demonstrated in one representative case in this study, motion detection and correction methods in PET data would be useful for further improving image quality. 19
Second, anatomical MRI is often required for accurate PET data analysis, including registration, ROI segmentation, gray matter masking, and partial volume correction, however, conventional 3D acquisition sequences of MR anatomical images require a long acquisition time and is therefore susceptible to in utero motion described above. 26 Fast 2D acquisition employed in this study provided sufficient in-plane resolution but had the drawback of relatively large slice thickness. In human fetal MRI, slice-to-volume registration techniques are often used to combine these slices into a super-resolution 3D image. However, the existing algorithms were developed for human fetal image and are not directly translatable to NHP fetal data. Fine-tuning these frameworks for NHPs may provide a potential solution for generating motion-free 3D volume images. In addition, motion-robust real-time dynamic MR imaging sequences may help address this issue by enabling rapid acquisition of 3D volume images within a very short time frame.12,13 In future studies, further optimization for in utero applications will be pursued.
Third, absolute quantification and validation of the PET measurements remain challenging. While the approach used in this study provides relative quantification, white matter exhibits minimal specific binding and is affected by spill-in from adjacent gray matter in a spatial resolution dependent manner. As a result, normalization to white matter can underestimate true gray-matter specific binding. Therefore, absolute measures such as VT may offer additional insight into brain development. However, absolute quantification requires accurate input function estimation, which would involve arterial blood sampling with correction for blood-to-plasma ratios and metabolite fractions. Because these parameters may differ between maternal and fetal circulation, arterial blood sampling from both mother and fetus would be necessary. Postmortem brain tissue assay could be used to validate the in vivo PET measurements, but it would require substantial resources and coordination.
Forth, interpreting SV2A changes during brain development requires through understanding of synaptic maturation. Although SV2A is widely used as a proxy for synaptic density in PET imaging studies, we acknowledge the limitation that SV2A binding may not directly equate to synaptic density and that it lacks specificity for neuronal subtypes.27–29 The number of SV2A glycoproteins per synaptic vesicle, as well as the number of vesicles per synapse, may vary across brain regions, neuronal subtypes, and developmental stages.27,30–32 Investigations of brain tissues allow more detailed insights into this during the perinatal period.
The fetal brain undergoes rapid development during pregnancy and throughout the perinatal period. Evidence from human MRI studies has demonstrated extensive structural and functional changes in fetal brain during the period of gestation33–35 and continuing after birth into the neonatal period.36–38 Investigating SV2A changes holds great potential for evaluating the synaptic maturation, as one of the presynaptic proteins. In this study, we focused on fetuses at ~145 gestational days, at which time the transverse width of the fetal brain was ~45 mm at its widest point, compared with 60 mm for the maternal brain. In our previous work we investigated ~120 gestational days of fetal brain, and the enhanced capabilities of NX also open the door to studies at even earlier gestational stages and enable longer longitudinal in utero brain assessments. A longitudinal study design would be particularly valuable, as it can substantially increase statistical power while reducing the total number of animals required. Such a design could be used to investigate prenatal exposures, such as maternal hypertension-related disorders, diabetes, and substance use.39–41 Although radioactive imaging is not suitable for direct research in human pregnant women and infants, NHP are closely related to humans, 6 and PET imaging in NHP allows microscopic insights into synaptic development during the perinatal period. 27
The NX offers the advantage of extended FOV, thereby allowing for simultaneous single bed acquisition of the NHP maternal and fetal brains, in contrast to conventional scanners that require multi-bed acquisition. This configuration improves data sampling quality for both maternal and fetal brains and opens the possibility to investigate maternal-fetal coupling, for example, through in vivo evaluation of SV2A to elucidate the underlying neurobiological mechanisms of reported maternal and fetal regional brain volume changes during pregnancy.34,35 Accurate PET quantification will require dedicated motion correction method. In the present work, rigid registration was used as a proof-of-concept to demonstrate feasibility, while more advanced motion correction approaches will be developed in future studies. In addition to brain regions, the spinal cord represents particularly interesting target, especially once nonlinear motion correction methods are established, as the structure are of high interest for SV2A PET studies.42,43
In conclusion, the NX is highly effective for detailed SV2A PET imaging in maternal and fetal brains. The enhanced spatial resolution and sensitivity offered by NX significantly improve the SV2A measurement, providing valuable insights into brain development.
Supplemental Material
sj-docx-1-jcb-10.1177_0271678X261429044 – Supplemental material for High-resolution in utero SV2A PET imaging of the nonhuman primate brain using the NeuroEXPLORER
Supplemental material, sj-docx-1-jcb-10.1177_0271678X261429044 for High-resolution in utero SV2A PET imaging of the nonhuman primate brain using the NeuroEXPLORER by Saloni Mehta, Huili Sun, Nicola Micali, Daniel Holden, Krista Fowles, Samantha Rossano, Jiazhen Zhang, Chao Ma, Paul Han, Wonil Lee, Alvaro Duque, Pasko Rakic, Stephanie M Groman, Richard E Carson, Dustin Scheinost and Takuya Toyonaga in Journal of Cerebral Blood Flow & Metabolism
Footnotes
Acknowledgements
We gratefully acknowledge dedicated support from Yale Animal Resource Center. We also deeply thank all the faculty and staff of the Yale PET Center and MR Research Center, who have provided insight and assistance to this work.
Author contributions
SM and HS contributed equally to this work. They performed data analysis, generated figures, and contributed to manuscript writing. NM, SR, AD, PR, and SMG coordinated the collaboration with the Rakic laboratory and contributed to experimental design. DH, KF, JZ, CM, PH, and WL conducted imaging experiments, performed image reconstruction, and assisted in establishing the data analysis pipeline. DS and REC provided scientific oversight, guidance on study design and data interpretation, and critically revised the manuscript for important intellectual content. TT designed and supervised the study, coordinated the data analysis pipeline, and finalized the manuscript.
Funding
The authors disclosed receipt of the following financial support for the research, authorship, and/or publication of this article: This study was supported in part by NIDA Merit Award DA023999 (to PR), NIMH R21MH120615 (to SMG and DS), NIBIB U01EB029811 (to REC), and the Yale Center for the Science of Cannabis and Cannabinoids (to NM).
Declaration of conflicting interests
The authors declared no potential conflicts of interest with respect to the research, authorship, and/or publication of this article.
Ethical considerations
All procedures done in this study were carried out under approved animal protocols by the Yale University Animal Care and Use Committee (IACUC) and in strict accordance with the guidelines set forth in the Animal Welfare Act and the Guide for the Care and Use of Laboratory Animals.
Consent to participate
Not applicable.
Consent for publication
Not applicable.
ORCID iDs
Supplemental material
Supplemental material for this article is available online.