
Abstract
In hypertension-associated arteriolosclerosis cerebral small vessel disease (CSVD), various studies have shown that MRI-detected lesions—such as lacunes, white matter hyperintensities, enlarged perivascular spaces, and cerebral microbleeds—are more prevalent in deep brain regions (DBR) than in the cortex. However, the underlying mechanisms remain poorly understood. We propose that differential vascular remodeling between DBR small vessels and superficial cortical branches contributes to this heterogeneity. Using a stroke-prone renovascular hypertensive rat (RHRsp) model, we observed pronounced changes in vessel density, diameter, extracellular matrix deposition, and smooth muscle cell alterations in DBR small arteries compared to that of the cortex. These findings were further confirmed in human brain tissue of our study. Additionally, our mathematical modeling indicated greater hemodynamic alterations in DBR vessels, with increased shear and circumferential stress under hypertension conditions. Overall, our study highlights more severe vascular remodeling and hemodynamic changes in the deep brain regions, where CSVD-associated MRI lesions are frequently detected.
Keywords
Introduction
Cerebral small vessel disease (CSVD) refers to a group of pathological processes with various etiologies that affect the small arteries, arterioles, venules, and capillaries of the brain.1 –3 The most common type of CSVD is arteriolosclerosis CSVD, with aging and hypertension as major risk factors. Since aging is inevitable, blood pressure management becomes a key point in treating CSVD. Vascular remodeling in hypertension-associated arteriolosclerosis CSVD is characterized by wall thickening of small arteries and arterioles with excessive extracellular matrix (ECM) deposition and progressive loss of smooth muscle cells. 4 However, vascular remodeling in arteriolosclerosis CSVD is hard to detect directly by current clinical neuroimaging techniques because of the small vessel diameter. 5 Instead, brain parenchymal magnetic resonance imaging (MRI) lesions, believed to result from vascular pathology, serve as markers for assessing CSVD progression. 6 These MRI markers include lacunes, white matter hyperintensities (WMH), enlarged perivascular spaces (EPVS), and cerebral microbleeds (CMB). Various research showed that Lacunes, CMB, and EPVS in hypertension-associated arteriolosclerosis CSVD are more commonly found in deep brain regions (DBR), such as the basal ganglia, thalamus, and brainstem, compared to the cortex. Specifically, a high degree of EPVS in the basal ganglia is more prevalent among patients with hypertension-associated CSVD, while EPVS in the centrum semiovale is more frequently observed in Cerebral amyloid angiopathy (CAA).7,8 Lacunar infarcts are found mostly in basal ganglia, internal capsule, thalami, and pons—regions supplied by deep branches.9,10 CMB in hypertension-associated CSVD typically occurs in the basal ganglia, thalamus, and pons, whereas cortical CMB is more characteristic of patients with CAA.10,11 However, the mechanisms underlying this heterogeneous distribution of lesion sites remain poorly understood.
Anatomically, the cortex and deep brain regions have different vascular origins. Overall, cerebral small arteries and arterioles have two origins:3,6 (a) superficial branches: they stem from the subarachnoid circulation penetrating the brain cortex superficially, supplying the cortical matter with short branches and the subcortical white matter with longer branches; or (b) deep branches: they stem from deep arterial perforators at the base of the brain and supplying the DBR such as basal ganglia, thalamus, and brainstem. In this study, the term DBR refers specifically to the striatum and thalamus, excluding the internal capsule. This anatomical difference may also imply hemodynamic differences, especially under pathological conditions. The vessel wall is constantly exposed to hemodynamic stimulations, including circumferential stress, shear stress, etc., that come from the blood flow and pulsation. 12 This biomechanical environment is critical for maintaining normal vessel wall structure integrity. 13 However, this mechanical environment changes a lot under hypertension. Due to a lack of in vivo techniques for assessing hemodynamic changes in cerebral small arteries in both humans and animals, mathematical models t has emerged as an alternative. Using a CCO model, Blanco et al calculated that blood pressure is lower in cortical vessels than in deep brain branches, with this pressure gradient persisting in their respective arteriolar beds and further increasing under hypertensive conditions. 14 This exciting finding suggests that cerebral small arteries and arterioles from superficial versus deep branches are exposed in distinct hemodynamic environments, potentially explaining their differing susceptibilities in CSVD. 15 Hence, we speculate that cerebral small vessels in DBR undergo more severe vascular remodeling than superficial cortical branches in CSVD, and the possible reason for this phenomenon is that vessels in DBR are likely subjected to greater hemodynamic stress under hypertension due to its anatomical characteristics.
In this study, we adopted a renal hypertensive animal model– stroke-prone renovascular hypertensive rat (RHRsp) as the animal model of hypertension-associated arteriolosclerosis CSVD. The RHRsp model is established by a two-kidney, two-clip(2k2c) procedure, 16 which induces persistent hypertension and leads to significant cerebral small artery remodeling with fibrinoid necrosis, hyalinosis, and apparent luminal narrowing. 17 Following the 2k2c procedure, the incidence of hypertension in rats reaches 100%, with a stroke incidence of 61.8% within 40 weeks post-surgery. 17
With this background, our study aimed to directly compare the difference of cerebral small vessel pathology between the cortex and DBR in the RHRsp model and in human tissue samples. Additionally, we calculated hemodynamic differences between these vascular branches using the CCO model to better understand the role of hemodynamic stress in CSVD progression.
Material and methods
The authors declare that the data are available upon reasonable request.
Animals and treatment
The experimental protocol was approved by the Fudan University Experimental Animal Science Department Animal Welfare and Ethics Review Board (NO.2022JS Huashan Hospital −286). All experiments adhered to the Guide for the Care and Use of Laboratory Animals and complied with the ARRIVE guidelines 2.0 to ensure transparent and reproducible reporting of animal experiments. 18 One-month-old Sprague-Dawley rats weighting 80–100 g were randomly subjected to either a 2k2c procedure to establish the RHRsp model or sham surgery. 2k2c procedure was performed according to the previous paper. 16 To eliminate potential hormonal influences on blood pressure, only male rats were used in this experiment. In order to expose the renal arteries, a median longitudinal incision was made on the abdominal skin of the rats under deeply anesthetized with sodium pentobarbital. Then both renal arteries of rats were placed with ring-shaped silver clips (provided by the Laboratory of Neurology, The First Affiliated Hospital of Sun Yat-sen University, China). Rats in the control group underwent the same procedures but without clipping.
Blood pressure (BP) monitoring
Tail-cuff method (BP-98A; Softron Co, Tokyo, Japan) was used to measure BP changes of the animals. A day before BP measurement, animals were induced into a holding cage for 15 min to help them adapt to the environment. On the day of measurement, rats were induced into the holding cage, with its tail being properly placed into the pressurized sensor sleeve. BP was measured only after the animals were calmed in the holding cage. The measurement was repeated three times at intervals greater than 5 min, and the average of each animal was taken. BP measurements were performed two months, four months and six months after the 2k2c procedure or sham operation.
Evaluation of cognitive function
The Morris water maze test was conducted 16 weeks after the 2k2c operation to evaluate the cognitive function of the animals. The test was performed in a circular water pool, which was divided into four quadrants with four start positions. A transparent platform was hidden 1 cm below the surface of the water in one of the quadrants. Platform acquisition test was performed four times per day from day 1 to day 5. The rats were released into the water at the four positions sequentially on each day and allowed to swim to search for the platform within 60 s. The time spent by the rat to find the hidden platform was recorded as the escape latency time. The platform was removed on day 6. The rats were allowed to swim for 60 s. The number of times crossing the former platform location and the time spent in the former platform quadrant of the rats in 60 s were recorded. All procedures were monitored using a video tracking system (EthoVision10.0, Noldus Information Technology Co., Ltd. Beijing).
Ex vivo micro computed tomography (CT) imaging
The rats were first transcardially perfused with heparinized PBS and followed by 4% paraformaldehyde (PFA). The working Microfil (Flow Tech Inc., Carver, MA) solution was prepared by mixing 5 parts of Microfil MV‐122, 4 parts of diluent, and 0.5 parts of catalyst. Additionally, 30%(w/v) Pb3O4 were added in order to increase the CT number of the compound. Freshly prepared Microfil solution was loaded into a 20 ml syringe and perfused by a pump with a speed of 150 ml/h for 6 min. Microfil solution was perfused at the same speed in all the animals so that the perfusion pressure was identical in all animals. At the end of Microfil infusion, the vena cava was sealed by ligation. Intact rat and infusion cannula with syringe was placed on ice to allow for complete curing of the polymer. The brain was then removed, post-fixed with 4% PFA for 24 h, and then stored at 4°C before scanning. Micro CT images of the brains were obtained using the SkyScan 1272 (Bruker MicroCT, Kontich, Belgium). The Scans were performed with the following parameters: source voltage and current (55 kV and 160 uA), Filter = Al 0.5 mm, Image Pixel Size (um) = 9.9, the distance of X‐ray to the camera was set to 176.89 mm, the distance of X‐ray to object was set to 98.275 mm. Acquired images were reconstructed by NRecon Reconstruction software (Bruker MicroCT, Kontich, Belgium) and then rendered into 3D images in CTvox volume rendering software (Bruker MicroCT, Kontich, Belgium). Image analysis was performed by CT Analyser1.17.7.2 (Bruker MicroCT, Kontich, Belgium). Tissue volume and vessel volume were quantified by Morphometric analysis in 3D within Skyscan CT-analyser. The total number of small vessels per different classes of lumen size (10–122 um) was quantified by Morphometric analysis in 2D within Skyscan CT-analyser.
Animal brain tissue preparation
The rats were sacrificed between 4–5 months after surgery and were transcardially perfused with approximately 300 mL of 0.9% saline, followed by 200 mL of 4% PFA in 0.1 M phosphate-buffered saline (PBS, pH 7.4) within 5 min under deep anesthetized with sodium pentobarbital. The brains were then collected and sagittally cut into halves from the midline. One hemisphere was post-fixed in 4% PFA for 24 h and then embedded in paraffin as routine protocol before being sectioned (4 μm thickness) on a microtome for Hematoxylin & Eosin (HE) staining. The other hemisphere was post-fixed in 4% PFA for 4–6 h and stored in 30% sucrose in 0.1 M PBS (pH 7.4) until the brain tissues fell to the bottom of the solution. The brain tissues were sectioned as serial slices (10 μm thickness) using a cryostat.
Human sample preparation
The human research institutional review board of Huashan Hospital approved the study protocol (2023-306). All methods were carried out ethically in accordance with the World Medical Association Declaration of Helsinki. An informed written consent was obtained from all patients prior to enrollment. 11 individuals were enrolled (details showed in supplementary methods). One patient was excluded due to inadequate sample for staining. All the individuals were diagnosed with primary hypertension. Human brain tissue was obtained from patients with intracerebral hemorrhage requiring surgical treatment. Fresh human brain tissue specimens (n = 20, from 10 individuals) were obtained from the planned surgical route (10 cortical grey matter samples, and 10 basal ganglia samples around the hematoma). White matter lesions (WMLs) is defined as diffuse, confluent white matter abnormality (low density on CT, lesions on CT were defined as hypodense area of ≥5 mm). The severity of WMLs in both the centrum semiovale and periventricular regions was rated as previously described. 19 Then, the severity ratings of the two areas were summed. Tissues were then immersed into 4% PFA for fixation for 24 h. After fixation, tissues were transferred into 30% sucrose in 0.1 M PBS (pH 7.4) at 4°C until the tissues fell to the bottom of the solution. The brain tissues were sectioned as serial slices (10 μm thickness) using a cryostat.
Immunofluorescence
Primary antibody against smooth muscle actin alpha (Invitrogen ma5-11547), Iba-1 (Proteintech,10904-1-AP), GFAP (Sigma, G3893), CD206 (Proteintech, 18704-1-AP), collagen I (Abcam, ab90395), collagen IV (Abcam, ab6586), fibronectin (Abcam, ab23750), and laminin (Abcam, ab11575) were used. The cryostat sections were treated with 0.25% Triton X-100 at room temperature (RT, 22–25°C) for 10 min. After washing three times with PBS, the sections were blocked with 1% bovine serum albumin for 1 h at RT. The sections were then incubated with primary antibodies overnight at 4°C. The slides were then washed three times with 0.01 M PBS and incubated with secondary antibodies (Invitrogen Carlsbad, CA, USA) for 1 h at RT. Following an additional three washes in 0.01 M PBS, the slides were counterstained with DAPI. Finally, the sections were sealed with the anti-fade reagent. The staining of the same marker in samples from different groups was completed in the same batch of staining so that the staining efficiency was identical among different samples. All slides were photographed using the same Fluorescence microscope (Olympus, BX-51, Tokyo, Japan). The imaging settings were kept consistent for each marker across samples, including the following excitation and emission filter settings: Green fluorescence (e.g., αSMA, CD206): excitation 470–490 nm, emission filter 515–550 nm. Red fluorescence (e.g., GFAP, collagen IV): excitation 530–550 nm, emission filter 590–800 nm. DAPI: excitation 405 nm, emission filter 460/50 (passes wavelengths 435–485 nm). Cerebral small arteries (10–65 μm) were indicated by the immunostaining of αSMA(supplementary Figure 3). Only cerebral small arteries in the cortex, basal ganglia and thalamus were included into quantification. Image analysis was performed using Image J software. Blinding was performed during imaging and analysis.
Mathematical model and simulation method
The constrained constructive optimisation (CCO) method was used to generate arteriolar bed. The posterior parietal artery (branch of the middle cerebral artery), and the lenticular artery (branch of striatal artery) with their corresponding arterioles beds were used to represent arteriolar beds from the cortex and the deep brain regions, respectively, according to Blanco, etc.. 14 Parameters for controlling the perfusion domains at these two arterioles beds were list in supplementary methods. When the average diameter of the terminal vessels in the two models is less than 20 um, the model generation process ends. Linearized one-dimensional model of blood was used as the numerical simulation method in this study as shown in previous paper. 20 The blood flow pattern inside the vascular tree can be obtained using the transmission line-based theory. This method transforms the one-dimensional pipe flow problem from time domain into the frequency domain for accelerating. We calculate the wall shear stress (WSS) based on the Poiseuille’s theorem for simplicity. The modeling parameters of CCO vascular tree under normotensive or hypertensive scenario were presented in supplementary methods. Model sensitivity analysis was also performed (details in supplementary methods).
Statistical analysis
Prism 8.0 software was used for data analysis. All values are presented as means ± SD (standard deviation, SD). Differences within groups were assessed using t-test or ANOVA accordingly. Statistical significance was set at p < 0.05.
Results
More dramatic changes of vessel density and vessel diameter in cerebral small arteries of DBR
To evaluate the morphology changes of cerebral small vessels, we used RHRsp as a CSVD animal model. Two months after the 2k2c procedure, rats in the RHRsp group showed stable hypertension (Supplementary Figure 1). By the end of 7 months, RHRsp presented cerebral small artery remodeling with significant vessel wall thickening, luminal narrowing, and enlarged perivascular spaces, as shown by HE staining (supplementary Figure 1). Morris water maze test also showed cognitive impairment in RHRsp (supplementary Figure 1). These results suggest that RHRsp is a suitable animal model of hypertension-associated CSVD for the study of vascular pathological changes.
To first have a general overview of vascular morphological changes of the RHRsp animals, we use Micro-CT to examine the brain vasculature of the animals (Figure 1(a) and supplementary Figure 2). We found that the vascular volume per unit brain tissue volume is significantly lower in RHRsp groups (1.27% ± 0.24 vs 2.28% ± 0.33, p < 0.05), indicating a decreased vascular volume in hypertensive animals. The total number of small vessels per different classes of lumen size (10–122 um) was also counted. We found that the vessel number per unit brain tissue volume at different classes of lumen size from 10–122 um decreased in the RHRsp groups (Figure 1(b)). We also calculated the percentage change of vessel number at different classes of lumen size separately in DBR and cortex. Results showed a more pronounced loss of small vessels in the DBR (Figure 1(c)). For the evaluation of diameter change, we calculated vessel numbers from different classes of lumen size as a percentage of the total vessel number. The percentage composition was different between SD and RHRsp (Figure 1(d) and (e)). Compared with SD animals, RHRsp animals had a lower percentage of vessels with lumens larger than 34 µm, indicating a shift toward smaller vessel diameters. For vessels smaller than 34 µm, there was also a reduction in percentage in the RHRsp group. We believe this was the combined consequence of luminal narrowing and vascular rarefaction occurring in RHRsp. Again, this phenomenon seemed more significant in the DBR (Figure 1(f)).
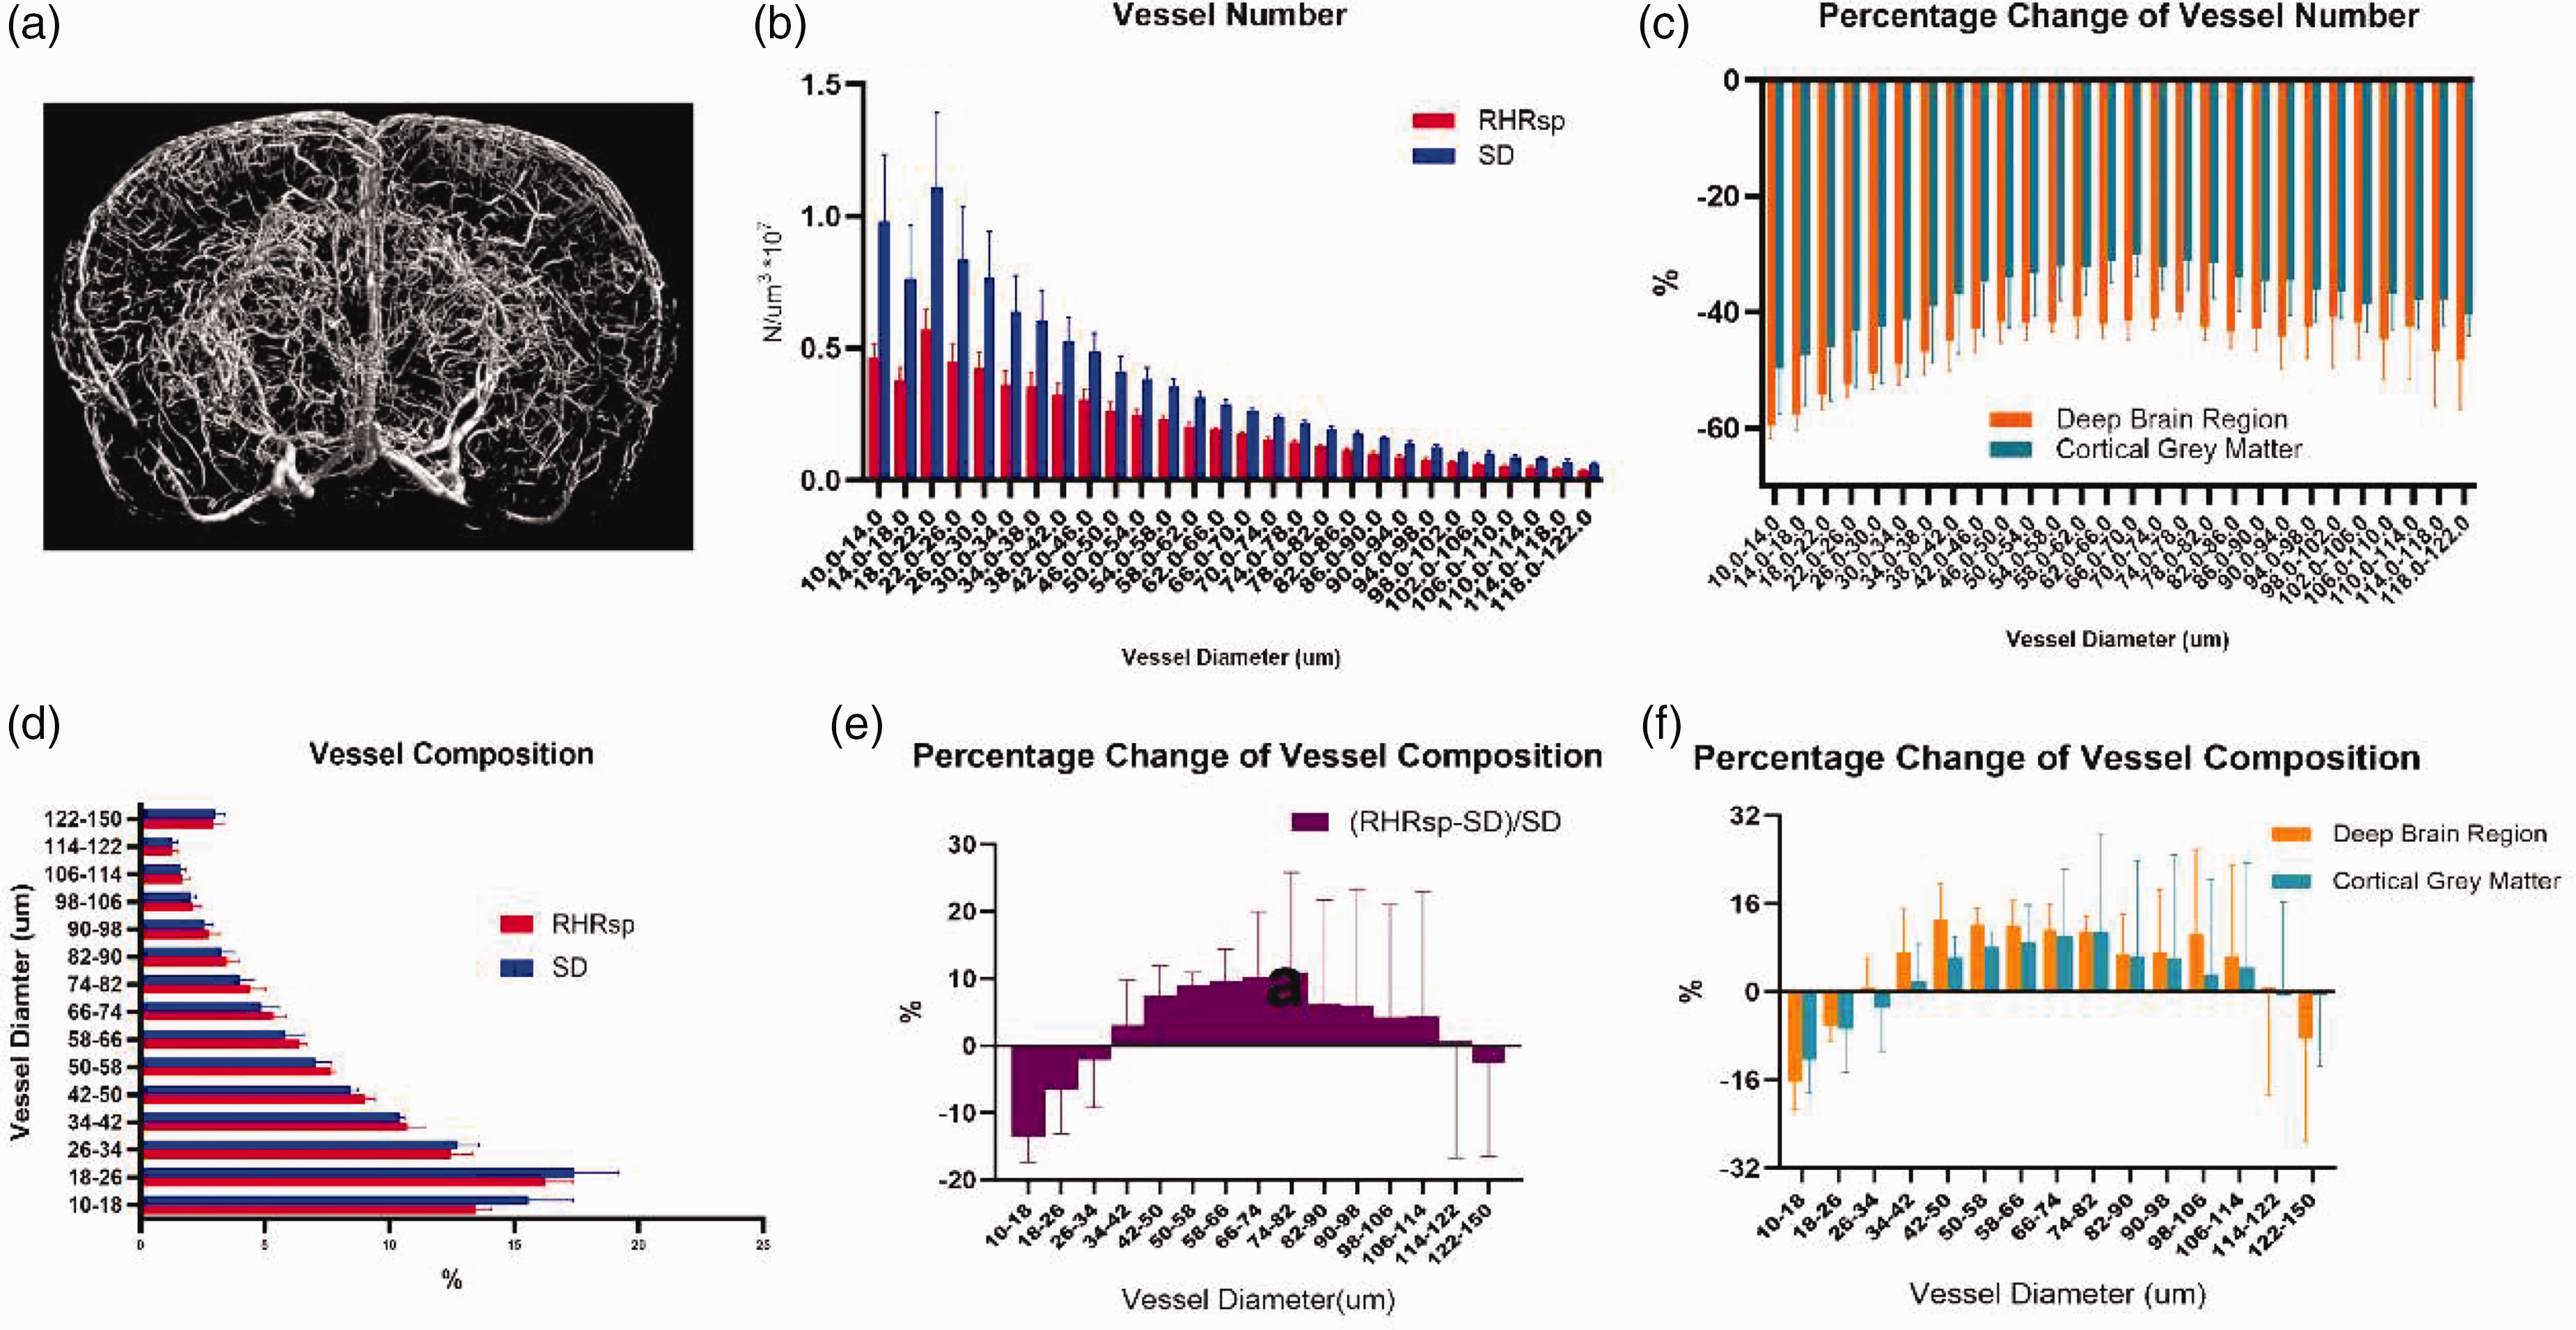
Changes of vessel density and vessel diameter of cerebral small vessels. (a) Representative 3D reconstruction of brain vascular system by Micro-CT; (b) quantification of the total number of small vessels per different classes of lumen size; (c) quantification of the percentage change of vessel number at different classes of lumen size separately in deep brain regions and the cortex and (d–f) quantification of vessel composition changes. (n = 3,3)
More severe ECM deposition in cerebral small arteries of DBR
Micro-CT cannot distinguish between arteries and veins. To specifically examine vascular remodeling in cerebral small arteries, we then used immunofluorescence to quantify ECM expression (including fibronectin, laminin, collagen I, and collagen IV) in the cerebral small arteries of the animals. Cerebral small arteries were identified by αSMA staining. Consistent with previous findings, RHRsp exhibited a significantly higher expression of ECM compared to SD rats with normal BP (Figure 2(a) to (d)). Further separated analysis indicated that ECM expressions in SD rats were similar in the small arteries of DBR and the cortex (Figure 2(a) to (d)). However, when it comes to RHRsp, a more substantial increase of ECM (including laminin, collagen IV, and collagen I) was found in the small arteries of DBR, leading to the result that the ECM expression in cerebral small arteries of DBR was significantly higher than that in the cortex in RHRsp (Figure 2(a) to (d)). These results suggest more severe ECM deposition in cerebral small arteries of the DBR under hypertension.
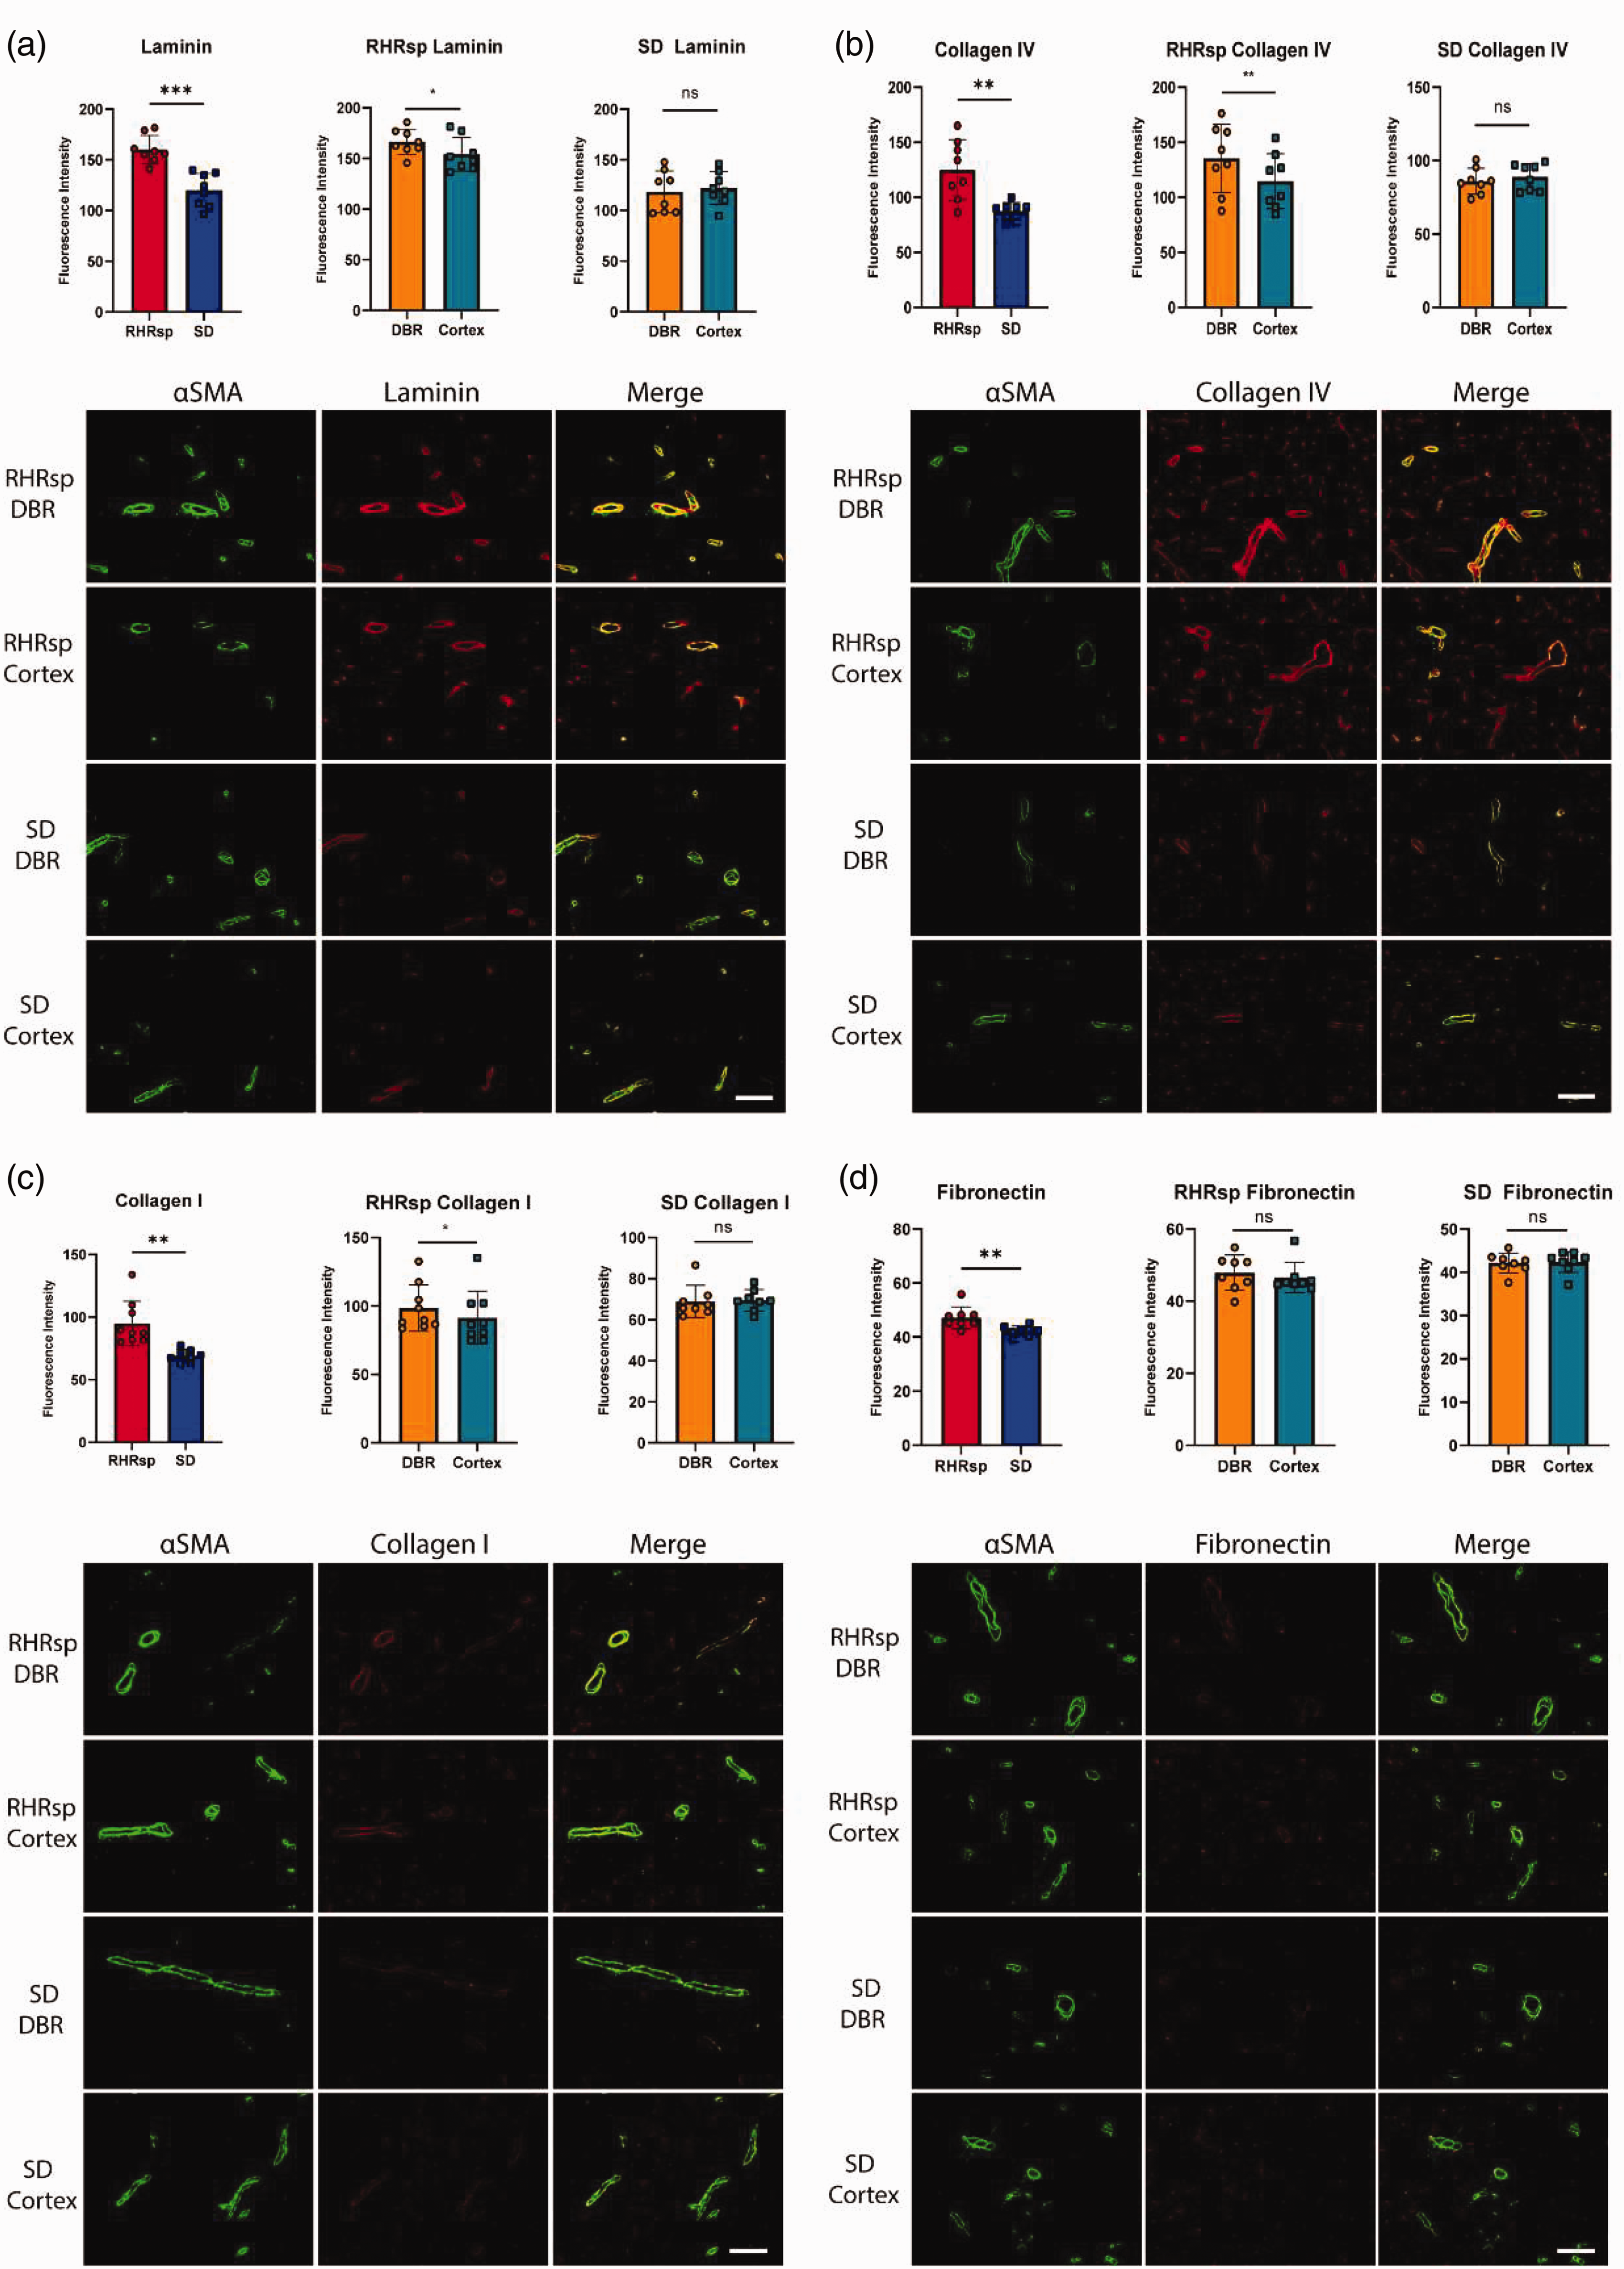
The deposition of extracellular matrix in the vessel wall of cerebral small arteries. (a) Quantification and representative immunofluorescence images of αSMA (Green) and laminin (Red) staining; (b) quantification and representative immunofluorescence images of αSMA (Green) and collagen IV (Red) staining; (c) quantification and representative immunofluorescence images of αSMA (Green) and collagen I (Red) staining and (d) quantification and representative immunofluorescence images of αSMA (Green) and fibronectin (Red) staining. The dots in the statistical graphs represent individual animals. Bar, 100 um. SD: Sprague Dawley rat; RHRsp: Stroke-prone renovascular hypertensive rat; αSMA: α-smooth muscle actin; DBR: deep brain regions. ns: not significance. *p < 0.05, **p < 0.01, ***p < 0.001.
More severe vascular smooth muscle cell changes in cerebral small arteries of DBR
Vascular smooth muscle cells (VSMCs) are important cells involved in the secretion of ECM in the vessel wall. In our study, we observed a significantly higher expression of αSMA and SM22α in the cerebral small arteries of RHRsp rats compared to SD rats (Figure 3(b) and (e)). Specifically, in the baseline condition (SD rats), the expressions of αSMA and SM22α were significantly lower in the DBR than in the cortex. Under baseline conditions (SD rats), αSMA and SM22α expression levels in the DBR were notably lower than in the cortex. However, under hypertensive conditions in RHRsp rats, the increase in αSMA and SM22α expression was more pronounced in the DBR, making expression levels in the DBR comparable to those in the cortex (Figure 3(a) and (d)). These results suggest a more substantial VSMCs change in cerebral small arteries of DBR under hypertension. We also quantified the ratio of αSMA area to the external luminal area. The ratio is significantly higher in the RHRsp group together with a more significant increase in DBR (Figure 3(c)), this indicates that media concentric thickness and luminal narrowing is more significant in the small arteries of DBR.
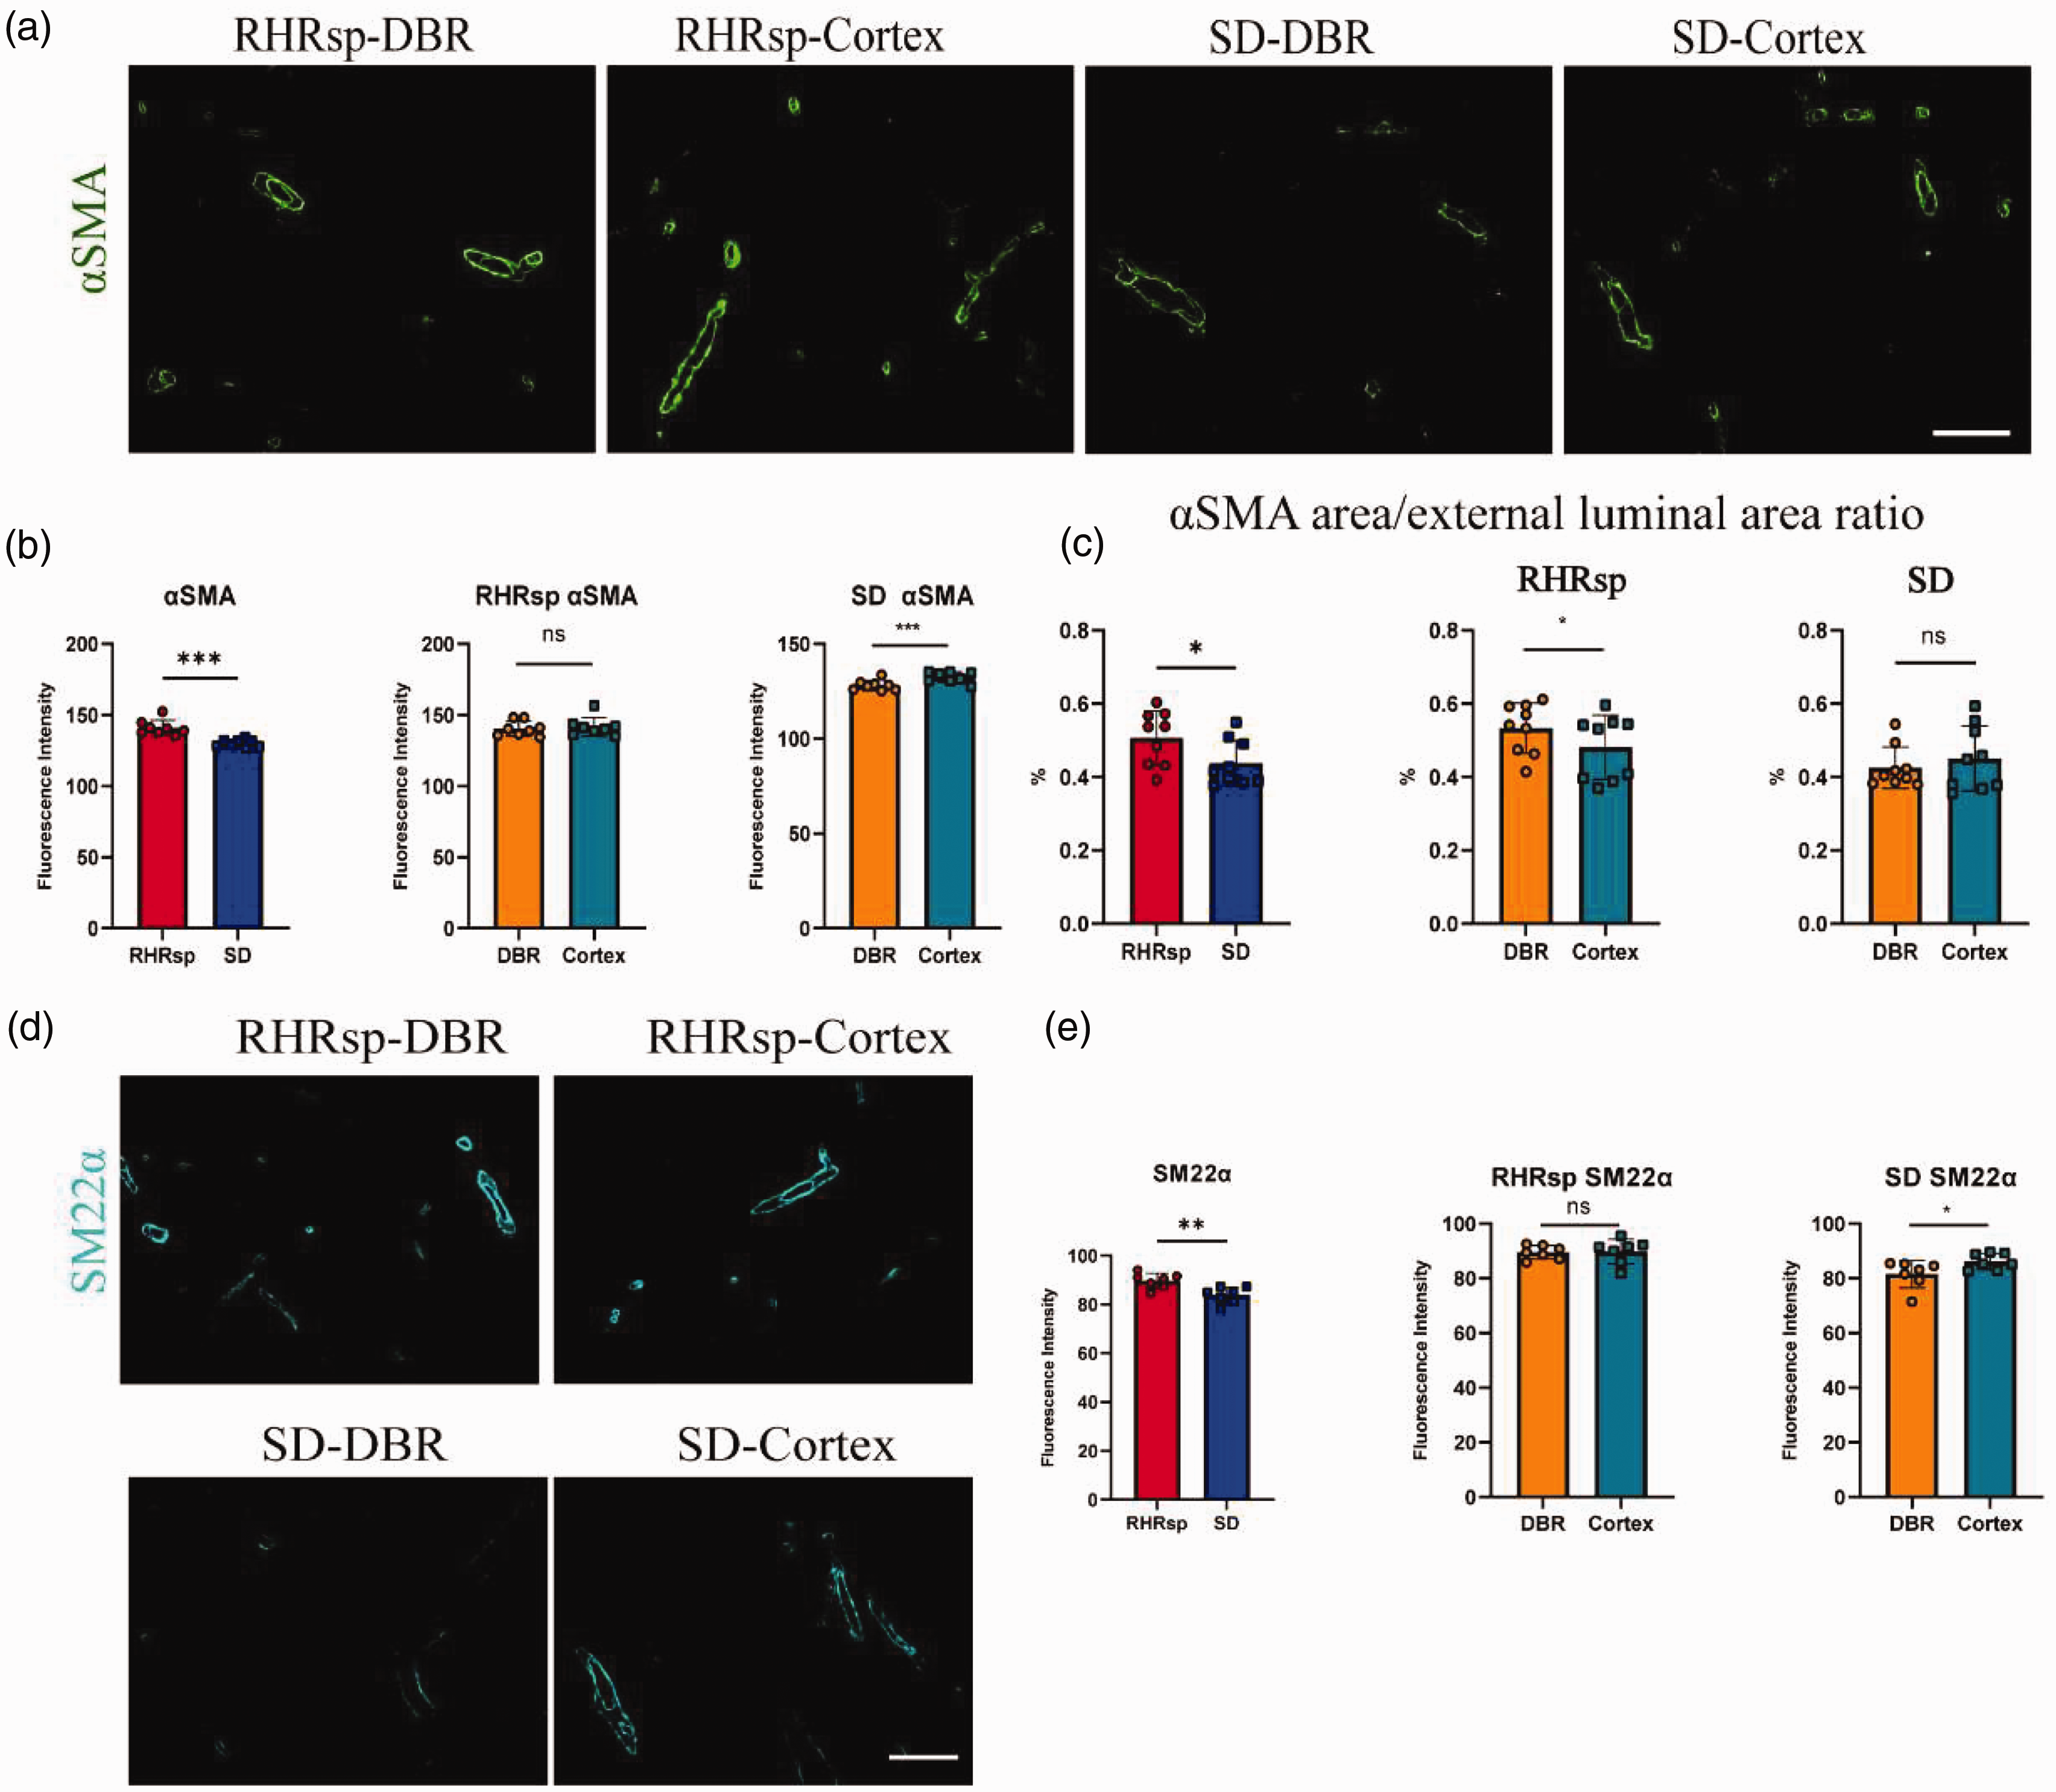
Vascular smooth muscle cell changes in cerebral small arteries. (a) Representative immunofluorescence images of αSMA staining (green) in RHRsp and SD rats, across DBR and Cortex regions. Scale bar = 100 µm; (b) quantification of αSMA fluorescence intensity in the same regions; (c) αSMA area/external luminal area ratio comparison between RHRsp and SD rats across both brain regions; (d) representative immunofluorescence images of SM22α staining in RHRsp and SD rats. Scale bar = 100 µm and (e) Quantification of SM22α fluorescence intensity in DBR and Cortex regions for both groups. SD, Sprague Dawley rat; RHRsp, Stroke-prone renovascular hypertensive rat; αSMA, α-smooth muscle actin; SM22α, smooth muscle protein 22 alpha; DBR, deep brain regions. ns, not significance. *p < 0.05, **p < 0.01, ***p < 0.001.
More severe inflammation reaction in cerebral small arteries of DBR
Vascular remodeling in hypertensive animals is often accompanied by an inflammatory response. In our study, by the end of 7 months, the cerebral small arteries of RHRsp showed significantly higher expression of CD206, GFAP, and Iba1. We quantified both Mean fluorescence intensity and %area of the markers. In SD rats, CD206 and GFAP expression in the cortex was slightly higher than in the DBR, though not statistically significant. However, in RHRsp rats, there was a markedly greater increase in CD206 and GFAP expression in the DBR, making their levels in the DBR higher than in the cortex (Figure 4(a), (b), (c) and (g)). For Iba1, the increase of Iba1 in DBR of RHRsp is also more significant than in the cortex (Figure 4(d) and (e)).
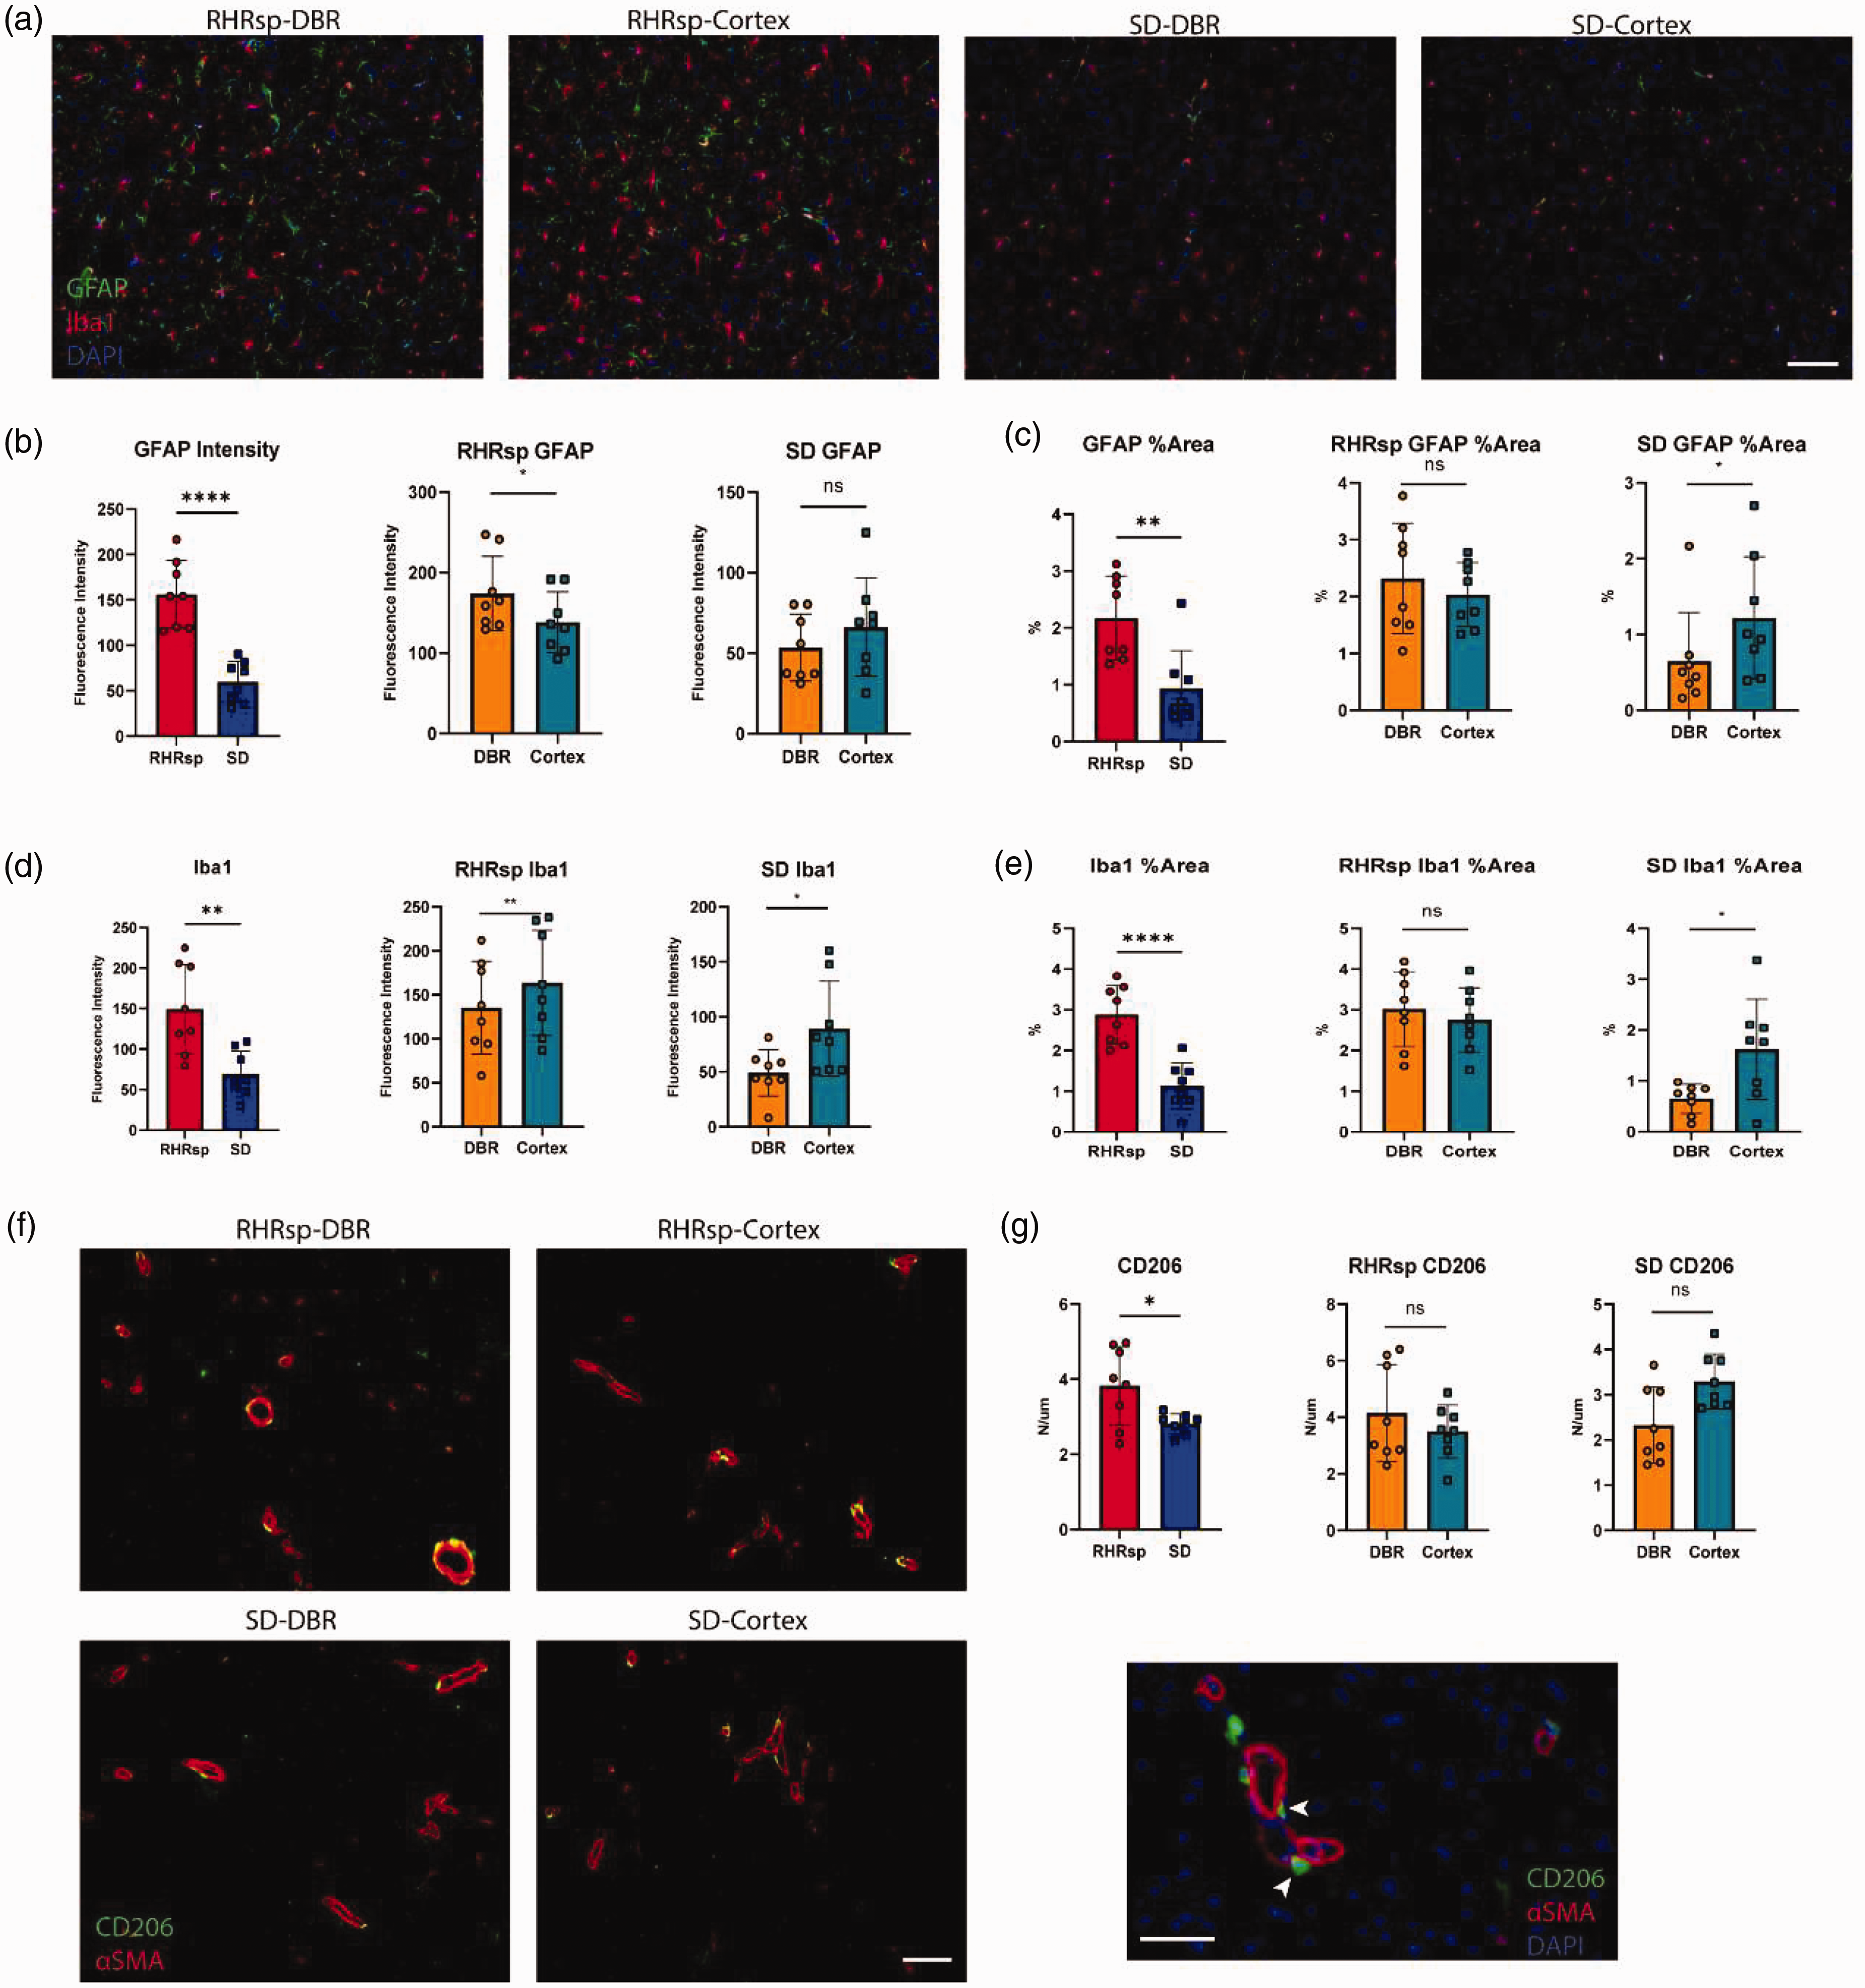
Inflammation related changes in cerebral small arteries. (a) Immunofluorescence images showing GFAP (red), Iba1 (green), and DAPI (blue) staining in the DBR and Cortex of RHRsp and SD rats. Scale bar = 100 µm. (b) Quantification of GFAP fluorescence intensity in RHRsp and SD rats. (c) GFAP %Area in DBR and Cortex regions of both rat groups. (d) Quantification of Iba1 fluorescence intensity in RHRsp and SD rats. (e) Iba1%Area in DBR and Cortex regions of RHRsp and SD rats. (f) Immunofluorescence images of CD206 (green) and αSMA (red) in cerebral arteries of RHRsp and SD rats. Scale bar = 100 µm and (g) quantification of CD206+ cells in DBR and Cortex regions of RHRsp and SD rats. SD: Sprague Dawley rat; RHRsp: Stroke-prone renovascular hypertensive rat; αSMA: α-smooth muscle actin; DBR: deep brain regions. ns: not significance. *p < 0.05, **p < 0.01, ****p < 0.0001.
More severe ECM deposition in cerebral small arteries of DGR in human samples
We then examined whether similar results could be observed in human brain tissue. Brain tissue samples from the basal ganglia and cortex were collected from patients with hypertensive cerebral hemorrhage. Patients were divided into a minor WML group (WML score 0–1) and a mild WML group (WML score 3). For each patient, collagen I and collagen IV staining were performed on both basal ganglia and cortex slices. Quantification of fluorescence intensity was restricted to small arteries indicated by αSMA staining. We calculated the ratio of fluorescence intensity in basal ganglia and the cortex. Our data showed that patients with mild WML scores had a more pronounced difference in ECM expression between the basal ganglia and cortex compared to the minor WML score group (Figure 5), suggesting that a higher WML score is associated with a greater disparity in ECM expression between these regions.
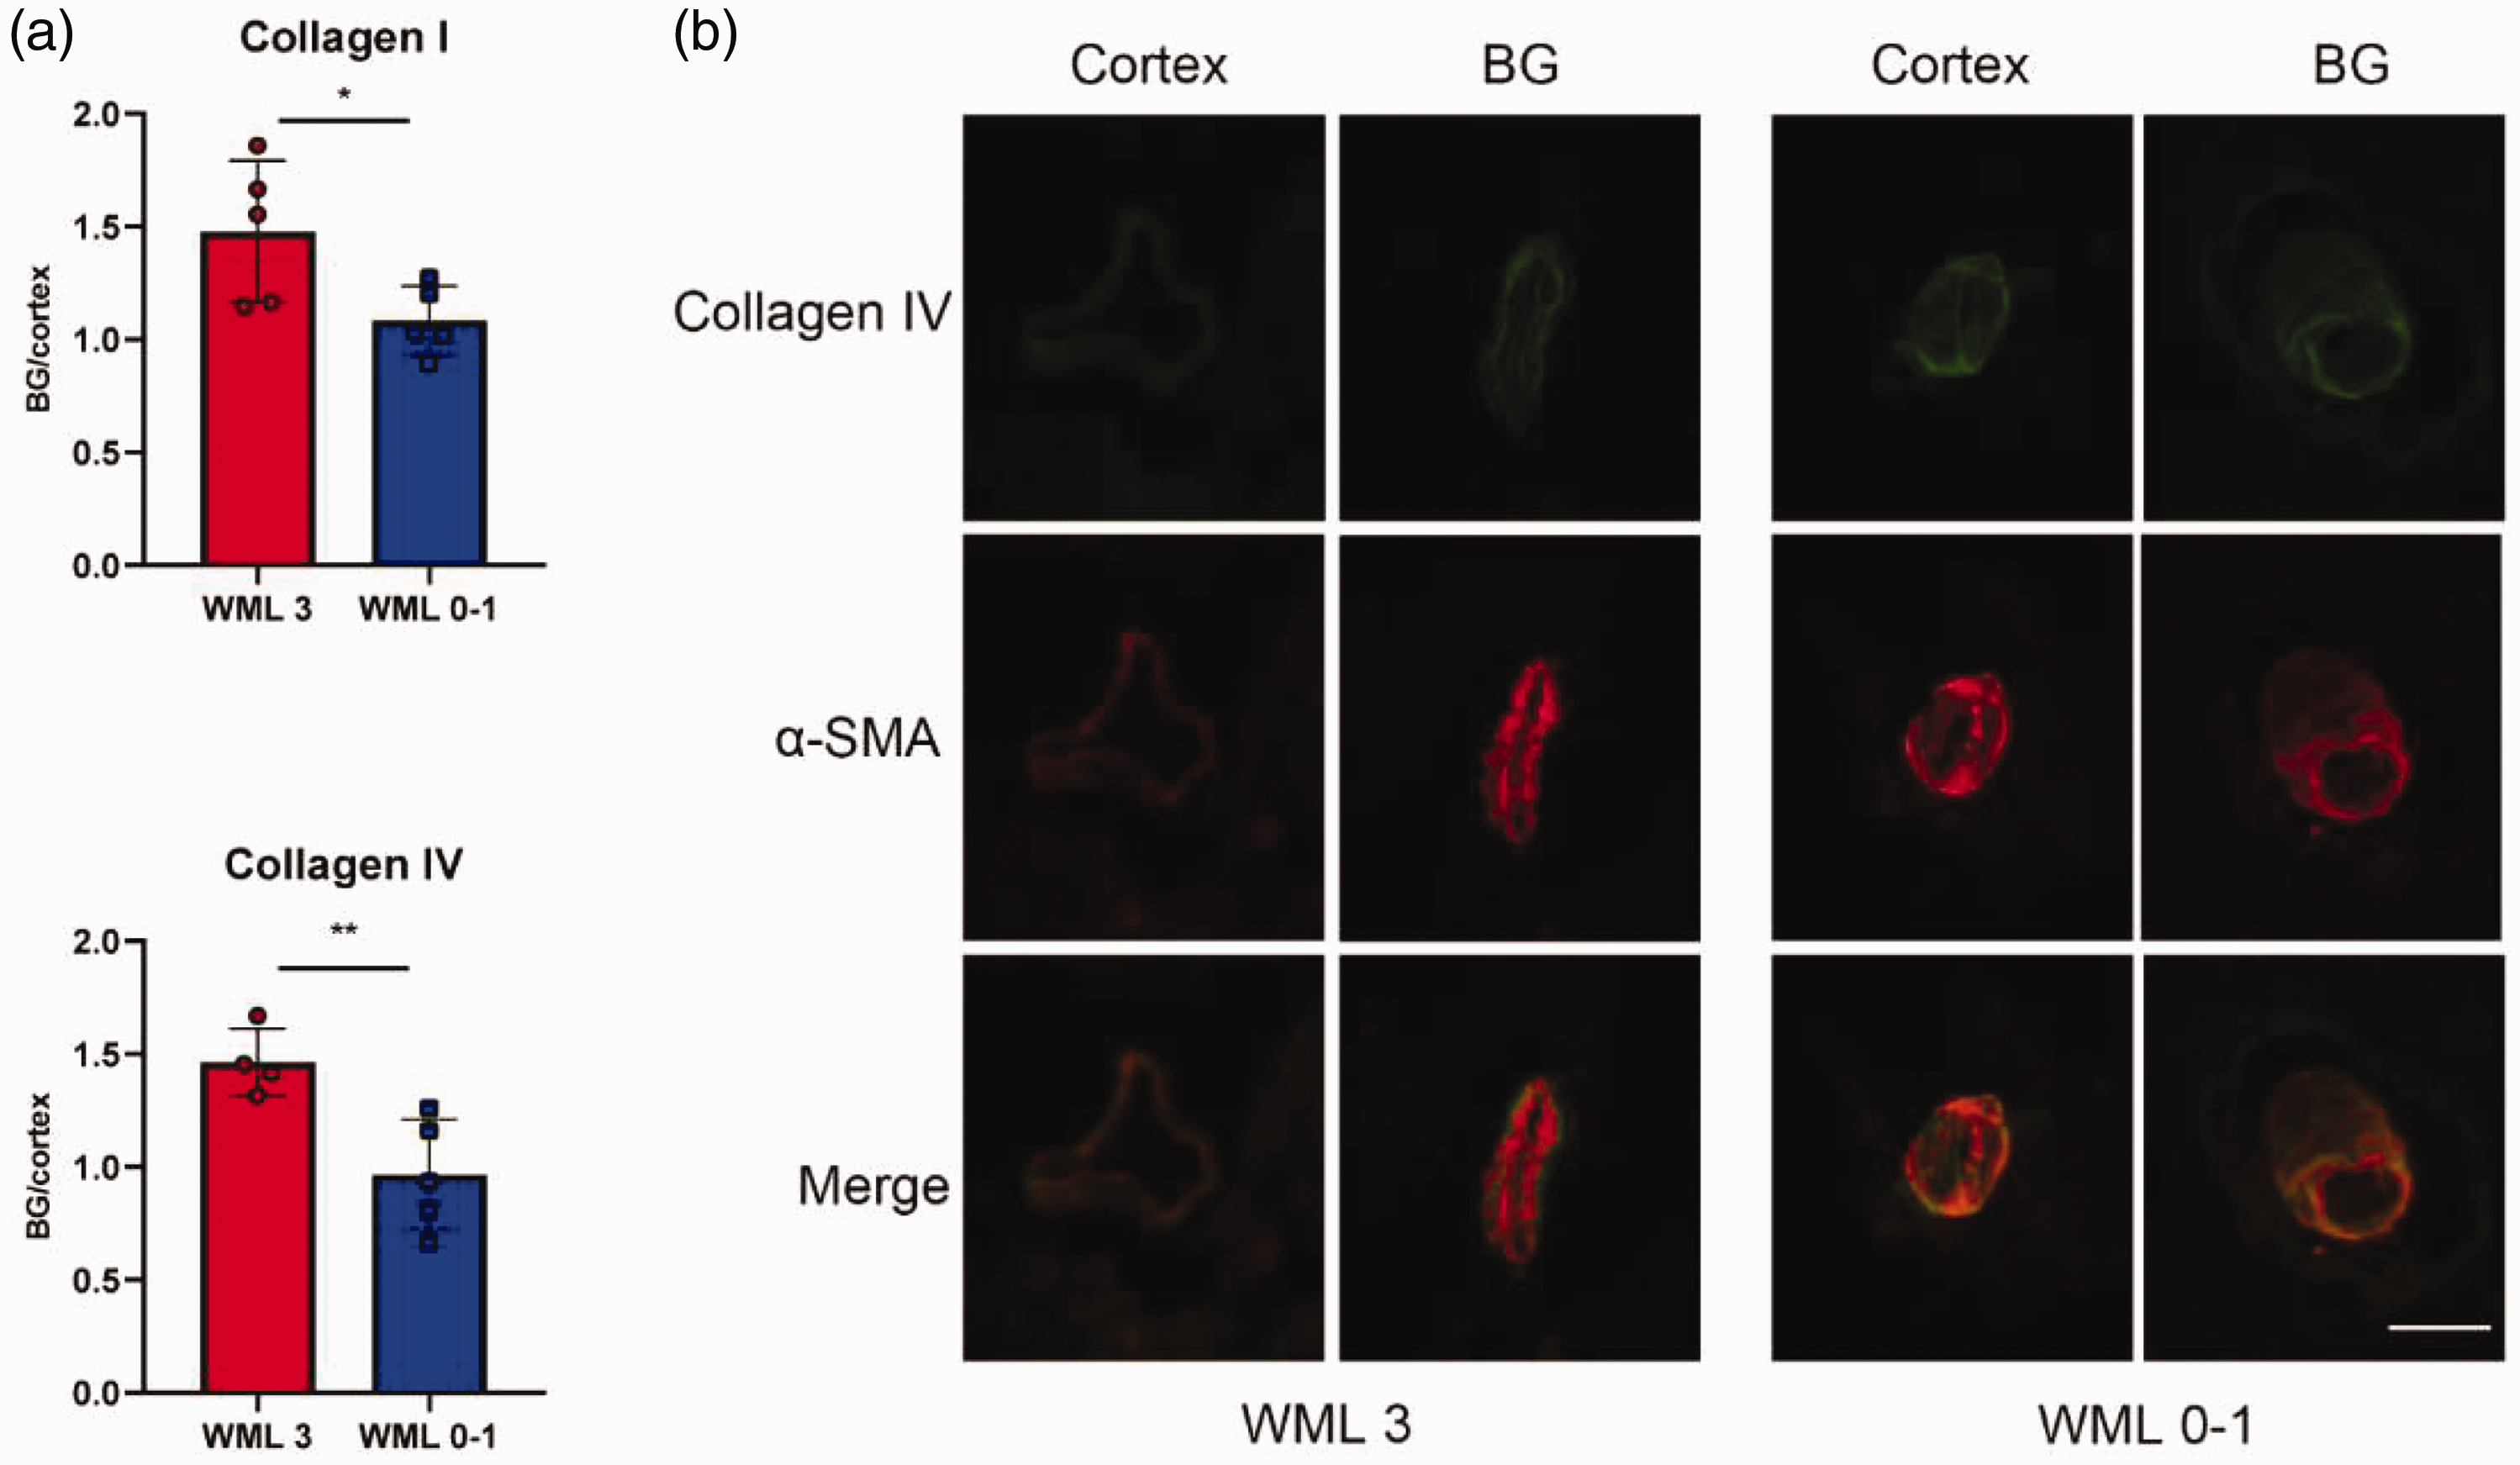
The deposition of extracellular matrix in the vessel wall of cerebral small arteries in human tissue. (a) Quantification of staining of collagen I and collagen IV in cerebral small artery and arterioles in human brain tissue; and (b) representative immunofluorescence images of αSMA and collagen IV staining in cerebral small arteries from human brain tissue. Scale bar = 25 µm. WML: white matter lesion; αSMA: α-smooth muscle actin; BG: basal ganglia. Bar, 100 um.
More pronounced hemodynamic changes in cerebral small arteries of DBR under hypertension
In this study, we adopted a modified CCO model to calculate related hemodynamic changes of the cerebral small vessels under normal and hypertension scenario. Our results show that, even under normal scenario, shear stress and circumferential stress of the cortex arteriolar bed (represented by the posterior parietal arteriolar bed) is lower than that of the DBR arteriolar bed (represented by the lenticulostriate arteriolar bed). We also found that this hemodynamic gradient between deep and superficial arteriolar beds increases in the hypertensive scenarios. In other words, a greater increase in shear stress and circumferential stress was found in the arteriolar bed of DBR compared with the arteriolar bed of the cortex under hypertension (Figure 6, supplementary table 1–2). Our results suggest that DBR arteriolar beds undergo more pronounced hemodynamic changes under hypertension.
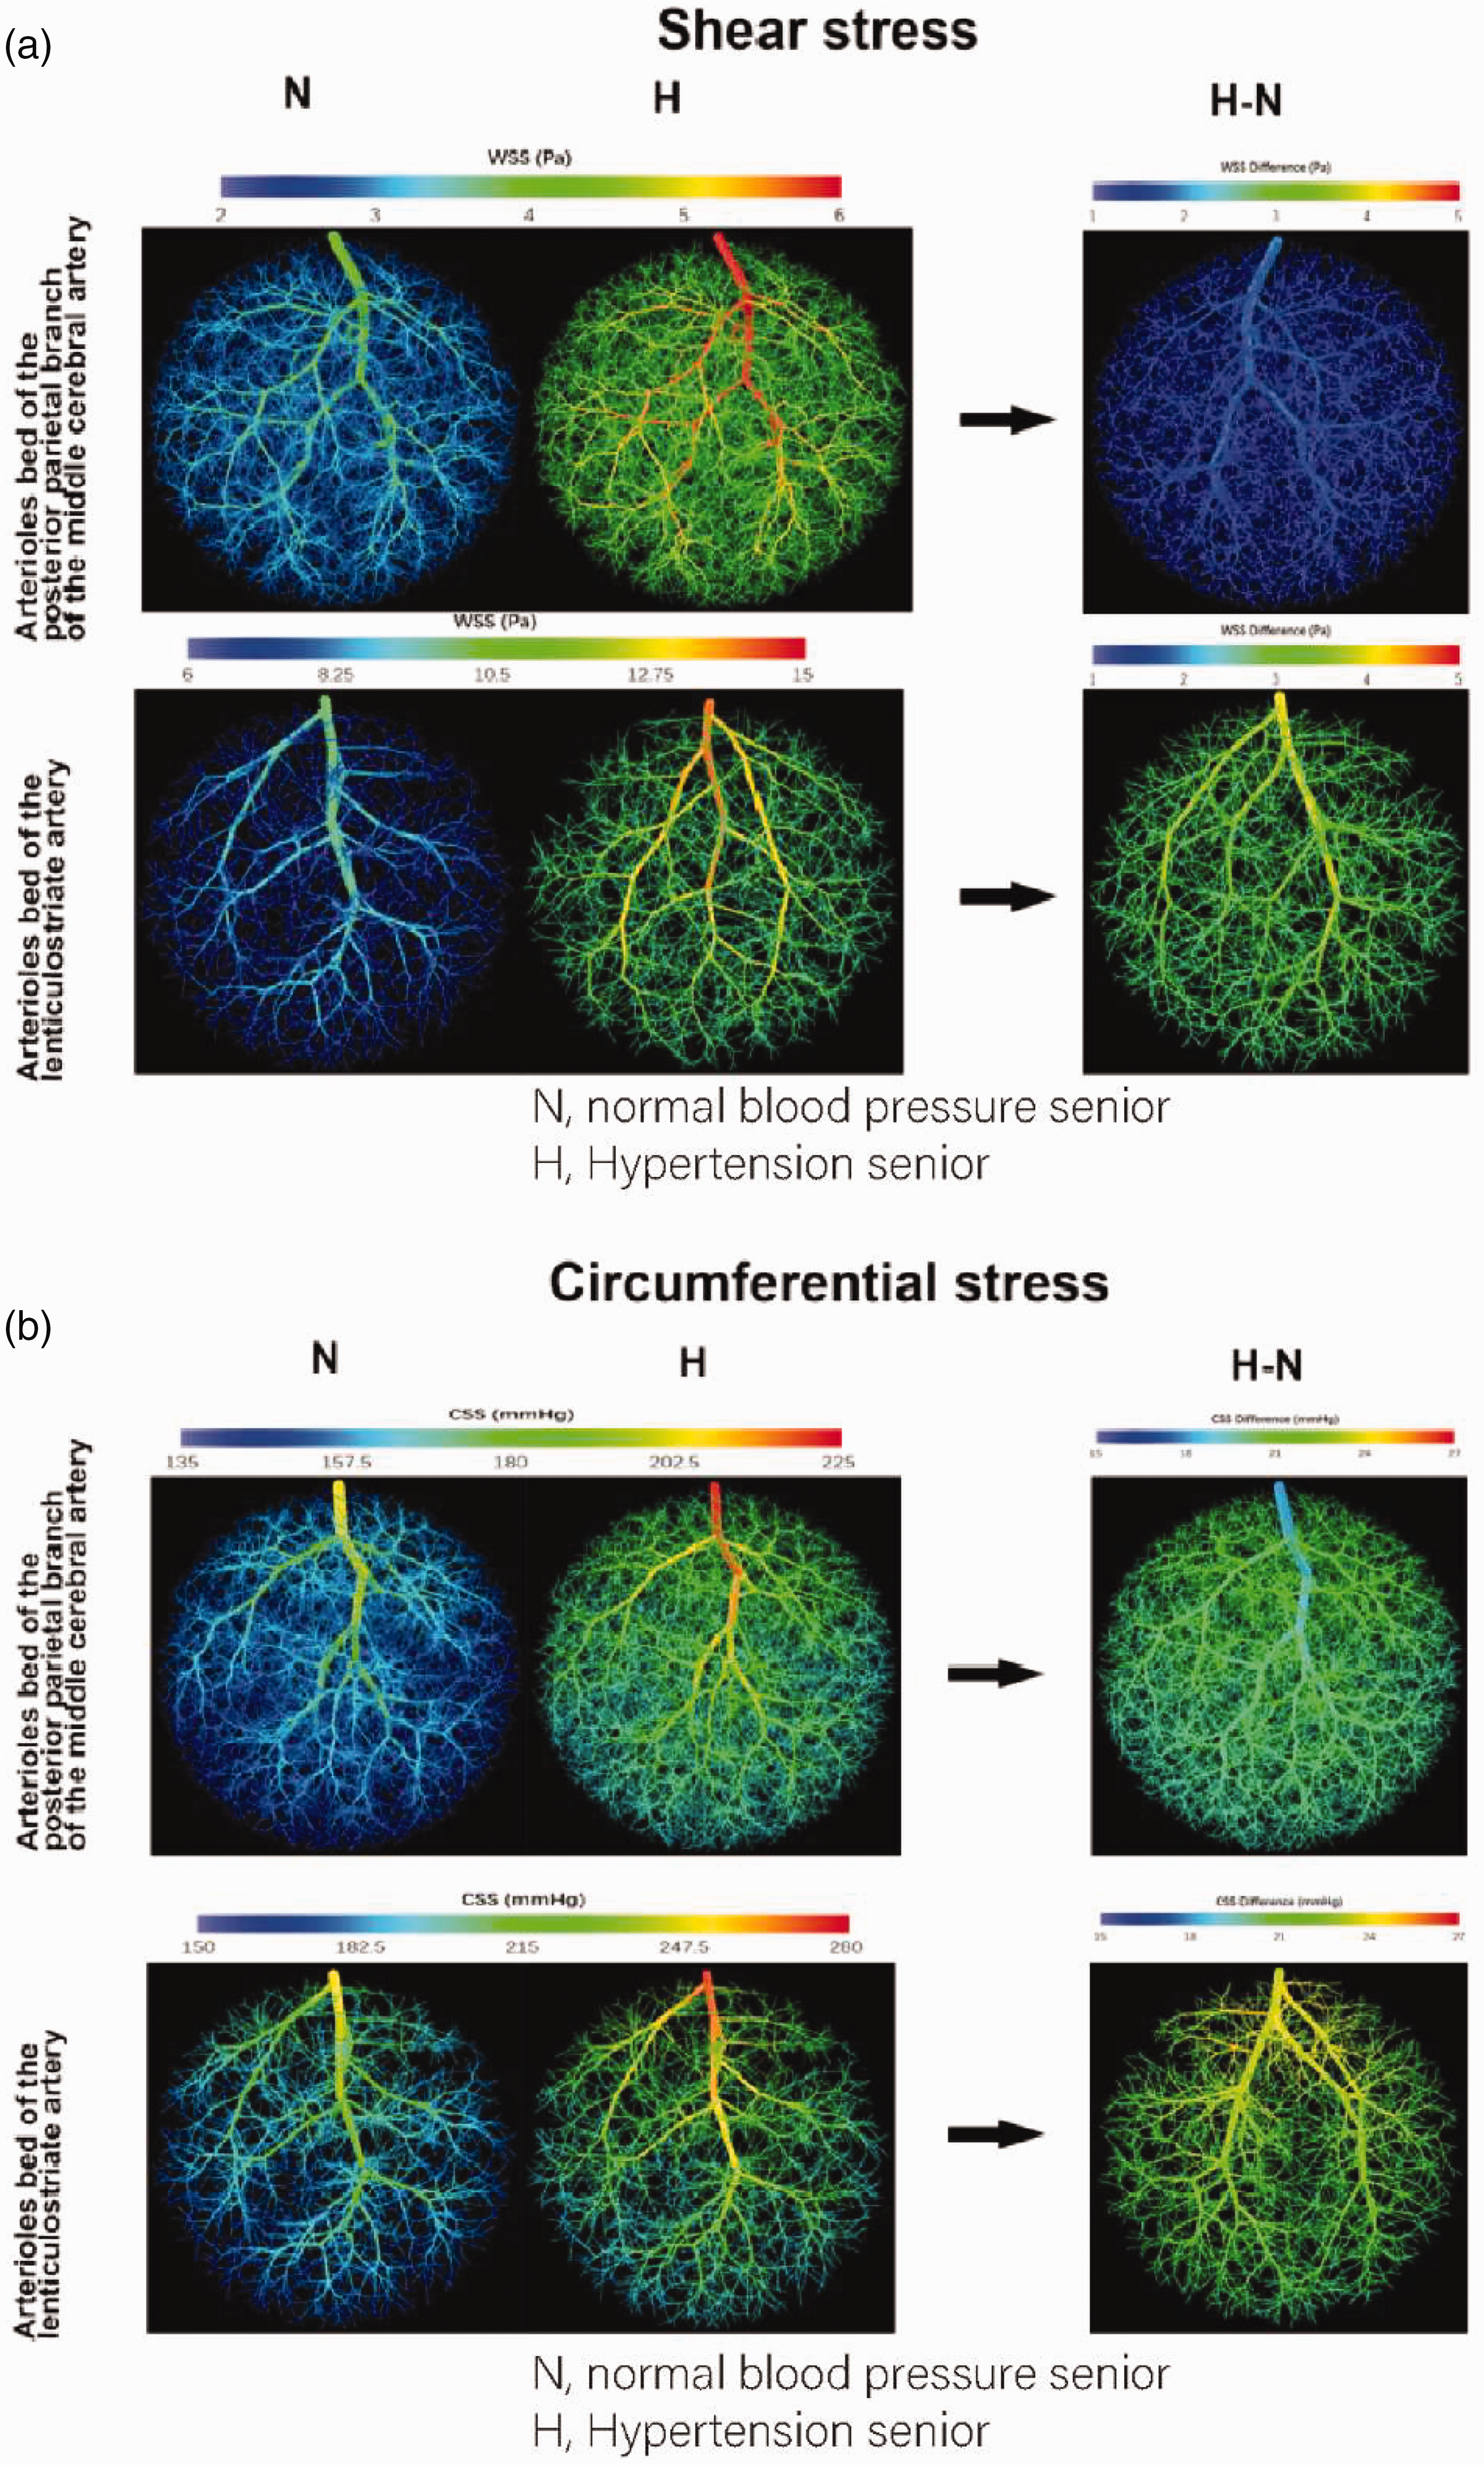
Hemodynamic changes in different cerebral arterioles beds. (a) Shear stress throughout different arterioles beds under the normotensive scenario (N), the hypertensive scenario (H), and the difference between the normotensive scenario and hypertensive scenario (H-N) and (b) circumferential stress throughout v arterioles beds under the normotensive scenario (N), the hypertensive scenario (H), and the difference between the normotensive scenario and hypertensive scenario (H-N).
Discussion
In this study, we found that cerebral small artery remodeling in RHRsp is much more severe in deep brain regions than that of the cortex, including ECM accumulation, VSMCs changes, vessel density decreasing, and vessel diameter changes. Our result also indicated a stronger inflammatory response in deep brain regions. We further validated more severe vascular remodeling in deep brain regions of human samples from hypertension patients. We speculated that this regional difference could result from different hemodynamic changes between small arteries in deep brain regions and cortex under hypertension.
Increased ECM deposition in small arteries is an important characteristic of arteriosclerotic CSVD. Vessel wall ECM includes basement membranes, which support vessel wall cells, and a fibrillar interstitial matrix that interconnects different cell layers. 21 Collagen type IV and laminins are the two major basement membranes components. 21 The fibrillar interstitial matrix is composed largely of the fibrillar collagen types I and III, together with multi-adhesive glycoproteins, including fibronectin. 21 Hence, in this study we quantified the expression of fibronectin, laminin, collagen I, and collagen IV in the vessel wall of cerebral small arteries. Many studies have accessed cerebrovascular remodeling in various hypertensive animal models among different brain regions.22 –28 Although direct comparisons of the vascular remodeling between deep brain regions and the cortex is lacking, several studies provide hints that vascular remodeling is different in these two regions.25 –28 In this study, we revealed that ECM deposition was much more severe in deep brain regions than in the cortex. In our analysis, we focused on the vascular remodeling of small arteries and arterioles. Hence, only αSAM positive arteries with a diameter of 10–65 um were included in the analysis. To quantify ECM accumulation, we measured mean fluorescence intensity, rather than the percentage staining area used in some previous studies.25,27 We believe that comparing ECM accumulation by quantifying the staining area is easily jeopardized by various vessel densities among different strains and brain regions. Held, F. reported that SHRsp exhibited a significantly higher collagen IV percentage area in the cortex, striatum, and thalamus. 27 However, the increased collagen IV signal area in the cortex was accompanied by an increased vessel density, while the increased collagen IV signal area in the striatum and thalamus was not accompanied by an increased vessel density. 27 Our data with human brain tissue also reveal that ECM deposition is more severe in the basal ganglia of hypertensive patients. Earlier this year, Sarabi et al. 29 demonstrated the potential for quantifying small cerebral vessel density using high-resolution 3D black-blood MRI at 3T. However, quantifying vessel wall thickness with MRI remains challenging. With continued advancements in MRI technology, it would be promising in the future to compare vascular changes across different brain regions under CSVD conditions.
More dramatic changes of VSMCs in the cerebral small artery of deep brain regions were also found in our study. One of the characteristics of cerebral small artery remodeling in CSVD is the degeneration and loss of the smooth muscle cells in the tunica media, which may be preceded by an onion-skin concentric smooth muscle cell proliferation. 30 Our study displayed an increased expression of αSMA and SM22α in the cerebral small artery of RHRsp, and the increase is more significant in the deep brain regions. It is also noteworthy that the baseline expression of αSMA and SM22α is lower in the deep brain regions than that of the cortex in the SD rats. This is consistent with a previous human autopsy study that assessed the structural preservation of tunica media of cerebral arteries by the ratio of smooth muscle cell nuclei number to medial area (N-MA ratio). They found that the N-MA ratio of basal ganglia perforating arteries was slightly lower than that of the subcortical medullary arteries in non-hypertensive subjects. 31 These may suggest a regional difference of medial vulnerability in the cerebral small arteries. 31
Emerging evidence indicates that inflammatory response is highly involved in the entire progress of hypertension and end-organ damage.32 –34 Our results demonstrated a more severe inflammatory response in the deep brain regions. Inflammatory cells and pro-inflammatory cytokines can accelerate vascular damage by impairing the endothelium and blood-brain barrier function thereby promoting reactive oxygen species (ROS) production. Perivascular macrophages are also reported to produce type I collagen directly around cerebral small vessels under prolonged hypertension in rats. 35
The hemodynamic disturbance in hypertension provides cues to initiate abnormal intracellular signaling pathways in the vessel wall. By using mathematical models, Blanco, P.J, etc. first showed that blood pressure drop from big arteries to the arteriole bed in deep brain regions is relatively small compared with that of the cortex. 14 This subsequently leads to higher blood pressure in the arteriole bed of deep brain regions. 14 Our results further showed that this blood pressure gradient also results in other hemodynamic gradients. Greater increases in shear stress and circumferential stress under hypertension were seen in arteriolar beds of the deep brain regions. Different anatomic stems of the arteriolar beds could account for the hemodynamic difference. Cerebral small vessels of deep brain regions stem directly from deep arterial perforators at the base of the brain and are relatively close to the origin. On the contrary, cerebral small vessels of the cortex stem from big arteries after subarachnoid circulation, which is relatively far from the origin.14,15 Indeed, regional differences in hemodynamic disturbance coincided with regional differences in vascular remodeling, suggesting that the former may be responsible for the latter. Endothelial cells and VSMCs in vessel walls are equipped with receptors that detect and respond to mechanical forces. 36 Endothelial cells are sensitive to changes in shear stress. 12 Increased shear stress on the cerebral endothelium during hypertension could cause atheroma formation and subsequent atherosclerosis, an important underlying risk factor for large and small vessel occlusion. 37 VSMCs are sensitive to circumferential stress. 38 When circumferential stress increases, VSMCs become hypertrophy followed by an increase in collagen and elastin contents. 36
In conclusion, our results confirm the presence of more severe hypertension-related vascular remodeling in deep brain regions where imaging lesions of CSVD are more commonly detected. We also propose that anatomically determined hemodynamic characteristics may explain the vulnerability of small vessels in DBR. Our study contributes to understanding the heterogeneity of lesion distribution in CSVD and provides further evidence for the importance of anti-hypertension treatment in CSVD.
Supplemental Material
sj-pdf-1-jcb-10.1177_0271678X251327919 - Supplemental material for More severe vascular remodeling in deep brain regions caused by hemodynamic differences is a potential mechanism of hypertensive cerebral small vessel disease
Supplemental material, sj-pdf-1-jcb-10.1177_0271678X251327919 for More severe vascular remodeling in deep brain regions caused by hemodynamic differences is a potential mechanism of hypertensive cerebral small vessel disease by Na Liu, Nan Li, Xiangyuan Cao, Wang Qin, Qi Huang, Yang Xue, Miaoyi Zhang, Yiheng Zhang, Siying Kang, Gong Chen, Jie Tang, Shengzhang Wang and Jianhui Fu in Journal of Cerebral Blood Flow & Metabolism
Footnotes
Funding
The author(s) disclosed receipt of the following financial support for the research, authorship, and/or publication of this article: Funding support was provided by the National Natural Science Foundation of China (82271337, Prof.Fu; 81901179, Dr.Tang).
Declaration of conflicting interests
The author(s) declared no potential conflicts of interest with respect to the research, authorship, and/or publication of this article.
Authors’ contributions
Supplementary material
Supplemental material for this article is available online.
References
Supplementary Material
Please find the following supplemental material available below.
For Open Access articles published under a Creative Commons License, all supplemental material carries the same license as the article it is associated with.
For non-Open Access articles published, all supplemental material carries a non-exclusive license, and permission requests for re-use of supplemental material or any part of supplemental material shall be sent directly to the copyright owner as specified in the copyright notice associated with the article.