
Abstract
This investigation explored the impact of partial pressure of end-tidal carbon dioxide (PETCO2) alterations on temporal neurovascular coupling (NVC) responses across the cardiac cycle and the influence of biological sex via a complex visual scene-search task (“Where’s Waldo?”). 10 females and 10 males completed five puzzles, each with 40 seconds of eyes open and 20 seconds of eyes closed, under PETCO2 clamped at ∼40 mmHg (eucapnia), ∼55 mmHg (hypercapnia), and ∼25 mmHg (hypocapnia). Cerebral blood velocity (CBv) in the middle and posterior cerebral arteries (MCAv, PCAv) were measured via Transcranial Doppler ultrasound. Linear mixed-effects models with participants as a random effect analyzed NVC metrics, including baseline and peak CBv, relative increase, and area-under-the-curve (AUC30). During hypercapnic trials, reductions in PCAv and MCAv AUC30 were noted across the cardiac cycle (all p < 0.001). Hypocapnic PCAv AUC30 was reduced (all p < 0.012), as was systolic MCAv AUC30 (p = 0.003). Females displayed greater baseline PCA diastole (p = 0.048). No other biological sex differences were observed across conditions in baseline (all p > 0.050), peak (all p > 0.054), relative increase (all p > 0.511), and AUC30 metrics (all p > 0.514). Despite differences in responses to hypercapnic and hypocapnic stimuli, NVC responses to complex visual tasks remain robust, across the physiological CO2 range.
Keywords
Introduction
Despite comprising only 2% of the body’s overall weight, the human brain is remarkably intricate and utilizes 20% of total oxygen metabolism at rest.1 –3 Due to the limited ability to store vital substances, the brain relies heavily on multiple complex regulatory processes to ensure sufficient cerebral blood flow (CBF) to maintain neural processing. Neurovascular coupling (NVC), also referred to as functional hyperemia, 4 describes the relationship between neurons and vasculature, their role in enhancing blood supply in active regions of the brain, and the removal of metabolic by-products produced by increased activity. 5 NVC plays a critical role in supplying the active cortical areas of the brain with sufficient CBF to support neural activities. 5 Moreover, NVC dysfunction is associated with many clinical conditions, including Alzheimer’s disease, 6 spinal cord injury, 7 and traumatic brain injuries.8,9
A variety of stimuli have been used to evoke an NVC response, including cognitive-based tasks,10,11 motor-based tasks,12,13 and visual-based tasks.14 –16 Visual-based tasks that elicit NVC responses include viewing simple shapes and checkerboards, reading articles, and visual scene searches. 16 A complex visual scene search paradigm such as “Where’s Waldo?”, demonstrates the greatest total haemodynamic response (i.e., area-under-the-curve) and an enhanced signal-to-noise ratio.14,16 Moreover, Transcranial Doppler ultrasound (TCD) is a well-established method to measure NVC responses across various tasks due to its superior temporal resolution compared to other imaging techniques such as magnetic resonance imaging, spectroscopy, and tomography.16 –18
Cerebrovascular reactivity (CVR) represents another key regulatory process employed by the brain and describes the ability of the cerebrovasculature to respond to vasoactive stimuli. 19 Brain blood vessels are highly responsive to changes in carbon dioxide (CO2) levels in the blood, with hypercapnia and hypocapnia causing significant vasodilation and vasoconstriction responses, respectively.19 –21 Previous research has shown the efficacy of dynamic end-tidal forcing (DEF) to manipulate end-tidal gas levels (and in turn, arterial levels) by utilizing feedback and feedforward algorithms.22,23 Specifically, DEF can precisely adjust the end-tidal pressure of CO2 (PETCO2) and oxygen (PETO2) by altering the fraction of inspired CO2 and oxygen on a breath-by-breath basis. 23
Previous research investigating the influence of CO2 tensions on the NVC response has yielded mixed results. Under hypercapnic conditions, one study reported an attenuated NVC response during a passive motor task. 24 Another observed no changes in NVC response during a reading visual paradigm. 25 During hypocapnic challenges, NVC response is reported to decrease during a visual simulation, 26 while others have reported no changes in total activation. 27 Collectively, these studies only describe data measured from the mean aspect of the cardiac cycle. Therefore, further research is warranted assessing the NVC response during diastole and systole.
Additionally, there is a lack of research highlighting differences in NVC responses between biological sexes concerning CO2 tensions. Under eucapnic conditions, sex differences in the NVC response have been observed in baseline and peak cerebral blood velocity (CBv) metrics, with the diastolic phases of the cardiac cycle demonstrating the most apparent differences. 28 However, sex differences were not as evident in total activation or relative CBv increases. 28 Moreover, without further studies investigating NVC responses under various CO2 tensions, it remains unclear if these biological sex differences observed during eucapnic trials are influenced by CO2.
Therefore, the current study aimed to explore the impact of CVR across three stages- hypocapnia, eucapnia, and hypercapnia- on NVC across the cardiac cycle during a “Where’s Waldo?” search paradigm. Secondarily, the study sought to understand how NVC responses differ between biological sexes across cardiac cycle phases and the physiological CO2 spectrum. It was hypothesized that across CO2 tensions, females would display greater baseline and peak CBv across the cardiac cycle, as this biological sex difference has been noted under eucapnic conditions.28,29 Based on previous studies, it was also hypothesized both hyper- and hypocapnia would attenuate NVC,24 –26 demonstrated by a reduction in relative increase and reduced total activation associated with the NVC stimuli.
Materials and methods
Ethical approval
The University of Calgary Conjoint Health Research Ethics Board (REB-20-1662 and REB 20-2112) provided approval for the current investigation. Before data collection, participants received detailed explanations about the protocol and the equipment used. Participants provided written informed consent before the start of data collection. All procedures followed institutional guidelines and adhered to the principles outlined in the Declaration of Helsinki, 30 except for study registration within a database.
Participants and study design
A convenience sample of 20 healthy adults (10 female, 10 male) aged 19–34, participated in a single laboratory session. Participants provided information about both their biological sex and their gender identity, with all indicating cis-gender identity. Accordingly, data will be analyzed for differences associated with biological sex, as the sample is not powered to consider the societal influences of gender. However, there is a recognized need for future research involving non-cis-gendered individuals to enhance and broaden understanding in the cerebrovascular field regarding the influence of gender on related metrics.31,32
The average age of female participants was 21.6 ± 1.1 years, with a body mass index (BMI) of 25.4 ± 4.2 kg/m2. Male participants were 25.1 ± 4.3 years of age, on average and had a BMI of 24.1 ± 2.0 kg/m2. Exclusion criteria included individuals with cardiorespiratory, musculoskeletal, neurological, and/or cerebrovascular conditions, or who have sustained a concussion within the preceding six months. 33
On the day of the study, participants were instructed to abstain from consuming caffeine, alcohol, smoking, or vaping for at least 8 hours before data collection.34 –37 Additionally, they were advised to refrain from engaging in exercise for 6 hours prior to testing. 38
Experimental protocols
The study was conducted at the Cerebrovascular Concussion Laboratory, University of Calgary, situated at an elevation of 1,111 meters above sea level. Upon obtaining written consent, the participant’s biological sex, gender, age, height, and weight were recorded. Subsequently, participants underwent a detailed repeated-measures protocol within the single visit to the lab, which included both an NVC task utilizing a “Where’s Waldo” search paradigm, alongside a dynamic cerebral autoregulation challenge using repeated squat-stand maneuvers (SSM) at two separate frequencies (0.05 Hz and 0.10 Hz) as previously described.39 –44 The results of the cerebral autoregulation task will be published elsewhere.
The protocol was informed by the recent consensus review on NVC assessment 45 although with the inclusion of 20 second eye-closed periods rather than 30-second periods, which is consistent with previous literature employing similar protocols.14,16,28 Participants were seated approximately 50–60 cm from a 27-inch monitor set to maximum brightness. 45 Furthermore, participants wore corrective contacts or glasses if necessary to ensure 20/20 vision, eliminating the effects of nearsightedness or farsightedness. To reduce the potential confounding of a fluctuating physiological measures such as blood pressure during a single round of the task, participants completed five rounds of the “Where’s Waldo?” task.5,46 Each round consisted of 20 seconds with eyes closed (baseline), followed by 40 seconds of eyes open (activation), during which participants search for “Waldo” and other characters within the “Waldo Universe”, including “Wenda”, “Odlaw”, “Wizard Whitebeard”, and “Woof’s tail”.45,47 To maintain their engagement, a different puzzle was presented for each round. None of the participants managed to accomplish the task of finding all of the characters in the “Waldo Universe” within the allotted 40-second period, minimizing the potential influence of task-related engagement/motivation. 14
Throughout the testing session, the barometric pressure was measured to be 666.4 ± 4.4 mmHg, the humidity. 16 8 ± 6.9%, and the room temperature 22.0 ± 0.7 °C. The testing commenced with the eucapnic breathing challenge, during which PETCO2 levels were maintained at 40 mmHg. Participants completed 5 minutes of the “Where’s Waldo?” search paradigm, with each puzzle consisting of 40 seconds of eyes open and 20 seconds of eyes closed per puzzle.16,28 This protocol was then repeated at hypercapnic levels (PETCO2 clamped at 55 mmHg) and hypocapnic levels (PETCO2 clamped at 25 mmHg)). 48 The selection of these PETCO2 stages were based on previous literature indicating their efficacy in inducing hypocapnia and hypercapnia at low altitudes.23,48 Moreover, the order of conditions (eucapnia, hypercapnia, and hypocapnia) was selected based on previous research suggesting vasoconstriction responses are less affected by moderate-to-high intensity exercise, which induces vasodilation similar to the hypercapnic condition. 49 Furthermore, a “washout” period of 5 minutes was provided between the hypercapnic and hypocapnic stages to allow PETCO2 to return to baseline. 49 Each participant underwent all three conditions of the protocol during the same visit, acting as their own eucapnic controls for the hypercapnic and hypocapnic stages. This approach helps to reduce the influence of confounding factors when comparing tasks such as the influence of the menstrual cycle phase or cardiac fitness status. 50 The total duration of the single-visit testing session was approximately 1.5 hours.
Instrumentation
During the data collection setup, participants’ middle cerebral artery (MCA) and posterior cerebral artery (PCA) were unilaterally insonated using TCD (DWL USA, Inc, San Juan Capistrano, CA, USA) to measure CBv as a surrogate for CBF. 51 Two 2-MHz ultrasound probes were positioned at the transtemporal window to insonate the P1 and M2 segments of the left PCA and right MCA, respectively. Trained sonographers utilized carotid compressions and simple visual tasks to confirm correct vessel insonation. 52 Subsequently, the TCD headframe was utilized to ensure proper probe placement and maintain position throughout the testing period (DWL USA, Inc, San Juan Capistrano, CA, USA). Blood pressure (BP) was measured on a beat-to-beat basis, and pulsatile waveforms were recorded using a finger photoplethysmography device with a height correction unit (Finometer NOVA; Finapres Medical Systems, Amsterdam, The Netherlands).
Throughout the protocol, a portable DEF system, as described by Tymko et al., 23 was employed to regulate PETCO2 and PETO2 levels on a breath-by-breath basis. This system utilizes independent solenoid valves for nitrogen, oxygen, and carbon dioxide to ensure precise control over PETCO2 and PETO2 metrics through feedback and feedforward mechanisms. 23 End-tidal steady state was achieved when PETCO2 was within 1 mmHg of the target stage for three consecutive breaths. 23 The DEF system offers advantages such as accurately maintaining PETCO2 levels at desired values and enhancing control through adjustments in the volume injected into the inspiratory reserve via the aforementioned feedback and feedforward mechanisms.22,23
Participants wore a nose clip while breathing into a mouthpiece connected to a sampling line that fed into the gas analyzer (ML206; AD Instruments, Colorado Springs, CO, USA). All data were simultaneously sampled at 1000 Hz using an analog-to-digital conversion (PowerLab 16/30 ML880; ADInstruments, Colorado Springs, CO, USA) and stored using commercially available software for analysis (LabChart Pro Version 8 AD Instruments).
Data processing
Beat-to-beat systolic and diastolic values were calculated based on the raw BP, MCA, and PCA readings. Using the precise timing of CBv and recordings from TCD and the finger photoplethysmography device, average values for these variables were obtained by averaging data points from each heartbeat. Peak levels of PETCO2 were assessed on a breath-by-breath basis. Less than 0.5% of the data showed artifacts, which were corrected using a median filter in LabChart. Most artifacts were observed in the systolic phase of CBv recordings.
Each participant’s fifteen trials (5 hypocapnic, 5 eucapnic, and 5 hypercapnic) were synchronized with the moment-in-time eyes opened. As described previously, the analysis focused on the 5 seconds before and 30 seconds after this event. 28 Specifically, the measures included: 1) baseline CBv averaged over 5 seconds before eye-opening, 2) highest CBv during the initial 30 seconds of task engagement, 3) Relative percentage increase in CBv from baseline to peak, and 4) Area under the curve during 30 seconds of task engagement (AUC30). 28 AUC30 was calculated as the area under the curve for the CBV response over the first 30 seconds of the eyes-open period, using the baseline CBv calculated. This metrics captures the magnitude and duration of vascular activation, which can differentiate NVC responses based on sustained or attenuated CBv patterns over time. 16 The AUC30 metric provides complimentary insight into subtle vasculature changes that may not be reflected by the mean response, offering additional sensitivity to transient vascular dynamics. Moreover, a strength of the current investigation in using AUC30 is that it relies on absolute CBv changes, compared to relative changes, leading to more robust comparison based on different CBv starting points between conditions (eucapnia, hypocapnia, and hypercapnia). Cleaned data were used to compute the previously mentioned metrics for the diastolic, mean, and systolic phases of the cardiac cycle in both the PCA and MCA via custom Excel scripts.
Sample size calculation
To determine the required sample size for the study, G*Power (Version 3.1.9.6) was utilized to conduct an a priori power analysis using a multiple linear regression model. Based on previous investigations showing large changes in PCAv during eucapnic and hypocapnic NVC challenges, 27 a large Cohen’s f 2 effect size of 0.35 was chosen, with alpha set at 0.05, and a power of 0.80 targeted. Since the study hypotheses were directional, a one-tailed test was selected. Additionally, the regression model included two predictor variables: PETCO2 condition and biological sex. Based on these parameters, the power analysis revealed a sample size of 20 participants would be necessary to detect the expected effects using a linear model. However, previous studies have determined that linear mixed-effect (LME) models increase power, 53 therefore, this sample would be adequate for LME modeling as well. Additionally, it is worth noting there is currently no consistent agreement on the a priori sample size for LME models. 54 Furthermore, a repeated measures protocol was designed to allow participants to function as their own controls for within subject factors. This approach helps mitigate the risk of confounding by unmeasured within-subject variables like prior concussion history, genetic factors, and other potential influences, which could otherwise impact the study outcomes while still permitting group level comparisons across sexes. 55
Statistical analysis
The statistical analyses were conducted using R-Studio (Version 2024.04.2 + 764). LME models were fitted for all NVC outcome measures, including baseline and peak middle cerebral artery velocity (MCAv) and posterior cerebral artery velocity (PCAv), relative changes in MCAv and PCAv, and AUC30 conditioned on individuals. These regressions utilized PETCO2 stages (eucapnia [reference], hypercapnia, and hypocapnia) and biological sex (female [reference] and male) as predictor variables across the cardiac cycle. Furthermore, each LME model was compared to a naive model that did not condition on individuals using a likelihood ratio (LR) test, which yielded the p-values for the LR test observed in Table 3. Afterward, a Wilcox rank-sum test was performed to compare the effect sizes of all NVC metrics (e.g., baseline, peak, relative increase, and AUC30) between male and female participants. Data are presented as mean ± 95% confidence intervals (95% CI) to estimate the population mean. Alpha was set a priori at 0.05.
Results
Physiological data
Biological sex-stratified cerebrovascular, respiratory, and cardiovascular metrics during the three “Where’s Waldo?” blocks are displayed in Table 1. All NVC outcome metrics of interest are displayed in Table 2. Table 3 shows the LME model outputs using participants as a random effect (beta coefficients and 95% CI, p-values, and LR p-values) comparing hypo- and hypercapnia to eucapnia and males to females.
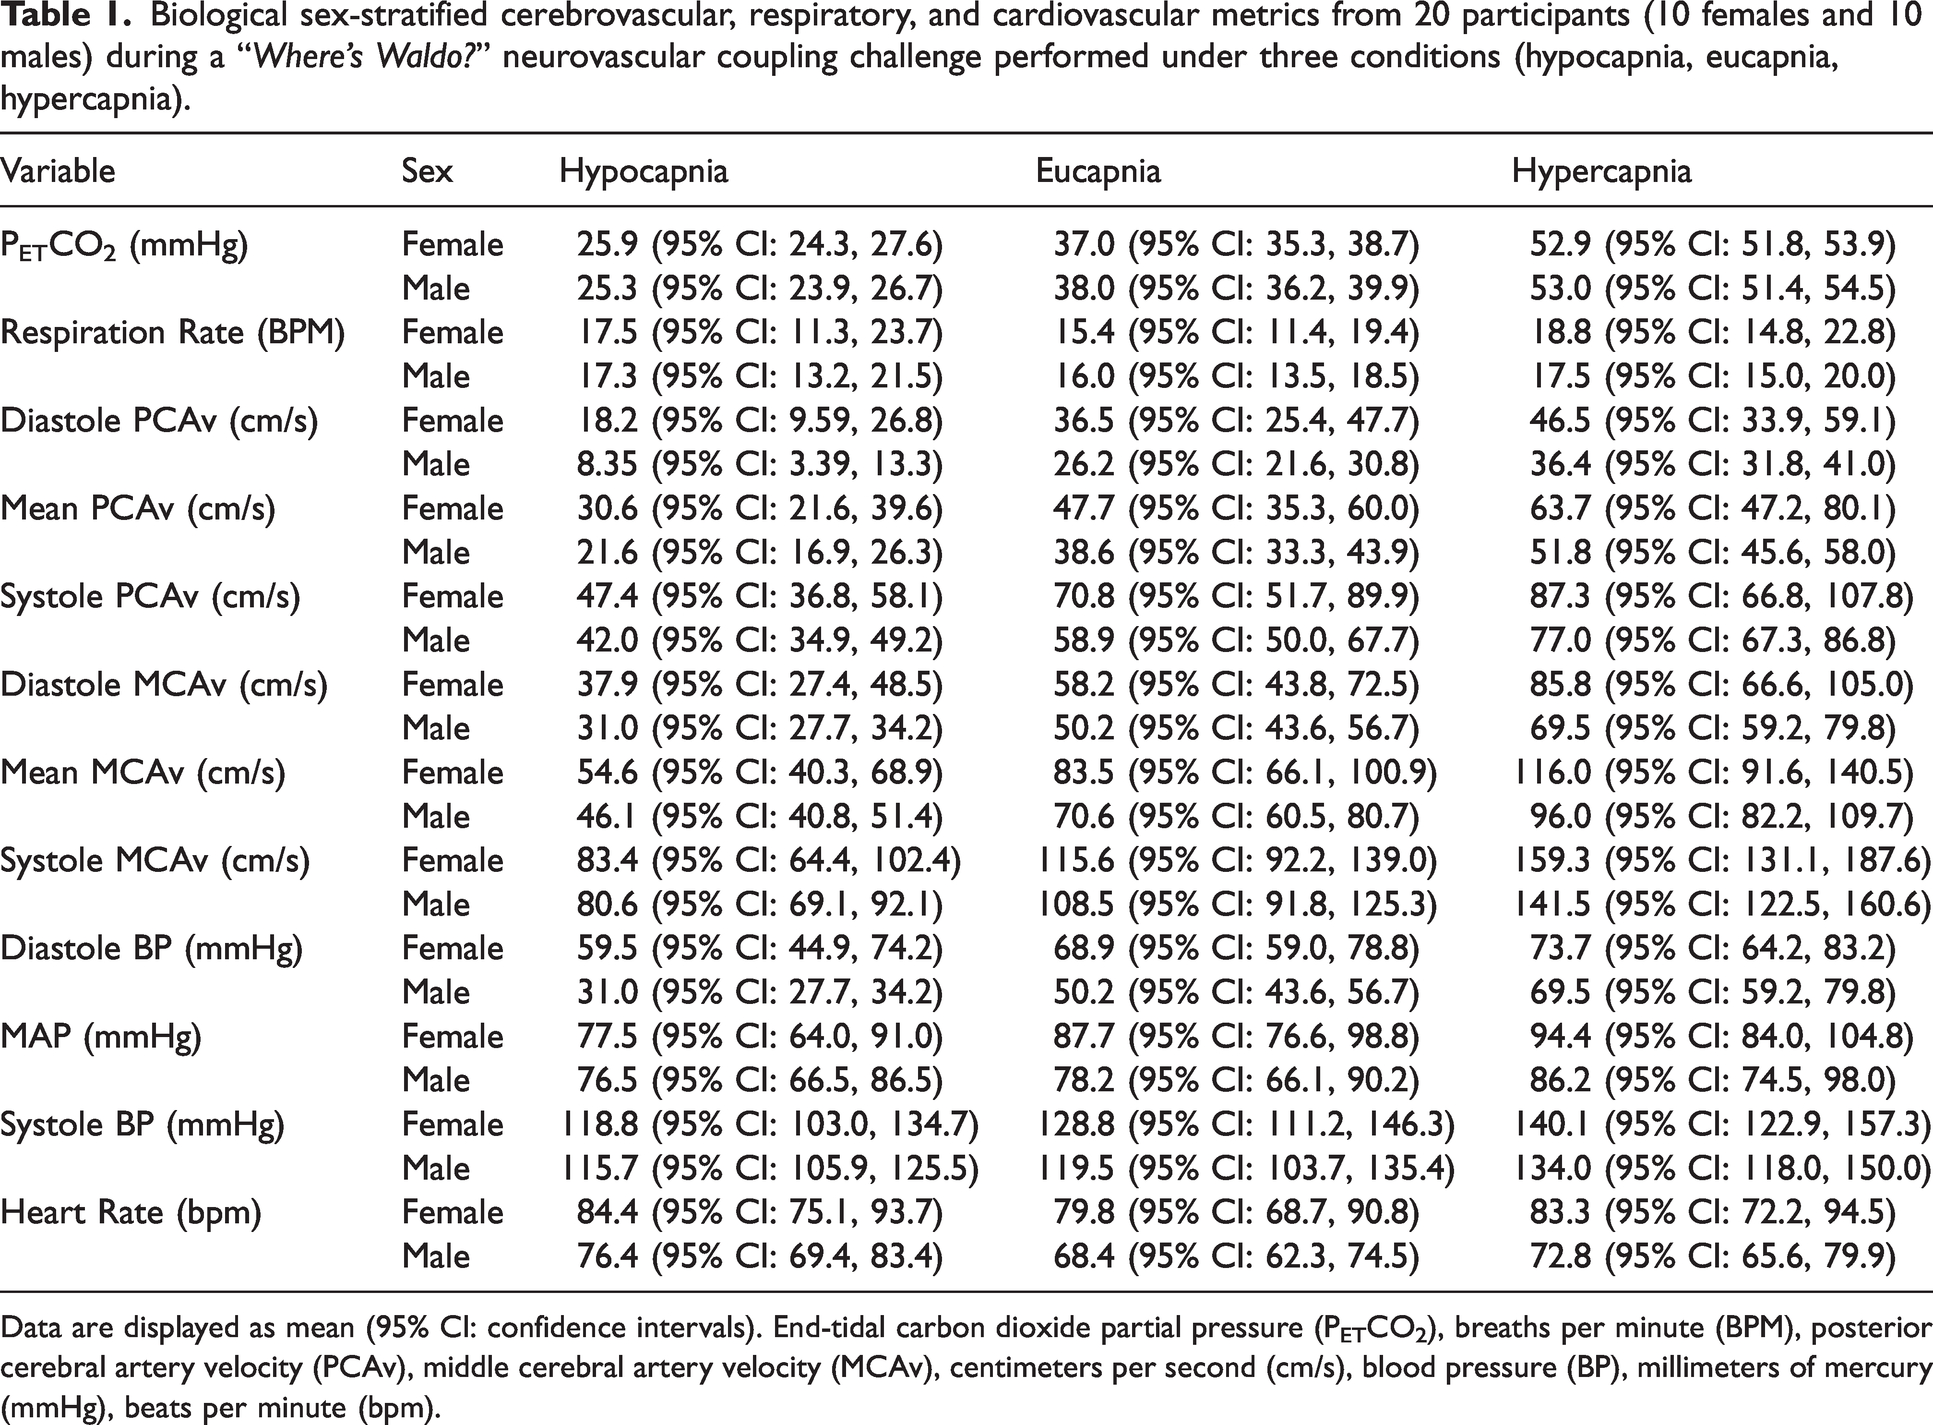
Biological sex-stratified cerebrovascular, respiratory, and cardiovascular metrics from 20 participants (10 females and 10 males) during a “Where’s Waldo?” neurovascular coupling challenge performed under three conditions (hypocapnia, eucapnia, hypercapnia).
Data are displayed as mean (95% CI: confidence intervals). End-tidal carbon dioxide partial pressure (PETCO2), breaths per minute (BPM), posterior cerebral artery velocity (PCAv), middle cerebral artery velocity (MCAv), centimeters per second (cm/s), blood pressure (BP), millimeters of mercury (mmHg), beats per minute (bpm).
Absolute neurovascular coupling metrics from a “Where’s Waldo?” search paradigm performed under three conditions (hypocapnia, eucapnia, hypercapnia) in 20 participants (10 female and 10 male).
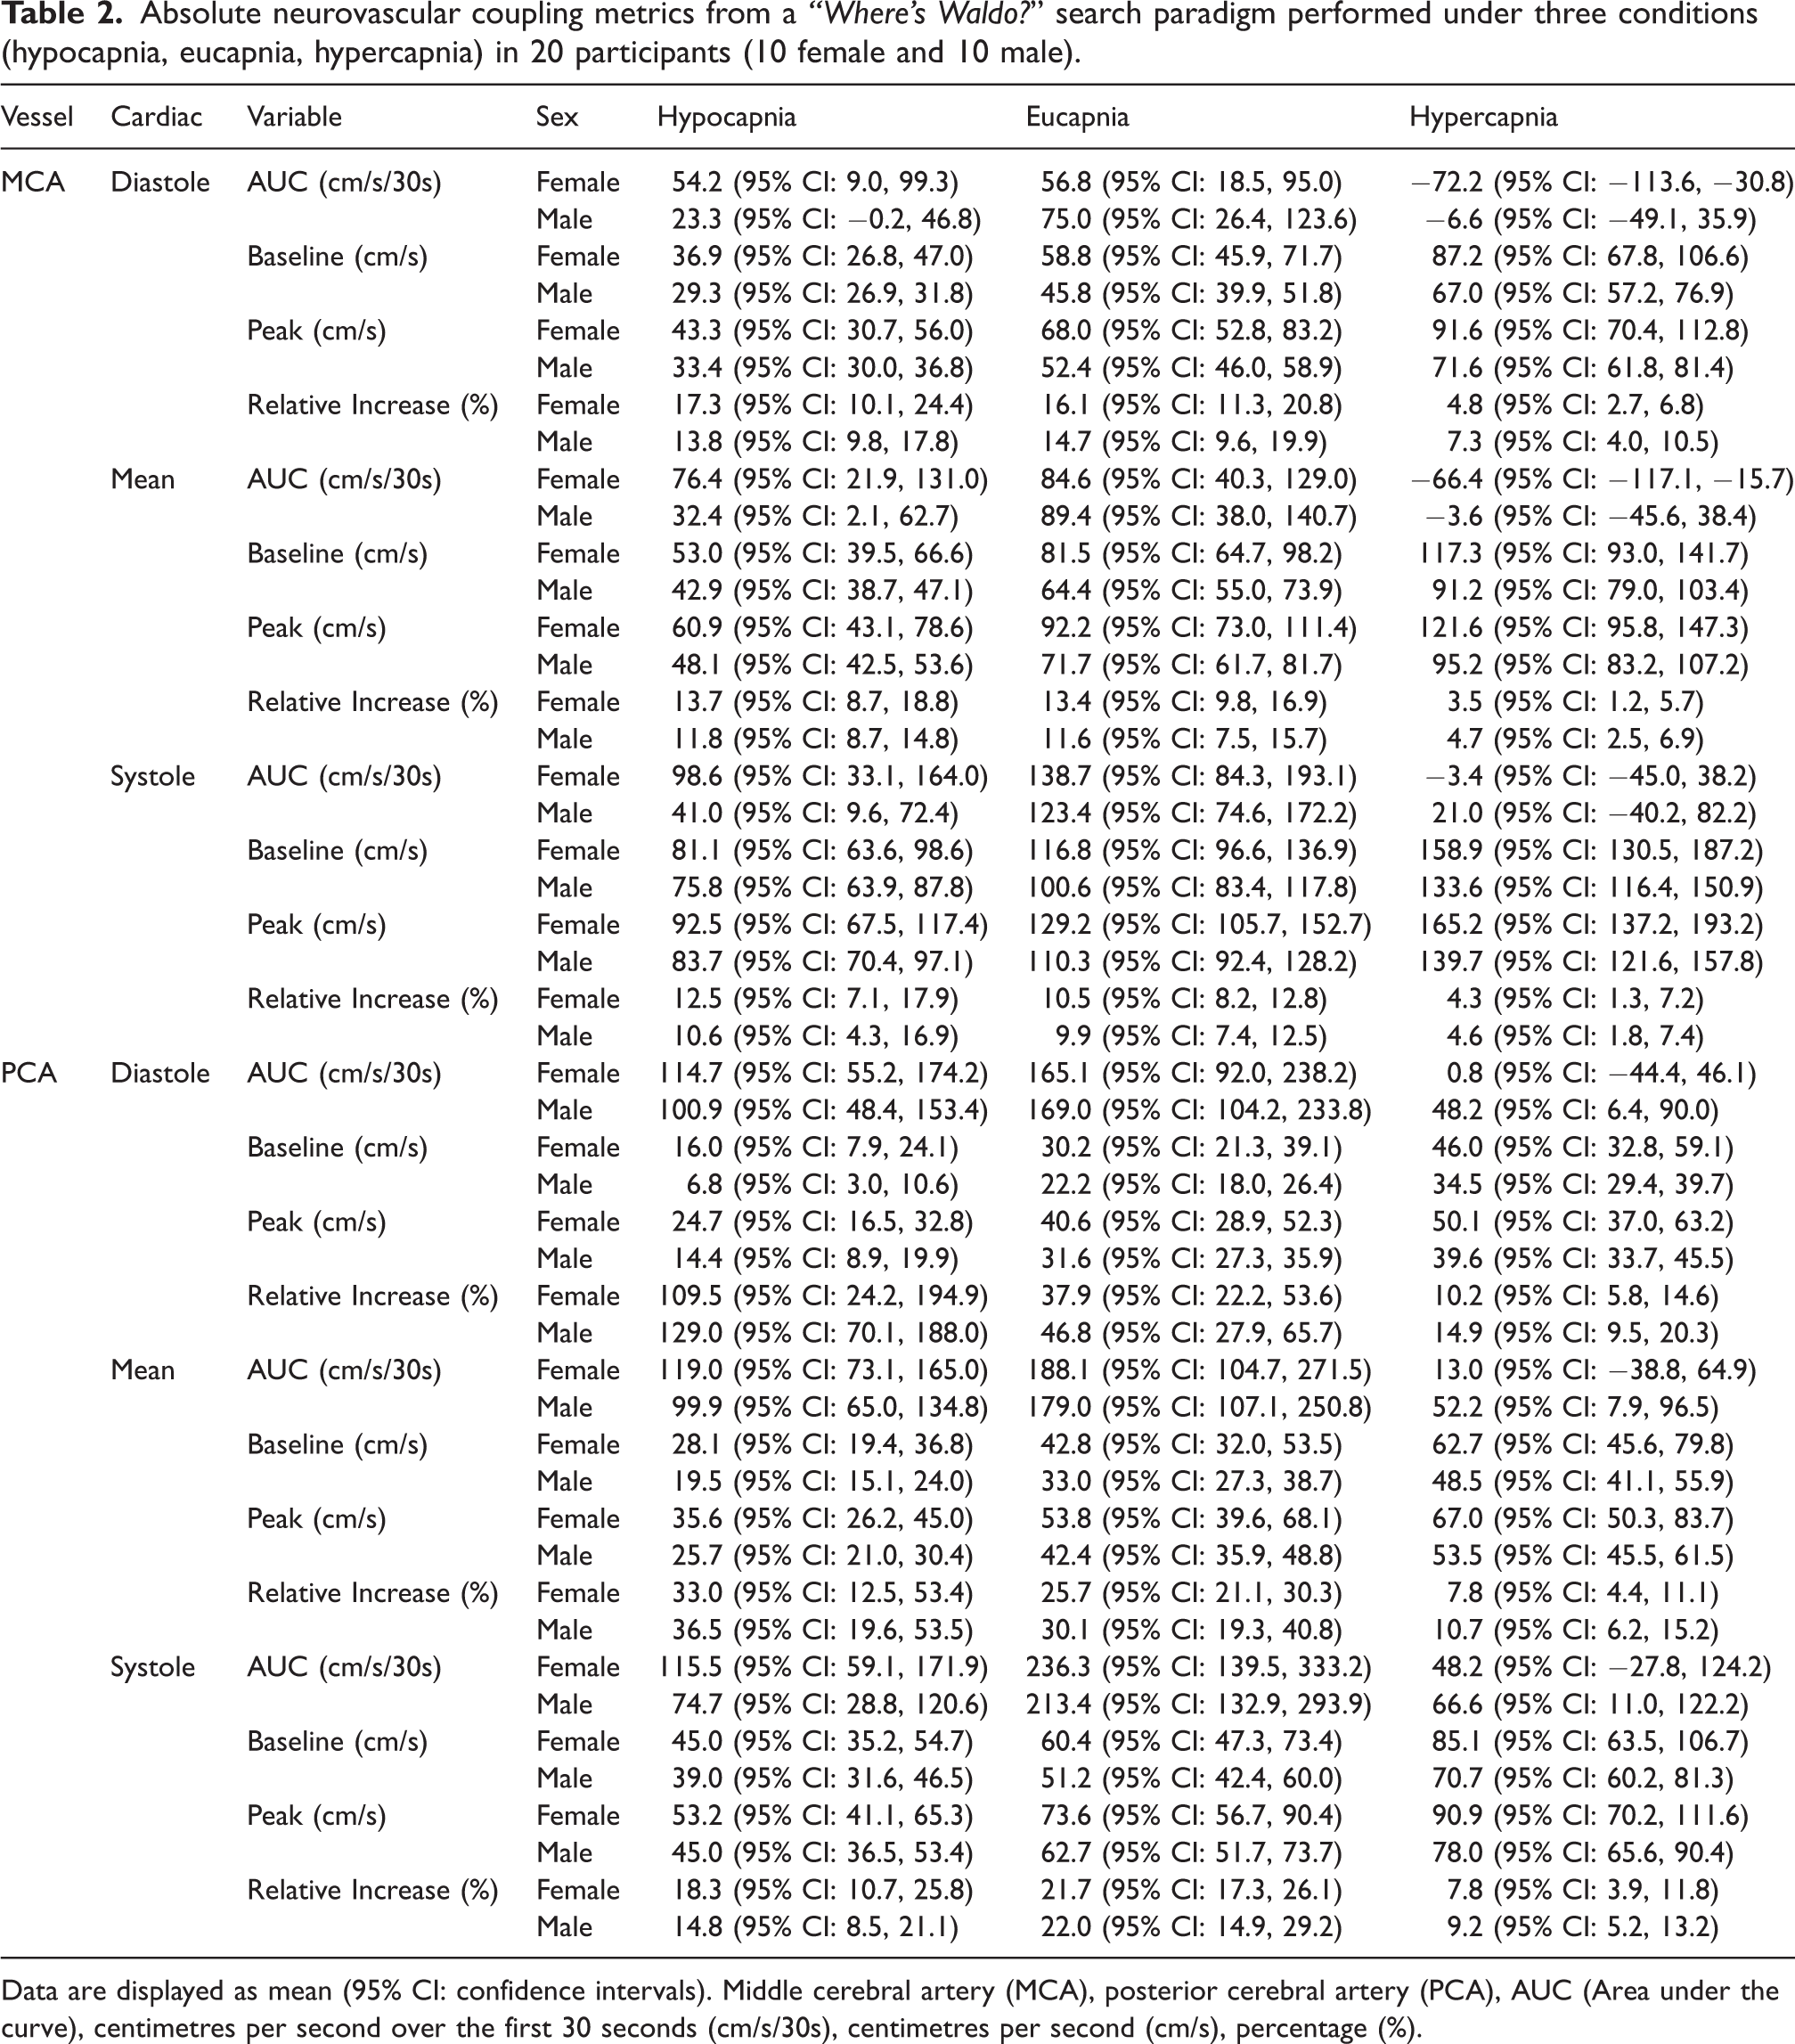
Data are displayed as mean (95% CI: confidence intervals). Middle cerebral artery (MCA), posterior cerebral artery (PCA), AUC (Area under the curve), centimetres per second over the first 30 seconds (cm/s/30s), centimetres per second (cm/s), percentage (%).
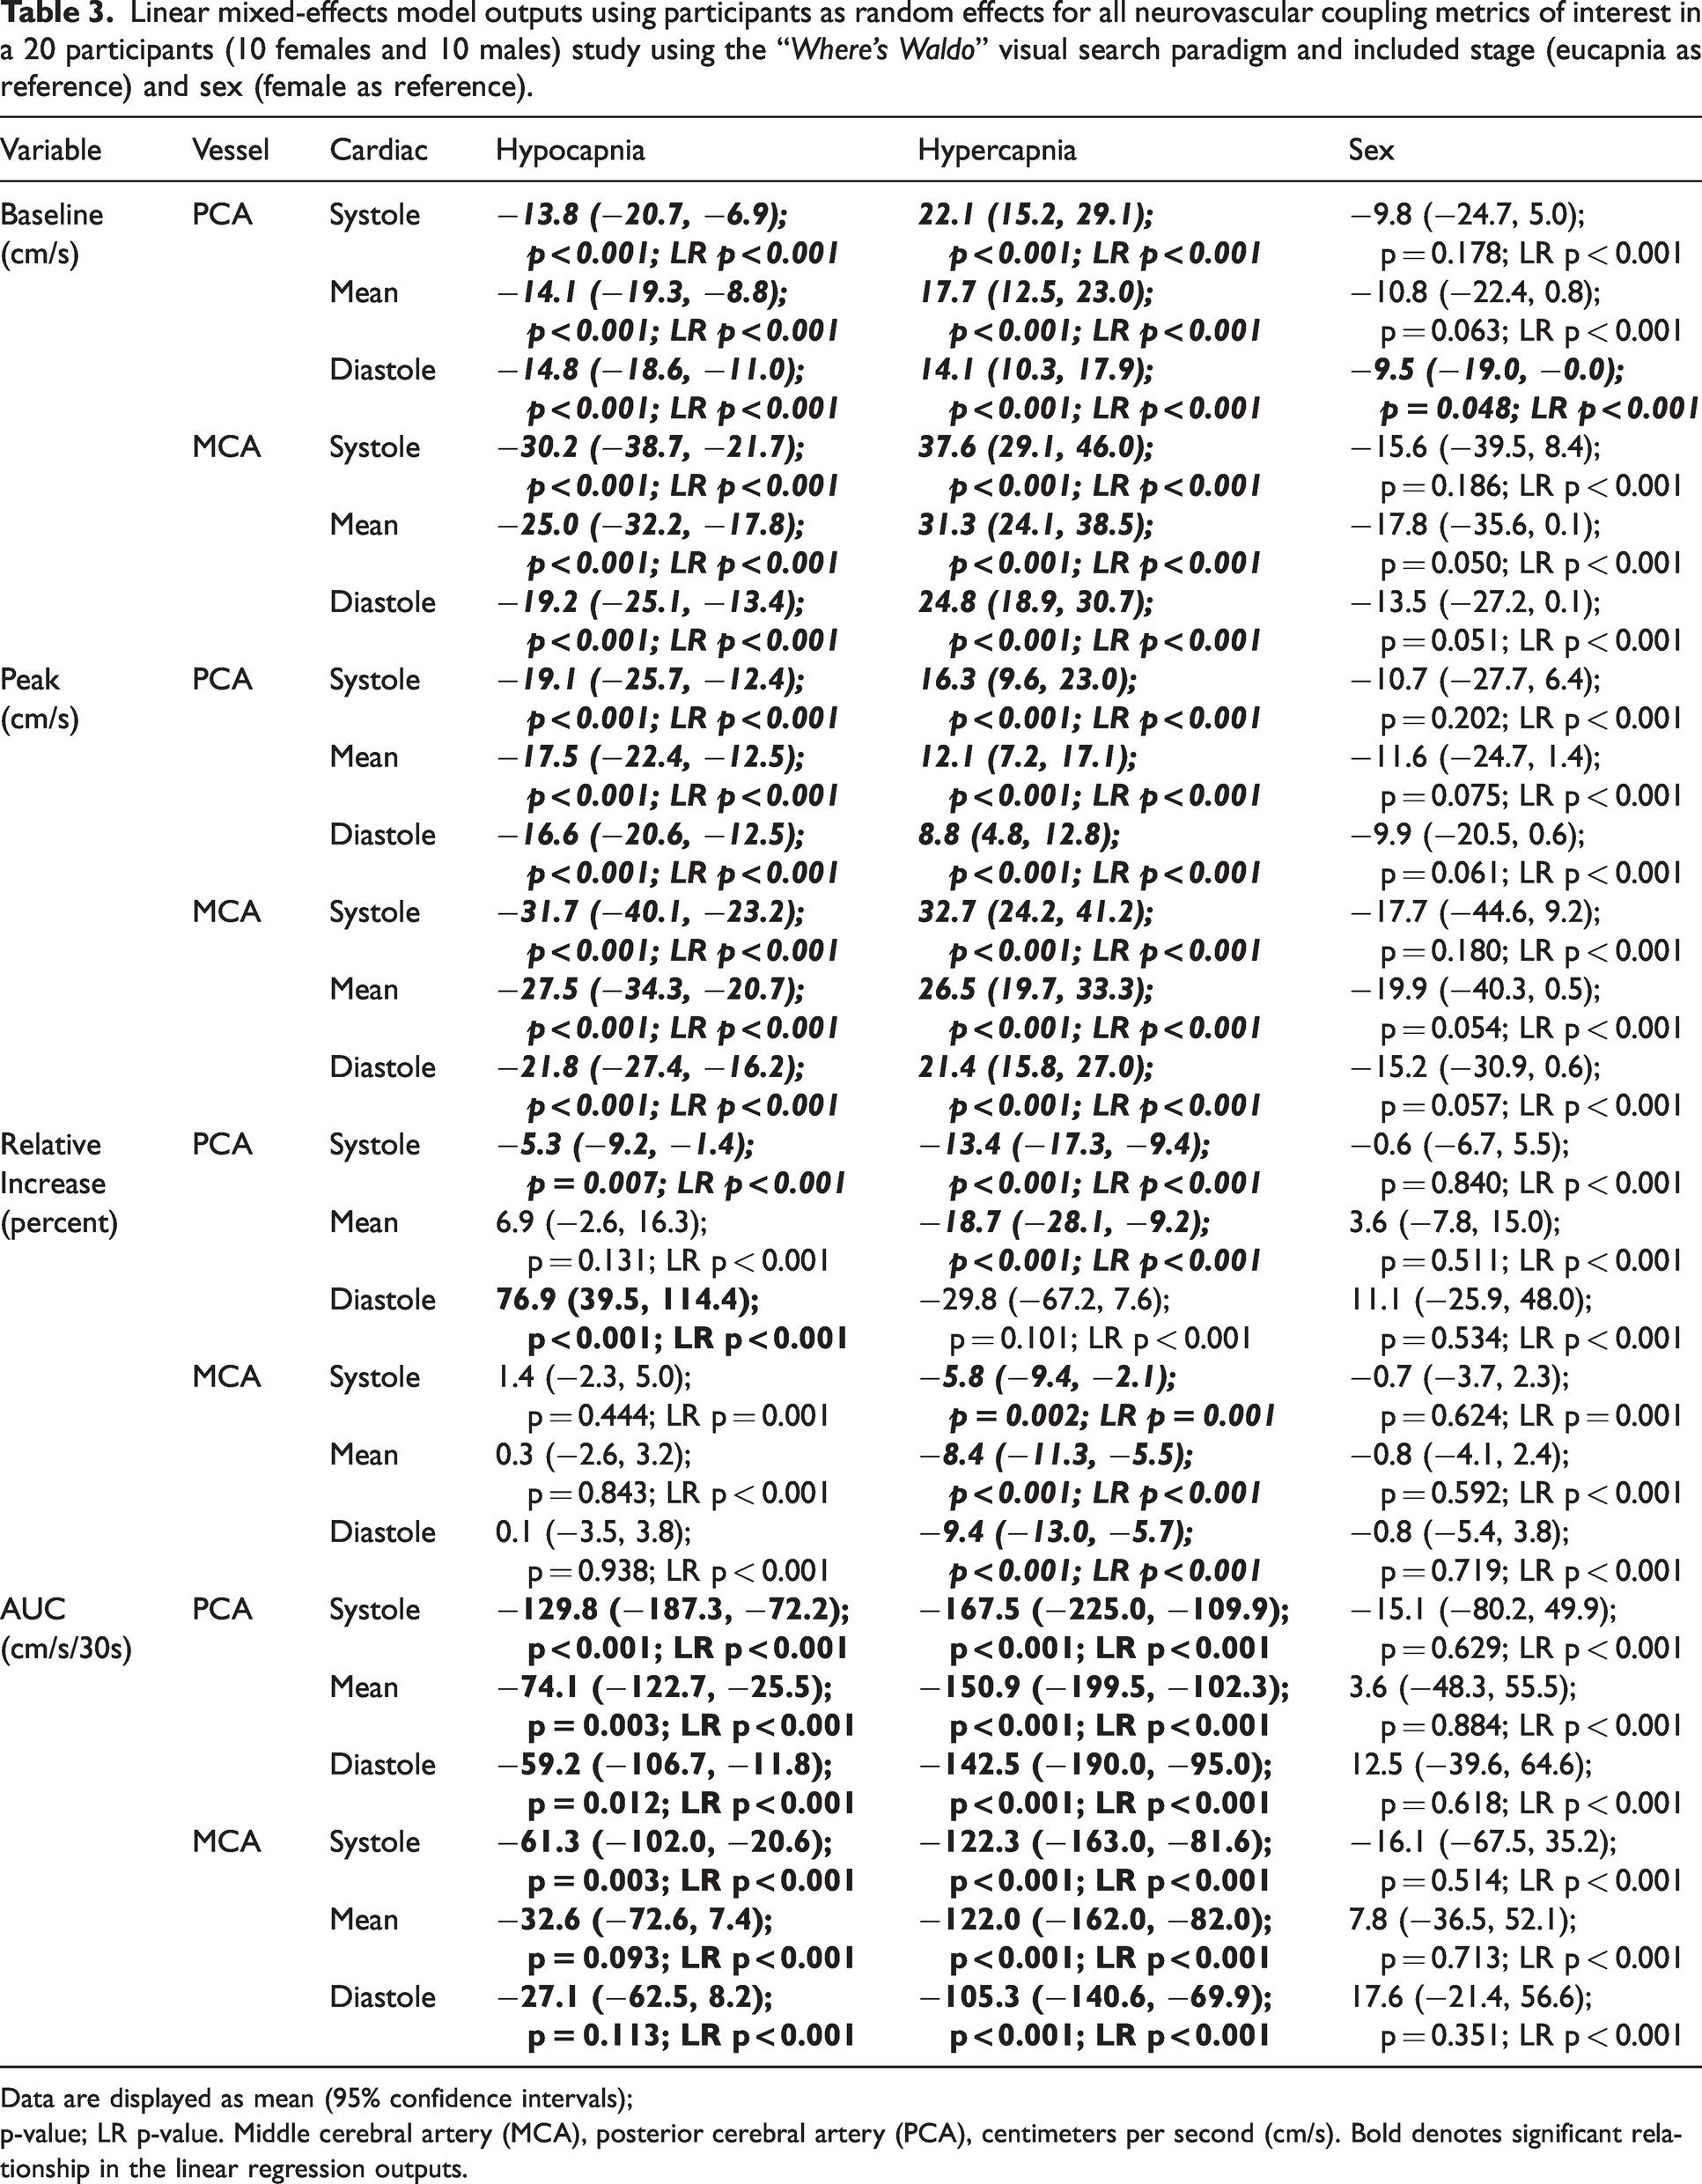
Linear mixed-effects model outputs using participants as random effects for all neurovascular coupling metrics of interest in a 20 participants (10 females and 10 males) study using the “Where’s Waldo” visual search paradigm and included stage (eucapnia as reference) and sex (female as reference).
Data are displayed as mean (95% confidence intervals); p-value; LR p-value. Middle cerebral artery (MCA), posterior cerebral artery (PCA), centimeters per second (cm/s). Bold denotes significant relationship in the linear regression outputs.
Compared to the eucapnic conditions (reference), baseline, and peak MCAv and PCAv were attenuated across the cardiac cycle during hypocapnia (all p < 0.001, all LR p < 0.001) (Table 3 and Figures 1 and 2). These metrics were all greater across the cardiac cycle during hypercapnia (all p < 0.001, all LR p < 0.001) (Table 3 and Figures 1 and 2). However, biological sex differences were only observed across conditions for PCA diastole metrics (p = 0.048, LR p < 0.001) where females displayed greater PCA diastole measures compared to males (Table 3, Figures 1 and 2). Conversely, all other peak and baseline metrics did not display significant differences, (all p > 0.050) (Table 3, Figures 1 and 2). Across conditions and the cardiac cycle, baseline measures indicated all biological sex effect sizes were below 0.263. Similarly, for peak metrics, across conditions and the cardiac cycle, all biological sex effect sizes were below 0.273.
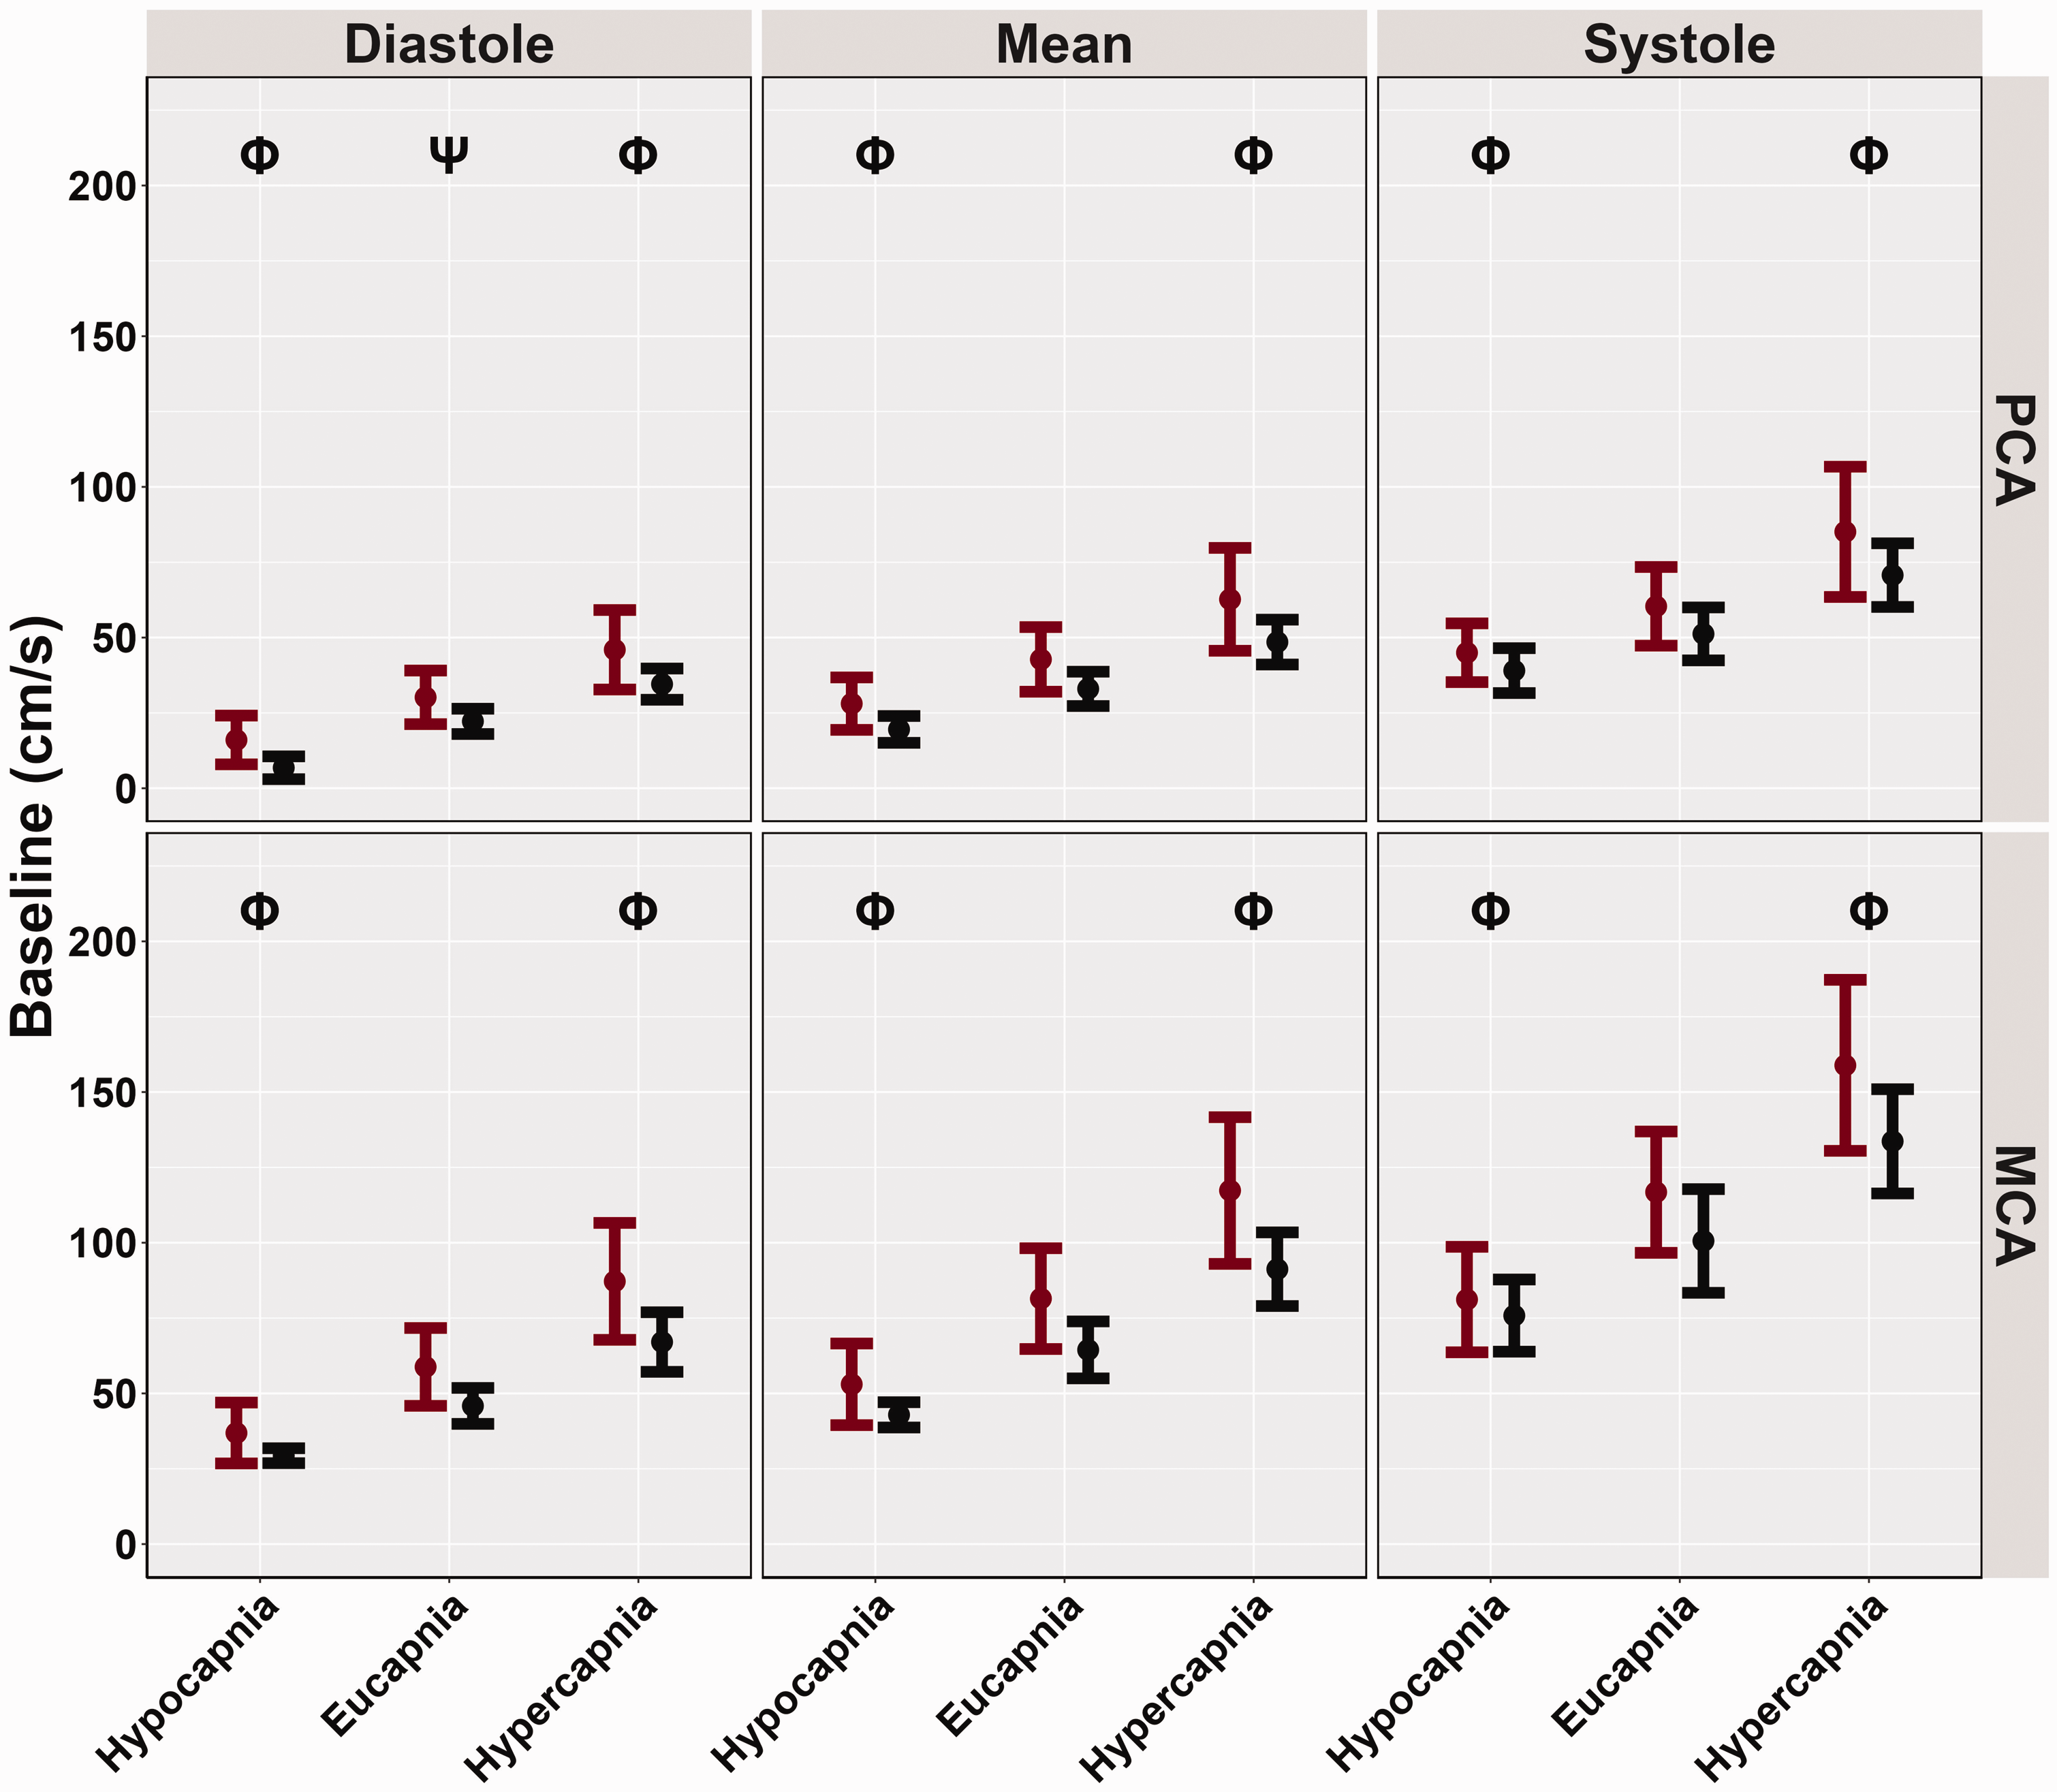
Baseline cerebral blood velocities (cm/s) obtained from participants’ posterior cerebral artery (PCA) and middle cerebral artery (MCA) across the cardiac cycle during a “Where's Waldo” neurovascular coupling (NVC) challenge. The NVC challenge was performed under three separate conditions: hypocapnia, eucapnia, and hypercapnia. The data are categorized by sex, with females represented in red (n = 10) and males in black (n = 10). The Phi symbol (Φ) indicates a stage significantly different from the eucapnia stage, determined by linear regressions with stages (eucapnia as reference) and sex (female as reference) predictor variables. The Psi (Ψ) highlights sex differences observed across the three stages (hypocapnia, eucapnia, hypercapnia).
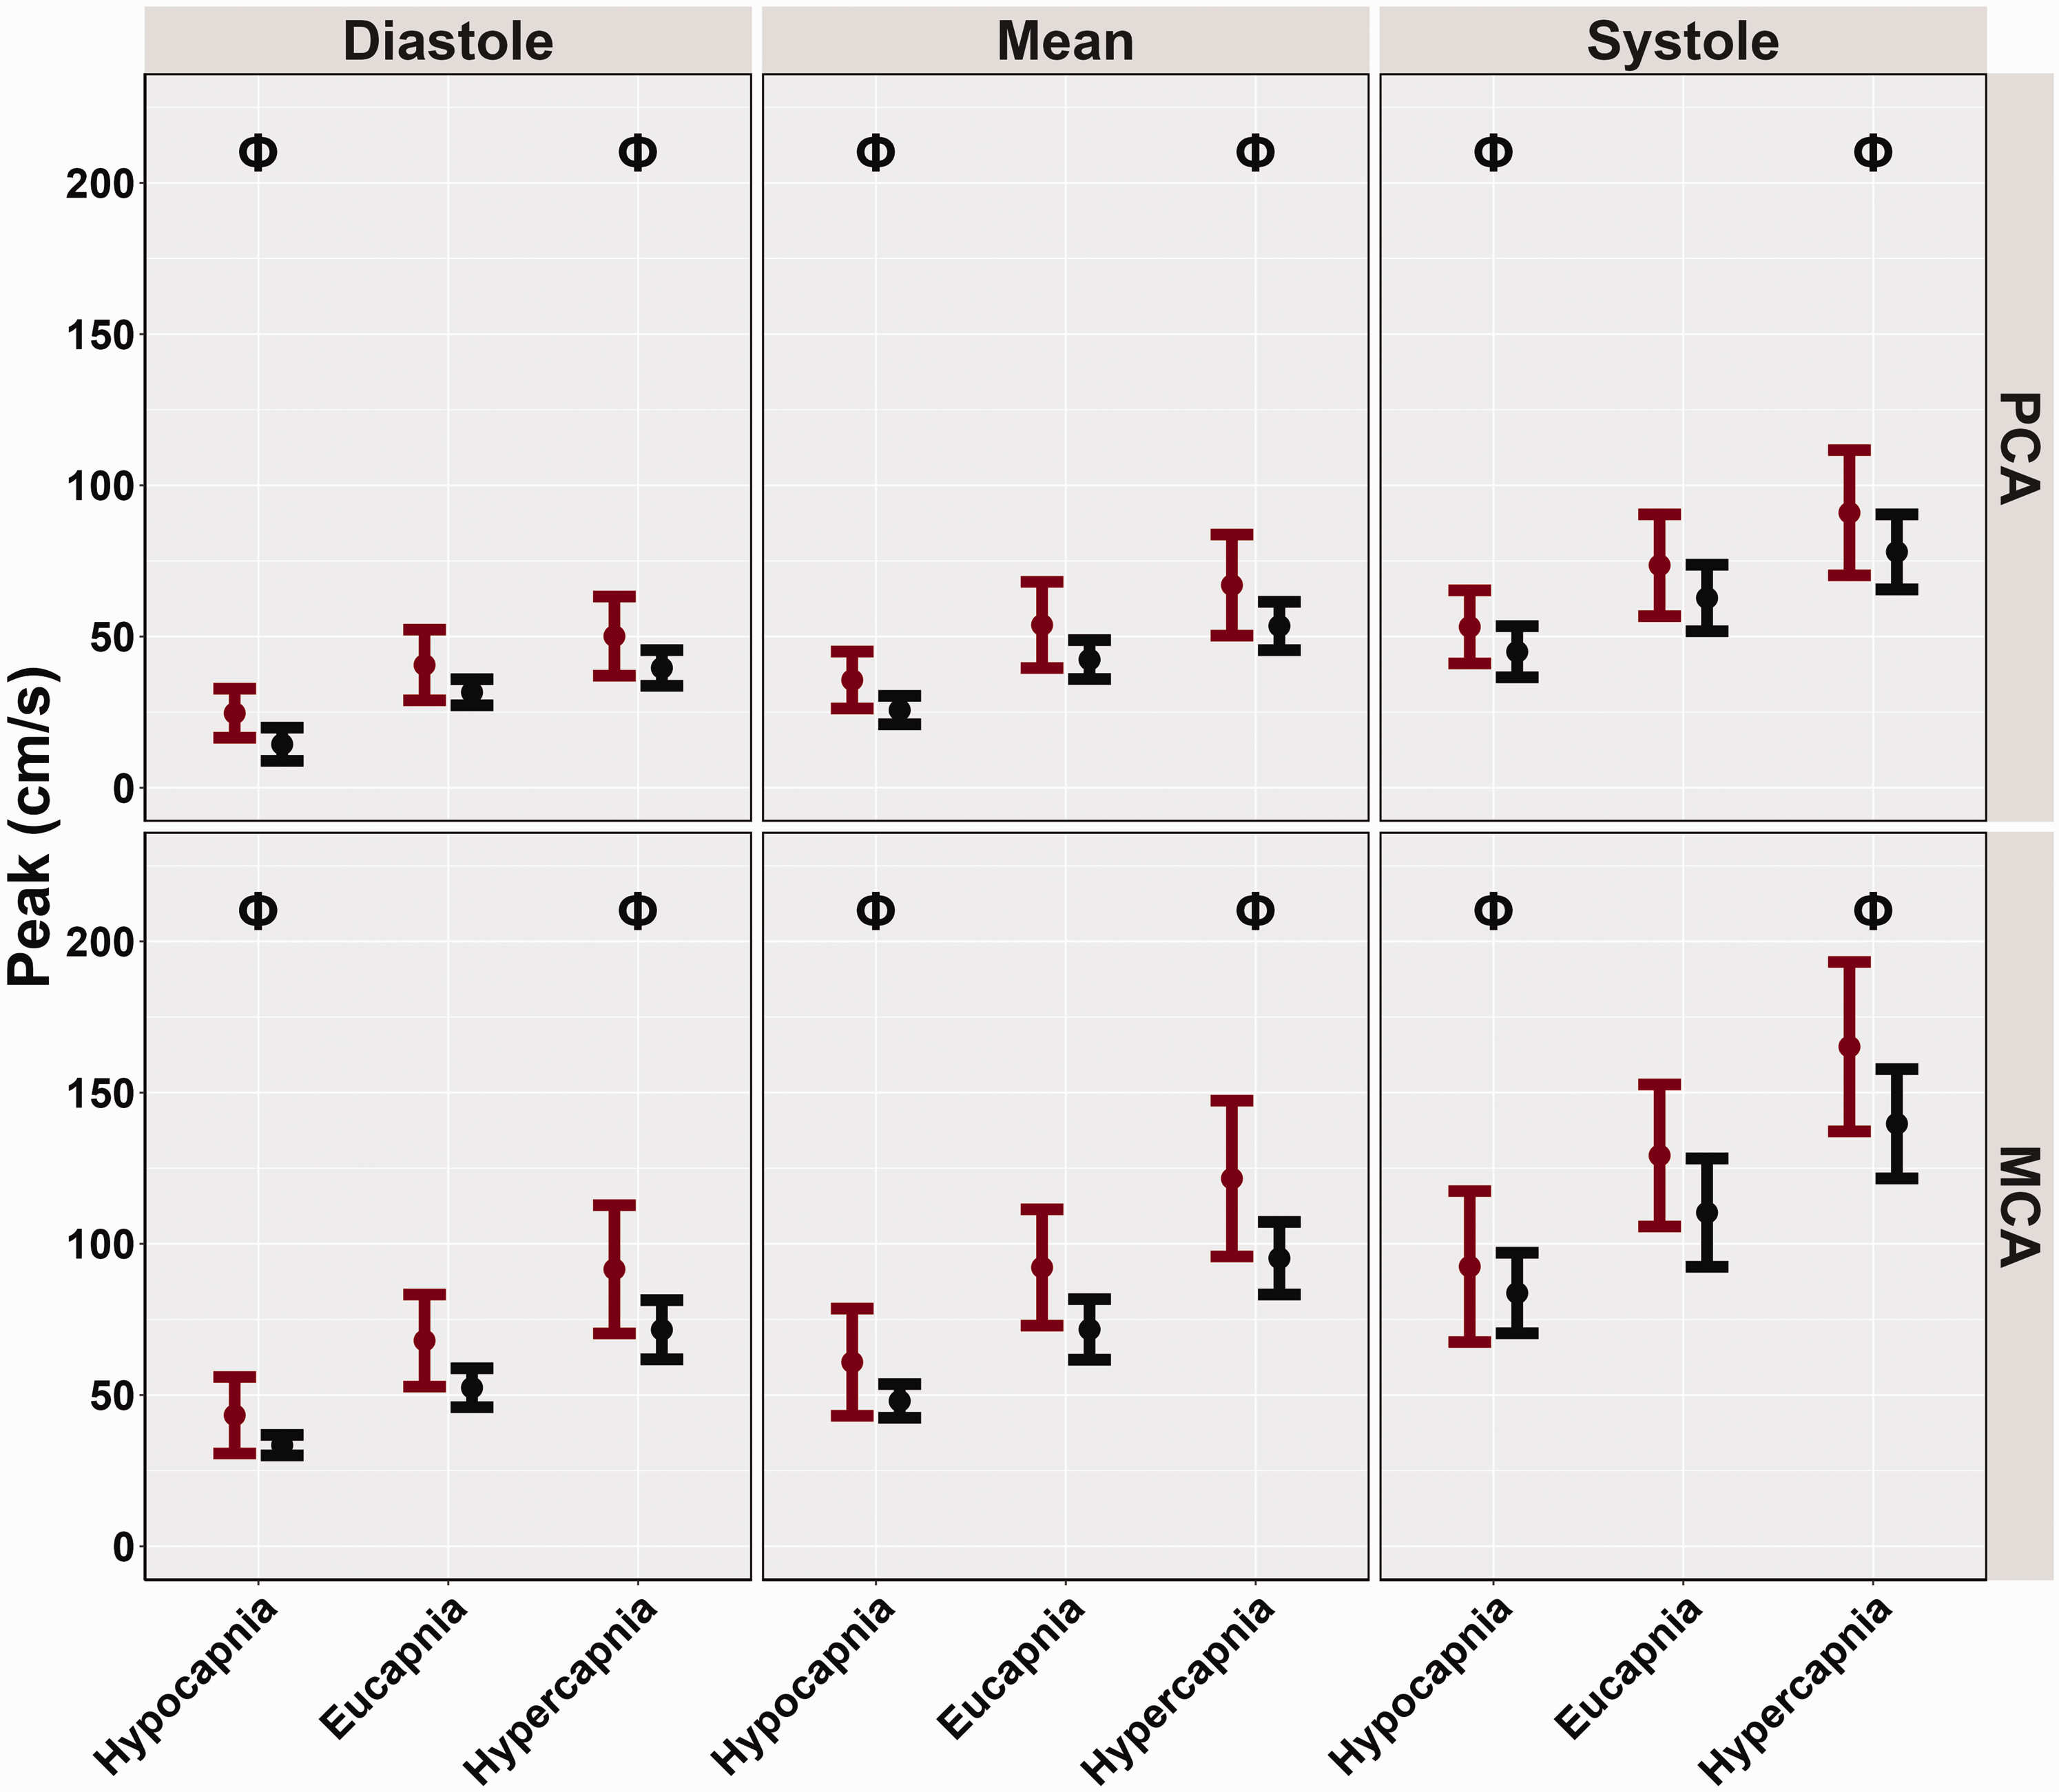
Peak cerebral blood velocities (cm/s) obtained from participants’ posterior cerebral artery (PCA) and middle cerebral artery (MCA) across the cardiac cycle during a “Where's Waldo” neurovascular coupling (NVC) challenge. The NVC challenge was performed under three separate conditions: hypocapnia, eucapnia, and hypercapnia. The data are categorized by sex, with females represented in red (n = 10) and males in black (n = 10). The Phi symbol (Φ) indicates a stage significantly different from the eucapnia stage, determined by linear regressions with stages (eucapnia as reference) and sex (female as reference) predictor variables. The Psi (Ψ) highlights sex differences observed across the three stages (hypocapnia, eucapnia, hypercapnia).
The relative increase in PCAv was greater during hypocapnia diastole (p < 0.001), lower in systole (p = 0.007), and similar in mean (p = 0.131) compared to eucapnic conditions (Table 3 and Figure 3). No differences in MCA relative increase were noted across the cardiac cycle when comparing hypocapnic to eucapnic trials (all p > 0.444) (Table 3 and Figure 3). During hypercapnic stages, the relative PCAv increase was lower during systole (p < 0.001, LR p < 0.001) and mean (p < 0.001, LR p < 0.001) (Table 3 and Figure 3). However, no differences in hypercapnic diastole PCAv were found compared to eucapnic relative increase (p = 0.101) (Table 3 and Figure 3). Throughout the hypercapnic trials, the relative MCAv increase was lower across the cardiac cycle (all p < 0.002, all LR p < 0.001) (Table 3 and Figure 3). No biological sex differences were recorded across conditions and the cardiac cycle in both PCAv (all p > 0.511) and MCAv (all p > 0.592) relative increase metrics (Table 3 and Figure 3). Across conditions and across the cardiac cycle, relative increase metrics displayed small biological sex effect sizes, as all effect sizes were discovered to be below 0.107.
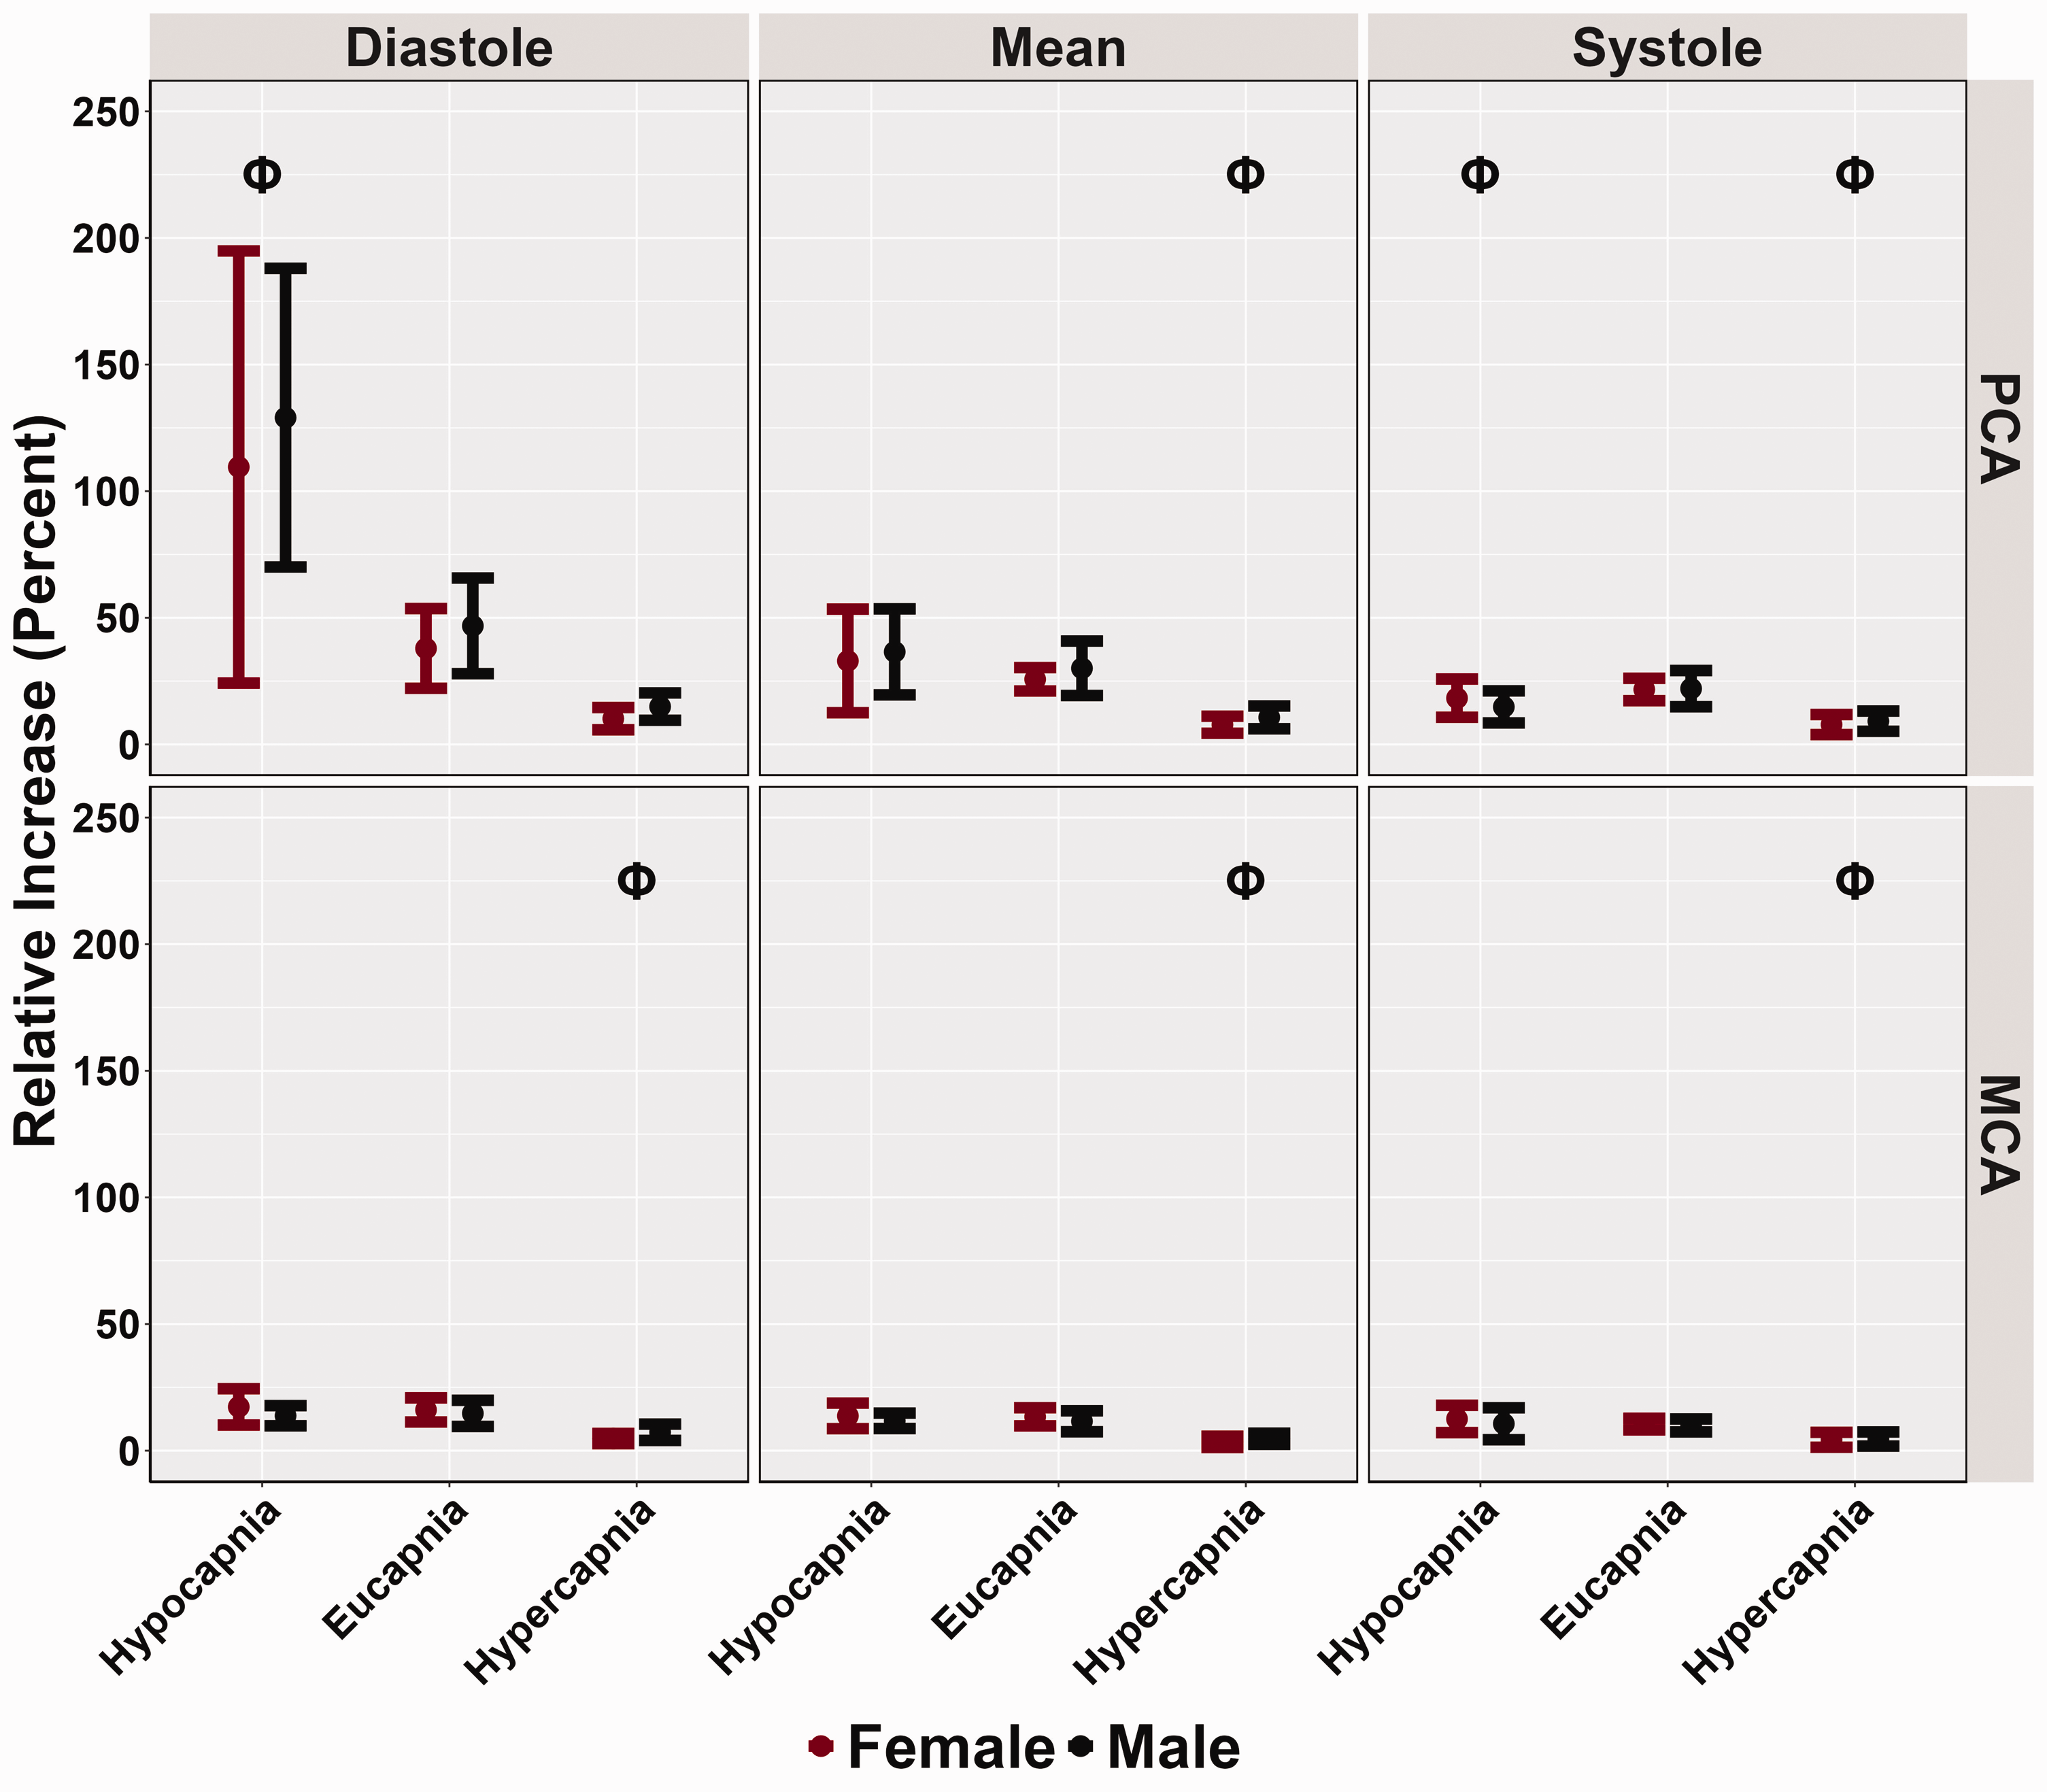
Relative increase (%) obtained from participants’ posterior cerebral artery (PCA) and middle cerebral artery (MCA) across the cardiac cycle during a “Where's Waldo” neurovascular coupling (NVC) challenge. The NVC challenge was performed under three separate conditions: hypocapnia, eucapnia, and hypercapnia. The data are categorized by sex, with females represented in red (n = 10) and males in black (n = 10). The Phi symbol (Φ) indicates a stage significantly different from the eucapnia stage, determined by linear regressions with stages (eucapnia as reference) and sex (female as reference) predictor variables. The Psi (Ψ) highlights sex differences observed across the three stages (hypocapnia, eucapnia, hypercapnia).
The PCAv AUC30 was reduced across the cardiac cycle during both hypocapnia (all p < 0.012, all LR p < 0.001) and hypercapnia (all p < 0.001, all LR p < 0.001) compared to eucapnic trials (Table 3 and Figure 4). Compared to the reference stage, the systolic MCAv AUC30 was lower during hypocapnic conditions (p = 0.003, LR p < 0.001) and remained similar for diastolic (p = 0.113) and mean (p = 0.093) components of the cardiac cycle (Table 3 and Figure 4). During hypercapnic trials, MCAv AUC30 was lower across the cardiac cycle when compared to eucapnic trials (all p < 0.001, all LR p < 0.001) (Table 3 and Figure 4). No biological sex differences were found within AUC30 metrics across the cardiac cycle for PCAv (all p > 0.618) and MCAv (all p > 0.351) (Table 3 and Figure 4). Finally, across all conditions and the cardiac cycle, small biological sex effect sizes were noted, as all effect sizes were determined to be below 0.115.
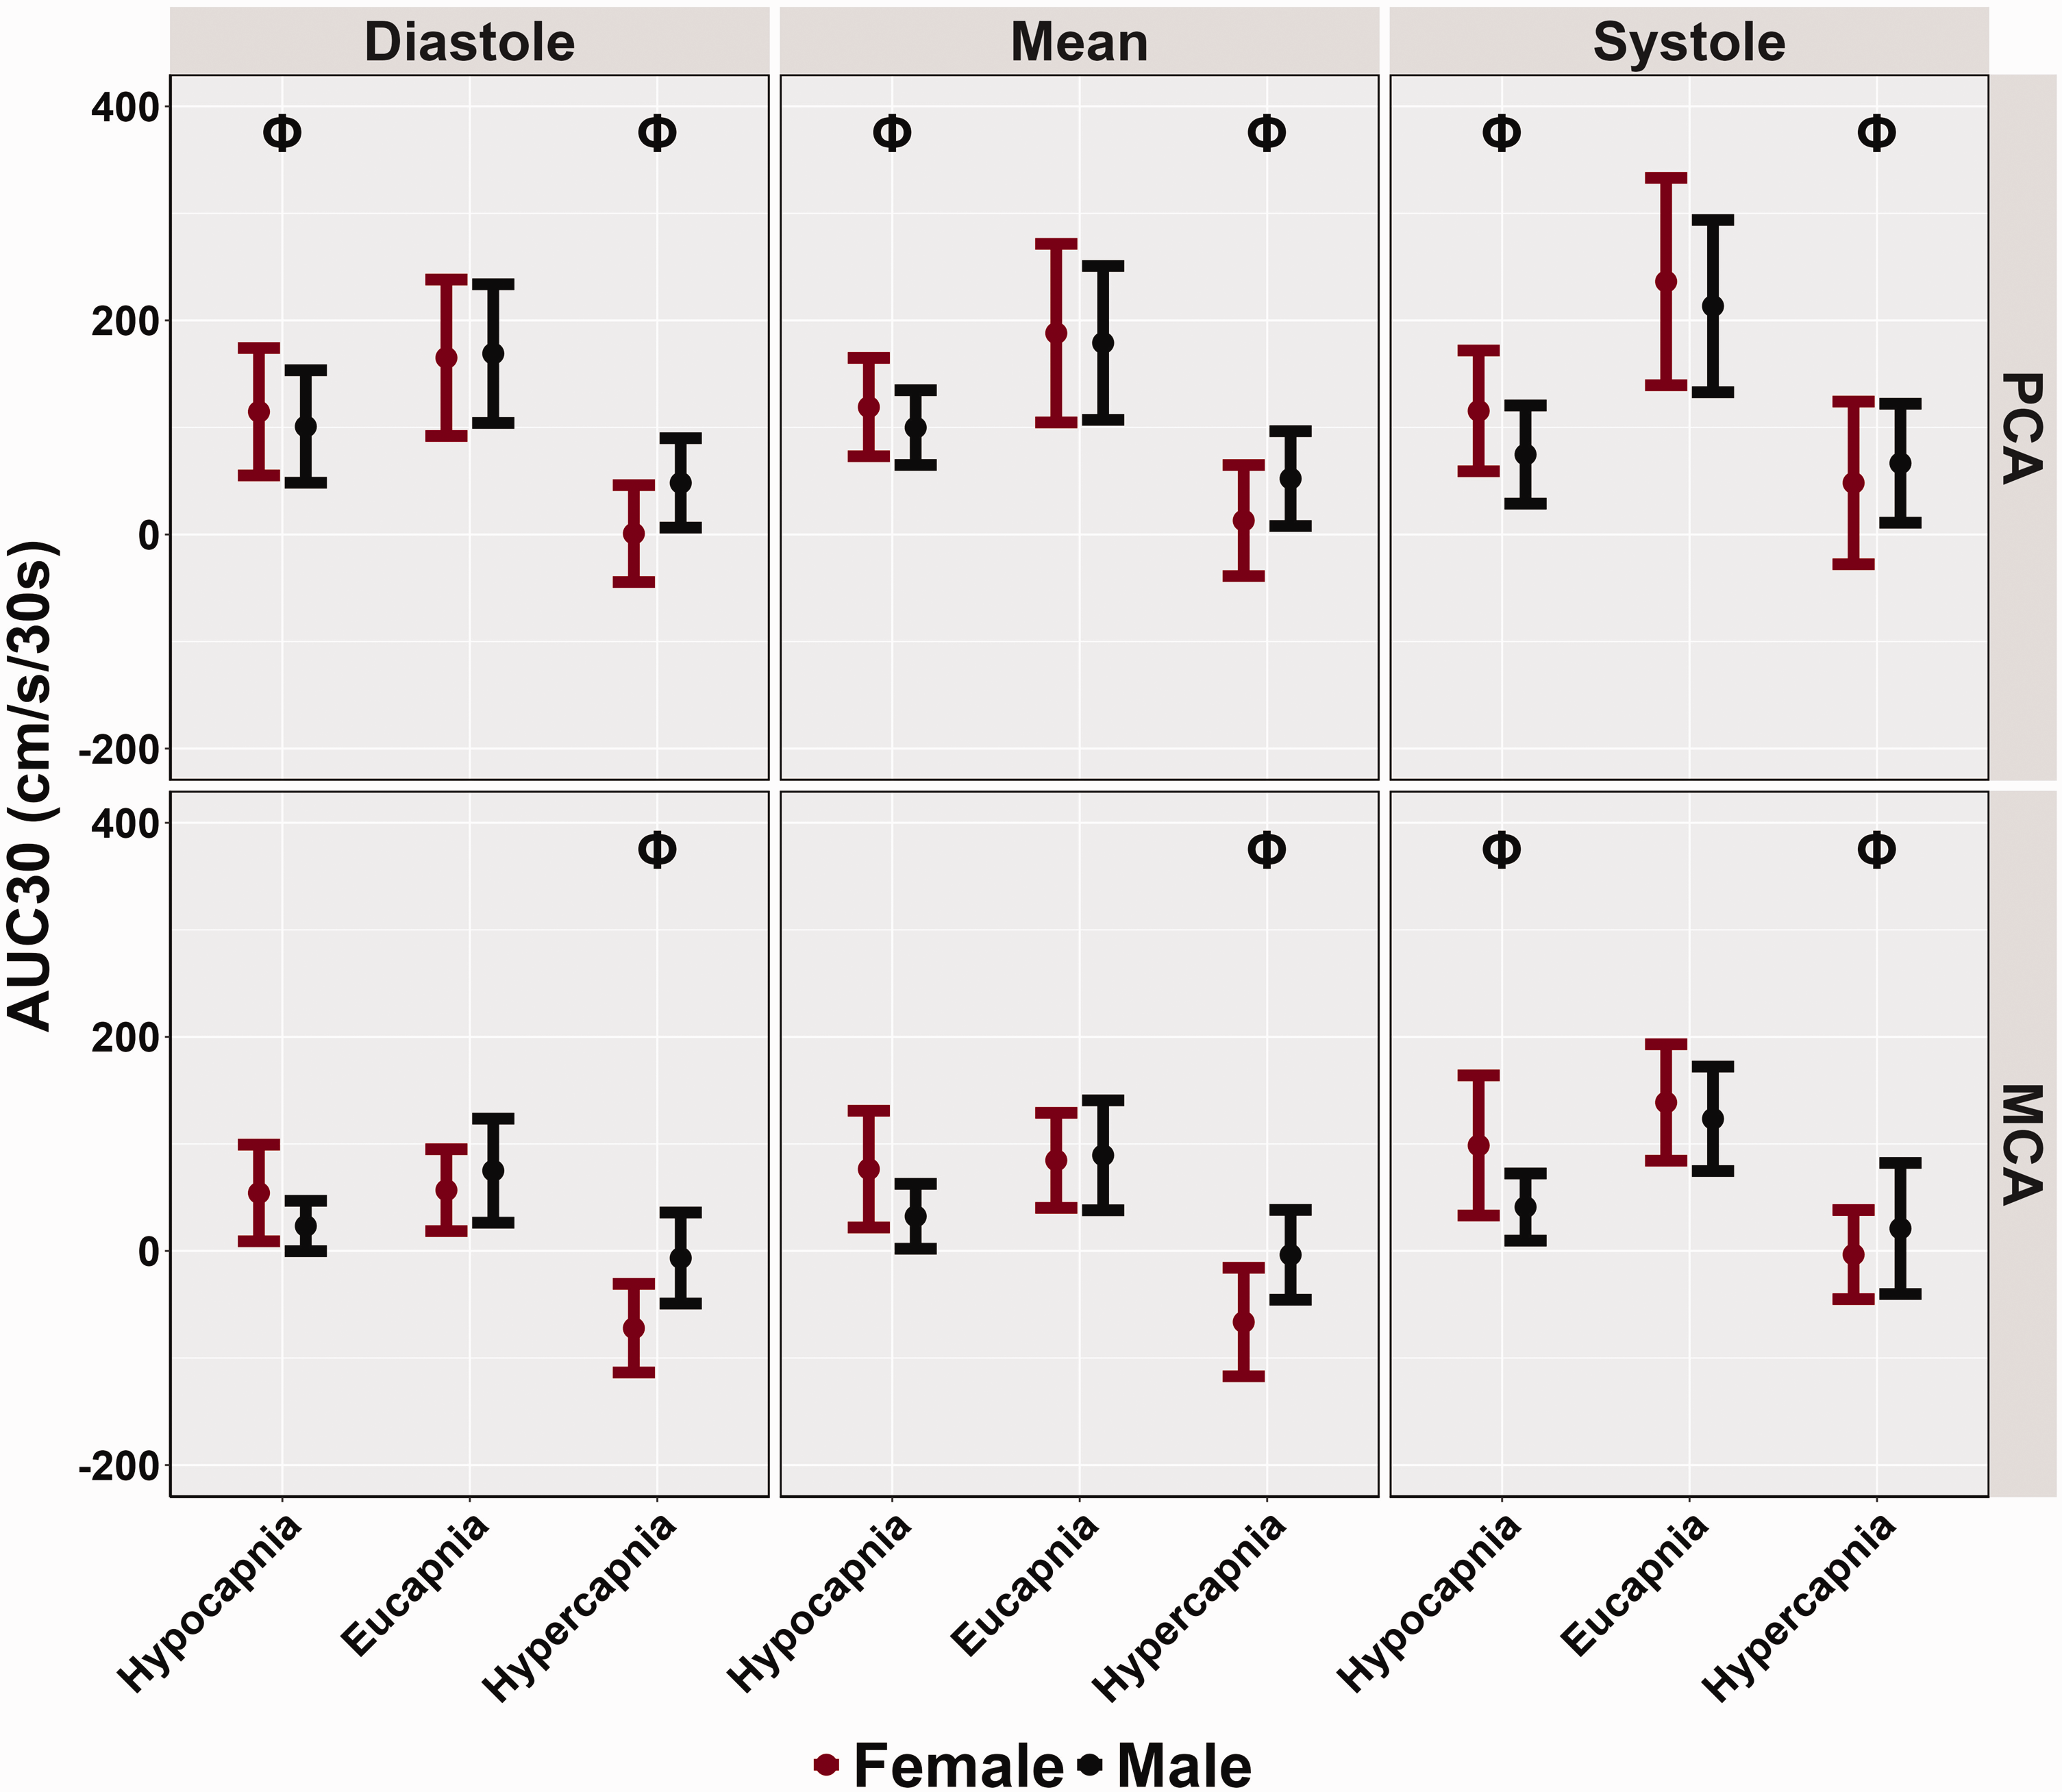
Area under the curve during 30 seconds of task engagement (AUC30) obtained from participants’ posterior cerebral artery (PCA) and middle cerebral artery (MCA) across the cardiac cycle during a “Where's Waldo” neurovascular coupling (NVC) challenge. The NVC challenge was performed under three separate conditions: hypocapnia, eucapnia, and hypercapnia. The data are categorized by sex, with females represented in red (n = 10) and males in black (n = 10). The Phi symbol (Φ) indicates a stage significantly different from the eucapnia stage, determined by linear regressions with stages (eucapnia as reference) and sex (female as reference) predictor variables. The Psi (Ψ) highlights sex differences observed across the three stages (hypocapnia, eucapnia, hypercapnia).
Discussion
The primary findings from this investigation were three-fold: 1) During hypocapnic trials, both MCAv and PCAv AUC30 were reduced, 2) Throughout the hypercapnic stage, PCAv AUC30 was lower across the cardiac cycle, and in the systolic component of the MCAv AUC30, with no changes reported in mean and diastole components, and 3) When accounting for individual variability through the LME modeling, minimal sex differences were observed in any NVC metrics (besides greater baseline diastolic PCA) across all conditions and across the cardiac cycle (Table 3).
Comparisons with previous literature
Numerous studies have explored temporal NVC responses under eucapnic conditions.5,17,18,56 –59 Previous research has shown females have higher levels of resting CBF.60 –63 In the current investigation, females displayed greater CBv for all baseline and peak metrics across the cardiac cycle; however, only PCA diastolic baseline measures showed significant biological sex differences (Table 3, Figures 1 and 2). Additionally, no disparities were found in the relative percent increase and AUC30 metrics, which characterize the NVC response (Table 3, Figures 3 and 4). These findings somewhat contrast with previous literature,14,28,58 which reports biological sex differences in baseline and peak CBv but no differences in relative increase or AUC30, despite using the same complex visual scene search paradigm. Furthermore, recent research has demonstrated that sex differences may depend on age as these factors jointly model the NVC response. 59 The difference in findings is likely due to the statistical analysis performed in each study. The current investigation employed LME modeling conditioning on individual, which better controls for within subject differences which may confound investigations of sex differences when within-individual variability is not considered. Furthermore, several male participants displayed higher than expected CBv, which may explain the lack of observed biological sex differences. CBv is known to be elevated in females compared to males,64,65 thus the unexpected CBv in the male participants may have disguised the effect of sex in this sample. A previous study conducted by Alwatban and colleagues 66 indicates that for 18–30 year olds, the average MCAv for females is 70.5 +/− 12.7, whereas for males it is 59.5 +/− 10.3. The current investigation used a similar age population, however, five males displayed larger than expected CBv, with an average mean MCAv of 81.89 cm/s, and an average mean PCAv of 41.96 cm/s. Finally, as the study did not have sufficient power to investigate biological sex differences across the individual stages, the three conditions were combined to examine these discrepancies. This may have influenced the results and could partially explain the differences observed in baseline and peak metrics in the current results (Table 3) compared with compared to previous literature.14,28 Nevertheless, the LME outputs suggests that while baseline and peak, diastolic and mean MCAv and PCAv did not reach the conventional significance of 0.05 with p-values ranging from 0.048 and 0.075 (Table 3). However, the consistent trend across baseline and peak diastolic measures points toward a probable sex difference (Table 3), consistent with previous work. In contrast, the relative increase in CBv and AUC p-values (ranging from 0.351 to 0.719) are consistently far from this threshold, indicating a lack of evidence for sex differences in those comparisons (Table 3).
Previous literature investigating the hypocapnic NVC response in both sexes observed reduced peak responses during hypocapnia compared to eucapnia, though with differing levels of hypocapnia (Δ −5–10 mmHg via hyperventilation compared to PETCO clamped at 25 mmHg via end tidal forcing) and employing different visual stimuli (strobe light vs. Where’s Waldo) compared to the present study.27,28 While this research included both sexes, the data was aggregated and sex differences were not explored 27 These studies, which both employed a visual stimulus, differed in that one found no change in mean PCAv and area under the curve (AUC) between conditions 27 while the other showed a reduced response. 28 However, this study differed from Bader and colleagues in the AUC30 findings, as PCAv AUC30 was observed to be lower across the cardiac cycle (Table 3 and Figure 4). These differences could be attributed to the PETCO2 metrics utilized, as the current investigation clamped PETCO2 at 25 mmHg for the hypocapnic trials (−15 Torr), while the aforementioned study used −10 Torr for the largest hypocapnic stimulus. Moreover, the two investigations employed different NVC challenges, with Bader et al. 27 using a visual stimulus with strobe lights, whereas the current investigation utilized a complex visual scene-search paradigm (“Where’s Waldo?”). A more complex and demanding task is likely to recruit a larger neurological response, in turn increasing the neurometabolic demand which elicits a larger compensation by the intracranial arteries via the neurovascular coupling response, thus enhancing the signal-to-noise ratio.16,28 While the results from Szabo and colleagues 26 are consistent with the findings of the current investigation (Table 3, Figures 1 and 2), and those from Bader and colleagues, 27 the relative increase was reported to be reduced during hypocapnic conditions compared to eucapnic trials. 26 These findings diverge slightly from the present investigation, which showed that during hypocapnia, the PCAv relative increase was greater in diastole, similar in mean, and reduced in systole, while no differences were found within MCAv relative increase (Table 3 and Figure 3). The differences between findings for the mean relative increase may be attributed to the different NVC challenges used, as both studies employed similar PETCO2 levels for hypocapnic and eucapnic conditions. 26
Additionally, although there is limited research on the effects of hypercapnia on NVC using visual stimuli, a study conducted by Davies and colleagues 67 employed a patterned counting task as well as a cognitive backwards counting stimulus to study NVC during hypercapnia. They induced hypercapnia using a 5% CO2 gas inhalation and measured % change in the NVC response do the gas inhalation. 67 The Davies study observed a much smaller change during hypercapnia (3–15% depending on task) than the present study, likely due to the methodological differences in the hypercapnic stimuli and the NVC task. 67 The present results may be more striking due to the tighter control of PETCO2 using end tidal forcing, and the more robust NVC response to the ‘Where’s Waldo’ visual task. In another study, Maggio and colleagues 24 employed a passive motor paradigm involving repetitive flexion and extension of participants’ elbows under eucapnic and hypercapnic conditions. Similarly, biological sex differences were not reported, as data was collapsed across biological sexes. In their protocol, hypercapnia was induced by breathing a mixture of 5% CO2 through a mask, and bilateral MCAs were monitored to observe changes in CBv which found that AUC30 was lower during the hypercapnic NVC challenge. 24 These results align with the findings from the current investigation, which also reported lower AUC30 during hypercapnic trials in both the MCAv and PCAv and across all components of the cardiac cycle (Table 3 and Figure 4). More recently, a study examined the influence of age on hypercapnic and hypocapnic NVC during a cognitive paradigm. 67 In agreement with the current findings, Davies and colleagues observed a reduction in the NVC response during hypercapnia (elicited by 5% CO2 gas inhalation) and hypocapnia (hyperventilation). Additionally, they reported no absolute change differences, but found that middle aged participants displayed a ‘younger’ NVC response during hypercapnia and an ‘older’ response during hypocapnia. 67
Physiological underpinnings of the tasks
While the NVC response is mostly nitric oxide-driven, recent pharmacological blockade studies have demonstrated that unknown mechanisms account for roughly 1/3 of the response. 68 , animal research has suggested that CO2, a metabolite on neural metabolism, mediates the neurovascular coupling response, given that local CO2 saturation abolishes the neurovascular coupling response. 69 In the present study, hypercapnia induced global increases in both baseline and peak (Table 3, Figures 1 and 2) CBv. However, there was a decrease in relative percent increase and AUC30 during hypercapnic trials, showing a smaller NVC response (Table 3, Figures 3 and 4). The increase in baseline and peak CBv is attributed to hypercapnic vasodilation, which occurs due to increased inspiration of CO2, H+ ions, reductions in pH, and relaxation of smooth muscle cells. 70 One possible physiological reason for the decreased relative percent increase and AUC30 noted during the “Where’s Waldo?” NVC task under hypercapnic conditions is that hypercapnia induces considerable vasodilation, restricting cerebral blood vessels from further dilating in response to localized activation changes.71,72 This physiological phenomenon is referred to as “vasodilatory reserve” and indicates that the NVC response and cerebrovascular reactivity response overlap in mechanism, perhaps related to the observation that the majority of glucose consumed by neurons during a period of neuronal excitation becomes CO2.69,73 However, the relative increase and AUC30 were still elevated compared to the baseline during the hypercapnic trials (Table 3, Figures 3 and 4), suggesting that, in accordance with the animal literature, other mechanisms are also in part influencing the NVC response. This demonstrates the complex interplay of various physiological factors in regulating CBv during altered PETCO2 levels.
Hypocapnia, however, may increase the vasodilatory reserve. In the present study, during hypocapnic trials, both baseline and peak CBv were decreased (Table 3, Figures 1 and 2). Additionally, the hypocapnic condition induced greater relative percent increases in PCA diastolic CBv, reduced systolic relative percent increases, and reductions in AUC30 compared to eucapnic trials (Table 3, Figures 3 and 4). Previous studies have demonstrated that hypocapnia induces reductions in CBF due to its vasoconstrictive effects on the cerebral vasculature. 74 This vasoconstrictive effect of hypocapnia may inhibit the NVC response, contributing to the reductions in AUC30 observed during NVC challenges (Table 3 and Figure 4). Additionally, decreases in cerebral perfusion and oxygen delivery induced by hypocapnia may result in brain tissue hypoxia, further diminishing the NVC response. 75
Recent evidence suggests that blood pressure changes may influence the NVC response in humans, suggesting an interaction between dynamic Cerebral Autoregulation (dCA) and NVC. A study by Ladthavorlaphatt et al. 76 characterized individuals into “responders” or “non-responders” based on their dCA response to neural activation. This stratification demonstrated that some individual’s vascular responses may be less efficient in regulating blood flow during moments of heightened neural demand, especially under variable CO2 levels. However, an important distinction between studies is that Ladthavorlaphatt et al. 76 obtained their estimates from a singular trial, across 3-minutes (1-minute rest period, 1-minute task activation, 1-minute recovery period). Observations of a singular trial would indeed be more influenced by changes in blood pressure and other physiological contaminations. Moreover, these authors used a cognitive task to elicit the NVC response, 45 which does not elicit as robust a response as the visual paradigm employed in the current investigation. Therefore, while it is the case that dCA metrics such as autoregulation index vary by sex and end-tidal CO2 level, 77 in the present study, the combination of repetitive trials and a more engaging task would attenuate the confounding ‘noise’ of other physiological fluctuations such as the dCA response to changing blood pressure. Nonetheless, had the analysis been conducted over time using a moving average or similar techniques, accounting for blood pressure fluctuations would have been essential to accurately interpret the NVC response. This approach would allow for a clearer understanding of how dCA interacts with NVC, particularly under conditions of dynamic blood pressure changes, which warrants further investigation.
Furthermore, while the demands of the hypercapnic condition in the current study may have elicited an increase in stress, associated with a relatively heightened sympathetic state, autonomic control of the cerebrovasculature is of significantly smaller magnitude compared to the NVC and CO2 tensions, suggesting that these effects would have negligible impacts on the observed responses. 78 The comparison of these regulatory mechanisms is described in more detail in Figure 1 of Smith and Ainsley (2017).
Limitations
A primary limitation of the experimental setup is the utilization of TCD to assess participants’ CBF throughout the protocol. TCD employs CBv as a proxy for CBF due to its inability to directly measure vessel diameter. 20 Consequently, it operates under the assumption that vessel diameter remains constant throughout the protocol. 20 Nonetheless, previous studies employing functional magnetic resonance imaging have suggested that CBv remains relatively stable within 8 mmHg of eucapnic values.79,80 Despite attempts to regulate PETCO2 levels at precise targets to surpass the suggested ∼8 mmHg range (i.e., 40 mmHg for eucapnia, 55 mmHg for hypercapnia, and 25 mmHg for hypocapnia), the observed results align with prior studies, bolstering confidence in the current findings.
Furthermore, the study recruited a convenience sample from around the university including graduate students and staff. The sample of healthy, young, and likely higher socioeconomic status adults limits the generalizability of the findings to other populations such as those with brain injuries, older individuals, those with a lower socioeconomic status or people with less compliant brain blood vessels. Furthermore, since culture and ethnicity were not assessed in this study, generalisability across cultures or ethnicities cannot be inferred. Future research targeting the associations between culture, ethnicity and cerebral hemodynamics is warranted. Additionally, all participants in this study identified as cis-gendered, restricting the study’s ability to comment on the associations between gender and NVC response. Future studies should aim to recruit non-cis-gender individuals to better understand the interplay between the societal influence of gender and cerebrovascular research. Moreover, the influence of the menstrual cycle phase, hormonal contraceptive use and cardiac fitness status was not accounted for in the present study. Therefore, future studies are warranted to investigate whether the menstrual cycle phase, contraceptive use, and cardiac fitness influence NVC responses. Sex differences were collapsed across conditions, as the current study did not have the subsequent power to examine biological sex differences across all individual stages albeit the trends were consistent with previous findings. 28 Nonetheless, each participant underwent all three conditions during a single visit, effectively serving as their own controls in eucapnic conditions across hypercapnic and hypocapnic trials. This approach minimizes the influence of potential confounding factors in task comparisons. 50
Conclusions
The aim of this study was to investigate the influence of CVR on NVC responses during a complex visual search task (“Where’s Waldo?”). The findings revealed decreases in PCAv and MCAv AUC30 throughout the cardiac cycle in both hypercapnic and hypocapnic conditions. Additionally, sex differences were only observed in baseline PCA diastole measures, with females showing higher absolute CBv. No significant differences between sexes were found in the main NVC metrics, such as relative percent increase and AUC30, across all trials. These results suggest that while both hypo- and hypercapnia have notable effects on the overall NVC response, there is minimal impact related to biological sex on these robust stimuli. The cerebrovasculature in both females and males appears to respond robustly to neural activation even under significant alterations in CO2 tensions. Further research is needed to differentiate between metabolic and hemodynamic changes associated with altered carbon dioxide levels and their impact on temporal NVC responses.
Footnotes
Data availability
The data supporting the findings from this project are available upon reasonable request to the corresponding author (M.G.N).
Funding
The author(s) disclosed receipt of the following financial support for the research, authorship, and/or publication of this article: This project was supported by the Natural Sciences and Engineering research Council (NSERC: RGPIN-2020-04057) (J.D.S).
Declaration of conflicting interests
The author(s) declared no potential conflicts of interest with respect to the research, authorship, and/or publication of this article.