
Abstract
Spontaneous cerebral vasomotion, characterized by ∼0.1 Hz rhythmic contractility, is crucial for brain homeostasis. However, our understanding of vasomotion is limited due to a lack of high-precision analytical methods to determine single vasomotion events at basal levels. Here, we developed a novel strategy that integrates a baseline smoothing algorithm, allowing precise measurements of vasodynamics and concomitant Ca2+ dynamics in mouse cerebral vasculature imaged by two-photon microscopy. We identified several previously unrecognized vasomotion properties under different physiological and pathological conditions, especially in ischemic stroke, which is a highly harmful brain disease that results from vessel occlusion. First, the dynamic characteristics between SMCs Ca2+ and corresponding arteriolar vasomotion are correlated. Second, compared to previous diameter-based estimations, our radius-based measurements reveal anisotropic vascular movements, enabling a more precise determination of the latency between smooth muscle cell (SMC) Ca2+ activity and vasoconstriction. Third, we characterized single vasomotion event kinetics at scales of less than 4 seconds. Finally, following pathological vasoconstrictions induced by ischemic stroke, vasoactive arterioles entered an inert state and persisted despite recanalization. In summary, we developed a highly accurate technique for analyzing spontaneous vasomotion, and our data suggested a potential strategy to reduce stroke damage by promoting vasomotion recovery.
Introduction
Vasomotion has been described as vascular smooth muscle cell (SMC)-initiated spontaneous oscillation relatively independent of pulsatile blood flow.1,2 It is characterized by 0.1 Hz sinusoidal changes in vessel diameter,3 –5 regulating cerebral blood flow6,7 (CBF). Spontaneous vasomotion influences both the central nervous system and peripheral systems. In the central nervous system, vasomotion reflected by basal fluctuations in blood oxygenation is related to resting-state neural activity.1,8 Recently, vascular optogenetics revealed that enhanced vasomotor activity promotes cerebral spinal fluid influx to the brain parenchyma. 9 As for the peripheral systems, vasomotion modulates fluid filtration pressure in the pulmonary vessels and promotes interstitial fluid clearance in rabbit ear skin.10,11 Moreover, for testes, vasomotion is essential for normal function.12 –14 These findings highlighted the importance of spontaneous vasomotion in tissue homeostasis in both peripheral and central systems.
Vasomotion dysfunction is associated with neuropathies8,15 and oscillatory blood flow at 0.1 Hz has been shown to promote cerebral tissue oxygenation during reduced CBF in human in clinical trials and under high-altitude conditions.16,17 Moreover, vasomotion can drive cerebral paravascular clearance of metabolic waste which can prevent the pathogenesis of Alzheimer’s disease (AD).1,8 These findings highlighted that vasomotion research may support the development of therapeutics for brain diseases such as stroke, AD, and vascular dementia. 18
Moreover, ischemic stroke is a leading cause of mortality and disability worldwide, characterized by the sudden interruption of blood flow to the brain, resulting in severe neurological deficits. The suppressed vasomotion has been proven to be closely associated with blood flow dysfunction in stroke. 19 Meanwhile the vaso-dynamic deficits after successful recanalization have been linked to stroke recurrence and poor recovery. 20 Mouse models consistently demonstrated pathological SMC constrictions during occlusion that prevent re-establishment of blood flow. 21 This pathological constriction occurs immediately after the onset of spreading depolarization during the hyperacute ischemic phase. However, whether this early SMC constriction leads to secondary, prolonged SMC functional deficits during vasomotion has yet been determined. Understanding this pathological progression may reveal stroke characteristics, leading to the development of new methods to prevent delayed neural damage progression.
However, our current understanding of cerebral vasomotion is not comprehensive. A cellular oscillator, which can be visualized by intracellular Ca2+ is necessary for the generation of vasomotion. 22 In the central nervous system, SMCs with synchronized Ca2+ fluctuations 23 are responsible for the self-generated component of vasomotion independent of external factors such as respiratory rhythms and heart beats.1,23,24 Therefore, it is crucial to explore the connection between fluctuating SMC calcium and arteriolar vasomotion for vasomotion research.
To characterize vasomotion, the vascular diameters are usually measured with two-photon microscopy. The vessel diameter is defined as the distance between bilateral vessel walls and calculated using the full width at half maximum (FWHM) methods. 25 A recently developed vasomotion index integrates multiple features of vasomotion into one general parameter by calculating the area under diameter-change curve over time; however, this method cannot identify individual events. 6 Moreover, the research on vasomotion focuses on the attributes in frequency domain due to the complexity of vasomotion signals in the time domain.8,26 In summary, many other important aspects of vasomotion remained uncharacterized. Determination of a suitable baseline for identification of events in basal vasomotion is critical for comparison of vasomotion properties between physiological and pathological states. However, neither the minimal nor the average vascular diameter could identify vasomotion events under resting-state due to insensitive baseline threshold, although they are frequently used to differentiate large vasomotion signals under a series of stimulation paradigms.27,28
Here, we integrated multiple algorithms to develop a high-precision analytical method, allowing the quantification of various vasomotion indices. These algorithms include vasomotion and calcium kinetics identification through the ‘F0 smoothing’ algorithm 29 combined with outlier detection, vessel radius definition, time-series curve similarity comparisons through dynamic time warping (DTW), time lag estimation between SMC calcium fluctuations and vasomotion based on sliding cross-correlation values, and arteriolar propagation index quantification through correlation coefficient (CC) maps. This method, while detecting known vasomotion properties, showed more comprehensive vasomotion characteristics. With this novel method, we identified single vasomotion event kinetics and found a shorter latency than previously known between Ca2+ increase and arteriole contraction. Furthermore, we identified the cessation of arteriole vasomotion after stroke. Our results have gained a deeper understanding of vasomotion, cerebral vessel networks and ischemic stroke.
Materials and methods
Animals
All mice procedures complied with the Institutional Animal Care and Use Committee guidelines of the School of Life Sciences, Westlake University (approval no. 20-033-JJM). All the animal experiments were conducted in accordance with the ARRIVE 2.0 guidelines. 30 The following mouse strains were used: wild type (C57BL/6J), SMACreER, 31 Ai14 (JAX: 007914), Ai47, 32 Ai96 (JAX: 028866). All mice were bred and maintained in a specific-pathogen-free animal room on a 12-hour light-dark cycle and provided food and water ad libitum at Westlake University Laboratory Animal Resource Center (LARC). All experiments used mice offspring aged 2 to 6 months. All awake mice were male and the anesthetized mice used for stroke research included both male and female mice.
Experimental timeline
For conditional labeling of mural cell, an efficient temporally-controlled transgenic mouse line, the SMACreER mice were used. 31 For the induction of Cre expression, we performed tamoxifen (MCE, Cat# HY-13757A/CS-2870) administration (15 mg/ml dissolved in corn oil, 3 mg daily for three consecutive days through intraperitoneal injection) in adult mice 3 weeks before in vivo imaging. After cranial window implantation, mice were allowed to recover for 2 weeks prior to imaging, to ensure that surgery-related inflammation has resolved.
Anesthesia
The mice were anesthetized by using the following three types of anesthetics: Isoflurane gas (1.5% inhaled air), avertin (16 ml/kg, 2.5% tribromoethyl alcohol, T48402; 2.5% 2-methyl-2-butanol, 240486; Sigma-Aldrich (U.S.)) and 1% pentobarbital sodium intraperitoneally injected (10 ml/kg). Core temperature was kept constant at 37°C using a homeothermic heating blanket system during all surgical and experimental procedures.
Cranial window surgery
The cranial surgery was performed by drilling a 3-mm round window on the anterolateral parietal bone overlying the middle cerebral artery (MCA) territory. Afterward, the cranial window was sealed with a 3-mm round glass coverslip (Warner Instruments, CS-3R, Cat# 64-0720) with cyanoacrylate glue (deli 502 super glue, Cat#No.7146).
Middle cerebral artery occlusion (MCAO) surgery
Focal cerebral ischemia was induced by the middle cerebral artery occlusion (MCAO) method. 33 A surgical incision in the neck region was made to expose the right common carotid artery (CCA). After ligating the distal side and the proximal side of the CCA, a small incision was subsequently made between the two ligatures. Then, a silicon rubber-coated monofilament with a rounded tip (Diccol, Cat# 7023910PK5Re) was inserted intraluminally. The monofilament was introduced along the internal carotid artery until the origin of the MCA was occluded. The monofilament was left for 2 hours to induce transient focal cerebral ischemia. Afterward, reperfusion was performed by withdrawing the monofilament.
Two-photon in vivo and ex vivo imaging
Mice were live-imaged using a two-photon laser scanning microscope (Olympus, FLUOVIEW, FVMPE-RS) equipped with a cooled high-sensitivity GaAsP PMT detector and an ultrafast IR pulsed laser system (Spectra-Physics, InSight X3, continuous variable wavelength range 680–1300 nm). Pictures were acquired in a 512 × 512 pixels square with a 0.994-µm pixel size under a 25× water-immersion objective (Olympus, XLPLN25XWMP2, NA = 1.05). The mice had undergone a continuous three-day training period to habituate them to head fixation by fastening their head in a butterfly metal adaptor and to enable them to freely move on a treadmill under the microscope objective. During in vivo imaging measurements, the head-fixed mice were imaged awake during daytime. For vascular vasomotion detection in vivo, SMACreER:Ai14 (tdTomato), SMACreER:Ai47 (EGFP) mice were used to label the vascular walls. The vascular walls were also labeled by the fluorescein dye Alexa Fluo633 hydrazide (ThermoFisher, Cat#A30634) 34 through tail intravenous injection. Moreover, the FITC-dextran (sigma, Cat#FD2000S, 10 mg/ml) and RhoB-dextran (sigma, Cat#R9379, 10 mg/ml) were employed to detect vascular vasomotion which labels the plasma. For mural cell cytosolic calcium detection in vivo, SMACreER:Ai96 mice (GCamp6s reported) were used. A 960 nm wavelength excitation was used to locate SMC, detect calcium oscillation and vasculature. During ex vivo imaging measurements, the dissected mouse brain was labeled by the Tetramethylrhodamine (TMRM, ThermoFisher Cat#T668) in artificial cerebrospinal fluid (ACSF) at 37°C for two hours, 35 then the SMCs were imaged at 960 nm wavelength under 2PLSM. For research of the relationships between calcium dynamics and vasomotion, the built-in line-scan mode of the two-photon microscope was used to take time-lapse information (100–200 Hz).
Vessel diameter and corresponding SMC Ca2+ signal measurement
All time-lapse pictures were analyzed in Fiji (version 2.3.0/1.53f) and MATLAB (version R2021a; MathWorks) using custom-written scripts. The vessel-containing images were loaded into Matlab and then underwent gaussian filtering to reduce spatial noise. The vascular diameter changes over time was determined as FWHM of reslice profile. 25 In the calcium-signal-containing images, regions of interest (ROIs) were drawn on several SMCs according to their outline, and the calcium signal changes were detected by the average green fluorescence brightness of each SMC.
Vessel radius definition
For radius calculation, the midpoint line was generated by dividing individual diameter through two time series alongside each other, based on the calculated FWHM. To reduce the influence of errors in the data and extract a robust and appropriate radius boundary, the centerline is fitted by midpoint line using the least-square method (LSM) method. 36 The radius was determined as the distance between the centerline and the unilateral FWHM coordinates.
Power spectrum analysis
The Fast Fourier Transform (FFT) is employed to calculate the power spectral density of vessel diameter, radius, and mural cell calcium. The mice vasomotion and calcium signals (FFT length: 200, the overlap: 50%) under awake/anesthesia and the filtered power of the ultra-low frequency spectrum (0–0.3 Hz) were shown.
Pearson correlation coefficient and propagation index analysis
Previously, Pearson CC and propagation analysis was implemented not only to identify the functional connectivity between single-vessel spatiotemporal dynamics and neuronal intracellular calcium signals, 26 but also to identify spontaneous vasomotion propagation along pial arterioles in awake mouse brain. 28 We measured the vasomotion at different points with an interval of 2.5 µm along a distance of ±30 µm from a center position we chose from the arteriole. To show the degree of propagation of the vasomotion, the CC between the vasomotion at each position and the center point were demonstrated in the curve. The vasomotion synchronization 3D model, simultaneously presents the vasomotion propagation parameters of time, distance, filtered amplitude ratio, and CC curve. The average CC maps is shown as CC comparison of each vasomotion statistic position.
Time lag estimation between SMC calcium fluctuation and vasomotion
Based on the results of SMC calcium dynamic and arteriolar vasomotion from time-lapse images, there is a negative cross-correlation between the two.6,23 The time lag between SMC calcium and arteriolar vasomotion was presented as the moment when cross-correlation curve arrived the minimum (most negative correlation value).
Dynamic time warping (DTW) analysis
DTW is widely used to find an optimal alignment two time-dependent sequences by measuring their similarities under certain restrictions. 37 This robust method can be combined with CC to describe the similarity of different vasomotion patterns. Here, for the control group, we used the paired DTW distance comparison between time series of internal and external diameter to represent the minimal difference, as the internal and external diameter showed no significance in the properties of spontaneous vasomotion. Then the DTW between side1 and side2 radius was calculated and compared to the DTW of minimal difference (highest similarities) to quantify asymmetrical vasomotion.
Calcium and vasomotion index calculation
For myogenic vasomotion characterization, all data used for extracting the calcium and vasomotion index must follow a normal distribution. The calcium and vasomotion index were defined as quantitative indicators vasomotion events. 29 Here, we defined F0 for each time point as the eighth smallest value within a time window of 40 frames, starting from 20 frame before the time point to 20 frames after the time point. These F0 baseline points for each time point produced a time series called the ‘F0 smooth’. An event was defined as a peak where the maximum exceeded double of the standard deviation of the baseline. The kinetic quantification indices included frequency, SD of peak intervals (interval SD), absolute amplitude and amplitude ratio.
Rank distribution of blood vessels
We divided the arteriole segments naturally into four categories using the quartile numbers among the arteriole diameters we measured, which are 23.05 µm, 32.18 µm and 38.83 µm. 38 The detailed explanation of all algorithm-related formulas can be found in supplementary data.
Quantification and statistical analysis
The numerical data were extracted from the raw digital images and analyzed with Fiji or MATLAB. All graphical illustrations and statistical analyses were generated and performed using GraphPad Prism 8 software (version 8.3.1, California, USA). All statistical tests were two-tailed, and significance was assigned at p < 0.05. Normality between group samples were assessed using the Kolmogrov-Smirnov test, Lilliefors test, Jarque-Bera test and Chi square Goodness-of-Fit test. When normality between sample groups was achieved, a paired Student’s t-test were used. The CC values would be used in statistics only if the p < 0.05. The data with error bars are displayed as the means ± SD. No blinding and randomization design was needed in this work.
Code availability
All image processing and analysis were performed in MATLAB. The codes consist of seven parts: Diameter radius detection, Frequency calculation, Propagation index calculation, 3D synchronization analysis, Time lag calculation, DTW analysis and vasomotion index calculation, which are available at https://github.com/JialabEleven/Vasomotion_analysis.
Results
A high-precision analytical method for vasomotion and achieved parameters
In this study, we focused on the pial arteriolar networks, which are known to exhibit distinct vasomotor activity. Crossing the Cre mice with reporter mice, tamoxifen-induced expression of Cre under the control of SMA promotor allowed the labeling of the mural cells of all arterioles and a few large venules(>100 µm, Supplemental Fig. 1) with fluorescence protein. Intriguingly, we also observed that arterioles were positioned above venules when they intersected (Supplementary Fig. 1A, Movie 1). Therefore, the morphologies of mural cells and the vasculature allowed us to distinguish pial arterioles from venules in mice.
To describe vasomotion comprehensively, we performed an eight-step process to analyze the time-lapse images and assessed nine parameters related to spontaneous vasomotion, as specified below. In step 1, we generated a time-stack kymograph for each vascular segment utilizing the reslice function in ImageJ with linear regions of interest (ROIs) that were strictly perpendicular to the longitudinal axis of the targeted vessel. Only well-focused vessel segments were chosen for vasomotion analysis, accounting for the curvature of pial vessels and excluding all out-of-focus vessels (Supplementary Fig. 2). This criterion is important for accurate vasomotion studies.
In step 2, we digitized the brightness of each pixel along each horizontal line in the kymograph to form a time stack matrix of the image, and the image stacks were processed in MATLAB with Gaussian filtering to reduce spatial noise (Figure 1). In step 3, we determined the FWHM coordinates of both boundaries to calculate the vessel diameter for each image stack and digitally assessed dynamic variations in vessel diameter over time (step 4).
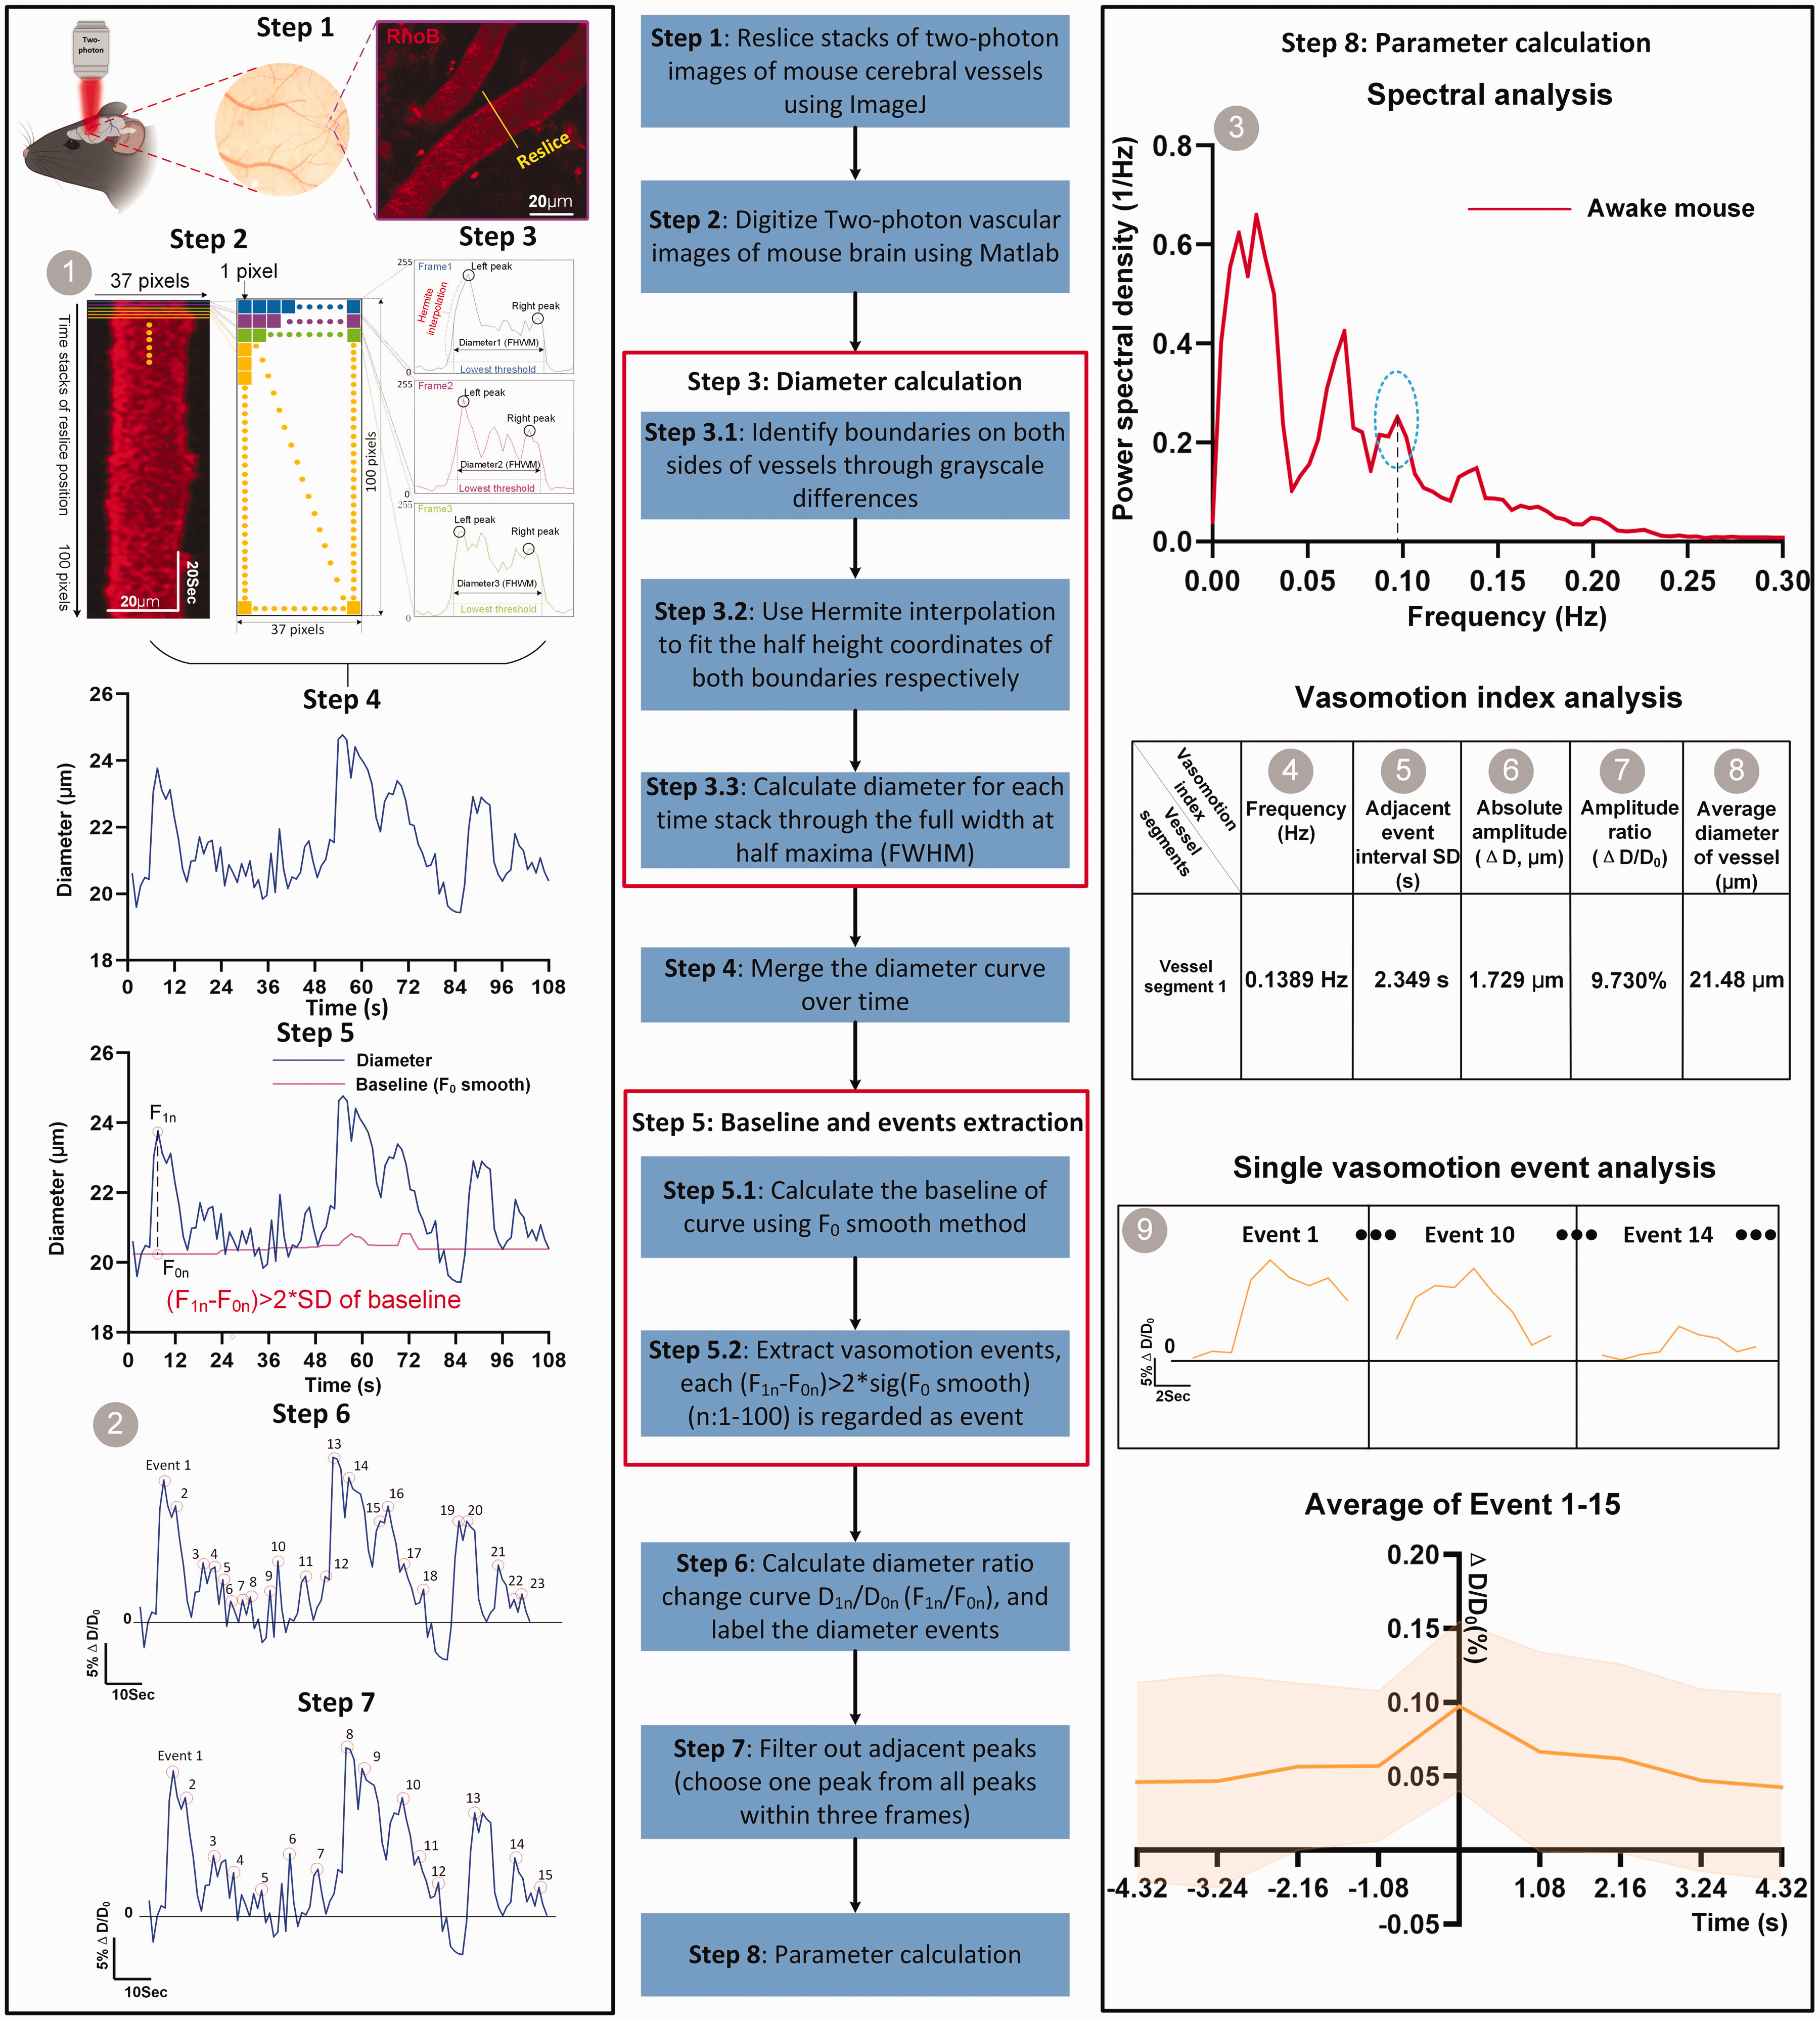
Flow chart of developing a comprehensive index for quantitative and precise characterization of spontaneous vasomotion. In vessel-containing images, time stacks of line ROIs are drawn on several vessel segments (The yellow solid line represents the reslice position, on average 2–8 segments per FOV), where pixel brightness along a line orthogonal to the length of the blood vessel was extracted. Image stacks in Tiff format are loaded into Matlab and in total nine vasomotion parameters are measured (The grey number ball indicates the detailed information of each parameter). These parameters are arranged in numerical order, representing as kymograph (1), time series diameter change curve (2), spectral analysis of diameter change curve (3), frequency of vasomotion (4), the standard deviation (SD) of interval times between two adjacent events (5), the absolute difference in vascular diameter change (6), the amplitude of difference in vascular diameter change (7), the amplitude ratio of vasomotion (8), the average diameter of vessel of time series and analysis of single events (9), respectively. All the results are exported into a csv file.
In steps 5 and 6, the baseline diameter variation over time was calculated using the D0 smoothing method. Initially, we adopted three methods that are commonly used to determine the baselines of the time series of the Ca2+ fluorescence (F) intensity fluctuations in neurons under stimulated conditions, namely, F0 average, F0 minimal, and F0 smooth. 29 The last method requires a time-rolling algorithm, while the first two methods simply use the average value or the smallest value as a baseline. Under basal conditions with no external stimulation, vasomotion events are difficult to identify with two methods that generate a fixed baseline (D0 minimal and average) when applying usual criterion for identifying a signal, namely, that the signal should exceed double SD of the diameter curve (Supplementary Fig. 3). In contrast, we detected more peaks when we employed the F0 smoothing method. Additionally, to minimize the number of false positives (step 7), we filtered the above results by selecting one event when two events were detected within three consecutive frames. To our knowledge, we are the first to utilize the D0 smoothing strategy in basal vasomotion analysis.
In addition, we applied traditional frequency and time domain analysis approaches to quantify nine parameters of spontaneous vasomotion events (Figure 1), including kymographs, time series of diameter change ratio and diameter change curve spectral analyses. Vasomotion can be divided into five components: the frequency of vasomotion, the time interval SD between two adjacent events, the absolute difference in vascular diameter changes during a vasomotion event (ΔD), the amplitude ratio of vasomotion (ΔD/D0), and the average diameter of vessel. Importantly, a novel contribution by elucidating the vasomotion dynamics, introducing the concept of single vasomotion cycles. In summary, we developed a procedure to comprehensively quantify spontaneous cerebral vasomotion events with high precision.
Freshly dissected mouse brains exhibit altered but noticeable arteriolar spontaneous vasomotion
To study vasomotion dynamics of arterioles, we compared arteriolar vasomotion index between freshly dissected mouse brains and awake mouse brain. Although isolated arterioles contract in vitro due to SMC-generated myogenic forces, 39 two key uncertainties remain in ex vivo brain. Firstly, it is unclear whether the ex vivo vasomotion contained the ∼0.1-Hz band in the power density spectrum of frequency. Secondly, the quantitative differences between ex vivo vasomotion and in vivo vasomotion are still unknown. We compared vasodynamics data obtained through two-photon microscopy between a total of 30 arteriole segments from four freshly dissected mouse brains and 38 arteriole segments from four head-fixed awake mice positioned on a treadmill with a surgically opened cranial window (Figure 2(a)). The effectiveness of vasomotion properties methods (Figure 1) will also be assessed by comparing these two conditions.
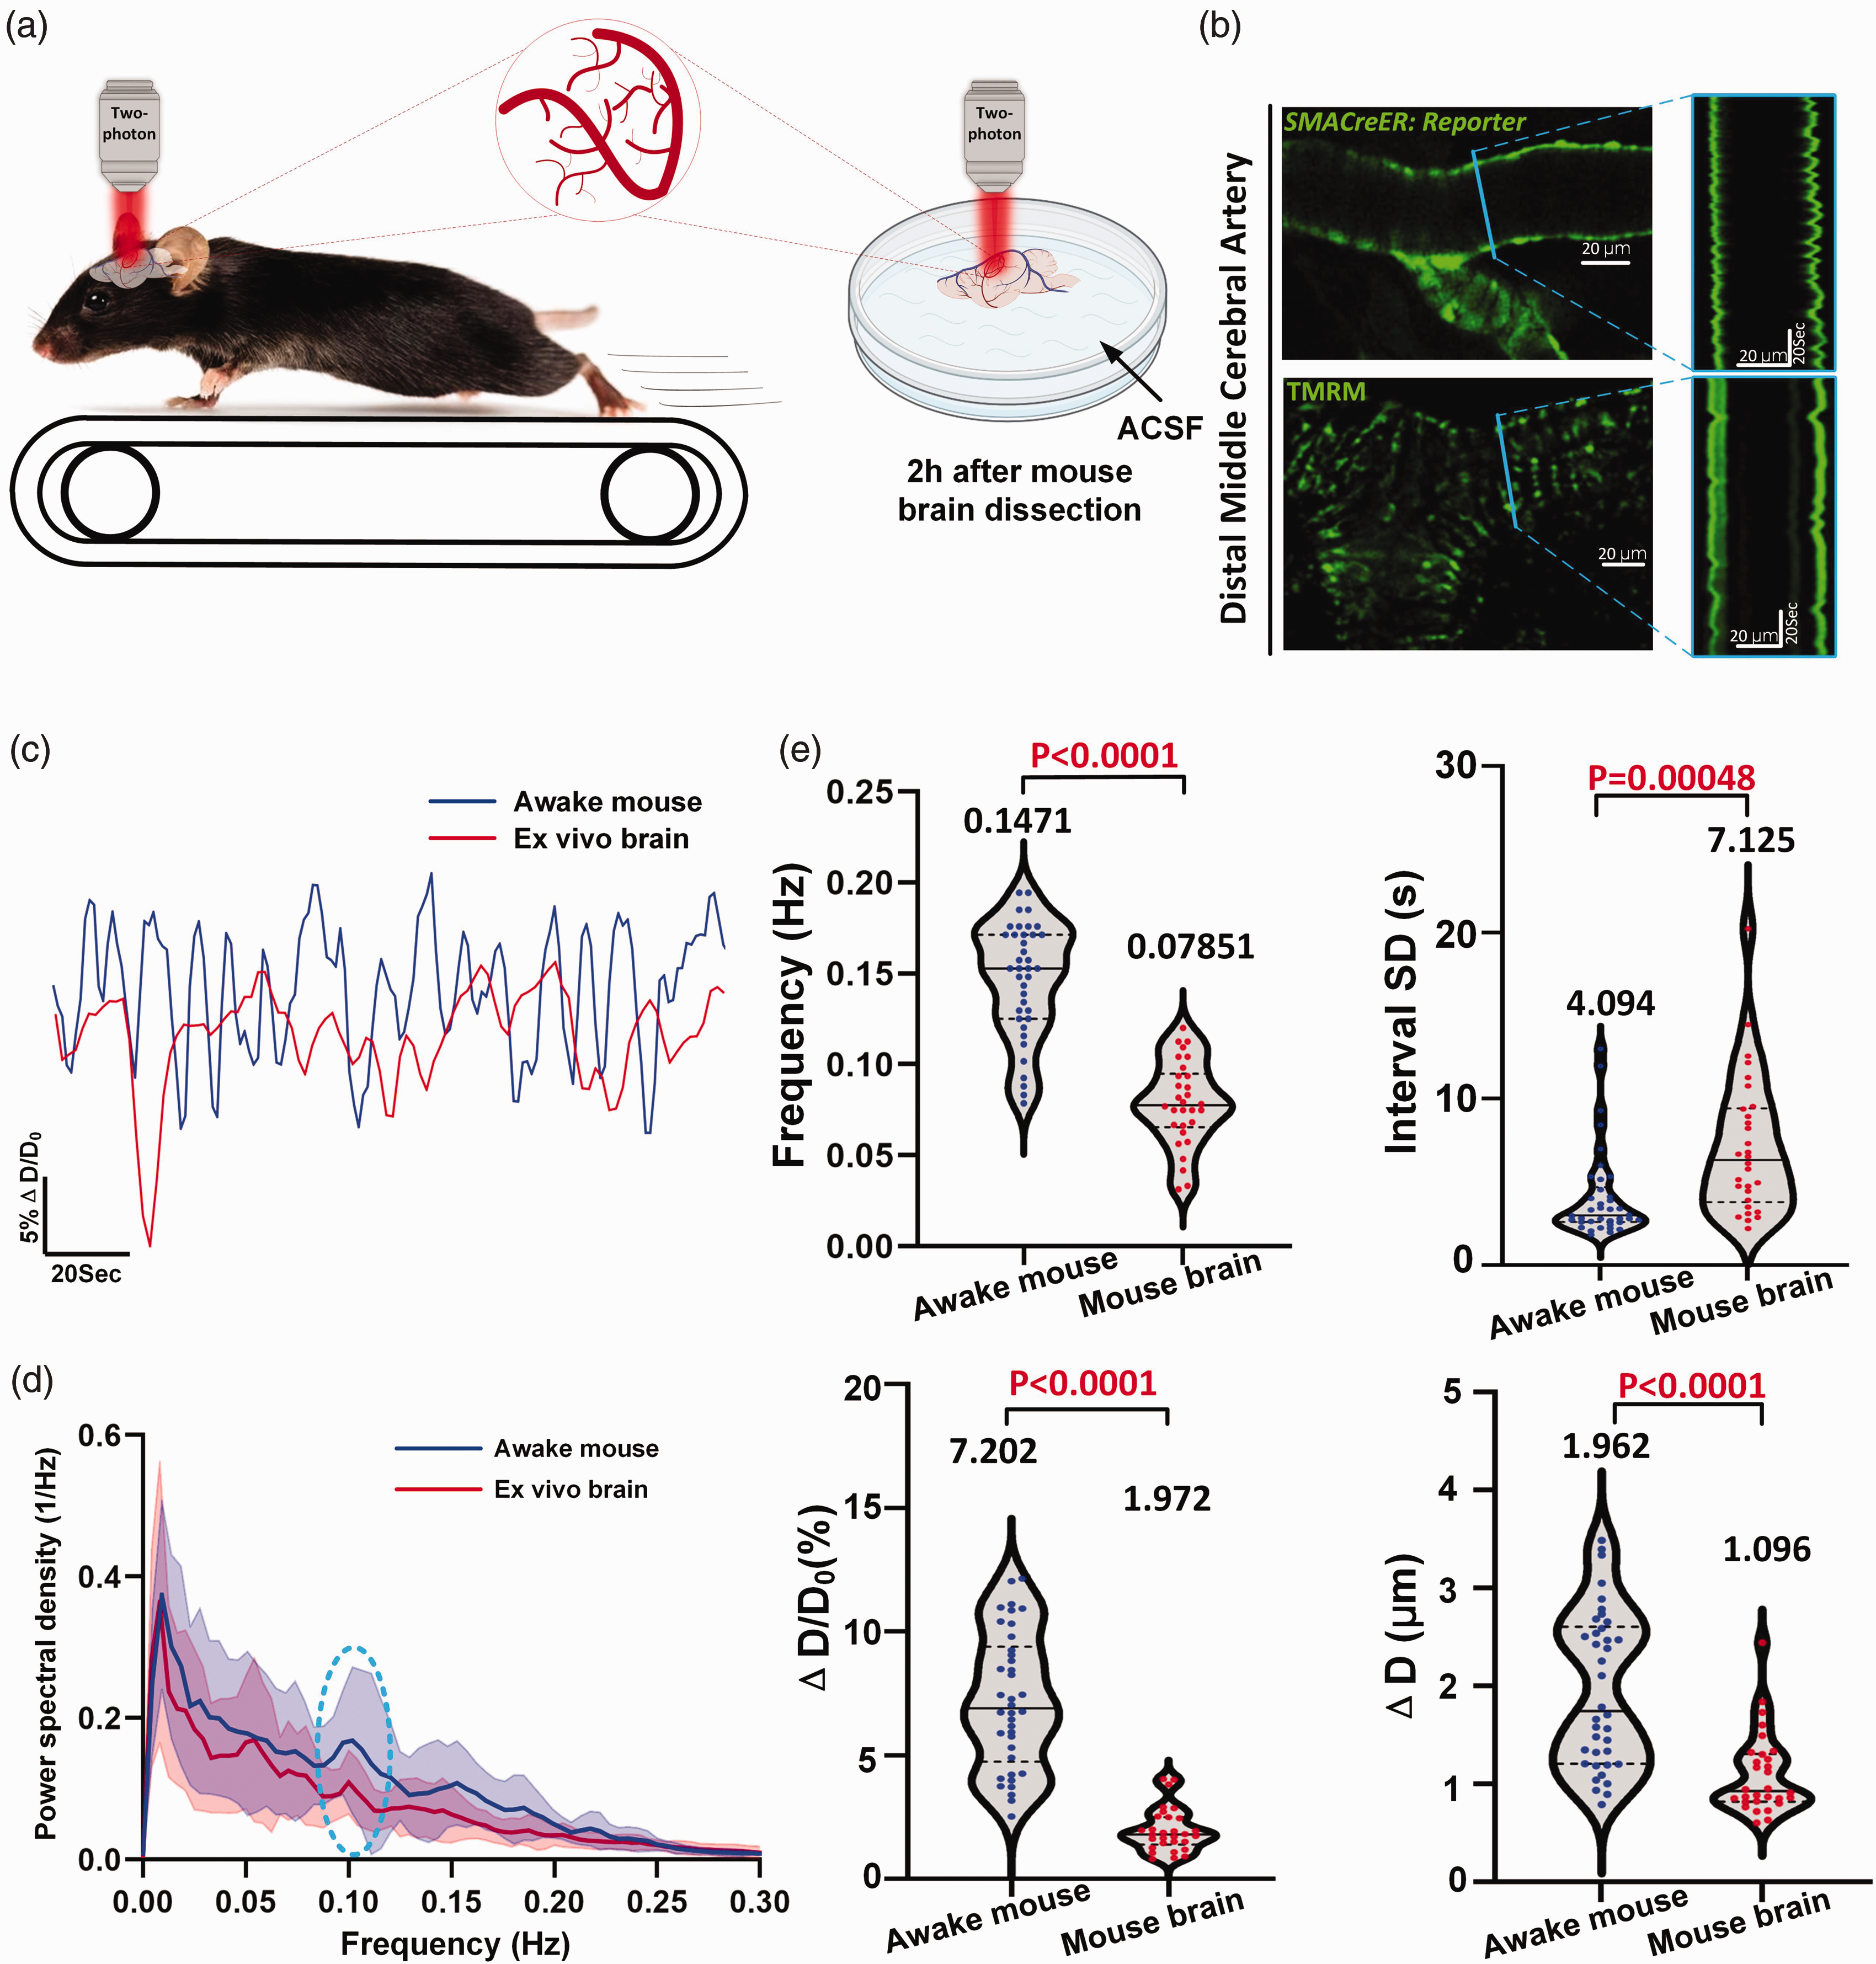
Vasomotion index analyses reveal altered but noticeable arteriolar spontaneous vasomotion in freshly dissected mouse brains. (a) Experimental design of the spontaneous vasomotion detection in awake mouse and ex vivo mouse brain. (b) Representative still-frame in vivo two-photon (2 P) microscopy images and kymographs of cerebral arteriole through a cranial window in an awake head-fixed mouse and ex vivo mouse brain. The blue solid line represents the resliced position (c) Representative time-series amplitude ratio (ΔD/D0) changes trace of awake mouse arteriole (blue solid line) and ex vivo mouse brain arteriole (red solid line). (d) The averaged Fourier plot across awake mouse cerebral diameter change and ex vivo mouse brain cerebral diameter change (n = 15 arterioles segments in 4 awake mice) showing a broad range of ultra-low frequencies (<0.3 Hz), with a distinct peak centered at around 0.1 Hz. Shaded areas represent SD. (e) Vasomotion index analysis between awake mouse (n = 38 arterioles segments in 4 awake mice) and ex vivo mouse brain (n = 30 arterioles segments in 4 mouse brains). Top left represents frequency of vasomotion, top right represents the interval SD, bottom left represents the amplitude ratio ΔD/D0 of vasomotion and bottom right represents the absolute difference in vascular diameter change ΔD.
The kymographs represented by the blue lines revealed differences in vasomotion profile under these two conditions (Figure 2(b), Movie 2–3). The time series of ΔD/D0 further corroborated this disparity (Figure 2(c)). Although different in these aspects, Fourier analysis revealed that the arterioles in the dissected brains kept in ACSF for two hours without an external supply of oxygen showed characteristic peaks around 0.1 Hz in frequency power spectrum resembling the vasomotion in vivo (Figure 2(d)). The vasomotion index analyses indicated that all four aspects of vasodynamics robustly decreased in ex vivo brains (Figure 2(e), Supplementary Table 1), especially in the frequency (Awake mouse: 0.1471 ± 0.03148 (95% CI: 0.1367, 0.1574) Vs. Ex vivo mouse brain: 0.07851 ± 0.02318 (95% CI: 0.06985, 0.08716)) and ΔD/D0 (Awake mouse: 7.202 ± 2.738% (95% CI: 6.302%, 8.102%) Vs. Ex vivo mouse brain: 1.972 ± 0.8819% (95% CI: 1.643%, 2.302%)). Altogether, these data not only demonstrated that the local control of SMCs over arteriole diameter can persist up to two hours ex vivo but also support that vasomotion analyses were sufficiently precise to discern differential vasomotion characteristics under different conditions.
Vasodynamic changes derived from both internal and external diameters can be used to characterize spontaneous vasomotion
Depending on the specific experimental conditions, some previous reports have focused on internal diameter,8,38,40 while others have measured external diameter.6,41 Therefore, we verified whether the vasomotion features extracted from these two diameters are comparable. All figures utilize green color to represent external diameter and red color to represent measured internal diameter of the lumen space within the vessels.
In total, we examined 31 arteriole segments from eight awake mice to address this issue. Spontaneous contractions and dilations of arterioles were observed in both external and internal diameter kymographs (Figure 3(a) to (c)). Moreover, the time series of ΔD/D0 revealed high correlations between these two types of diameters (Figure 3(d); Supplementary Table 2; CC: 0.6855 ± 0.01542 (95% CI: 0.6540, 0.7170)), and a 0.1-Hz peak was observed in the spectral analysis (Figure 3(e)). Moreover, our findings showed no discernible differences in the vasomotion index (Figure 3(f)). Based on these comparisons, we conclude that internal and external diameters can both be effectively utilized to investigate the properties of spontaneous vasomotion (Movie 4). This is particularly important when there is a need to retrospectively compare features obtained solely from either the external or the internal diameter.
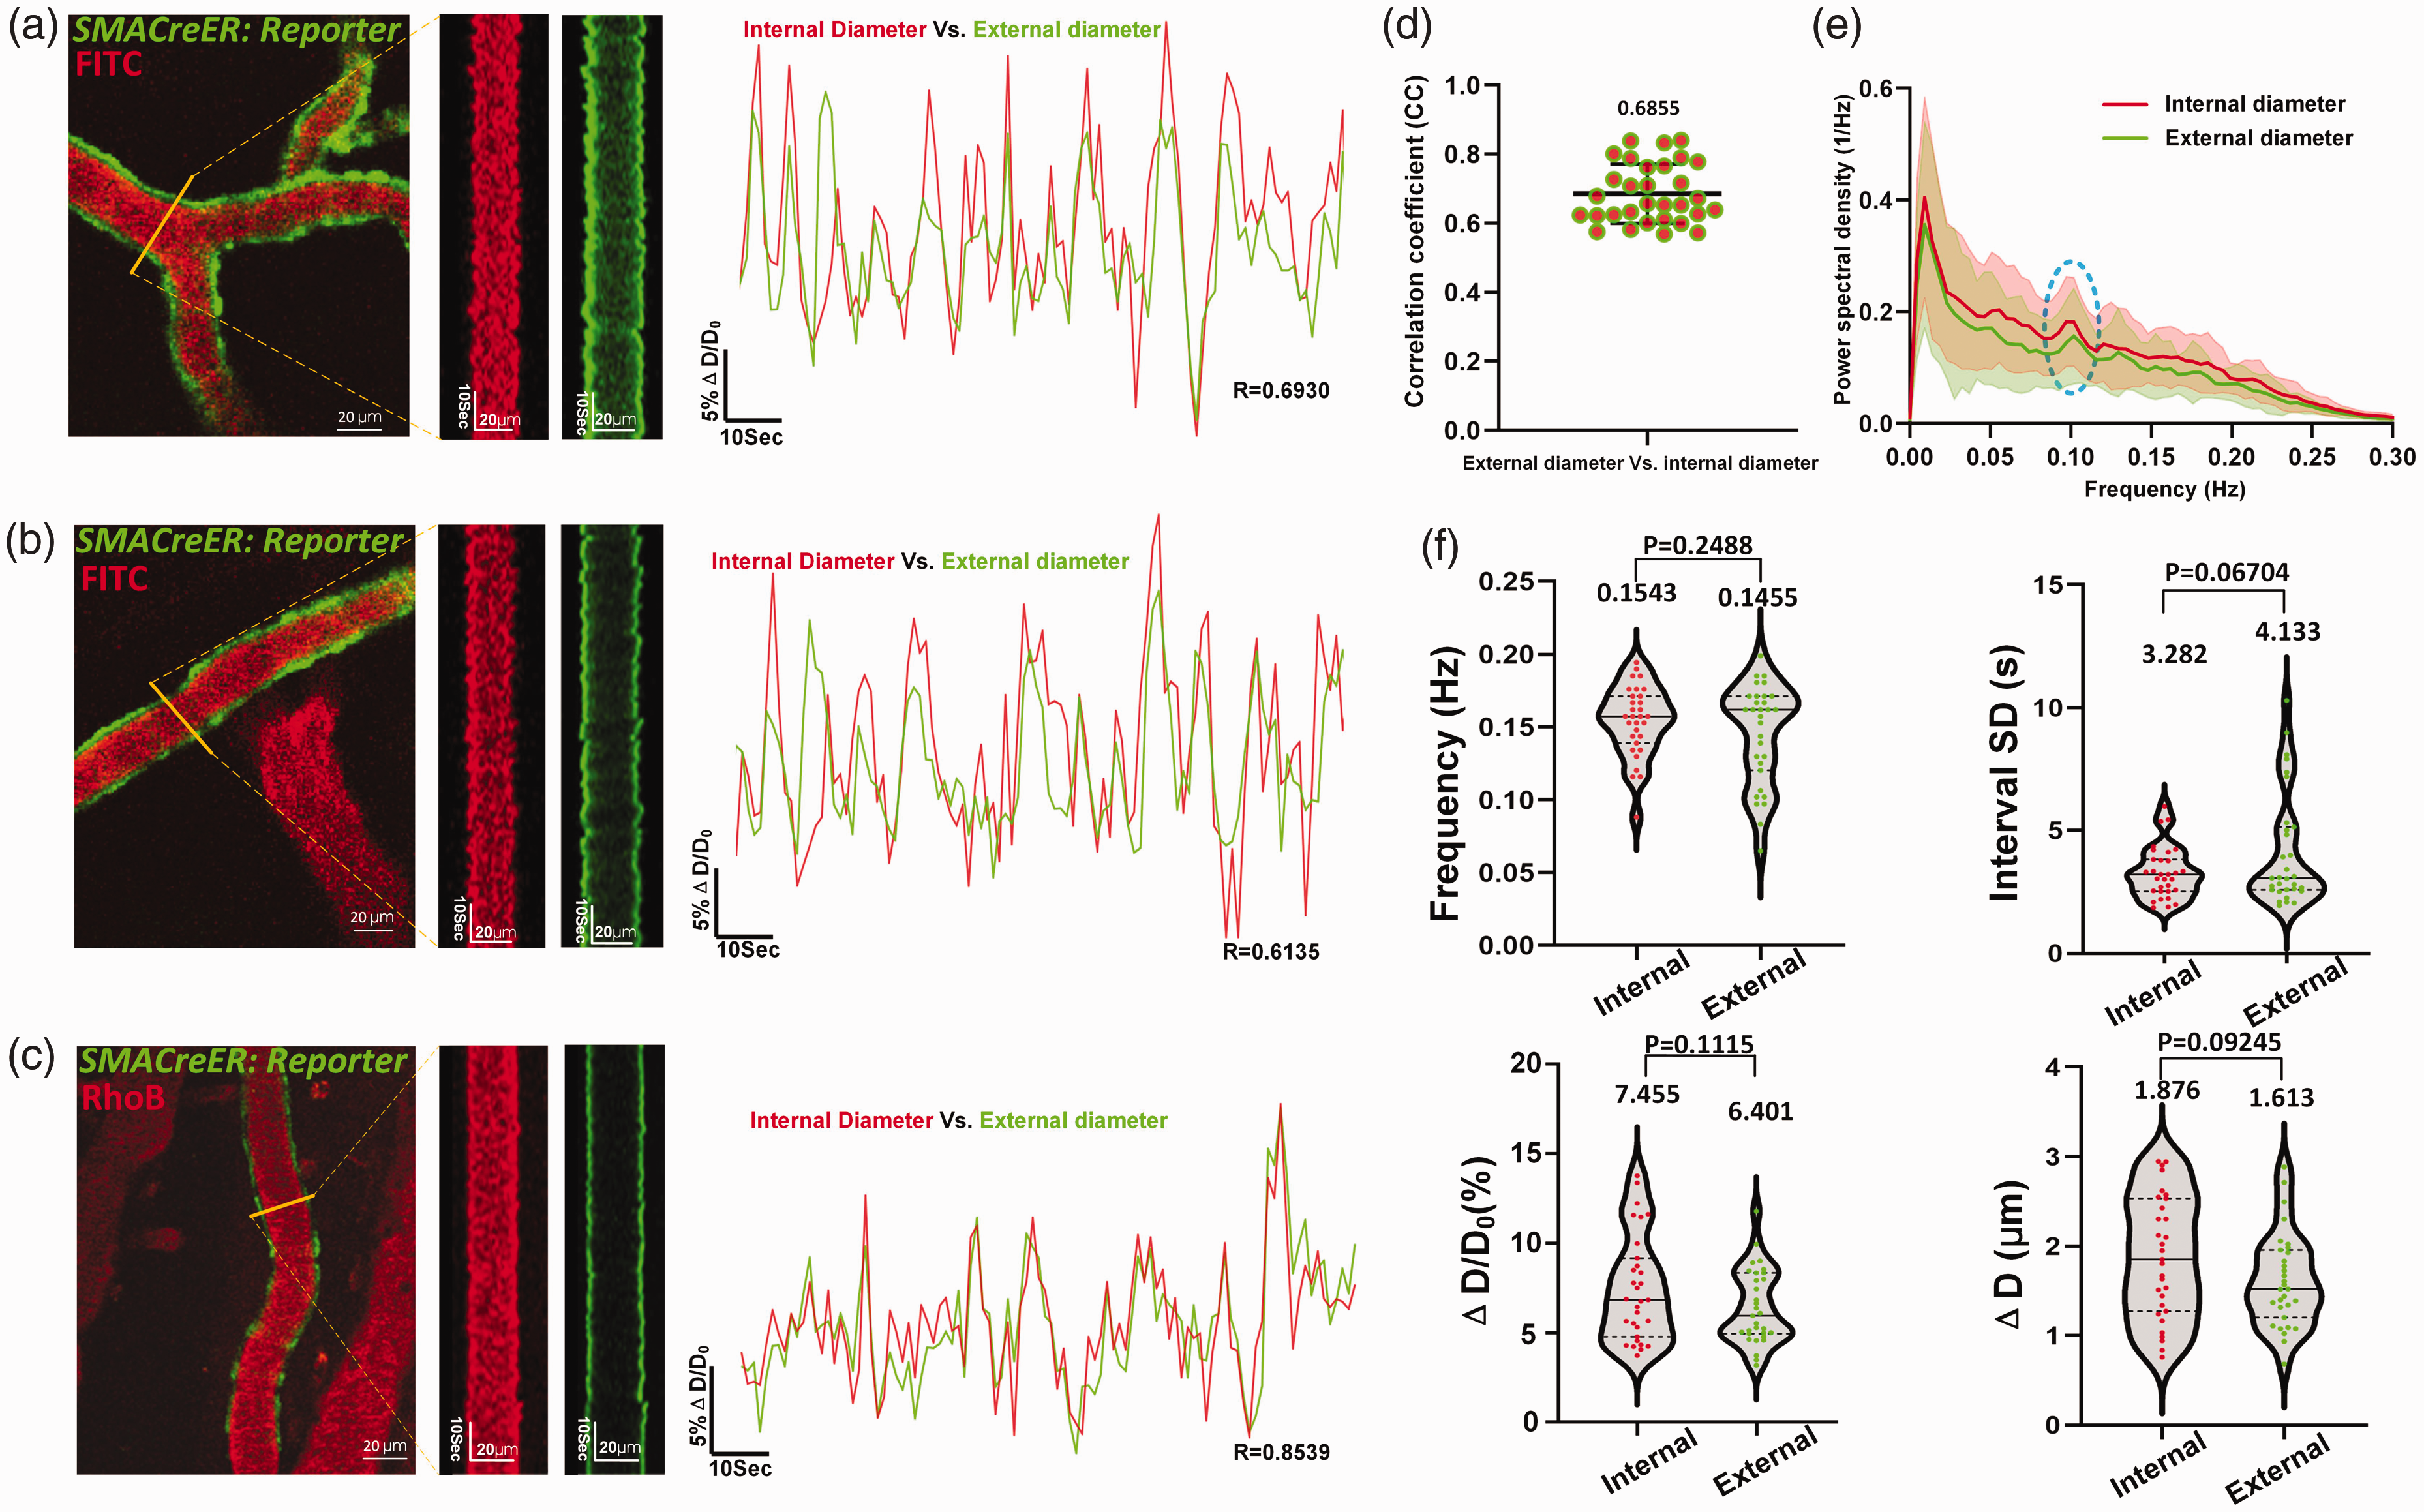
Both dynamic changes in internal and external vascular diameter can be used to characterize spontaneous vasomotion. (a)–(c) Left: Representative still-frame images and kymographs of 3 branching levels from a single cerebral arteriole. Right: the corresponding time series of diameter changes of the internal and external diameter, representing medium, low and high correlation coefficient from top to below. The yellow solid line represents the reslice position. (d) Quantification of CC values between same arterioles segments internal and external diameter vasomotion (n = 31 arterioles segments in 8 awake mice). (e) The averaged Fourier plot across awake mouse cerebral internal and external diameter change of same arterioles (n = 31 arterioles segments in 8 awake mice)showed a broad range of ultra-low frequencies (<0.3 Hz), with a distinct peak centered at around 0.1 Hz. Shaded areas represent SD. (f) Vasomotion index analysis of cerebral arteriole and comparison between internal and external diameter (n = 31 arterioles segments in 8 awake mice). Top left represents the index of frequency, top right represents the interval SD, bottom left represents the index of amplitude ratio ΔD/D0 and bottom right represents index of absolute amplitude ΔD. The reporter mice used in our study included Ai14, Ai47, and Ai96 mice whose external diameter are uniformly labeled green and internal diameter are labeled red.
The radius vasomotion index reveals that the circular arteriolar wall contraction and dilation are non-isotropic
In the kymograph and time series data analysis performed in this study as well as previously published representative kymographs of vasodynamics obtained under basal, neural, and chemical stimuli conditions, 6 we observed that the two sides of the kymograph tended to be asymmetric (Figure 2(b)). Therefore, we developed a radius index to characterize this nonisotropic contractility of arterioles.
Next, we verified that the internal and external radii, as well as the diameter, can be employed to investigate spontaneous vasomotion properties (Supplementary Fig. 4, Supplementary Table 2). To accomplish this, we compared the time series of each radius to that of the diameter and observed mismatched dilations and contractions (Figure 4(a)). In contrast, mismatches between the external and internal radii were seldom observed (Figure 4(b), Movie 5).
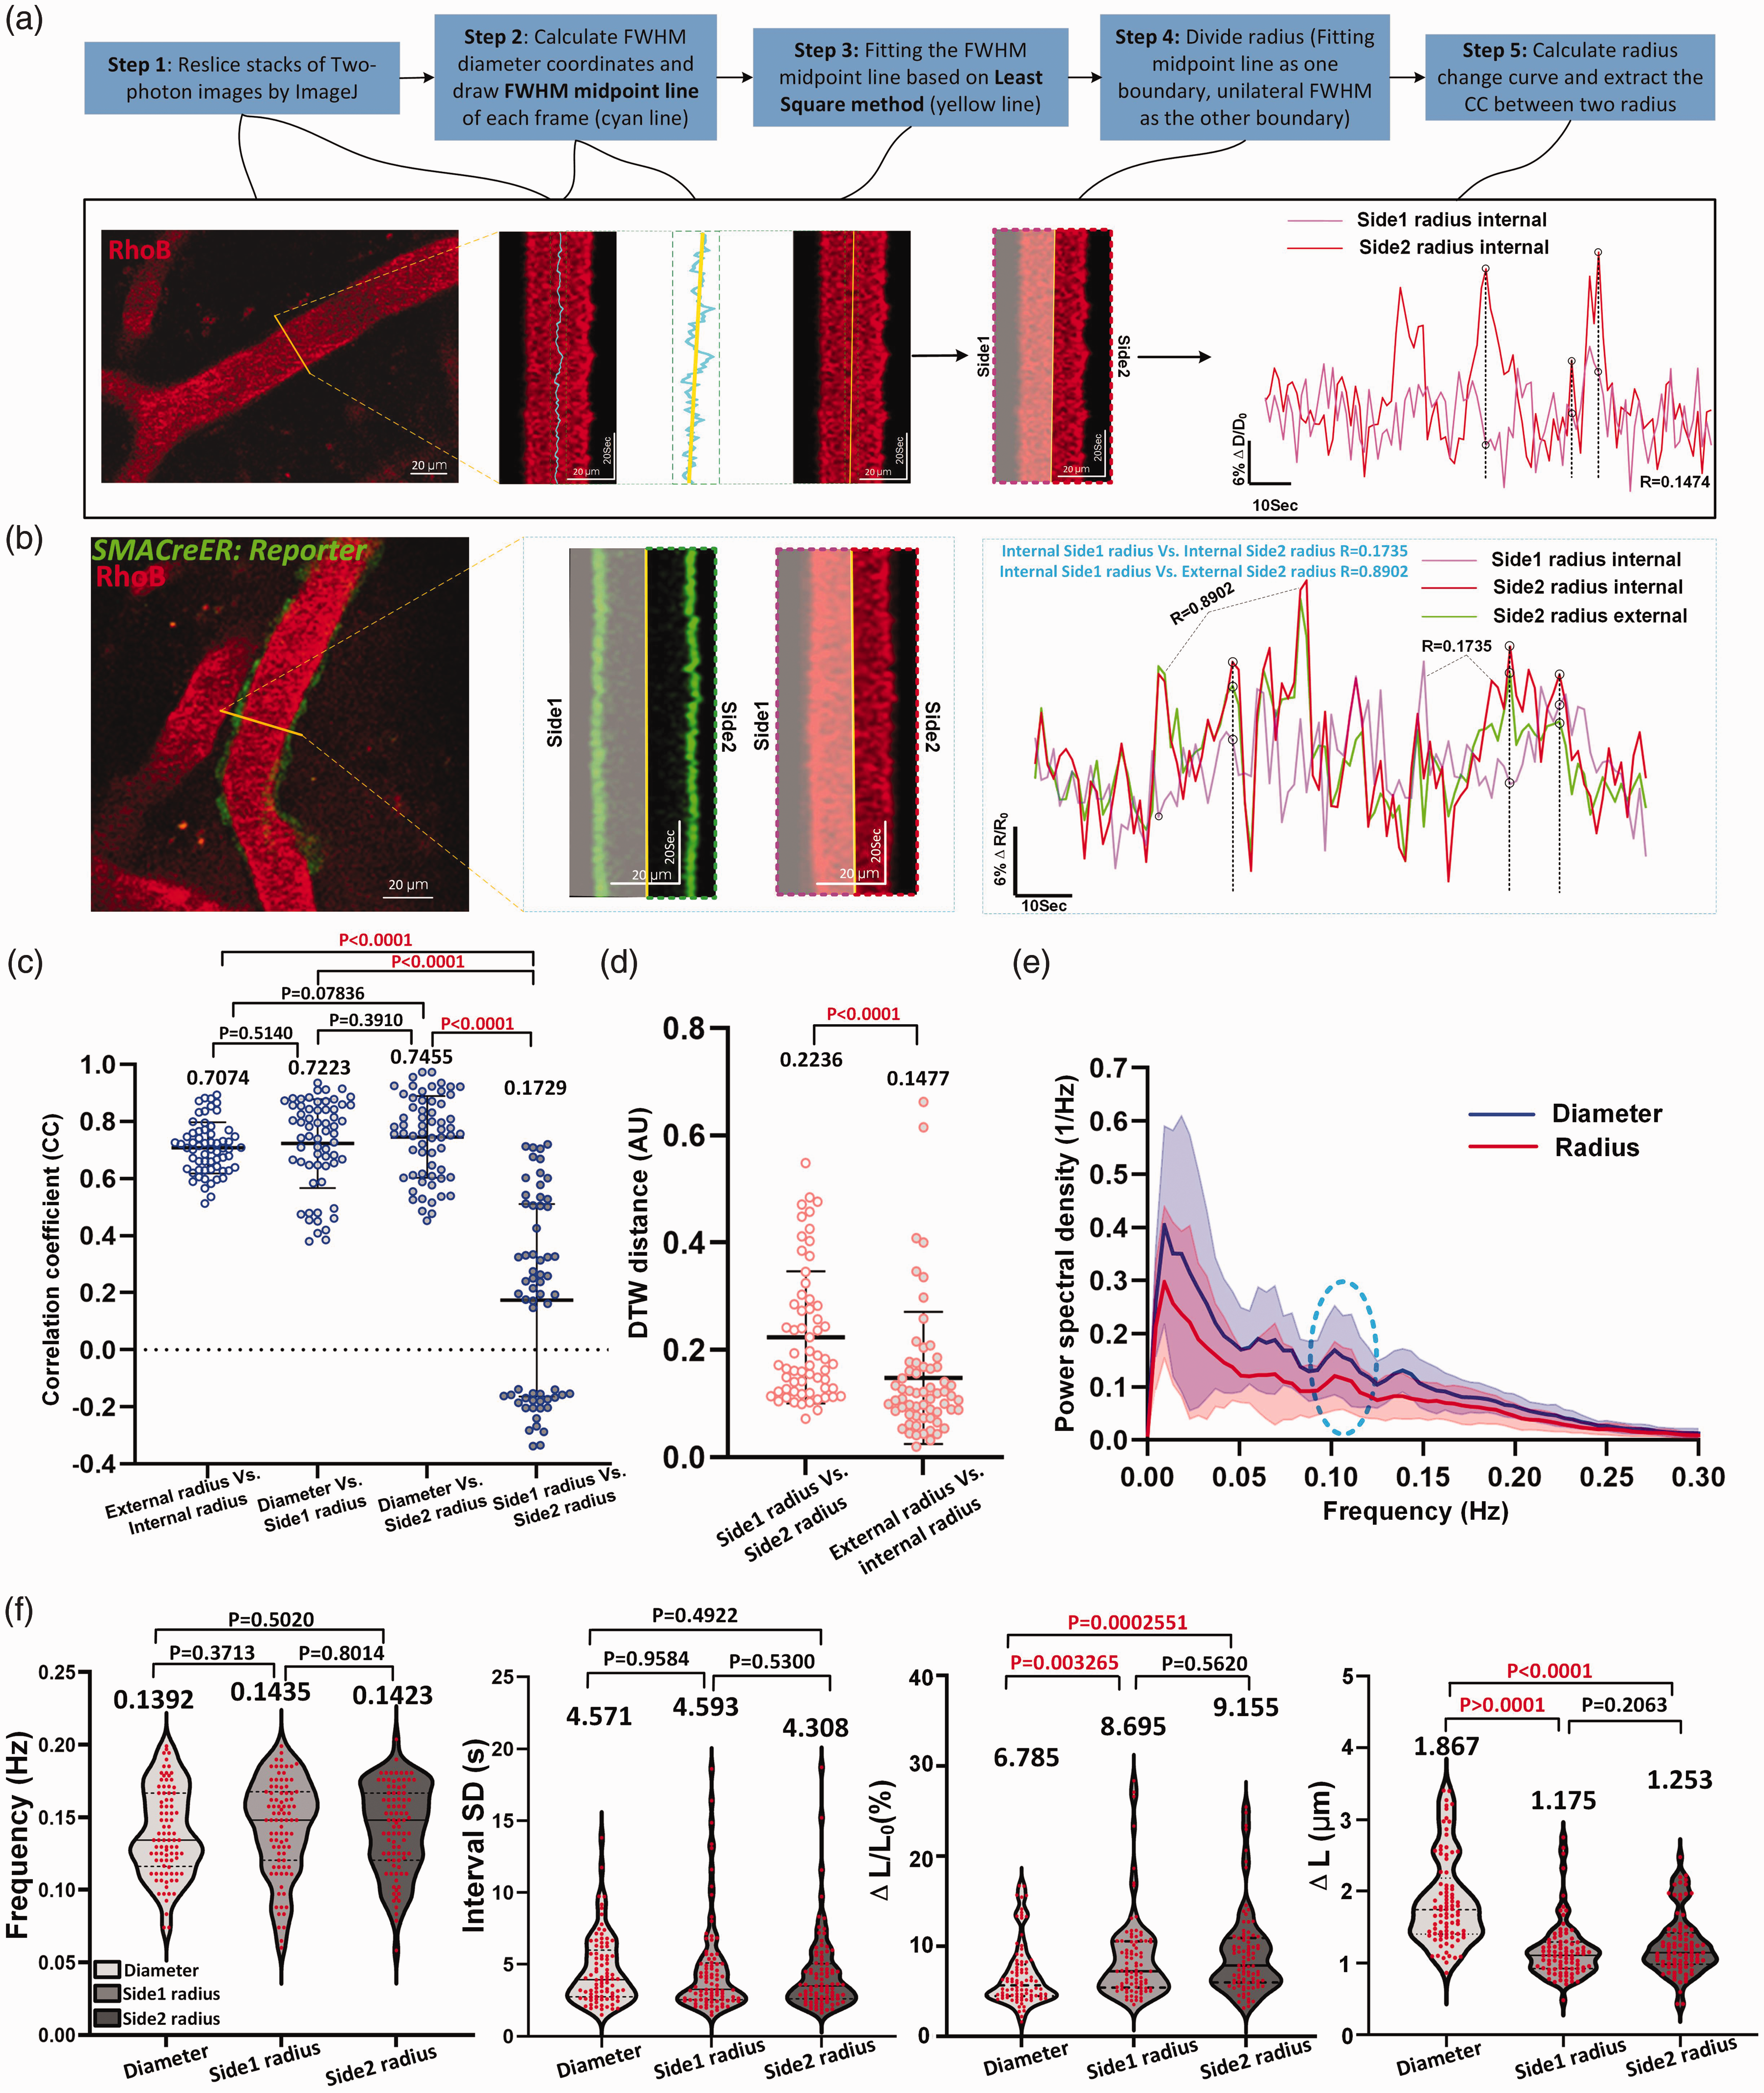
Radius vasomotion index reveals an asymmetrical movement between the two sides of the arteriolar wall at the maximum diameter section (a) Flow chart of radius boundary definition. The yellow solid line represents the reslice position and the black dotted line represents the mismatched vasomotion. (b) Representative still-frame image and kymograph of the internal (red) and external (green) radius of cerebral arterioles. Right shows the CC values comparison of side1 radius and side2 radius amplitude ratio with internal and external radius amplitude ratio as reference. Shaded areas represent radius of the other side. (c) The statistic graph of CC value comparison showing the correlation between internal and external radius amplitude ratio (n = 62 arterioles segments in 8 awake mice), diameter and side1 radius (n = 62 arterioles segments in 9 awake mice), diameter and side2 radius (n = 62 arterioles segments in 9 awake mice), side1 radius and side2 radius (n = 62 arterioles segments in 9 awake mice). (d) Dynamic time warping (DTW) comparison between side1 and side2 radius (n = 62 arterioles segments in 9 awake mice) of the same cerebral arteriole with internal and external radius (n = 62 arterioles segments in 8 awake mice) as reference. (e) The averaged Fourier plot comparison across diameter (n = 31 arterioles segments in 9 awake mice) and radius (n = 62 arterioles segments in 9 awake mice) in awake mouse revealed a broad range of ultra-low frequencies (<0.3 Hz), with a similar distinct peak centered at around 0.1 Hz. Shaded areas represent SD. (f) Vasomotion index analysis between diameter and radius (n = 89 arterioles segments in 9 awake mice).
The comparison between two time series should consider both the temporal and amplitude differences. Thus, we examined the mismatches between the curves by combining the DTW method with CC analysis to gain a more comprehensive understanding of arteriolar wall movement. A higher DTW score signifies a greater distance (and thus less similarity) between two analyzed objects (Supplementary Fig. 5).
Four sets of CC values were compared separately (Figure 4(c), Supplementary Table 3), The CC obtained from external radius highly positively correlates with its corresponding internal radius. Similarly, the CC values of diameter were highly positively correlates with radii on both sides. In contrast, the side1 radius did not correlate with side2 radius (CC: 0.1729 ± 0.3371; 95% CI: 0.08734, 0.2585; p < 0.05). Moreover, the DTW score obtained by comparing the two radii of a reslice was significantly higher than what was obtained by comparing the side1 radius with its corresponding external radius (Figure 4(d) and Supplementary Fig. 5; 0.2236 ± 0.1229 (95% CI: 0.1924, 0.2548) Vs. 0.1477 ± 0.1235 (95% CI: 0.1163, 0.1791)). This finding supports the asymmetry between the opposite arteriole walls.
Despite this asymmetry, the radius analysis showed a peak at approximately 0.1 Hz in the frequency power spectrum, like the results of the diameter analysis (Figure 4(e)). Additionally, the radius index was generally comparable to the diameter index, except for two parameters: ΔL/L0 and ΔL (Figure 4(f), Supplementary Table 4). This difference can be attributed to the fact that the radius is half of the diameter. Overall, these data highlighted that the radius-based analysis has unique advantages over diameter-based analyses for study aims, such as the extraction of time delay between fluctuation SMC calcium and arteriolar vasomotion, which will be discussed in detail in the upcoming sections.
Arterioles exhibit suppressed spontaneous vasomotion and weakened vasomotion propagation index under anesthesia
To examine whether cerebral arterioles exhibit prominent 0.1-Hz vasomotion before and after anesthesia, we performed a paired comparison of the same arterioles in mice under awake and anesthetized states; To induce anesthesia, three methods were employed, including the administration of isoflurane gas and intraperitoneal injection of avertin or pentobarbital sodium. It is known that anesthesia does not deplete arteriole spontaneous vasomotion but dilates the resting diameter,19,23,42 but it is still unclear to what extent anesthesia can induce. Furthermore, the differential vasomotor responses of arterioles to anesthesia have not been quantitatively characterized.
The results showed that when the mice were anesthetized, all 85 arteriole segments from twelve mice with diameters ranging from 12.49 µm to 55.53 µm exhibited dilation (Figure 5(a) to (g)). Arterioles exhibited a prominent peak at 0.1 Hz in Fourier spectral analysis both in awake and anesthetized states (Figure 5(h)). While the three groups of mice assigned for the three anesthetics exhibited consistent vasomotion indices in their awake state (Supplementary Fig. 6A), the arterioles showed significantly smaller amplitudes under anesthesia (Figure 5(i), Supplementary Table 5, Awake mice: 6.183 ± 1.285% (95% CI: 5.703%, 6.663%) Vs. Anesthetized mice: 1.706 ± 0.7448% (95% CI: 1.428%, 1.984%) of isoflurane anesthesia; Figure 5(j), Awake mice: 6.247 ± 2.134% (95% CI: 5.275%, 7.218%) Vs. Anesthetized mice: 1.780 ± 0.7649% (95% CI: 1.432%, 2.128%) of avertin anesthesia; Figure 5(k), Movie 6, Awake mice: 6.982 ± 2.372% (95% CI: 6.155%, 7.810%) Vs. Anesthetized mice: 3.672 ± 1.367% (95% CI: 3.195%, 4.149%) of pentobarbital sodium anesthesia). Moreover, compared to the awake state, the vasomotion frequencies decreased upon administration of all the anesthetics. Isoflurane and avertin exhibited better vasomotion inhibitory effects compared to pentobarbital sodium (Supplementary Fig. 6B), mainly reflected in a greater reduction in ΔD/D0 and ΔD. These results were consistent with previous reports that anesthetics significantly reduced the power of vasomotion.19,23,42
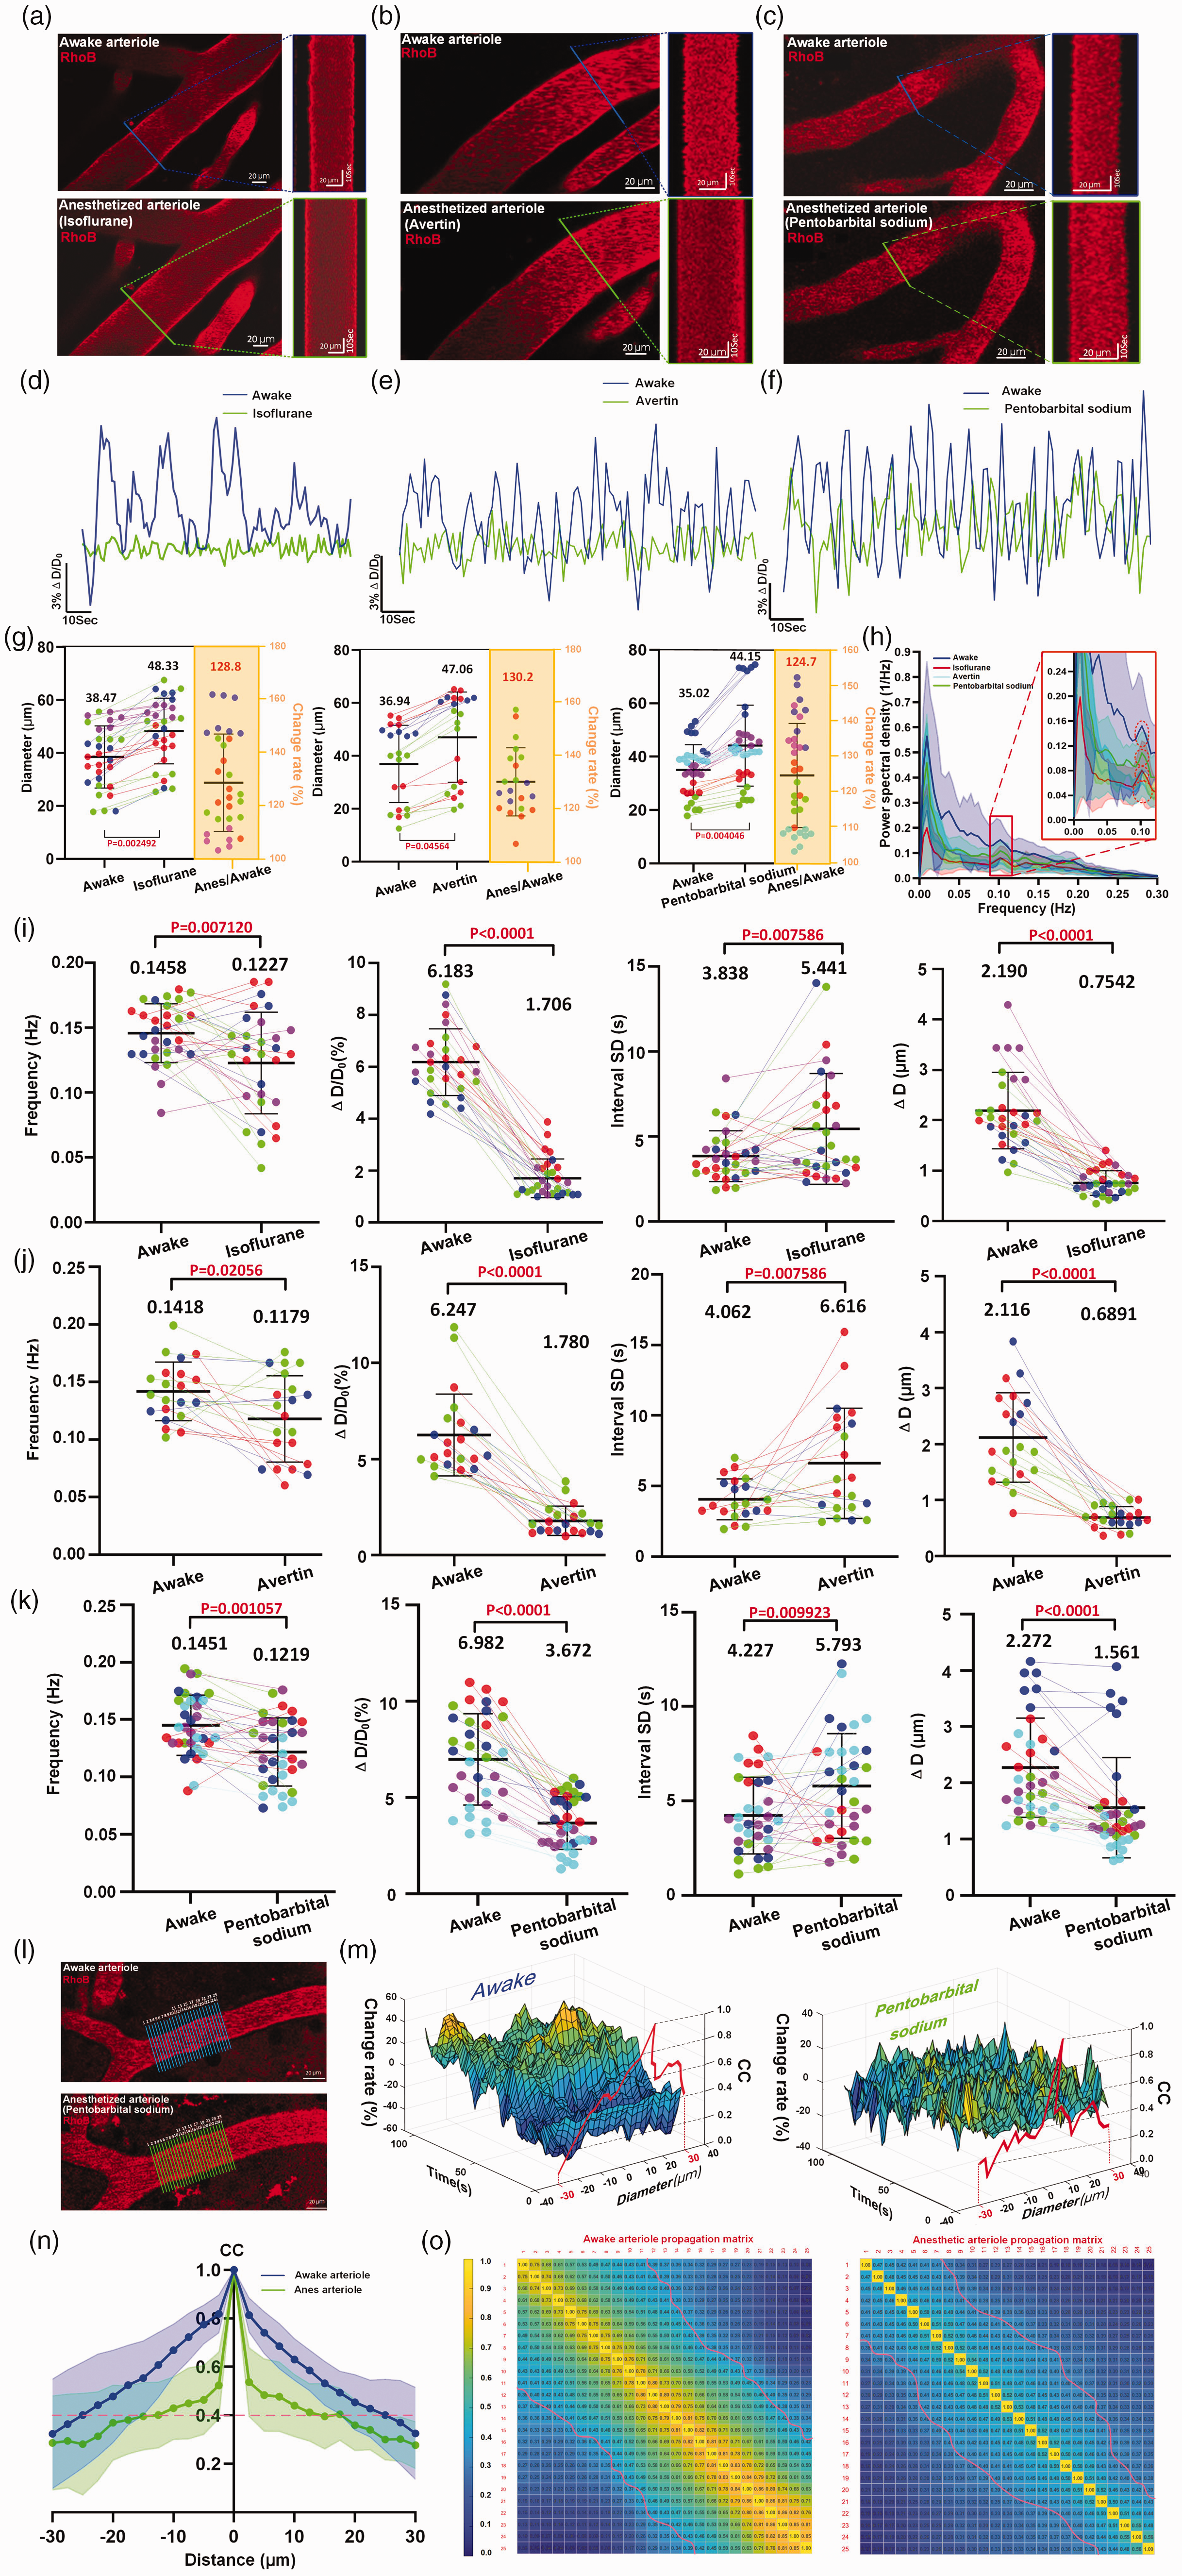
Arterioles exhibit suppressed spontaneous vasomotion and weakened vasomotion propagation index under anesthesia (a–c) Representative still-frame image and kymograph of a single mouse cerebral arteriole in awake and various anesthetized Continued.(Isoflurane, avertin and pentobarbital sodium) states. (d–f) Representative time-lapse amplitude ratio trace of a single mouse arteriole in awake (blue line) and various anesthetized states. (g) Cerebral arteriolar dilation in mice under Isoflurane (left, n = 30 arterioles segments in 4 mice), avertin (medium, n = 21 arterioles segments in 3 mice) and pentobarbital sodium (right, n = 34 arterioles segments in 5 mice) anesthesia states. (h) The averaged Fourier plot among awake state (green line, n = 17 arterioles segments in 5 mice), isoflurane anesthetized state (red line, n = 23 arterioles segments in 4 mice), avertin anesthetized state (cyan line, n = 24 arterioles segments in 3 mice) and pentobarbital sodium anesthetized state (n = 12 arterioles segments in 4 mice) showed a distinct peak centered at around 0.1 Hz. Shaded areas represent SD. (i–k) Vasomotion index comparison of a single arterioles before and after Isoflurane anesthesia (n = 30 arterioles segments in 5 mice), Avertin anesthesia (n = 21 arterioles segments in 3 mice) and Pentobarbital sodium anesthesia (n = 34 arterioles segments in 5 mice), respectively. The different color dots represent different mice and connecting lines represent vasomotion index change of the same arteriole in the same mouse before and after anesthesia. (l) Example of vasomotion propagation of a single cerebral arteriole in awake and pentobarbital sodium anesthetized states (m) Representative 3D mash grid plots of arterioles before and after Pentobarbital sodium anesthesia. (n) The arteriolar vasomotion propagation index analysis. The blue (awake) and green (anesthesia) curves show the average cross-correlation value of different vasomotion time-profile (n = 21 arteriolar diameter change propagation column in 3 mice). The magenta dash line indicates correlation coefficient is 0.4. Shaded areas represent SD. (o) The arteriolar vasomotion propagation cross-correlation matrix (n = 21 arteriolar diameter changes propagation column in 3 mice, see Methods). The magenta dash line indicates that the correlation coefficient is 0.4.
Recently, arteriole wall motion was found to propagate along the vascular longitudinal axis. 28 We imaged spontaneous vasomotion propagation changes in arteriolar diameter in both awake and anesthetized mice. To investigate the interactions from one seed position to other positions of arteriolar vasomotion, cross-correlation coefficient analysis of line scan vasomotion along the length of one imaged arteriole was employed (Figure 5(l) and (m)). These results confirmed this vasomotion propagation in arterioles and revealed that this propagation was robustly suppressed under the influence of anesthetics (Figure 5(n) and (o)), suggesting a novel aspect of the side effects of anesthesia. Taken together, our findings demonstrated that anesthesia profoundly affected spontaneous vasomotion.
Vasomotion features in different diameter ranks of vessels and relationships between SMCs Ca2+ oscillations and vasomotions in arterioles
Next, to address whether vasomotion varies with the size of the vessels, we categorized arterioles into four ranks with the quartile number of vascular diameters. 38 For arterioles, 170 segments from sixteen awake mice were calculated and the ranks were defined as rank1 (38.83 < d < 56.31 µm), rank2 (32.18 < d < 38.83 µm), rank3 (23.05 < d < 32.18 µm), and rank4 (17.80 < d <23.05 µm).
We then characterized differences in vasomotion indices arterioles of different ranks. After a comprehensive analysis, the results indicated that smaller arterioles exhibited more pronounced vasomotion (Figure 6(a) to (c), Supplementary Table 6; Rank1: 5.240 ± 2.715% (95% CI: 4.394%, 6.086%) Vs. Rank2: 5.718 ± 2.261% (95% CI: 5.022%, 6.416%) Vs. Rank3: 7.748 ± 2.644% (95% CI: 6.934%, 8.562%) Vs. Rank4: 10.226 ± 4.024% (95% CI: 9.010%, 11.52%)). We found no differences in frequency or interval SD among arterioles with different ranks. Intriguingly, the ΔD of arterioles were consistently approximately 2 µm, regardless of ranks.
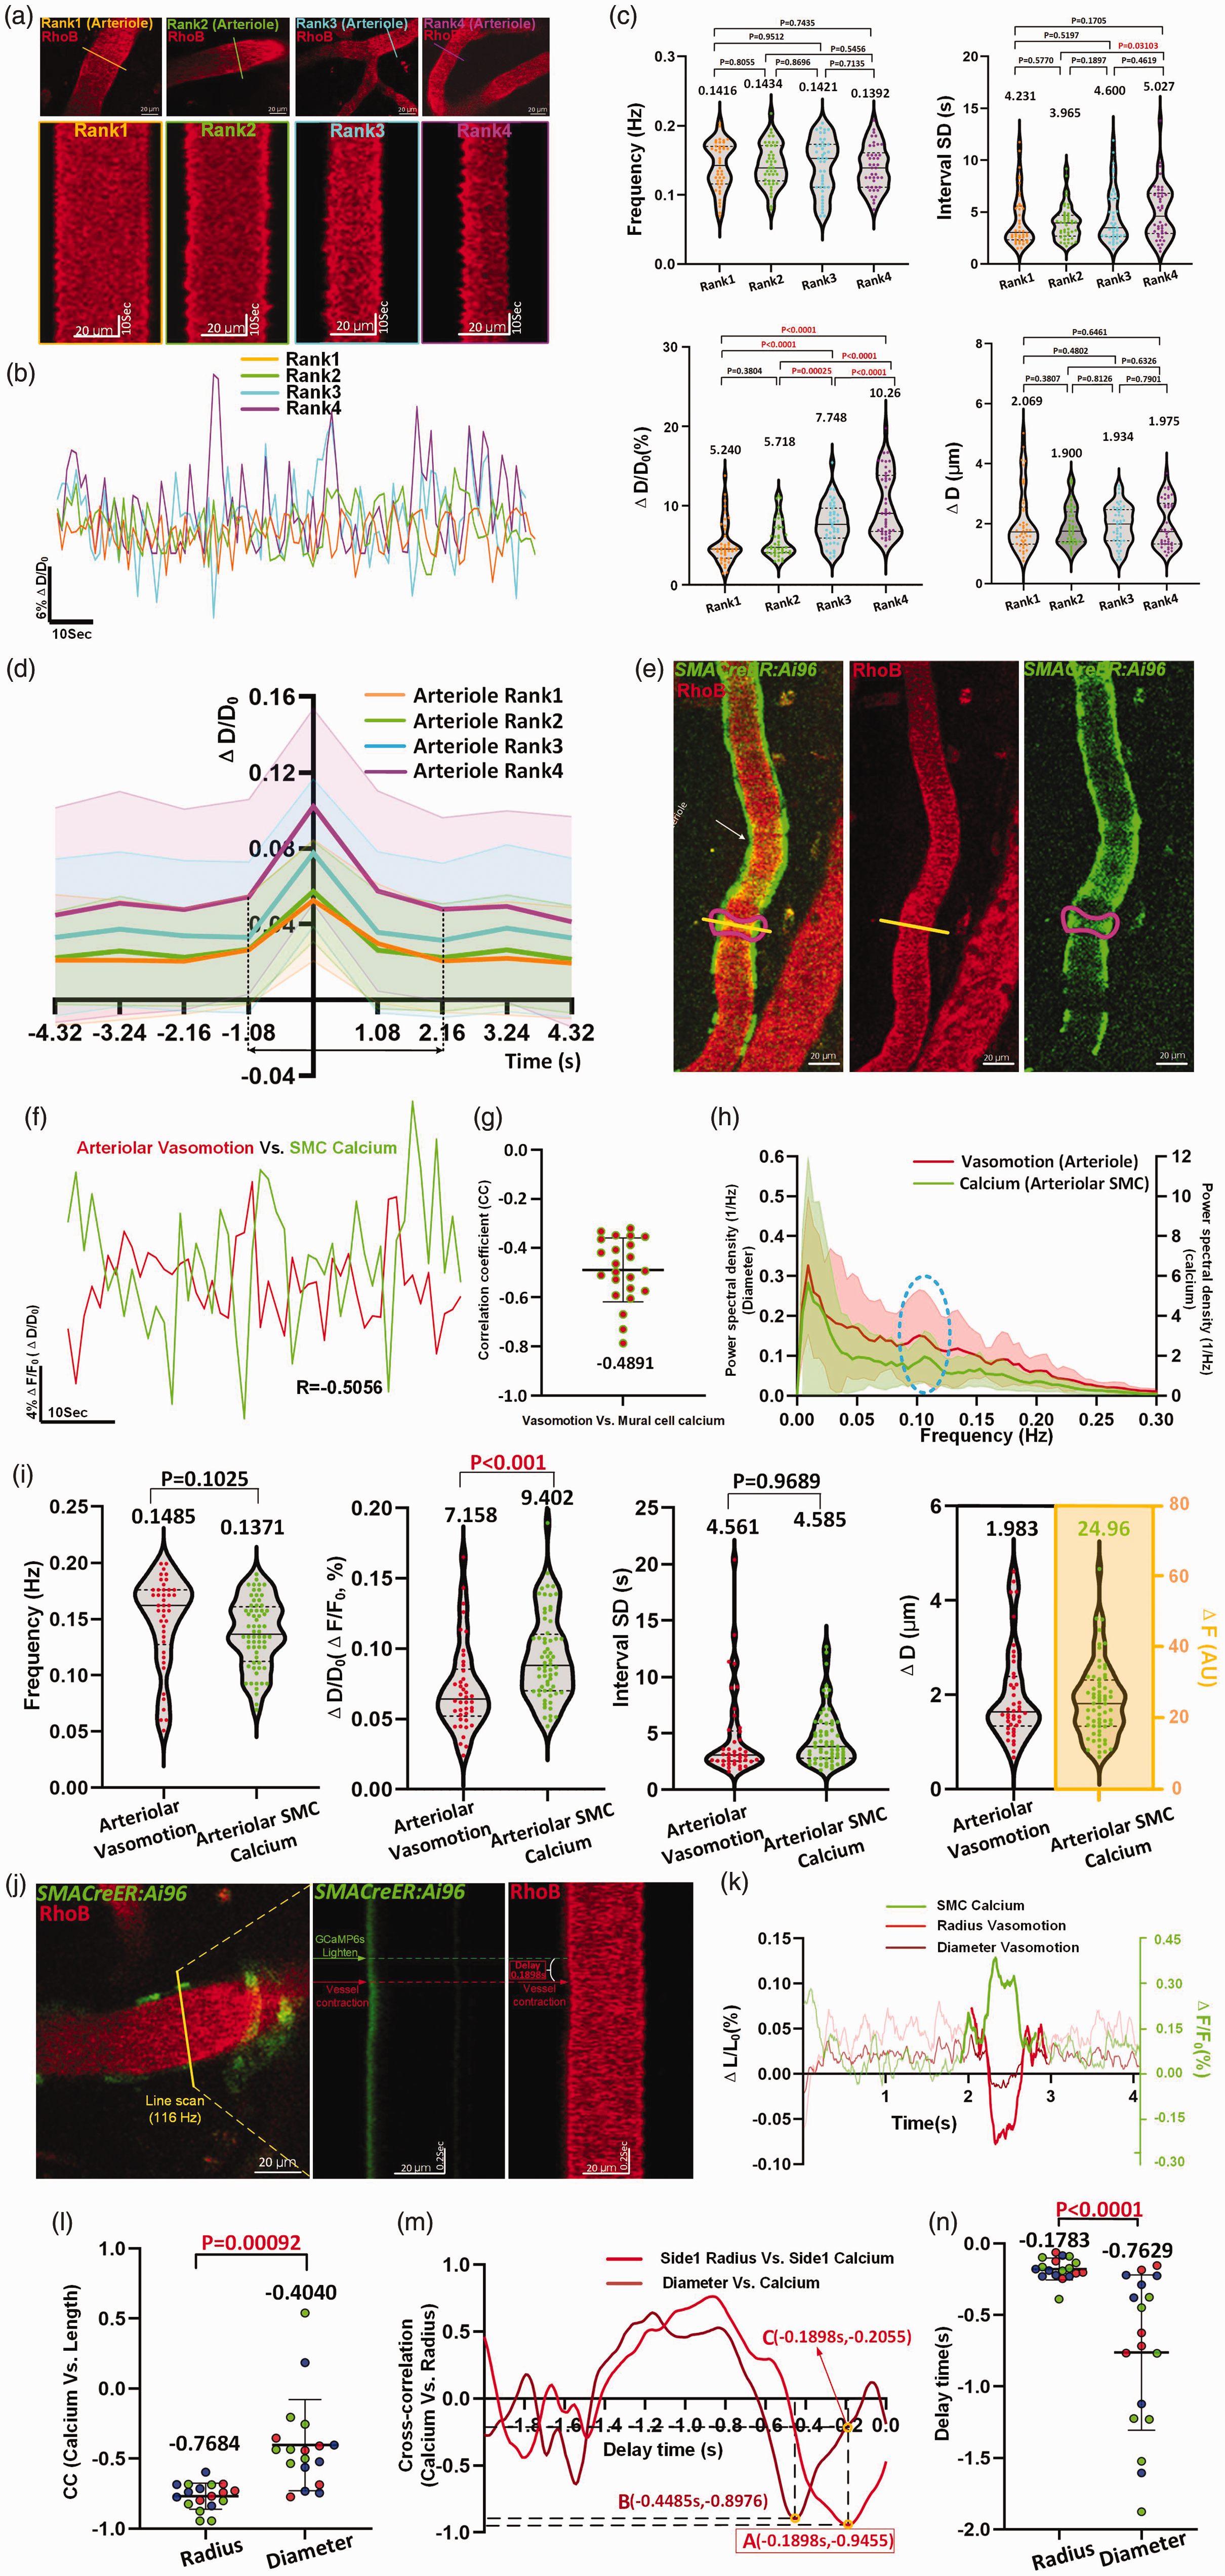
Vasomotion features in different diameter ranks of vessels and comparison between SMCs Ca2+ oscillations with vasomotions in arterioles. (a) Representative still-frame image and kymograph of cerebral arterioles of different ranks. The 170 arteriole Continued.segments collected from 16 awake mice were categorized by Quartile distribution of diameter. (Rank1: n = 42 arterioles segments in 10 awake mice, Rank2: n = 43 arterioles segments in 8 awake mice, Rank3: n = 43 arterioles segments in 10 awake mice, Rank 4: n = 42 arterioles segments in 6 awake mice). (b) Comparison of representative time-series amplitude changes trace of four rank of arterioles. (c) Vasomotion index comparison of arterioles at four diameter ranks. (d) The averaged single vasomotion events plot comparison of arteriole of four diameter ranks. For arterioles, Rank1: n = 481 vasomotion events in 7 awake mice, Rank2: n = 486 vasomotion events in 5 awake mice, Rank3: n = 510 vasomotion events in 6 awake mice, Rank4: n = 493 vasomotion events in 5 awake mice. (e) Representative still-frame images including vessels vasomotion and GCaMP6s calcium fluorescence intensity changes of the corresponding mural cell. (f) Representative time-series of mural cell calcium amplitude ratio (green solid line) and vessels vasomotion amplitude ratio (red solid line) change traces of awake mouse, and the CC comparison of two time series curves. (g) The quantification of CC values between arteriolar vasomotion and SMCs calcium (n = 23 pairs in 5 awake mice). (h) The averaged Fourier plot across mouse arterioles SMCs calcium signal change and arteriolar diameter change in awake state revealed a distinct peak centered at around 0.1 Hz (n = 38 SMCs in 6 awake mice Vs. n = 21 arterioles segments in 6 awake mice). Shaded areas represent SD. (i) Comparison between vasomotion index and calcium index (n = 64 SMCs in 5 awake mice) (j) Representative still-frame image and kymograph of cerebral arteriole using high frequency line scan. (k) Representative time series of ΔF/F0, ΔD/D0 ΔR/R0 for one arteriole (j) in the field. (l) Left column: CC value for the correlation between radius amplitude ratio and calcium amplitude ratio; Right column: CC values for the correlation between diameter amplitude ratio and the calcium. (n = 18 arterioles segments in 3 awake mice, different color dots represent different mouse). (m) The delay time between time series of calcium amplitude ratio and radius or diameter amplitude ratio used for the example in (j) with cross-correlation. The radius lags calcium activity (minimum of cross correlation) by 0.1898 s and the diameter lags electrical activity by 0.4485 s. (n) The quantification of averaged delay time comparison across arteriolar radius or diameter with SMC calcium.
Additionally, we isolated and aligned individual vasomotion events (Figure 6(d)). To our knowledge, this is the first time that the kinetics of single vasomotion events have been demonstrated. Our findings indicated that each vasomotion event cycle required approximately one second to dilate and two seconds to contract. Ideally, as 0.1-Hz rhythmicity implies that one event occurs every 10 seconds, our findings suggested that the vessel wall remains still during remaining six to seven seconds in each cycle. These analyses represented a comprehensive characterization of arteriolar networks.
To determine the role of Ca2+ oscillations in SMC in driving spontaneous vasomotion, we used awake SMACreER:Ai96 mice. Intraluminal injection of rhodamine into these mice allowed simultaneous measurements of Ca2+ oscillations and arteriolar diameter dynamics (Figure 6(e) and (f)). Consistent with previous studies,6,23 the SMC Ca2+ dynamics were inversely correlated with arteriolar vasomotion (−0.4891 ± 0.1300; 95% CI: −0.5453, −0.4329; p < 0.05) (Figure 6(g), Supplementary Table 7, Movie 7). We also identified a 0.1 Hz peak in the spectral analysis of Ca2+ oscillations, supporting that the calcium oscillation drives vasomotion (Figure 6(h)). Furthermore, there are no significant differences in frequency and interval SD between Ca2+ oscillations and vasomotion (Figure 6(i), Supplementary Table 8).
Next, we employed a high-speed line scanning approach to determine how early SMC Ca2+ activity leads to vasoconstriction (Figure 6(j)). From the time series analysis of diameter, radius and calcium activity, changes in calcium concentration clearly mirrored the vasomotor activity (Figure 6(k)). The CC value for the correlation between diameter changes and GCaMP6s fluorescence intensity changes was −0.4040 ± 0.3263 (95% CI: −0.5663, −0.2418; Figure 6(l)), which is close to previous findings. 6 Notably, we found an even significantly higher negative correlation of −0.7684 ± 0.09329 (95% CI: −0.8148, −0.7220) between radius and calcium. Furthermore, we found that SMC Ca2+ activity led to a vasocontraction within 178.3 ± 76.48 ms (95% CI: 140.3 ms, 216.3 ms), which was nearly one-quarter of the time lag calculated using the diameter (Figure 6(m) and (n)). Thus, we conclude that, for the time lag analysis between SMC Ca2+ oscillations and vasomotion (Figure 6(j)), radius-based vasomotion analysis is more precise.
During ischemic stroke, arteriole vasomotion impairment is an early pathology that persists for a long time
We performed in vivo imaging of the same MCA branches before occlusion, during occlusion, and 1 or 14 days after recanalization. We observed a sudden surge of Ca2+ in SMCs after the MCAO surgery, with signal amplitudes four times higher than basal levels (Figure 7(a) and (b)). In addition, obvious anisotropic movements between two sides of the vascular wall were observed in the kymograph (Figure 7(a), Movie 8). These Ca2+ elevations were immediately followed by strong SMC constrictions. This led to a diameter reduction from 32.82 µm to 12.29 µm within 22 seconds, and recovery to baseline was not achieved within 200 seconds (Figure 7(a) and (b)). These data suggest that significant rise of SMC Ca2+ is likely the central pathological driver of arteriolar constriction.
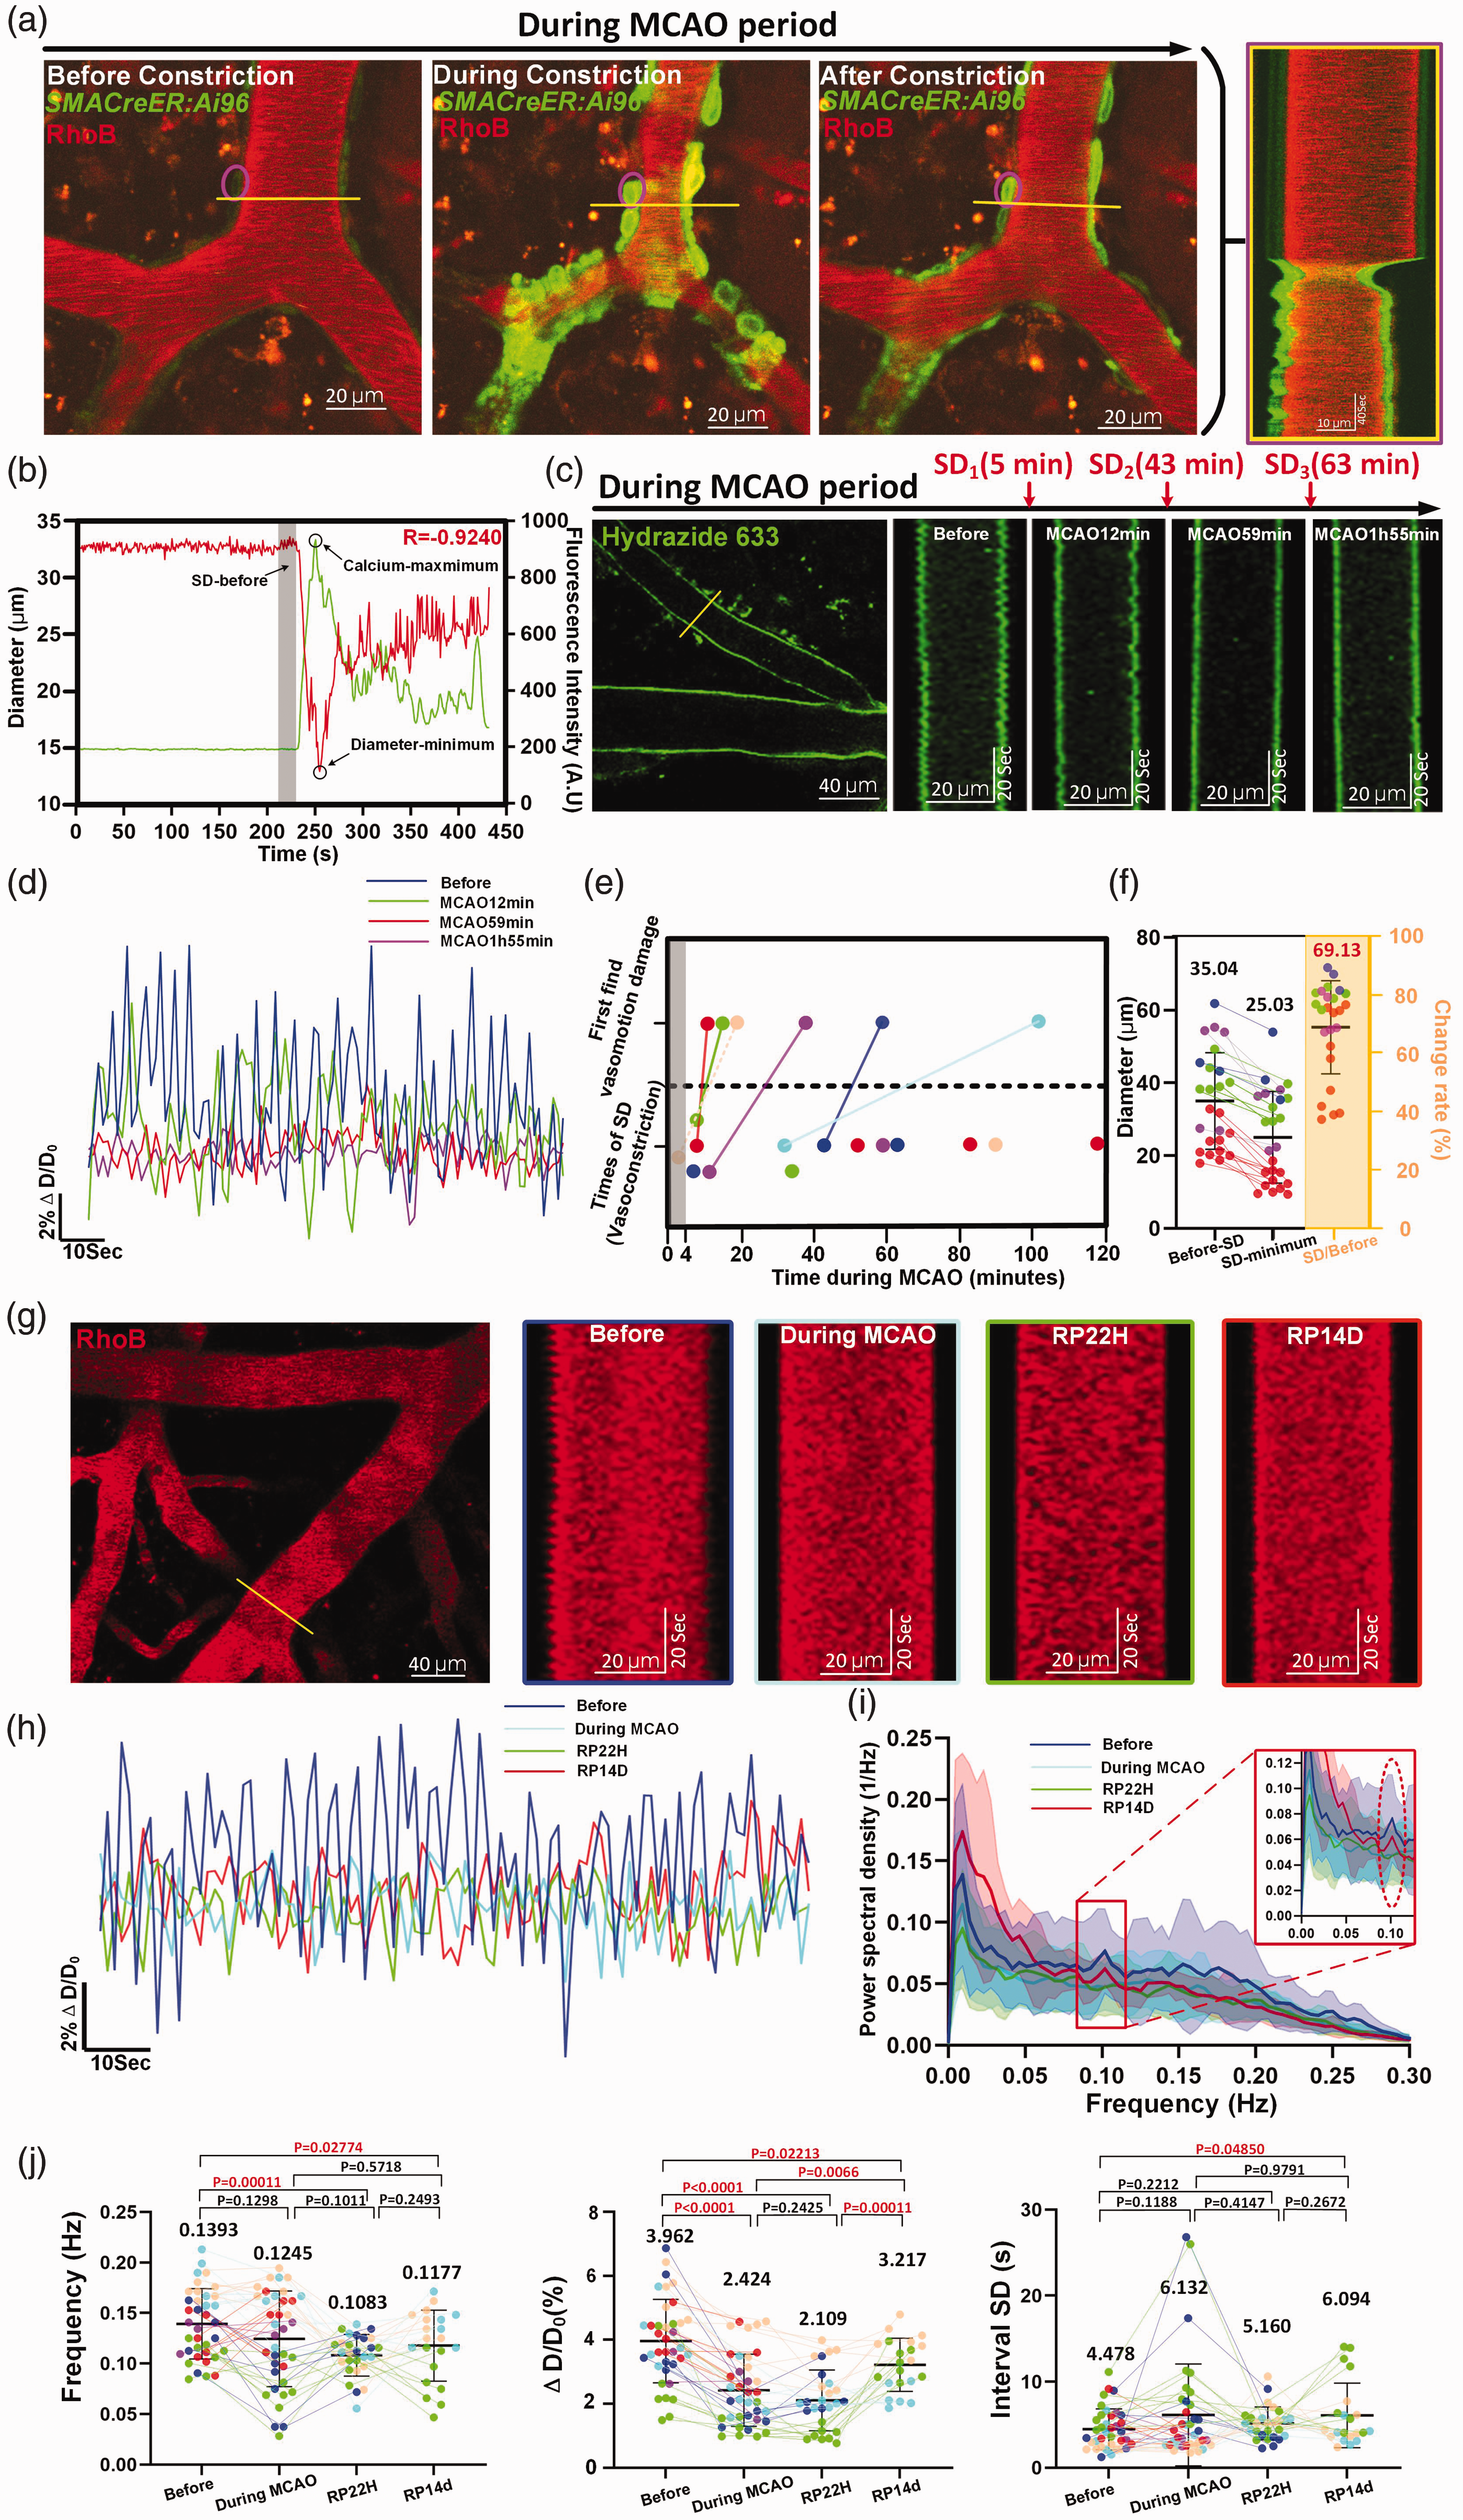
Vasomotion damage after the vasoconstriction during the a few minutes of occlusion and lasts long despite successful recanalization. (a) Time-series and kymograph showing both GCaMP6s calcium changes in a single SMC and cerebral arteriole diameter change during spreading depolarization vasoconstriction upon ischemia. The yellow line represents the reslice position. (b) Representative time-series of calcium signal and diameter change cerebral arteriole in anesthetized mouse during MCAO period. Continued.Shaded areas represent the average diameter of 15 frames (16.2 s) before spreading depolarization. (c) Time-series and kymograph showing the degree of vasomotion damage during the occurrence of spreading depolarization in MCAO period. (d) Representative time-series amplitude changes of the same cerebral arteriole during different stroke periods. (e) Top shows the first time when the vasomotion damage was observed during MCAO period (N = 6 anesthetic mice). Bottom shows times of spreading depolarization within 4–120 minutes of MCAO (n = 14 in 6 anesthetic mice). The gray column represents the time (4 minutes) taken for the mouse to 2P platform for imaging after MCAO surgery. The connecting solid lines represent time interval between vasomotion damage happening and first spread depolarization occurred during in vivo imaging recorded (the dashed line is estimated time interval). (f) Cerebral arteriolar vasoconstriction in mice (n = 25 arterioles segments in 6 mice) under anesthesia. (g) Representative still-frame image and kymographs of the same cerebral arteriole during different stroke periods. (h) Comparison of representative time-series amplitude changes trace of the same arteriole at four periods (Before, During MCAO, RP22H and RP14D). (i) The averaged Fourier plot of diameter change across four stages (n = 26 arterioles segments in 6 mice of before stroke stage, n = 26 arterioles segments in 6 mice of during MCAO stage, n = 20 arterioles segments in 4 mice of RP22H stage and n = 17 arterioles segments in 3 mice of RP14D stage) showing a distinct peak centered around 0.1 Hz before MCAO and at RP14D, while no significant peaks during MCAO and RP22H. Shaded areas represent SD. (j) Vasomotion index comparison of the same arterioles at four stages (n = 37 arterioles segments in 6 anesthetic mice of before stroke stage, n = 37 arterioles segments in 6 mice of MCAO damage stage, n = 27 arterioles segments in 4 mice of RP22H stage and n = 21 arterioles segments in 3 mice). The different color dots represent different mice and connecting lines represent diameter or vasomotion index change of the same arteriole in the different stages during stroke.
Multiple episodes of spreading depolarization induced vasoconstriction occur during ischemia.6,43 Therefore, we hypothesized that these repeated early constrictions gradually lead to damaged vasomotion. In the example data, we observed only slight deterioration 7 min after the first episode (MCAO 12 min), and nearly no vasomotor activity 16 min after the second episode (MCAO 59 min) and 52 min after the third episode (MCAO 1h 55min) (Figure 7(c) and (d)). In the six mice we examined, they displayed 1–4 episodes and an average reduction in resting diameter of 30.87 ± 16.00% (95% CI: 24.26%, 37.47%; Figure 7(e) and (f)). Notably, we consistently observed impaired vasomotion following the onset vasoconstriction in five out of six mice (Figure 7(e)). We may have missed the first vasoconstriction represented by the peach-colored dots due to the blank four-minute period required to settle mice under the microscope. These findings indicated that vasomotion impairment follows pathological arteriolar constriction driven by drastic elevation of SMC Ca2+ during early ischemia, and repeated SMC Ca2+ drastic elevation has an immediate and accumulative detrimental impact on basal vasomotion.
Next, to determine the extent of vasomotion damage, we examined vasomotor activity of pentobarbital sodium anesthetized mice at the same MCA branches position during different stroke periods (Figure 7(g)). It revealed that arterioles became inert (during MCAO) and showed very mild recovery (recanalization 14 days) (Figure 7(h) and (i)). In addition, the vasomotion indices of frequency and ΔD/D0 (Before: 3.962 ± 1.305% (95% CI: 3.527%, 4.397%) Vs. During MCAO: 2.424 ± 1.124% (95% CI: 2.049%, 2.799%) Vs. RP22h: 2.109 ± 0.9502% (95% CI: 1.733, 2.485) Vs. RP14d: 3.217 ± 0.8302% (95% CI: 2.839%, 3.595%)) reached their lowest values approximately one day after recanalization and recovered only slightly 14 days after recanalization (Figure 7(j), Supplementary Table 9). Our findings suggested that long-term vasomotion damage is a novel vascular pathology associated with stroke that may impact postischemic blood flow. Therefore, the early dysfunction of myogenic vasomotion could be a novel therapeutic target for preventing reperfusion deficits.
Discussion
In this study, we first examined spontaneous vasomotion in arteriolar networks in the mouse brain under various conditions. By adopting a time-rolling baseline method to investigate vasomotion (Figure 1), we overcame long-standing challenges of low sensitivity in the analytic methods: we isolated single vasomotion events and identified arteriolar vasomotion of different ranks. Then, we comprehensively and quantitatively characterized thirteen aspects of vasomotion, including kymographs, the time series amplitude ratio, spectrum density, vasomotion indexes (frequency, interval SD, ΔD, ΔD/D0 and average diameter), single vasomotion event kinetics, CC and DTW relationships, vasomotion propagation, and the time latency between SMC Ca2+ activity and vasomotion. For the first time, we utilized the radius of vessels, identifying asynchronous movement of the vascular wall at transverse cross-sections (Figure 4). Importantly, we identified a novel vascular pathology in which arterioles entered a vaso-inactive status following repeated spread depolarization induced vasoconstrictions during the super acute ischemia period. The damage became more severe with the increased number of vasoconstrictions (Figure 7). Therefore, vasomotion is a valuable indicator to assess the extent of vascular damage under ischemic stroke. These quantitative descriptions of spontaneous vasomotor activity improve our understanding of functional features of cerebral vasculature.
Our findings in ex vivo brains, in which presumably no neural activity was present, support the role of the intrinsic contractility of SMCs in generating vasomotion 24 (Figure 2). The 3.24-seconds vasomotion events measured for arterioles were even consistent with recent findings on the average duration of SMC Ca2+ peak. 23 This consistency suggests that single events were reliably isolated and that SMCs Ca2+ fluctuations influence vasomotion kinetics.
Furthermore, our study of asymmetric vasomotion may help address the important issue of how cerebral spinal fluid (CSF) flow in the perivascular space correlates. From a dorsal view, CSF flow speed differs along the two sides of pial arteriole wall. 44 Together with previous work suggesting that vasomotion promotes CSF flow, our findings on asymmetric movements of arteriolar walls (Figure 4) may explain this asymmetry observed in CSF flow. Additionally, different vasomotion amplitudes across different ranks in arteriolar network (Figure 6) suggest potentially different potencies in CSF flow, which might lead to different spatial clearing rates of β-amyloid (Aβ). Indeed, studies on both AD patients and model animals have reported that Aβ deposits do exhibit spatial differences related to the size of arteries.45 –47 These results suggest that strategies to specifically manipulate arteriole segments should be developed in future work.
One limitation of this study is that the behavior of awake mice was not constantly monitored during the in vivo imaging process. However, we tried to ensure stable awake imaging of mice, including excluding datasets with significant movement, training head-fixed mice to move freely on a treadmill. The mice we used for vasomotion imaging were housed under regular light-dark cycle to ensure consistent wakefulness during imaging. The other is the low vasomotion sampling frequency of 0.926 Hz when using a 512 × 512 sampling FOV which may result in the loss of high-frequency information. In the future, when using conventional TPLSM to study vasomotion, small FOVs, such as 128 × 128, should be selected to capture higher sampling frequency.
Our study of vasomotion after ischemic stroke confirmed previous findings that pial arterioles become inert during the first 24 hours after recanalization. 19 However, how early vasomotion damage is induced and how long vasomotion damage lasts have yet been established. We addressed these questions by investigating the super acute period and a longer reperfusion period (Figure 7) and found that the number of spread depolarizations appeared to have a cumulative effect on the extent of vasomotion damage (Figure 7(c)). Therefore, we speculated that increased transient Ca2+ activity can cause more severe damage to molecular machines that are responsible for cyclic SMC contractility. Prevention of drastic elevation of SMC Ca2+ could be a novel therapeutic goal to prevent delayed damage to vascular function.
In conclusion, comprehensive quantification of vasomotion is essential for understanding cerebral vascular networks, assessing vascular health and exploring therapeutic interventions. This quantitative approach provided the knowledge of vessel dynamics, and ultimately contributes to the development of improved treatments for various brain disorders such as stroke, Alzheimer’s disease and vascular dementia.
Supplemental Material
sj-pdf-1-jcb-10.1177_0271678X241258576 - Supplemental material for High-resolution vasomotion analysis reveals novel arteriole physiological features and progressive modulation of cerebral vascular networks by stroke
Supplemental material, sj-pdf-1-jcb-10.1177_0271678X241258576 for High-resolution vasomotion analysis reveals novel arteriole physiological features and progressive modulation of cerebral vascular networks by stroke by Yi-Yi Zhang, Jin-Ze Li, Hui-Qi Xie, Yu-Xiao Jin, Wen-Tao Wang, Bingrui Zhao and Jie-Min Jia in Journal of Cerebral Blood Flow & Metabolism
Footnotes
Funding
The author(s) disclosed receipt of the following financial support for the research, authorship, and/or publication of this article: J.-M.J. acknowledges the support from Westlake University startup funding, the Westlake Education Foundation, the “Pioneer” and “Leading Goose” R&D Program of Zhejiang (grant 2024SSYS0031). Zhejiang Province Natural Science Foundation (Project # 2022XHSJJ004), the National Natural Science Foundation of China (Projects # 32170961 and 31970969), HRHI programs 202309002 and 202109013 of Westlake Laboratory of Life Sciences and Biomedicine and the grants from National Natural Science Foundation of China Youth Programs of Projects # 82001267 to J.L.
Acknowledgements
We are grateful to Xu-Zhao Li, Dong-Dong Zhang and Jia-Yu Ruan for constructive suggestions during this study. We thank Dr. Y. Mu and Mr. Y. Qian from Center for Excellence in Brain Science and Intelligence Technology, Chinese Academy of Sciences for technical support on the code writing of vasomotion quantification.
Declaration of conflicting interests
The author(s) declared no potential conflicts of interest with respect to the research, authorship, and/or publication of this article.
Authors’ contributions
Yi-Yi Zhang, Conceptualization, Resources, Data curation, Software, Formal analysis, Validation, Investigation, Visualization, Methodology, Writing – original draft; Jin-Ze Li, Resources, Conceptualization, Data curation, Formal analysis, Validation, Investigation, Writing – review and editing; Hui-Qi Xie, Resources, Conceptualization, Formal analysis; Yu-Xiao Jin, Validation, Investigation; Wen-Tao Wang, Investigation, Methodology; Bingrui Zhao, Validation, Investigation; Jie-Min Jia, Conceptualization, Funding acquisition, Project administration, Resources, Supervision, Writing review and editing.
Supplementary material
Supplemental material for this article is available online.
References
Supplementary Material
Please find the following supplemental material available below.
For Open Access articles published under a Creative Commons License, all supplemental material carries the same license as the article it is associated with.
For non-Open Access articles published, all supplemental material carries a non-exclusive license, and permission requests for re-use of supplemental material or any part of supplemental material shall be sent directly to the copyright owner as specified in the copyright notice associated with the article.