
Abstract
Atherosclerosis can underly internal carotid artery stenosis (ICAS), a major risk factor for ischemic stroke, as well as small vessel disease (SVD). This study aimed to investigate hemodynamics and structural alterations associated with SVD in ICAS patients. 28 patients with unilateral asymptomatic ICAS and 30 age-matched controls underwent structural (T1-/T2-weighted and diffusion tensor imaging [DTI]) and hemodynamic (pseudo-continuous arterial spin labeling and dynamic susceptibility contrast) magnetic resonance imaging. SVD-related alterations were assessed using free water (FW), FW-corrected DTI, and peak-width of skeletonized mean diffusivity (PSMD). Furthermore, cortical thickness, cerebral blood flow (CBF), and capillary transit time heterogeneity (CTH) were analyzed. Ipsilateral to the stenosis, cortical thickness was significantly decreased in the posterior dorsal cingulate cortex (p = 0.024) and temporal pole (p = 0.028). ICAS patients exhibited elevated PSMD (p = 0.005), FW (p < 0.001), and contralateral alterations in FW-corrected DTI metrics. We found significantly lateralized CBF (p = 0.011) and a tendency for lateralized CTH (p = 0.067) in the white matter (WM) related to ICAS. Elevated PSMD and FW may indicate a link between SVD and WM changes. Contralateral alterations were seen in FW-corrected DTI, whereas hemodynamic and cortical changes were mainly ipsilateral, suggesting SVD might influence global brain changes concurrent with ICAS-related hemodynamic alterations.
Keywords
Introduction
Internal carotid artery stenosis (ICAS) is considered a major risk factor for acute stroke, contributing to approximately 10% of all ischemic strokes. 1 In addition, chronic decrease of cerebral blood flow (CBF) has been shown to adversely impact brain metabolism and contribute to cognitive decline, which can be, however, very subtle and challenging to detect through routine clinical assessments.2,3 Patients with ICAS that present no clear signs of neurologic deficits are therefore referred to as asymptomatic, even though their cognitive function might not be equivalent to age-matched healthy individuals according to more granular investigations (e.g., using dedicated tests that address different cognitive domains).2,4 Cognitive impairments have been linked to structural alterations in both white matter (WM) and gray matter (GM).5,6
The pathogenesis of ICAS is associated with vascular risk factors and can be considered a macrovascular manifestation of atherosclerosis. 7 However, atherosclerosis can also alter small vessels, leading to thickening of the endothelia due to inflammatory processes and eventually stiffening of the vessel walls, referred to as cerebral small vessel disease (SVD).8,9 When arterioles and capillaries are affected, local hemodynamic function and, subsequently, structural integrity may be considerably impacted.10,11
Magnetic resonance imaging (MRI) enables to non-invasively evaluate both the structural integrity and hemodynamic status of the brain.12,13 Regarding brain structure, WM hyperintensities (WMH) are frequently observed on routine T2-weighted images in patients with vascular risk factors, yet the relations of such alterations to brain perfusion characteristics are largely unknown. 14 Specifically, previous studies have suggested a link between ICAS-related hypoperfusion and WMH, which, however, remains controversial.15,16 Another hypothesis proposes that WMH may arise from endothelial dysfunction and perivascular tissue alterations, as seen in SVD.5,17 The WM microstructure can be assessed using diffusion tensor imaging (DTI), which can serve as a key method for tracking even subtle WM changes. 18 Consequently, DTI has been repeatedly utilized to study microstructural impairment related to vascular diseases.19,20 Previous studies have also provided compelling evidence connecting cognitive performance to WM alterations, thus linking microstructural changes to brain function.21,22 Regarding GM, cortical thickness can be assessed in order to localize atrophy, 23 which has been previously observed in both, ICAS and SVD.5,6,24 Cognitive impairments have been linked to structural alteration in WM as well as GM, with GM changes primarily related to atrophy.6,14
Besides investigating whole-brain WM changes, other DTI-based biomarkers related to vascular impairment, such as the peak width of skeletonized mean diffusivity (PSMD, a histogram-based analysis of the distribution of MD within a WM skeleton) and bi-tensor-derived free water (FW, for determining the FW and tissue content in each voxel and correcting standard DTI indices accordingly for FW content) have been introduced recently.25,26 Specifically, PSMD could capture diffuse alterations in WM resulting from the non-focal impacts of SVD.11,26 With a bi-tensor model, a more dedicated analysis of the contribution of FW to pathophysiological changes in addition to assessments of tissue alterations, using the FW-corrected DTI indices, is possible.25,27 Herein, FW is considered to represent extracellular water, which has been recently proposed as highly relevant in SVD, since extracellular water is increasing in inflammation and endothelial dysfunction.27,28 The combination of PSMD, FW, and WMH has been shown to be highly sensitive for evaluating the extent of SVD-related diffuse alterations across the brain’s WM.11,27
Concerning hemodynamic alterations in patients with ICAS, arterial spin labeling (ASL)-based evaluation of CBF is a valuable method to investigate perfusion.3,29 Since ICAS directly affects the blood supply to the brain, this parameter can be used to investigate changed perfusion patterns. 3 Furthermore, capillary transit time heterogeneity (CTH), derived from parametric modeling of dynamic susceptibility contrast (DSC)-MRI, is a promising parameter to evaluate changes in capillary flow patterns. 30 Therefore, CBF and CTH can address vascular processes and give insights into ICAS-related alterations. The combination of CBF and CTH allows to investigate SVD-related capillary dysfunction. 31
To date, there has not yet been a comprehensive examination of the interplay between structure and hemodynamics in ICAS-affected WM. Furthermore, the role of SVD in conjunction with structural and hemodynamic processes represents a gap in our current understanding of the pathophysiology related to ICAS. Against this background, our study aimed to investigate the impact of high-grade asymptomatic ICAS on the brain's structure and hemodynamics, specifically targeting the WM as the primary location of manifestation of ICAS- and SVD-related changes. By comparing healthy individuals with asymptomatic ICAS patients, we aimed to investigate unexplored influence of SVD within ICAS through MRI-based markers linked to SVD. Further, we aimed to determine the potential relationship between chronic hypoperfusion and cognitive performance by assessing associations with brain structure.
Methods
Standard protocol approvals, registrations, and patient consents
The Institutional Review Board of the Klinikum rechts der Isar of the Technical University of Munich (TUM) approved this monocentric prospective study, which was conducted according to the Human Research Committee guidelines of our university. Written informed consent was provided by all participants, and the study was conducted following the Declaration of Helsinki.
Study design and patient inclusion
Patients with an incidental finding of an asymptomatic ICAS were recruited from the outpatient clinic of the Department for Vascular and Endovascular Surgery, healthy controls through advertisement between May 2015 and May 2017. Thirty patients with high-grade unilateral asymptomatic ICAS (>70% according to North American Symptomatic Carotid Endarterectomy Trial [NASCET] criteria) and 30 healthy age-matched volunteers without ICAS were included in this prospective study. 32 In four patients, an additional mild or moderate ICAS was detected contralaterally to the side of high-grade ICAS. Excluded from this study were individuals with a history of stroke, transitory ischemic attack, known structural brain abnormalities (e.g., silent territorial ischemic lesions or bleedings), and general MRI contraindications (e.g., cochlear implants).
The examinations of the participants included basic neurological and cognitive assessments and brain MRI examinations, which were carried out on the same day per participant. The assessment of cardiovascular risk factors in this study comprised diagnosed or current medical treatment for hypertension, diabetes mellitus, and hyperlipidemia (Table 1). Two patients were excluded from this study’s analysis due to insufficient MRI data quality (i.e., insufficient quality of DTI maps in one patient and artifacts in DTI data in another patient), leading to a final sample size of 28 patients and 30 healthy controls.
Demographic data.
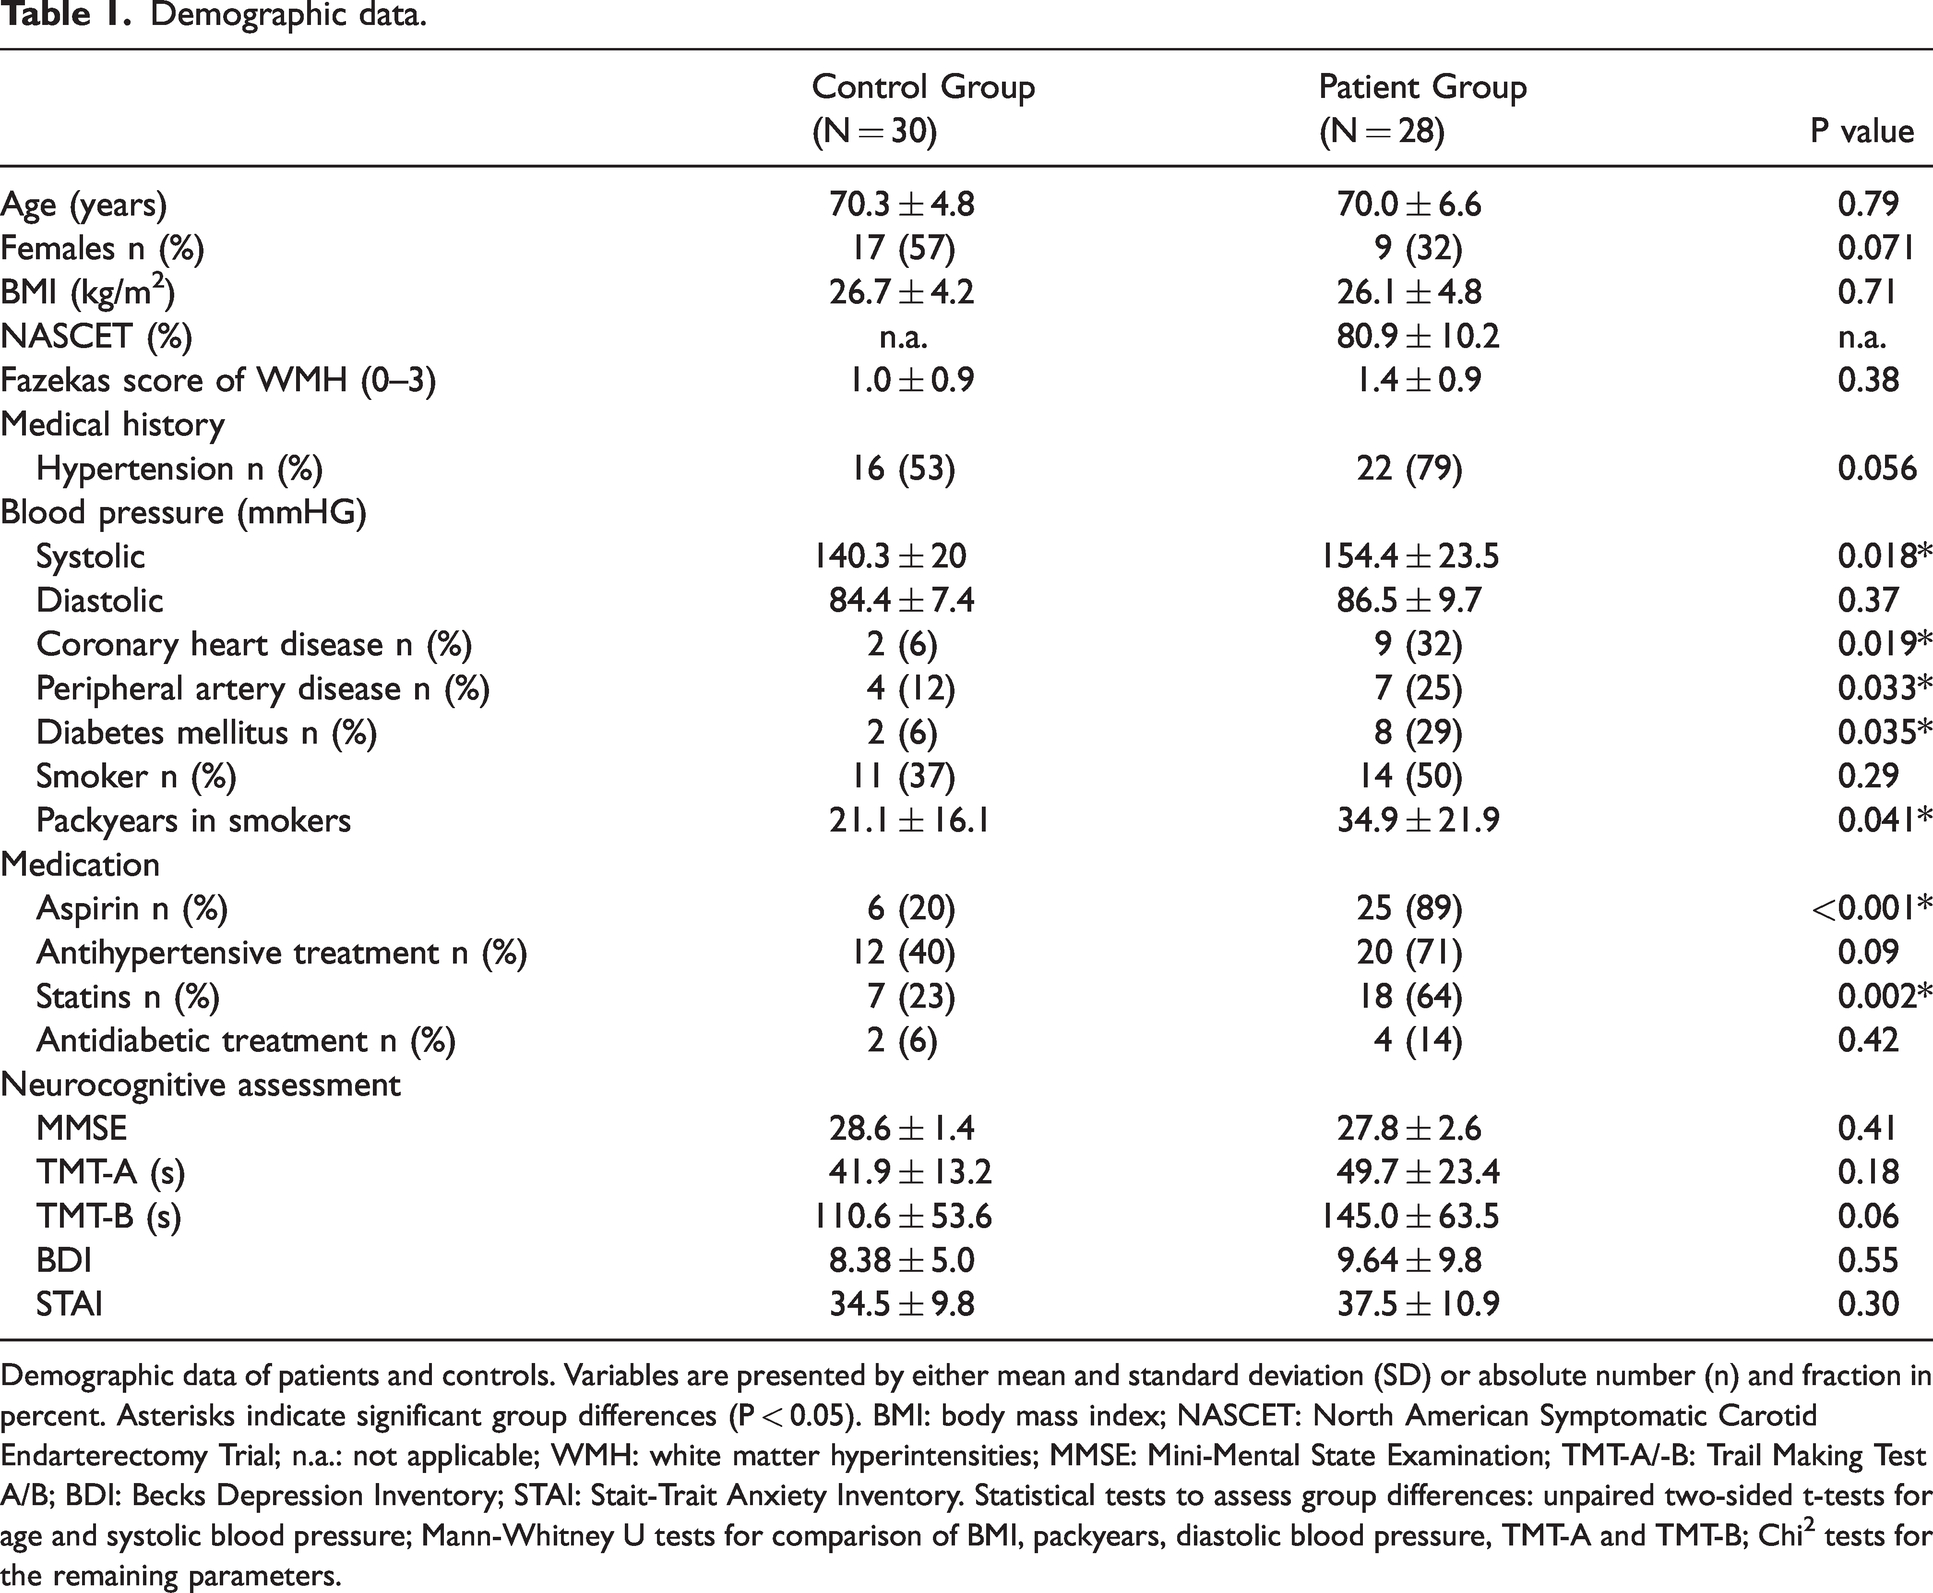
Demographic data of patients and controls. Variables are presented by either mean and standard deviation (SD) or absolute number (n) and fraction in percent. Asterisks indicate significant group differences (P < 0.05). BMI: body mass index; NASCET: North American Symptomatic Carotid Endarterectomy Trial; n.a.: not applicable; WMH: white matter hyperintensities; MMSE: Mini-Mental State Examination; TMT-A/-B: Trail Making Test A/B; BDI: Becks Depression Inventory; STAI: Stait-Trait Anxiety Inventory. Statistical tests to assess group differences: unpaired two-sided t-tests for age and systolic blood pressure; Mann-Whitney U tests for comparison of BMI, packyears, diastolic blood pressure, TMT-A and TMT-B; Chi2 tests for the remaining parameters.
Cognitive assessment
Participants underwent the Mini-Mental State Examination (MMSE) to assess general cognitive function. 33 Participants also completed the Trail Making Test A (TMT-A) and B (TMT-B), evaluating processing speed and executive functions. 34
Given that neuropsychiatric factors could confound cognitive assessments, participants completed the Beck Depression Inventory (BDI) for depressive symptoms. 35 Finally, the State-Trait Anxiety Inventory (STAI) was used for measuring anxiety levels. 36
Imaging protocol
Participants underwent imaging on a 3-Tesla MRI system (Ingenia, Philips Healthcare, Best, The Netherlands) using a 16-channel head/neck coil for a clinically used angiography and a 32-channel head receive coil. The imaging protocol comprised DTI to evaluate WM microstructure including SVD-related changes and fluid-attenuated inversion recovery (FLAIR) sequences for screening regarding ischemic brain lesions and assessing WMH. Moreover, a three-dimensional (3D) T1-weighted turbo field echo (TFE) sequence was obtained to assess macrostructure in terms of cortical thickness. Furthermore, we assessed CBF using pseudo-continuous ASL (pCASL) to address perfusion changes. Water as a freely diffusible tracer can yield more accurate CBF estimates compared to quickly equilibrating intravascular tracers such as Gadolinium (Gd)-based agents, which are commonly used for DSC imaging.
37
Additionally, we evaluated CTH based on parametric modeling of DSC-MRI. The sequence parameters were set as follows:
DTI: spin-echo echo planar imaging (EPI) with 32 gradient directions, b = 800 s/mm2, repetition time (TR) = 12.9 s, echo time (TE) = 61 ms, Half Fourier = 0.7, SENSE = 2, 60 slices, matrix = 112 ×110, voxel size = 2.0 × 2.0 × 2.0 mm3, number of signal averages (NSA) = 2, acquisition time =15:30 min. T2-weighted FLAIR: TR = 4800 ms, TE = 289 ms, flip angle (α) = 90°, 163 slices covering the whole brain, field of view (FOV) = 250 × 250 × 183 mm3, acquisition voxel size = 1.12 × 1.12 × 1.12 mm3 (reconstructed voxel size = 1.0 × 1.0 × 1.0 mm3), turbo spin echo (TSE) factor = 167, inversion delay = 1650 ms, acquisition time = 4:34 min. 3D T1-weighted TFE: inversion time (TI) = 1000 ms, TR = 2300 ms, TE = 4 ms, α = 9°, SENSE = AP/RL 1.5/2.0, 170 slices covering the whole brain, FOV =240 × 240 × 170 mm3, voxel size = 1.0 × 1.0 × 1.0 mm3, acquisition time = 5:59 min. pCASL: based on a phase contrast angiography of the neck area, the labeling plane was customized for each participant. This ensured the perpendicular labeling in the left and right ICA, and the labeling plane was located at least 2 cm distal to the stenosis. Label duration = 1800 ms, post-label delay =2000 ms, segmented 3D multi-echo gradient-spin echo (GRASE) readout, four background suppression pulses and proton density-weighted (PDw) scan, TR = 4377 ms, TE = 7.4 ms, α = 90°, 16 slices, 3 dynamics, acquisition voxel size = 2.75 × 2.75 ×6.0 mm3 (reconstructed voxel size = 2.73 × 2.86 ×6.0 mm3), TSE factor = 19, EPI factor = 7, acquisition time = 5:41 min. DSC-MRI: acquisition during a bolus injection of weight-adjusted Gd-DOTA (DOTAREM® 0.5 mmol/mL, Guerbet GmbH, Roissy, France; concentration = 0.5 mmol/mL, dose = 0.1 mmol/kg with at least 7.5 mmol per participant, flow rate = 4 mL/s, injection = 7.5 s after DSC-MRI started) using a single-shot gradient echo EPI readout. TR = 1513 ms, TE = 30 ms, α = 60°, 80 repetitions, FOV = 224 × 224 × 100 mm3, voxel size = 2 ×2 × 3.5 mm3, NSA = 1, 26 slices, acquisition time = 2:01 min.
Image processing
Image processing of the MRI data was performed using FMRIB Software Library (FSL version 6.0.4; https://fsl.fmrib.ox.ac.uk/fsl/fslwiki), SPM12 (SPM version 7771, https://www.fil.ion.ucl.ac.uk/spm/software/spm12/), and MATLAB (version R2020b; The MathWorks Inc., Natick, MA, USA). An overview of the processing pipeline can be found in Figure 1.
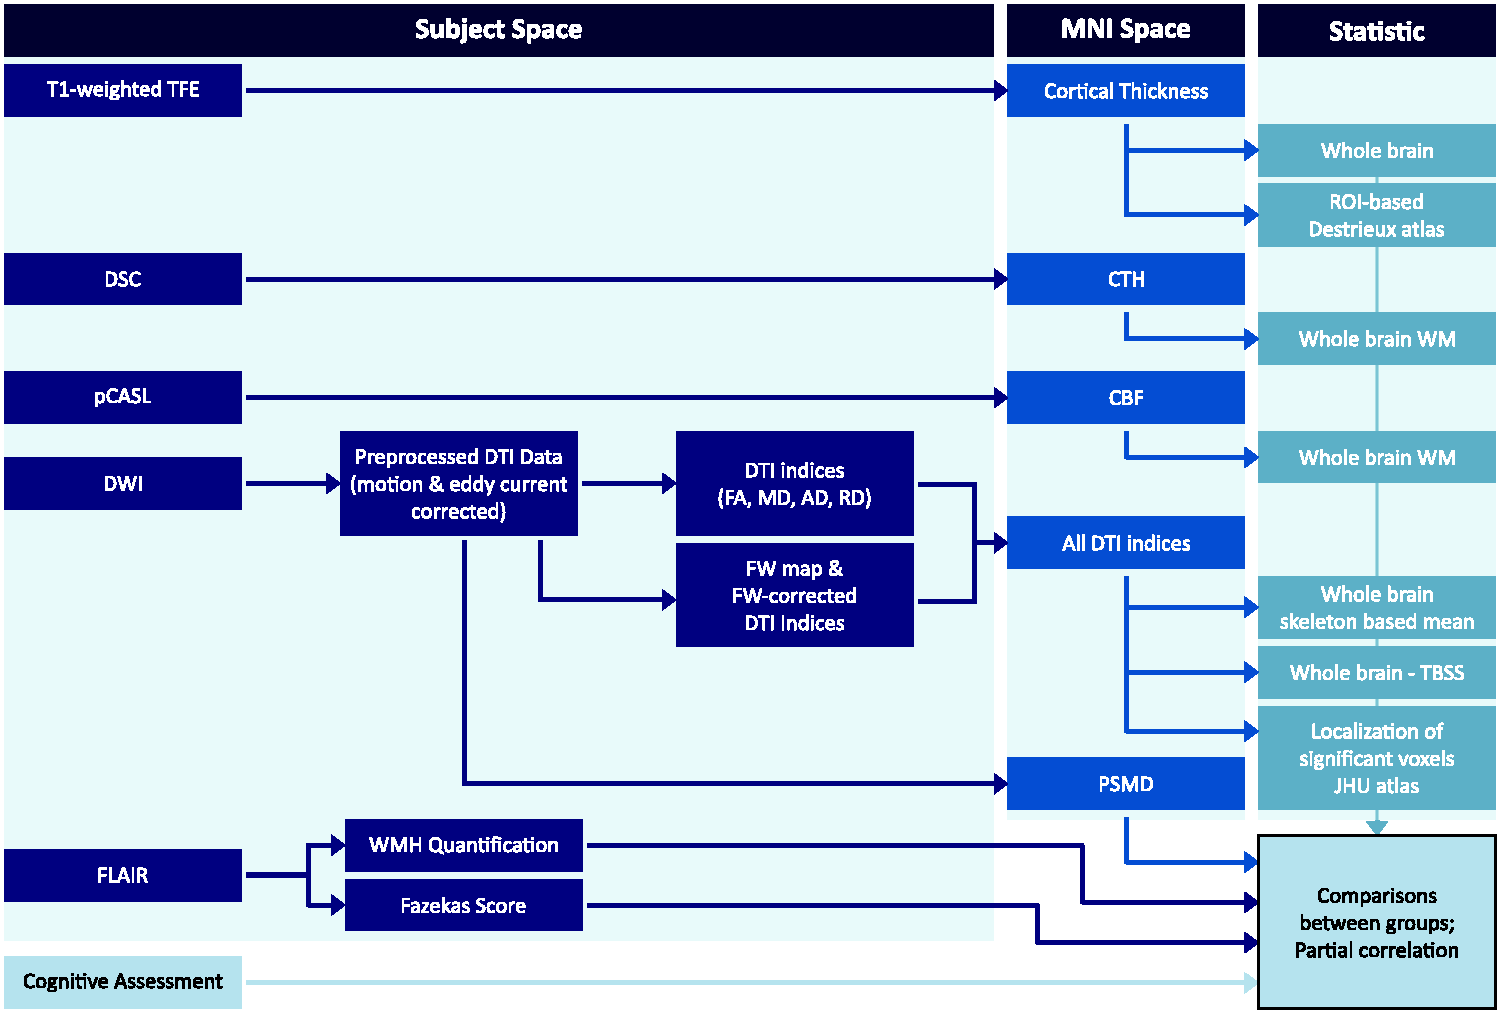
Processing overview. The MRI data underwent processing using different software applications. Following DTI preprocessing, PSMD was computed based on the eddy-current and motion-corrected images. WMH quantification was performed in the individual space using FLAIR images. All other maps were subjected to non-linear coregistration to MNI space using respective pipelines. To investigate ICAS-associated changes on group level, the images of patients with left-sided stenosis were flipped to the right. Further analysis was conducted within the skeleton (for DTI indices) or within a WM mask, which was segmented based on the T1-weighted images using a threshold of 0.9 for the hemodynamic parameters (CTH, CBF). Additional regional analysis was carried out for cortical thickness and significant DTI indices to determine their specific spatial localization within the brain.
Gray matter/cortical thickness
The CAT12 toolbox (version 12.8; http://www.neuro.uni-jena.de/cat/), integrated in SPM12, was used to employ a projection-based method to calculate the cortical thickness.23,38 Data of patients with left-sided stenosis were flipped to investigate ICAS-related alterations uniformly on one hemisphere.
Each image was visually screened for any artifacts. After automated tissue segmentation of GM, WM, and cerebrospinal fluid (CSF), cortical thickness at each point on the surface was calculated as the distance between the GM/WM boundary and the pial surface. The thickness estimates were then adjusted for local curvature to provide accurate measurements. 23 Further, a voxel of interest (VOI) analysis using the Destrieux atlas was performed, extracting mean cortical thickness in 74 different regions per hemisphere as implemented in the CAT12 standard processing algorithm. 39 This was done to accurately determine cortical thickness with respect to single anatomical regions. 39
White matter
Analysis of WM included WMH assessment by a neuroradiologist (5 years of experience) using the FLAIR sequence, who graded according to the Fazekas score (from 0 to 3). 40 Furthermore, we used a lesion segmentation approach (version 3.0.0; https://www.applied-statistics.de/lst.html) as an additional toolbox for the SPM software to objectively quantify the WMH load for the entire brain and each hemisphere separately (in addition to the qualitative assessment by the neuroradiologist), with a threshold of 0.3. 41
For processing the DTI data with FSL, we used tract-based spatial statistics (TBSS) adhering to the guidelines provided in the TBSS manual (https://fsl.fmrib.ox.ac.uk/fsl/fslwiki/TBSS/UserGuide). 42 Data of patients with left-sided stenosis were flipped to investigate ICAS-related alterations uniformly on one side. Prior to applying eddy current correction using FSL's eddy tool, we visually inspected the data for artifacts. Subsequently, we generated whole-brain masks for each participant to eliminate non-cerebral regions, utilizing the brain extraction function (BET; https://fsl.fmrib.ox.ac.uk/fsl/fslwiki/BET). A multivariate linear fitting algorithm was employed to voxel-wisely compute a diffusion tensor, resulting in three pairs of eigenvalues and eigenvectors. From these, we derived diffusion scalar metrics for each voxel, including fractional anisotropy (FA), MD, axial diffusivity (AD), and radial diffusivity (RD).
The FW analysis was done using a customized MATLAB script. 28 In short, a bi-tensor model was applied to each voxel to determine the FW component and a FW-corrected tissue compartment diffusion tensor, resulting in FA tissue (FAt), MD tissue (MDt), AD tissue (ADt), and RD tissue (RDt). In addition, FW maps were calculated, referring to the amount of FW in each voxel that could range from 0 to 1.
Further steps included non-linear co-registration to the Montreal Neurological Institute (MNI) space and projection onto the skeleton, using a threshold of 0.3 to exclude peripheral tracts and account for partial volume effects (PVE). We conducted this procedure separately for FA, FAt, MD, MDt, AD, ADt, RD, RDt, and FW maps. Additionally, we calculated the average of each of the DTI indices within the skeleton for quantitative comparison of each parameter on a whole-brain level.
Furthermore, whole-brain PSMD (version 1.8.3; http://www.psmd-marker.com/) was calculated in accordance with previous recommendations (i.e., on motion-corrected DTI data) using FSL on the standard MD map. 26 This parameter is based on the histogram spreading of MD values between the 5th and 95th percentile within the WM skeleton as provided by the PSMD package. 26
Hemodynamics
Regarding hemodynamic parameters, CBF and CTH were calculated using MATLAB scripts and SPM12 as previously described.3,43 In short, CTH maps were generated by parametric modeling of DSC-MRI data, based on the work by Jespersen and Ostergaard and Mouridsen et al.30,44 The tissue residue function R(t) is modeled by employing a specialized gamma variate function, characterized by two key parameters, known as α and β, which effectively describe the distribution of times it takes for blood to pass through a network of parallel capillaries in the brain.30,44
To accurately estimate these parameters, an expectation–maximization-type algorithm is utilized.
45
Using this model, we were able to calculate the CTH, a measure of the variability in the time it takes for blood to traverse the capillary network. We represented this heterogeneity as the standard deviation of the transit times, with larger values indicating greater variability. Furthermore, CBF calculations were implemented according to the consensus statement of the International Society for Magnetic Resonance in Medicine (ISMRM).
46
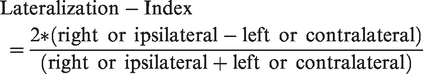
To obtain pCASL-based CBF maps, both label and control images were corrected for motion, averaged, subtracted, and CBF was calculated according to equation (1) from Alsop et al., with M0 (i.e., the PDw image) being used for normalization.3,43,46 Then, CBF maps were smoothed using a full width at half maximum (FWHM) 3D Gaussian kernel of 5 mm. Due to our interest in WM hemodynamics, the individual WM masks were thresholded at 0.9 to reduce PVE, and mean values of CBF and CTH were calculated within this mask. To assess the altered hemodynamic patterns, an asymmetry index was introduced:
Statistics
Statistical analysis was performed in MATLAB (version R2020b). Data are presented as mean and standard deviation (SD). We checked for Gaussian data distribution using the Shapiro-Wilk test for all data except within the TBSS and CAT12 pipelines, respectively. Subsequently, if normality assumptions were fulfilled for both groups, we applied the F-test to test for equal variances. Based on the outcomes of the normality and equal variances tests, we selected one of the following statistical tests for further group comparisons. If both groups exhibited normal distributions with equal variances, we utilized unpaired two-sample t-tests. If either group's distribution was not normal, we used non-parametric Mann-Whitney U tests. This procedure was done for the skeleton-based mean DTI parameters, quantitative WMH load, PSMD, atlas-based cortical thickness data, lateralized CBF and CTH, demographics, and cognitive data. For categorical variables in the demographic data including the Fazekas scores, Chi2 tests were used. One participant in the control group was excluded from the analysis of TMT-A and -B due to a test result differing more than 4.5 SDs from the mean performance in the control group.
Whole-brain cortical thickness in the CAT12 pipeline and DTI-derived parameters in the TBSS pipeline were voxel-wisely compared to determine group differences between ICAS patients and controls, using a two-sample t-test. Within the TBSS pipeline, this was done by applying 5,000 random permutations, threshold-free cluster enhancement (TFCE), and family‐wise error (FWE) correction, adjusted for age and sex. Significant voxels were localized within VOIs using the Johns Hopkins University (JHU) ICBM-DTI-81 WM labels atlas. 47 For visualization, the resulting maps were thresholded at p = 0.05 and thickened using the tbss_fill command (Figure 2). Furthermore, we performed partial correlation analysis, adjusting for age and sex and cardiovascular risk factors that differed significantly between the patient and control groups, to evaluate the associations between structural, cognitive, and hemodynamic MRI parameters. We corrected for multiple testing using MATLAB's ‘mafdr' function, which implements the Benjamini and Hochberg false discovery rate (FDR) correction. A p-value of ≤0.05 was considered statistically significant.
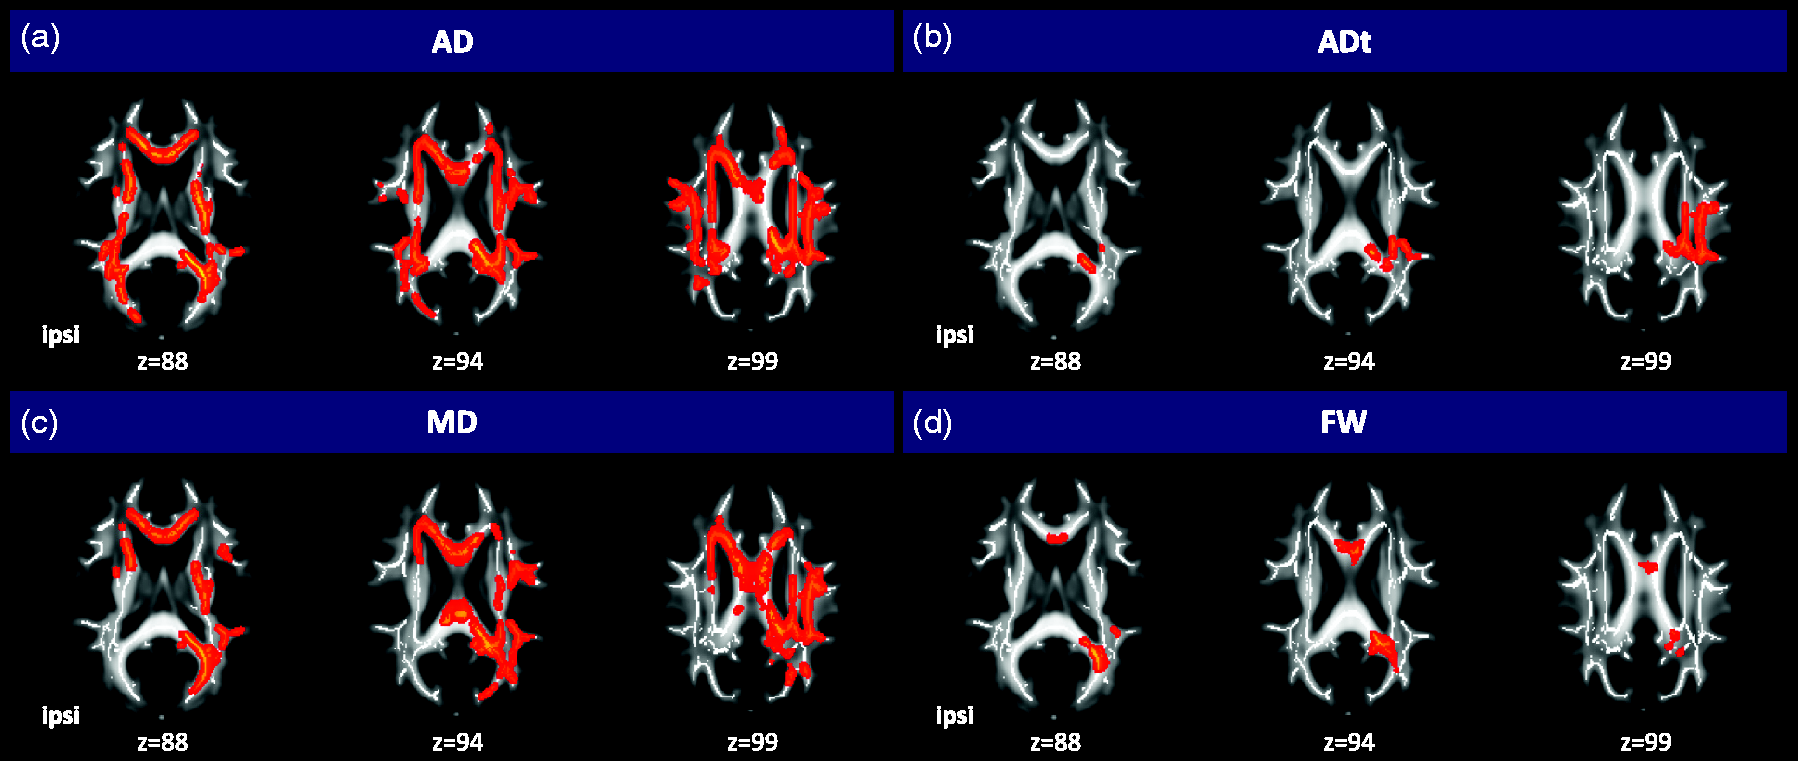
Significant TBSS results for group comparison of DTI indices. Top row: significant results of the group-wise comparison of standard AD (a) and FW-corrected ADt (b). Bottom row: significantly higher standard MD (c) and FW (d) in patients than controls after correction for age and sex. For display, the presented voxels are magnified using tbss_fill, which creates the bold red framing around the significant voxels (p < 0.05). AD and MD present widespread alterations involving the whole skeleton, while changes in ADt and FW are more restricted mainly to the corpus callosum and the contralateral hemisphere. There is some overlap with ADt in regions exhibiting significantly higher FW, but the alterations in ADt are more extensively distributed. Note: To specifically address ICAS-related changes in the ipsilateral (ipsi) compared to the contralateral hemisphere, data of patients with left-sided stenosis were flipped.
Data availability statement
The authors have full access to all study data and participant consent forms when applicable and take full responsibility for the data, the conduct of the research, the analysis and interpretation of the data, and the right to publish all data. The data that support the findings of this study are available from the corresponding author and co-authors upon reasonable request.
Results
Demographics and cognitive performance
Twenty-eight patients (70.0 ± 6.6 years, nine females) with high-grade unilateral asymptomatic ICAS and 30 healthy age-matched volunteers without ICAS (70.3 ± 4.8 years, 17 females) were included (Table 1).
Cardiovascular risk factors were more common in the patient group, including a significantly higher systolic blood pressure in patients (p = 0.018) and a higher prevalence of diabetes mellitus (p = 0.035), as well as higher manifestation rates of atherosclerosis (i.e., higher count of coronary artery disease [p = 0.019] and peripheral artery disease [p = 0.033]; Table 1).
While patients performed similarly to controls in MMSE (p = 0.41), patients needed more time to complete TMT-A (p = 0.18) and TMT-B (p = 0.06), yet without a statistically significant difference between groups (Table 1). Furthermore, BDI and STAI scores did not significantly differ between patients and controls (BDI/STAI p = 0.55/p = 0.30, Table 1).
Gray matter
Whole-brain analysis of cortical thickness revealed no significant differences in patients compared to controls (p = 0.12), with an overall whole-brain mean cortical thickness of 2.46 ± 0.84 mm in controls and 2.42 ± 0.75 mm in patients.
The VOI analysis indicated lower cortical thickness in 82% of all VOIs in ICAS patients, equally involving both hemispheres. After adjusting for multiple comparisons, the posterior dorsal cingulate cortex (PCC) ipsilateral to the ICAS remained significant (mean cortical thickness in controls/patients 2.64 ± 0.19/2.47 ± 0.14 mm, p = 0.024). Additionally, cortical thickness of the temporal pole differed significantly between groups (controls/patients 3.14 ± 0.15/2.97 ± 0.21 mm, p = 0.028).
White matter
The WMH burden was higher in patients but did not differ significantly between groups (Fazekas scores: p = 0.38; quantitative WMH load controls/patients 5448 ± 5952 mm3/8025 ± 7953 mm3, p = 0.17). In patients, WMH voxel count in the hemisphere contralateral to the stenosis (4016 ± 3543 mm3) did not differ significantly from the ipsilateral hemisphere (4009 ± 4760 mm3, p = 0.98). Furthermore, WMH load in controls was similar in both hemispheres (left/right hemisphere 2517 ± 3061mm3/2931 ± 2930 mm3), presenting a rather symmetric distribution between hemispheres (p = 0.59).
The DTI analysis within the WM skeleton revealed higher MD, RD, and AD compared to MDt, RDt, and ADt in both groups, and FAt was increased compared to FA (Figure 3), illustrating the influence of FW on DTI indices. In contrast to non-corrected DTI indices, none of the FW-corrected tissue indices presented significant differences between ICAS and controls when averaged over the whole WM skeleton (Figure 3). However, FW was significantly higher in patients than in controls (p < 0.001).
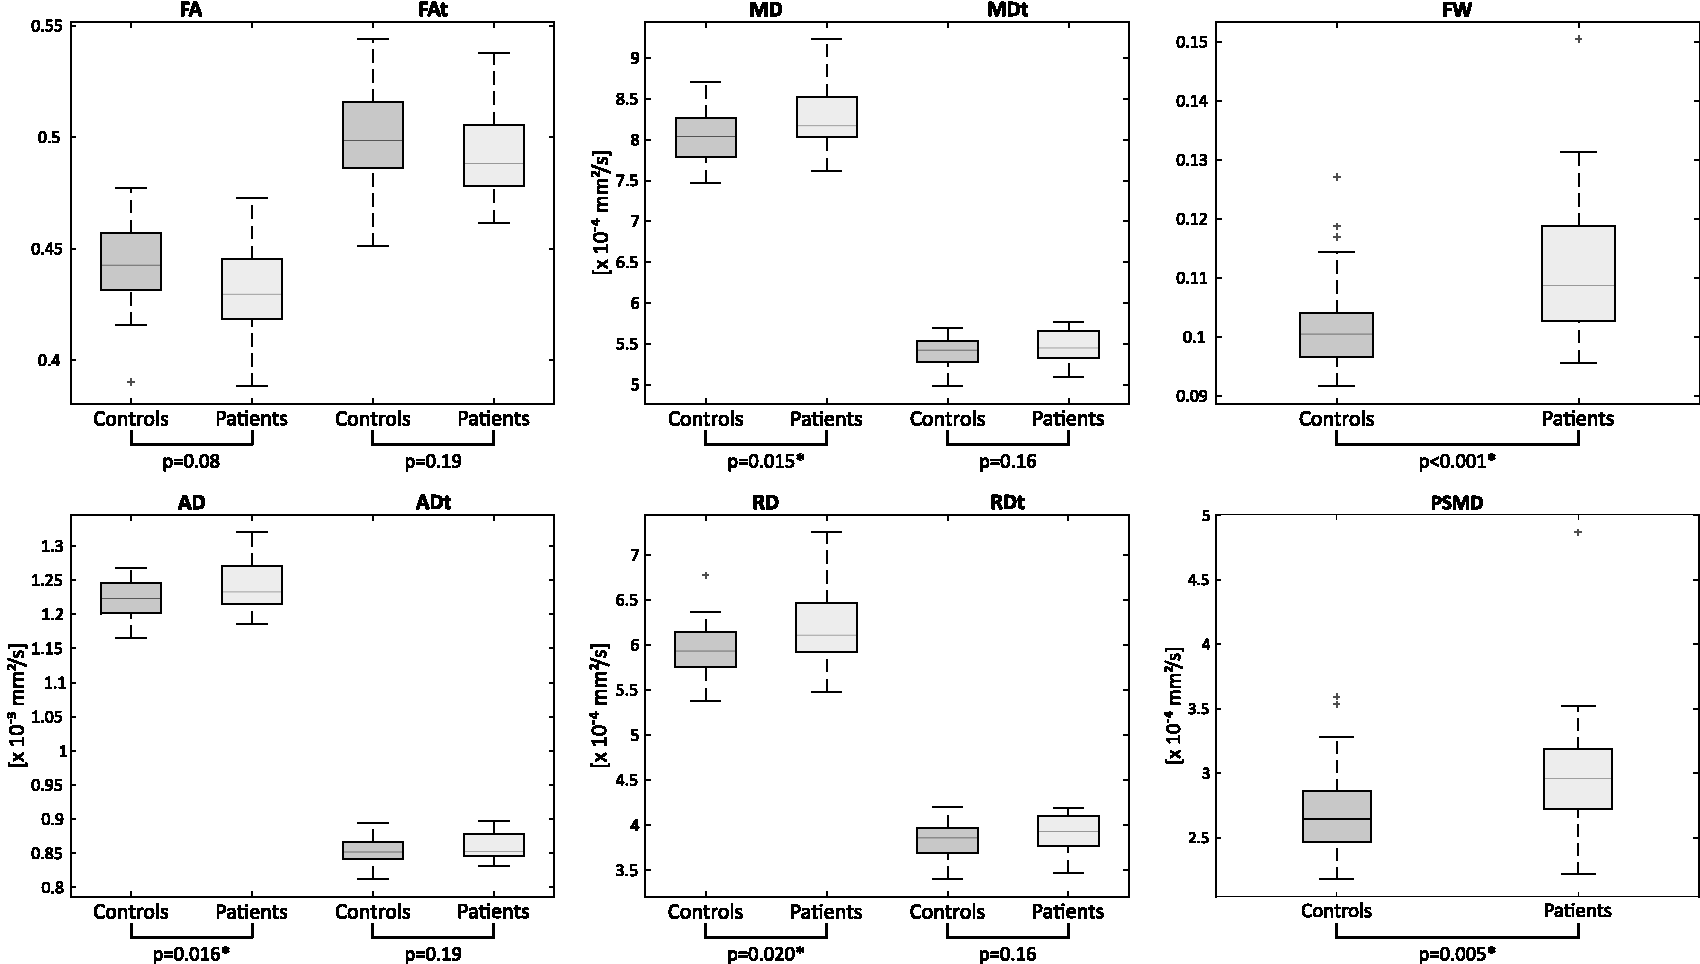
Skeleton-based whole-brain analysis of WM microstructure. Global averages of diffusion measures were assessed within the study-specific WM skeleton, which was obtained during the TBSS processing. Boxes illustrate data of controls or patients, with the center line representing the median and the bottom and top lines indicating the 25th and 75th percentiles, respectively. The whiskers indicate the range of data points not considered outliers, while outliers are shown using the ‘+' symbol. Outliers are defined as data points that are outside 1.5 times of the interquartile range from the upper or lower boundary of the box. Significance of group comparisons is indicated by p-values below the panels. The whole-brain analysis of the DTI indices revealed a significant increase in FW levels among patients (p < 0.001) and increased PSMD (p = 0.005) in patients.
The TBSS analysis displayed widespread and significant increases of AD, MD, FW, and ADt in patients as compared to controls (Figure 2). While AD and MD alterations could be found in both hemispheres, FW and ADt alterations were mainly located in the contralateral hemisphere. Most of the voxels with increased FW were found in the corpus callosum (21.2% of all significant voxels) and in the splenium of the corpus callosum (26.1%), as well as in the contralateral posterior thalamic radiation (11%). For ADt, most significant voxels were found in the contralateral superior corona radiata (8.8%), the splenium of the corpus callosum (7.4%), and the contralateral posterior corona radiata (7.1%).
Regarding PSMD, significantly elevated values were revealed in patients as compared to controls (p = 0.005, Figure 3), yet no significant difference between hemispheres was observed in patients or controls (also see Supplementary Figure 2).
Hemodynamics
The lateralization of hemodynamic parameters was strongest for patients’ CBF, with a mean lateralization of −12.4% ± 14% in patients and −3.4% ± 11.3% in controls (Figure 4). The higher perfusion lateralization as an indication of an altered blood supply reached a significant difference between groups (p = 0.011). The negative lateralization corresponds to lower CBF in the ipsilateral hemisphere. On the other hand, CTH presented a statistical trend towards a higher heterogeneity in patients (p = 0.067), with a mean CTH lateralization of 15.5 ± 16.0% in patients and 6.8 ± 6.5% in controls. In this context, the positive lateralization index of CTH indicated higher CTH in the ipsilateral hemisphere.
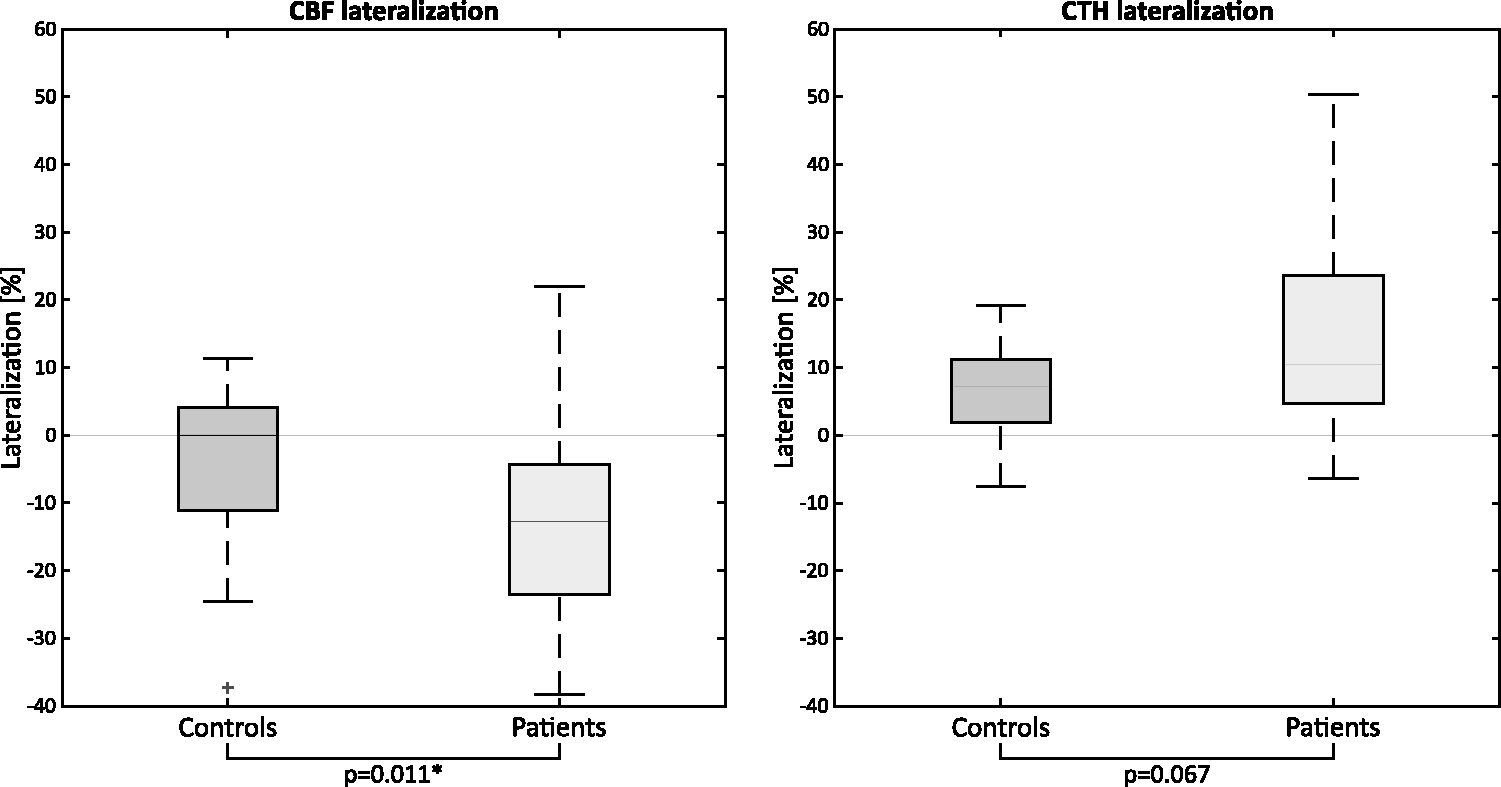
WM hemodynamics. Box plots of altered hemodynamic patterns for controls and patients. Boxes present data of controls or patients, with the center line representing the median, the bottom and top lines indicating the 25th and 75th percentiles, respectively. The whiskers display the range of data points not considered outliers, while outliers are shown using the ‘+' symbol. Outliers are defined as data points which are 1.5 times of the interquartile range from the upper or lower part of the box. To assess the hemodynamic situation, CBF, addressing perfusion, and CTH, presenting capillary flow heterogeneity, were analyzed within WM using a WM mask, segmented individually for each participant. The lateralization of these parameters depicts the overall change in WM perfusion in percent. CTH lateralization was higher in patients and elevated in the hemisphere ipsilateral to the stenosis. CBF was significantly lower in the hemisphere ipsilateral to the stenosis in patients.
Associations for MRI-derived parameters and cognition
Results of the partial correlations for MRI-derived parameters can be found in Figure 5. Overall, WM parameters displayed high intercorrelations (Figure 5). Whole-brain PSMD and quantitative WMH load were highly correlated in both the patient and control group (controls/patients r2 = 0.62/0.75, p = 0.003/<0.001). The highest correlation with WMH was reached for FW, with r2 = 0.80 and p < 0.001 in patients and r2 = 0.58 with p = 0.008 in controls. In turn, FW was highly correlated with PSMD, with r2 = 0.92 in patients and r2 = 0.93 in controls and p < 0.001 for both.
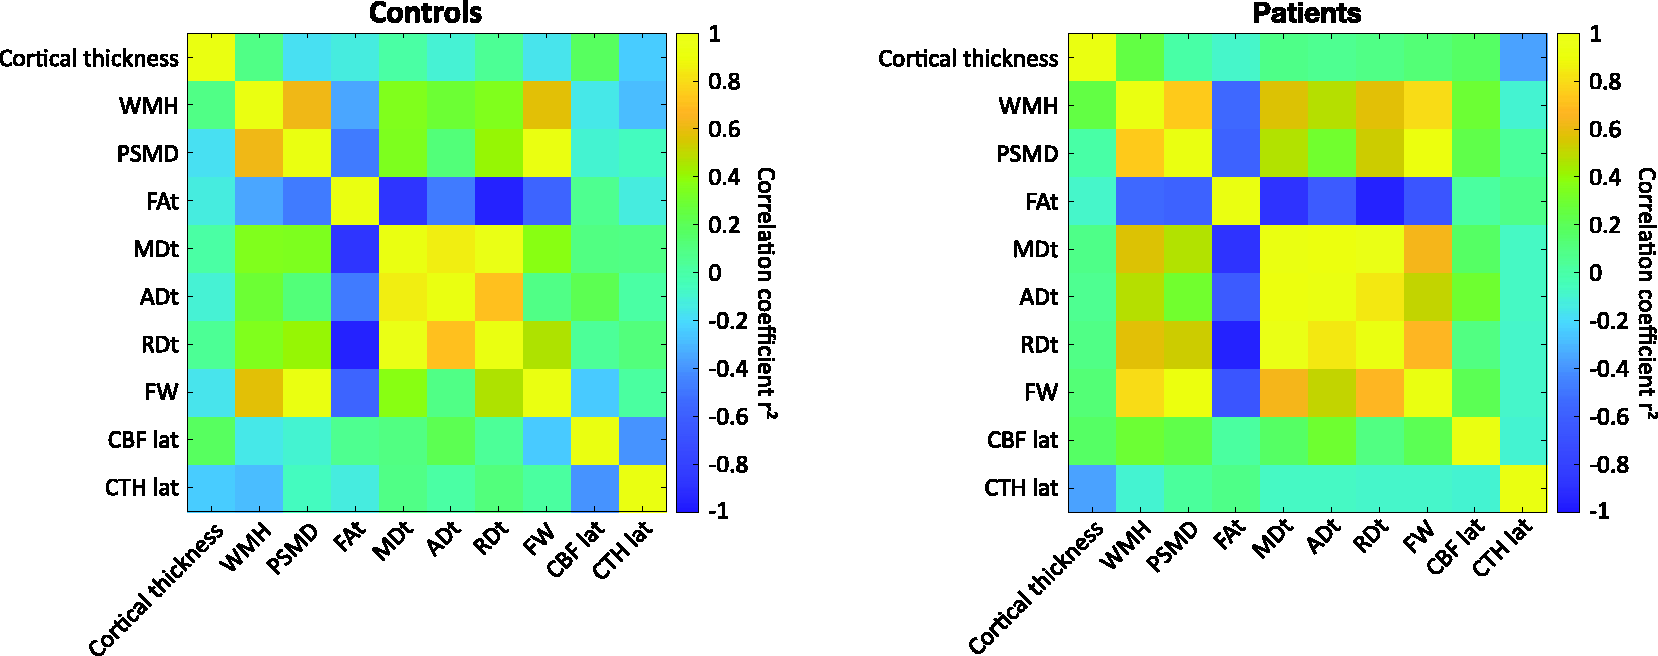
Partial correlations of whole-brain structural and hemodynamic parameters. Correlation coefficients of asymmetric flow pattern, assessed by lateralization of CBF and CTH, and structural parameters for controls (left) and patients (right). We utilized the mean values of FW-corrected DTI parameters within the whole-brain WM skeleton for our correlations, aiming to assess the potential impact of perfusion lateralization on overall brain structure. DTI indices exhibit strong intercorrelation, especially FW shows significant correlation with all FW-corrected DTI indices. In the control group, FW is significantly correlated solely to FAt, which might indicate that FAt is sensitive to variations in FW content, even in the absence of disease. CBF lateralization in WM showed its highest correlation with ADt in patients (r2 = 0.30; p = 0.13), and a medium association to CTH lateralization (controls/patients r2 = −0.41/−0.09; p = 0.08/0.27). CTH lateralization in WM presented little correlation regarding whole-brain structural parameters, the strongest being cortical thickness in patients (controls/patients: r2 = −0.24/−0.35; p = 0.22/0.19).
The highest correlation of MMSE and TMT-A in patients was found with quantitative WMH load, while the highest correlation of TMT-B was found with FAt, reaching r2 = −0.24 and p = 0.19 in patients and r2 = −0.06 and p = 0.33 in controls.
Discussion
This study in asymptomatic ICAS patients and healthy controls aimed to investigate associations between cerebral hemodynamic and structural properties, with a focus on properties associated with SVD. We found a significant reduction in cortical thickness in ICAS patients compared to controls for the PCC and the temporal pole, both located at the peripheries of perfusion territories. We also detected extensive alterations in WM for ICAS patients. Specifically, significantly higher PSMD and FW were found as compared to controls. Furthermore, we found hemodynamic alterations, such as significantly lateralized CBF and a trend towards higher heterogeneity as expressed by CTH in ICAS patients, both in the hemisphere ipsilateral to the stenosis.
Concerning GM, a significantly thinner cortex was observed in ICAS patients in two VOIs ipsilateral to the stenosis. Among these, the PCC is known for its higher metabolism compared to other cortical areas, potentially making it particularly vulnerable to hypoperfusion. 48 Considering its rather peripheral location, this structure may receive dual blood supply via the anterior and posterior cerebral arteries. Thus, effects of hypoperfusion might play a distinct role in structural decline. The temporal pole, on the other hand, is located within the vascular territory of the middle cerebral artery and was also previously reported to be affected in ICAS patients. 24 This fits with our results, where the temporal pole in the hemisphere ipsilateral to the stenosis was significantly thinner compared to controls. This makes ICAS-related perfusion alterations, leading to a reduction of oxygen supply, a likely cause for GM atrophy.
To specifically investigate the impact of SVD, we used a combination of parameters that have previously been reported as highly sensitive to the diffuse structural alterations related to SVD, including WMH, PSMD, and FW. 11 All three parameters were elevated in ICAS patients compared to controls, yet only PSMD and FW showed significant group differences. Specifically, PSMD indicates a broader dispersion of MD values and was highly correlated with FW, suggesting that increased extracellular water can relate to a higher distribution of standard MD values, which was also described earlier in patients with sporadic SVD and Cerebral Autosomal Dominant Arteriopathy with Subcortical Infarcts and Leukoencephalopathy (CADASIL). 27 For SVD, increased FW has been interpreted as blood-brain-barrier disruptions due to endothelial dysfunction or vacuolization within myelin.27,49 The affection of the whole brain also matches the diffuse impacts of SVD as PSMD and WMH did not significantly differ between hemispheres in patients (Supplementary Material). A previous study has associated external carotid artery stenosis with an increased burden of SVD, suggesting that a greater atherosclerotic load in larger vessels might mirror more extensive systemic atherosclerosis, including also changes within the smaller cerebral vessels. 50
In the regional analysis, we also observed widespread and bihemispheric alterations in MD and AD, which were also previously reported in ICAS patients. 24 This was, however, different for the FW-corrected DTI analysis. Both FW and ADt presented alterations in the contralateral hemisphere, yet effects on the ipsilateral hemisphere as seen in MD and AD were diminished by the FW correction, underlining the importance of including FW in DTI analyses. The location, however, seems counterintuitive, as we expected changes to be a consequence of decreased perfusion pressure, therefore manifesting within the ipsilateral hemispheres. A possible explanation is that the decrease in perfusion pressure might reduce the effects of high blood pressure on cerebral vessels in the ipsilateral hemisphere, which is not happening in the contralateral hemisphere not affected by high-grade ICAS, where hypertension is still reaching the vessels. A long-term effect of hypertension is vascular stiffening and eventually endothelial dysfunction.9,17 This could lead to impairments of the blood-brain-barrier and increases of extracellular water, which might further explain elevated FW. 27
As previously suggested, patients with ICAS exhibit lateralization of CBF, indicating asymmetry in WM perfusion with reduced perfusion ipsilateral to the stenosis, especially within watershed areas. 43 Concerning CTH, a statistical trend towards higher CTH and higher variability of CTH in the ipsilateral hemisphere in patients was observed, indicating a heterogenous distribution of capillary blood flow, leading to inefficient oxygen supply and, in consequence, reduced cerebral metabolism. 51 Our findings of a subtle increase of CTH and a higher variability in patients resonate with prior findings, often interpreted as an early stage or mild manifestation of capillary dysfunction. 31 With the contralateral hemisphere in ICAS patients possibly experiencing higher blood pressure as blood flow is reaching the hemisphere without passing a stenosis, the lower CTH in the hemisphere contralateral to the stenosis might be linked to the so-called capillary shunting, in which several capillary pathways are impaired (i.e., due to altered vascular structure), potentially leading to a shorter transit time via the remaining vessels. 52
A hemodynamically compensated situation might be the reason for the rather subtle alterations in cognitive performance when comparing both groups. Specifically, SVD-related structural alterations, mainly regarding WMH, FW, and PSMD, seem to have minor associations with cognitive performance (i.e., MMSE). In contrast to a previous study in patients with SVD, we did not find a strong correlation between processing speed in TMT-A/-B and PSMD. 26 However, CBF at rest might not be ideal to investigate SVD-specific effects on cognition, in contrast to cerebrovascular reactivity. 9 As the capillary dysfunction is also likely in an early stage, hemodynamic alterations and structural damage might be weaker in our study compared to previous results.26,27
The calculation of CBF can be challenging, particularly when focusing on the analysis of hemodynamics in WM. Our study opted for ASL over DSC imaging due to its promising applications in this field.46,53,54 One of the major challenges encountered in using ASL with a single post-labeling delay for CBF analyses in WM are artifacts due to prolonged arterial transit time (ATT).55,56 However, we addressed ATT bias by careful visual inspection of unsmoothed CBF maps and by considering spatial coefficients of variance below 0.45 following Mutsaerts et al. 57 Also, we carefully analyzed time-to-peak delay information across the hemispheric CBF in WM (Supplementary Material), which revealed no significant difference between the ipsilateral and contralateral hemispheres in patients, indicating that ATT effects might not be as prominent as assumed. Despite this, lower signal-to-noise ratio (SNR) is a known issue.46,58 This is consistent with reports of higher variability in ASL-based CBF measurements within WM. 43 While challenges remain, our approach aligns with other studies that have reported the feasibility and reliability of ASL-based CBF measurements, particularly in the context of WM analysis.59,60
This study has several limitations. First, the sample size is comparably small, as we focused on recruiting pre-symptomatic ICAS patients identified through incidental findings. Nonetheless, our findings largely aligned with our initial hypotheses. Second, the cognitive testing included rather global tests of various functions. While these tests are fast, standardized, and robust for assessing cognition also in a clinical setting, more specific tests addressing different and fine-grained cognitive domains are needed, as cognitive impairments in asymptomatic ICAS patients are subtle. Additionally, cognitive tests were not corrected for educational years, which represents a shortcoming of our analyses. Third, DTI indices must be interpreted with caution as the underlying mechanisms of DTI changes can be variable, ranging from physiological aging to pathological findings and depending on region and orientation of structures. We addressed this by group matching and by including a bi-tensor model, in which we separated extracellular water content from tissue to better understand microstructural changes. Fourth, hemodynamic and metabolic assessments of cerebral conditions are challenging, as various compensation mechanisms and individual predispositions must be considered. Furthermore, imaging by pCASL is known for a low SNR, especially concerning WM analysis. In addition, the position of the labeling plane can have an impact on the resulting measurements of CBF.61,62 Since flow velocity is increased at the stenosis, we anticipated a potential reduction in label efficiency. To address this, we used a phase contrast angiography survey scan to strategically position the labeling plane at least 20 mm cranially from the stenosis site. 3 This placement was based on the assumption that at this location, the mean flow velocity would not be significantly elevated. 63 We assessed CBF in whole-brain WM to benefit from averaging a larger number of voxels compared to an atlas-based approach with smaller VOIs. To mitigate PVE, we employed a threshold of 0.9 on the WM masks, which is in accordance with other studies in the field.64,65
Conclusion
Our study suggests that in patients with ICAS, changes in hemodynamic parameters and WM take effect, likely induced by the unilateral stenosis, along with SVD as both diseases are a manifestation of atherosclerosis. We identified both localized and global WM structural changes in the presence of hemodynamic alterations, underscoring the potential benefits of a multi-modal approach to deepen our understanding of the origins and implications of ICAS even in clinically asymptomatic patients.
Supplemental Material
sj-pdf-1-jcb-10.1177_0271678X241238935 - Supplemental material for Macro- and microvascular contributions to cerebral structural alterations in patients with asymptomatic carotid artery stenosis
Supplemental material, sj-pdf-1-jcb-10.1177_0271678X241238935 for Macro- and microvascular contributions to cerebral structural alterations in patients with asymptomatic carotid artery stenosis by Lena Schmitzer, Stephan Kaczmarz, Jens Göttler, Gabriel Hoffmann, Michael Kallmayer, Hans-Henning Eckstein, Dennis Martin Hedderich, Jan Kufer, Claus Zimmer, Christine Preibisch, Fahmeed Hyder and Nico Sollmann in Journal of Cerebral Blood Flow & Metabolism
Footnotes
Funding
The author(s) disclosed receipt of the following financial support for the research, authorship, and/or publication of this article: JK was supported by the Translational Medicine program of the Technical University of Munich (TUM) and the Else-Kröner-Fresenius-Stiftung (grant 2014_Promotionskolleg20). This work was further supported by the Friedrich-Ebert-Stiftung (grant to SK), Dr.-Ing. Leonhard Lorenz-Stiftung (grant to SK: 979/20, 971/19 and JG: 915/15), and the German Research Foundation (DFG) project number PR 1039/6-1 (grant to CP). FH was supported by NIH grants (R01 MH-067528, R01 NS-100106, R01 EB-023366, and R21 MH-110862).
Acknowledgements
We thank Maurizio Bergamino, PhD and Prof. Ashley Stokes of the Barrow Neurological Institute, Phoenix, Arizona, USA, for providing assistance on the bi-tensor-based FW calculations and Kim Mouridsen and Mikkel Bo Hansen of the Center of Functionally Integrative Neuroscience, Aarhus University, Aarhus, Denmark, for supplying their software and support for CTH processing.
Declaration of conflicting interests
The author(s) declared the following potential conflicts of interest with respect to the research, authorship, and/or publication of this article: Stephan Kaczmarz is an employee of Philips, Hamburg, Germany. The other author(s) declared no potential conflicts of interest with respect to the research, authorship, and/or publication of this article.
Authors’ contributions
J.G., S.K., and C.P. designed the study and acquired data, N.S., C.P., and L.S. analyzed and interpreted the data and drafted the article. J.G., G.H., D.M.H., J.K., F.H., S.K., M.K., HH.E., and C.Z. made a substantial contribution to the acquisition or analysis and interpretation of data and critically revised the article for important intellectual content. All authors approved the final version of the manuscript.
Supplementary material
Supplemental material for this article is available online.
References
Supplementary Material
Please find the following supplemental material available below.
For Open Access articles published under a Creative Commons License, all supplemental material carries the same license as the article it is associated with.
For non-Open Access articles published, all supplemental material carries a non-exclusive license, and permission requests for re-use of supplemental material or any part of supplemental material shall be sent directly to the copyright owner as specified in the copyright notice associated with the article.