
Abstract
Antenatal hypoxia-ischaemia (HI) in preterm fetal sheep can trigger delayed evolution of severe, cystic white matter injury (WMI), in a similar timecourse to WMI in preterm infants. We therefore examined how severe hypoxia-ischaemia affects recovery of electroencephalographic (EEG) activity. Chronically instrumented preterm fetal sheep (0.7 gestation) received 25 min of complete umbilical cord occlusion (UCO, n = 9) or sham occlusion (controls, n = 9), and recovered for 21 days. HI was associated with a shift to lower frequency EEG activity for the first 5 days with persisting loss of EEG power in the delta and theta bands, and initial loss of power in the alpha and beta bands in the first 14 days of recovery. In the final 3 days of recovery, there was a marked rhythmic shift towards higher frequency EEG activity after UCO. The UCO group spent less time in high-voltage sleep, and in the early evening (7:02 pm ± 47 min) abruptly stopped cycling between sleep states, with a shift to a high frequency state for 2 h 48 min ± 40 min, with tonic electromyographic activity. These findings demonstrate persisting EEG and sleep state dysmaturation after severe hypoxia-ischaemia. Loss of fetal or neonatal sleep state cycling in the early evening may be a useful biomarker for evolving cystic WMI.
Introduction
Preterm birth is associated with a high-risk of life-long neurodevelopmental impairment,1,2 accounting for ∼40% of all cases of cerebral palsy.2,3 Severe white matter injury (WMI), including cystic lesions, remains highly associated with the development of cerebral palsy.4,5 The underlying factors that place preterm infants at risk of severe neural injury and neurodevelopmental disability, including cystic WMI and cerebral palsy, remains controversial and are likely multifactorial. However, there is evidence that high rates of hypoxia-ischaemia (HI) either before or during preterm birth likely contribute.6,7
Electroencephalographic (EEG) disturbances are common during both neonatal and later life in children with cystic WMI.8 –11 Such EEG abnormalities in the first 3 days of life are associated with adverse neurodevelopmental outcomes, 12 but there is limited information on the relationship between EEG changes and longer-term evolving neural injury. More information on the trajectory of EEG changes and their underlying histopathological substrate would be of considerable value for systematic assessment of preterm infants, and recruitment for novel neuroprotective interventions.
We have recently shown that severe HI in preterm fetal sheep is associated with slowly evolving severe WMI, such that diffuse WMI with selective oligodendrocyte death and maturational arrest is observed at 3–7 days, while severe macroscopic WMI including cystic lesions, ventriculomegaly and persisting diffuse WMI is seen 14–21 days after HI. 13 The delayed progression of this WMI and its histological features mirror the delayed onset of cystic WMI in human preterm neonates,5,14 suggesting a causal link between HI at preterm gestation and cystic WMI. This paradigm is also associated with grey matter injury, including severe hippocampal injury, and impaired cortical growth. 15
In the present study, we sought to characterise the long-term relationship between evolving cystic WMI after severe HI and the maturation of EEG activity. We performed HI at preterm equivalent age in fetal sheep (0.7 gestation) and recorded EEG activity for three weeks in utero, until 0.8 gestation, when sheep are neurodevelopmentally equivalent to term humans.16 –18 Over this period, the fetal EEG transforms from an immature discontinuous mixed frequency pattern to a mature pattern, alternating between low-voltage and high-voltage sleep states. 19 We hypothesised that HI would impair EEG maturation and impair sleep state at term equivalent.
Materials and methods
Ethical approval
All procedures were approved by the Animal Ethics Committee of the University of Auckland and carried out in accordance with the New Zealand Animal Welfare Act 1999. This manuscript is compliant with the ARRIVE guidelines. 20 Methodology is briefly described here, but please refer to Supplementary Information for detailed methodology including a complete description of the manufacture of electrodes and their surgical placement.
Surgical procedures
Eighteen Romney/Suffolk fetal sheep were surgically instrumented under general anaesthesia at 98–100 days gestation (term is 147 days).21,22 Fetuses were instrumented to allow pre-ductal arterial blood sampling and to measure arterial blood pressure, electrocardiogram activity, EEG activity and nuchal electromyographic (EMG) activity as an index of fetal body movements. 23 An inflatable occluder was placed to allow umbilical cord occlusion (UCO).
Experimental protocol
Ewes were housed together in separate metabolic cages with ad libitum access to food and water in rooms with a 12-hour light/dark cycle (light 0600 to 1800 h). Experiments began at 9:00 am, 4–6 days after surgery (104–105 days gestation). Fetuses were randomly assigned to receive 25 minutes complete UCO (n = 9) or sham-UCO (control, n = 9). Occlusion was ended early if mean arterial pressure fell <8 mmHg. 21 21 days after UCO (at 125–126 days gestation), ewes and fetuses were killed by an intravenous overdose of sodium pentobarbitone (9 g Pentobarb-300, Provet, Auckland, New Zealand).
Neurophysiological analysis
Timecourse data across the 21-day recovery period was calculated for total EEG power, spectral edge frequency (as a measure of EEG frequency), the power of and proportion of activity within the delta (0–3.9 Hz), theta (4–7.9 Hz), alpha (8–12.9 Hz) and beta (13–22 Hz) bands, EMG activity and fetal heart rate (FHR). The proportion of each spectral band was calculated relative to the total power across all bands. EEG powers and nuchal EMG activity were normalised to the average of the 24-hour baseline period.
Sleep state was analysed using two approaches. Firstly we assessed sleep state indirectly using the method described by Szeto. 24 In this analysis, histograms of the distribution of spectral edge frequency across 24 hours of data per animal (1440 datapoints of 1 minute means) were constructed. The mean daily distribution was calculated across each the group for selected timepoints (baseline and 3, 7, 13, 15, 17, 19 & 21 days after UCO). Secondly, sleep state was directly examined over 24 hours on the final day of recordings, beginning at 6 am on day 20 after UCO. Continuous 1-minute means of EEG power and spectral edge frequency were assessed by a blinded assessor (CAL) and alternating epochs of low-voltage, high-frequency sleep and high-voltage, low-frequency sleep were identified.25,26 Blinding across the study was achieved by independent coding of data files. We hypothesised that HI would be associated with impaired sleep state cycling, and therefore we did not set threshold values and only required reciprocal changes in EEG power and spectral edge frequency to identify sleep states. A minimum duration of three minutes, excluding periods of transitional sleep, was required to be classed as a sleep state. 27 Epochs that could not be classified as low-voltage or high-voltage sleep were classed as indeterminate sleep. Transitional sleep was also classified as indeterminate sleep for the purpose of this analysis. Based on this analysis, corresponding EEG and EMG parameters were extracted for each sleep state, and outputted as the mean from eight 3-hourly epochs across the 24 hours examined.
Histological preparation and analysis
At post-mortem, fetal brains were fixed with 10% phosphate-buffered formalin and paraffin embedded. Two sections per animal were stained with thionine and acid fuchsin to examine macroscopic structural integrity through measurement of total white matter, thalamic and lateral ventricle area. The total white matter area was measured across all continuous white matter structures of the parietal and temporal lobes of both hemispheres, including the intragyral and periventricular regions and the corpus callosum.
Statistical analysis
Statistical analysis was performed using SPSS v25 (SPSS, Chicago, IL, USA). If the data were normal according to the Kolmogorov-Smirnov Test, then physiological and neurophysiological assessment over the 21-day recovery period was assessed using two-way ANOVA with group as the independent factor and time treated as a repeated measure. Assessment of the indirect measure of sleep state maturation (i.e. the Szeto analysis, shown in Figure 1) was performed separately on each day via two-way ANVOA, with group as the independent factor and spectral edge frequency treated as a repeated measure. Assessment of the direct measure of sleep state on the final day of recordings (Figures 2 to 5) was performed using two-way ANOVA with group treated as the independent factor and both state and time across the day (i.e. the eight 3-hourly means) treated as repeated measures. If a significant effect of the independent factors was found, the effect of group was further investigated using the Fisher’s protected least significant difference (LSD) post-hoc test. Assessment of blood biochemistry and histological outcomes was performed using one-way ANOVA. Exploratory analysis was performed to assess the correlation between histological outcomes and selected key neurophysiological outcomes, including average total EEG power, spectral edge frequency and nuchal EMG activity over the final 24 h of recovery, percent time in high-voltage and low-voltage sleep states, and total EEG power and spectral edge frequency during high-voltage and low-voltage sleep states. Statistical significance was accepted when p < 0.05. Data are presented as mean ± SD.
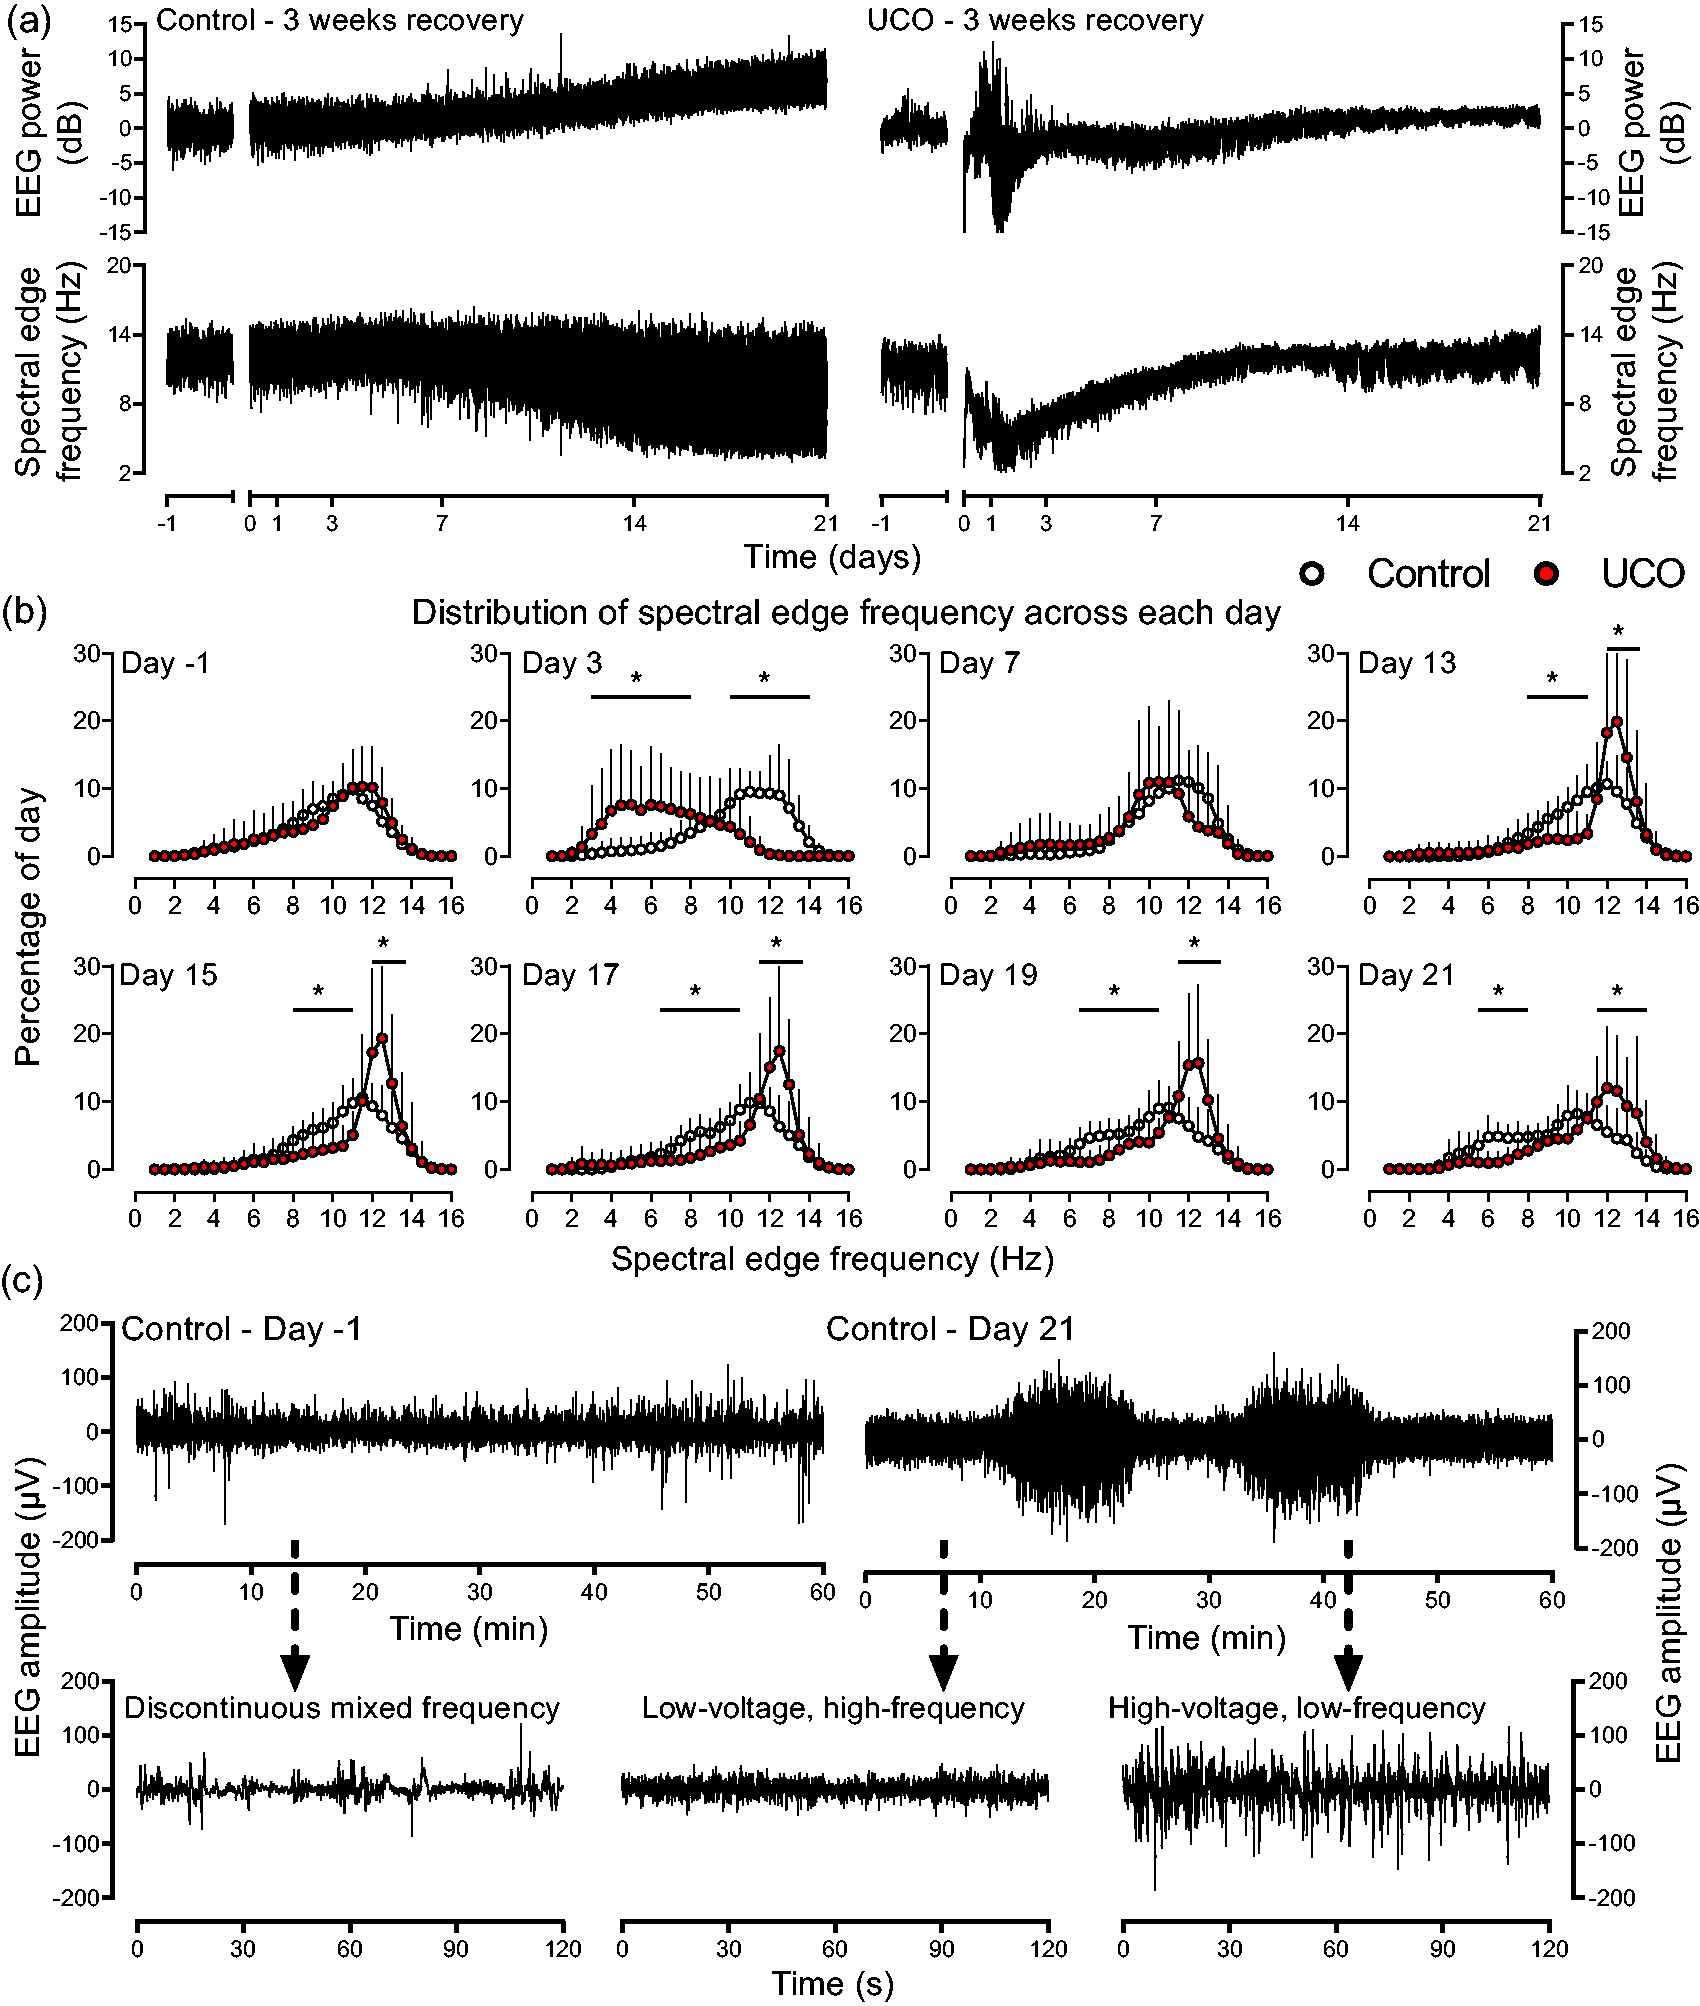
Maturation of EEG activity from preterm to term equivalent age. (a) Examples of EEG power and spectral edge frequency from individual fetuses across the baseline and 21-day recovery period in the control and UCO group. Data are 1 min averages, the period of UCO is not shown but ended at time-point zero. Note the progressive increase in EEG power and initial rise then fall in spectral edge frequency over the 21-day period in the control fetus. After UCO, the increase in EEG power within the first 2–3 days represents seizure activity on continuous recordings. Note the attenuated increase in EEG power, and the impaired fall in spectral edge frequency towards the end of the recovery period in the UCO fetus. (b) Distribution of spectral edge frequency during the baseline period and selected days during the recovery period (n = 9 for both groups). A frequency distribution was created from the 1 min values of spectral edge frequency across each 24-hour period. Data are displaced as percentage of the day spent at each frequency. Note the marked shift to lower frequencies in the UCO group at day 3, the unimodal distribution of both groups at baseline and day 7, and the progressive increase in skewness of the control distribution between 13–21 days with the appearance of a second lower frequency peak around at day 19–21, reflecting the appearance of the high-voltage sleep state. These changes were impaired in the UCO group. *p < 0.05 control vs. UCO groups and (c) Examples of continuous EEG patterns from the control group from the baseline period showing the immature discontinuous mixed frequency EEG patterns (left panels), and the final day of recovery (right panel) showing cycling between low-voltage and high-voltage sleep states. Data are raw EEG patterns down sampled to 256 Hz.
Results
Baseline and umbilical cord occlusion
All fetuses in both the control and UCO groups were healthy before the start of experiments based on our laboratory standards, including normal physiological and arterial blood gas parameters. There were no significant differences in any physiological parameters between the groups before experiments. Nuchal EMG activity during the baseline period in both groups consisted of brief bouts of activity interspersed with periods of near isoelectric EMG activity, consistent with periods of atonia. UCO was associated with sustained bradycardia and profound arterial hypotension, hypoxemia, hypoglycaemia and progressive respiratory and metabolic acidaemia (Supplementary Table 1). FHR and arterial pressure recovered rapidly after the end of occlusion (data not shown), and metabolic acidaemia progressively resolved over the first day after UCO (Supplementary Table 1).
Neurophysiological maturation in the control group
EEG activity in the control group matured over the 21-day recovery period. Initially both groups showed an immature pattern consisting of discontinuous mixed frequency EEG activity (Figure 1(c)), with a unimodal distribution of spectral edge frequency across the 24 hours baseline period (Figure 1(b)). In the control group, the unimodal distribution of spectral edge frequency became increasingly skewed from day 13 onwards, resulting in a progressive shift towards a bimodal distribution evident at day 19–21 (Figure 1(b)). This shift reflected the appearance of sleep state cycling, with alternating periods of high-voltage, low-frequency and low-voltage, high-frequency states (Figure 1(c)). The high-voltage state began to appear at approximately 13 days after sham-UCO (117–118 days of gestation) in association with the increased skewness of the spectral edge frequency distribution.
A progressive increase in total EEG power (effect of time, p < 0.001, Figure 2) with corresonding increases in delta, theta, alpha and beta power was observed over the 21-day recovery period in the control group (effect of time, all p < 0.001, Figure 3). Maturation of spectral edge frequency was also observed (effect of time, p < 0.01), with an initial progressive increase in spectral edge frequency until approximately day 8–9 of recovery (approximately 112–114 days of gestation), followed by a progressive fall until 21 days (Figure 2). The changes in the proportion of EEG spectral bands paralleled the changes in spectral edge frequency. The proportion of delta activity progressively decreased to a nadir at 8–9 days of recovery (112–114 days of gestation), followed by an increase towards the end of the 21-day recovery period (effect of time p < 0.005, Figure 4). In contrast, the proportion of both alpha and beta activity showed an initial progressive increase reaching peaks at 8–9 days of recovery (112–114 days of gestation), followed by a progressive fall towards the end of the experiment (effect of time, both p < 0.001, Figure 4). The average proportion of theta activity remained constant throughout the 21-day recovery period.
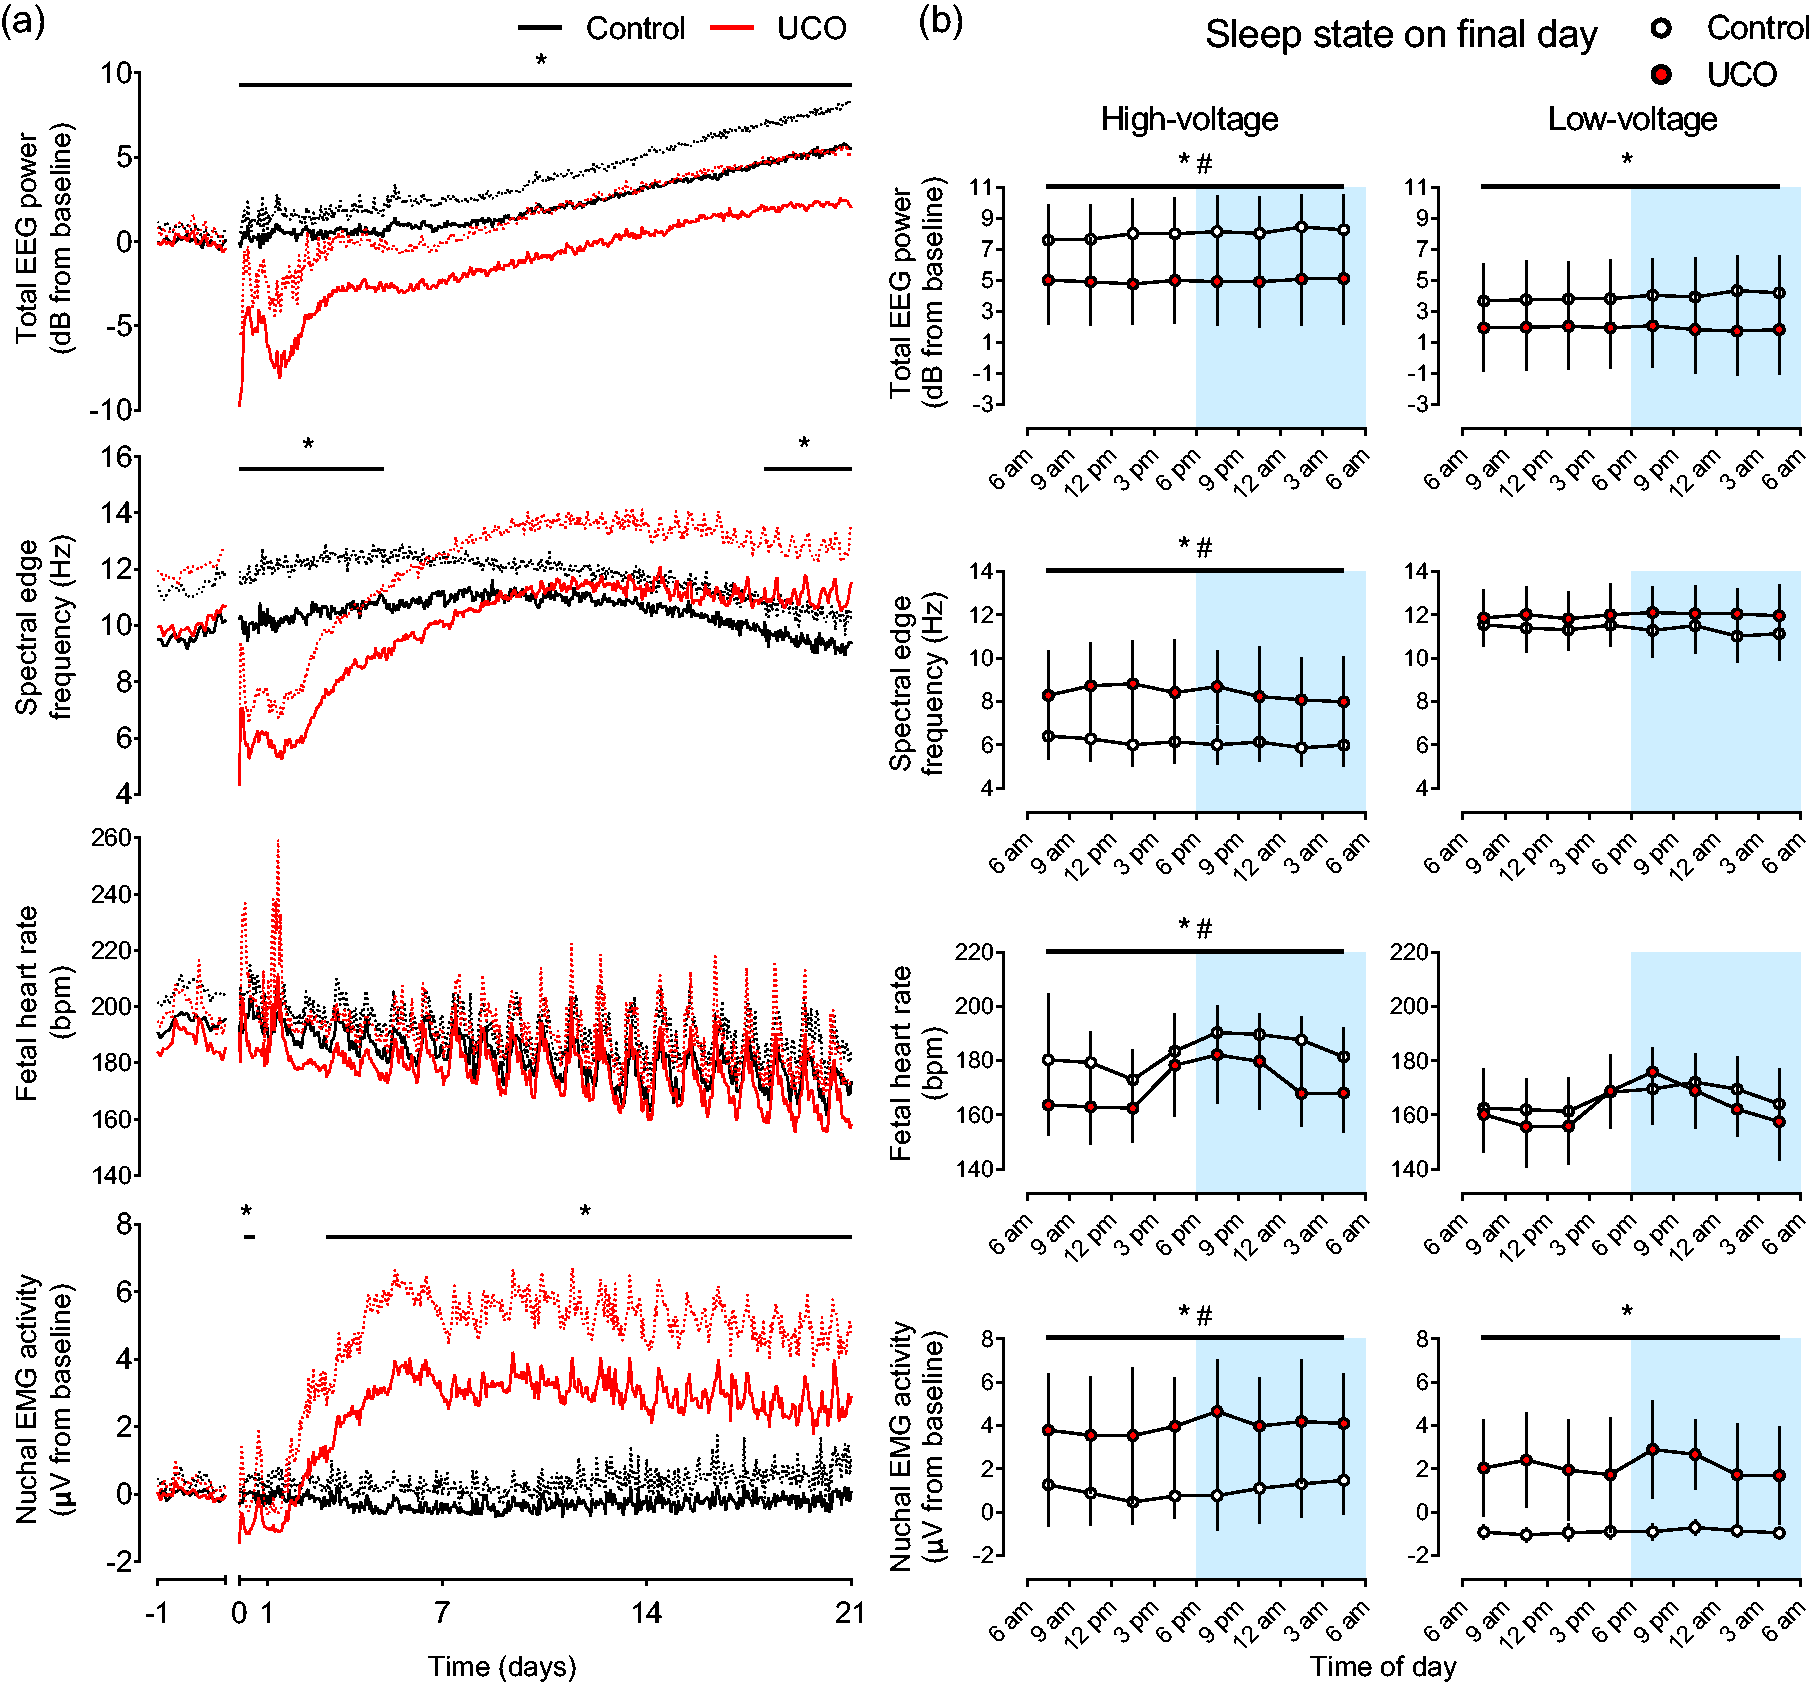
Recovery of EEG activity, FHR and nuchal EMG activity. (a) Recovery of EEG power, spectral edge frequency, FHR and nuchal EMG activity after UCO in the control (n = 9 or 8 for FHR, black lines) and UCO groups (n = 9 or 7 for FHR, red lines). The period of UCO is not shown but ended at time-point zero. Nuchal EMG activity is an index of fetal body movements. EEG power and nuchal EMG activity are displayed relative to baseline values. Data are 1 h means ± SD. Mean values are displayed as solid lines, SD values are shown as dotted lines. *p < 0.05, control vs. UCO and (b) EEG power, spectral edge frequency, FHR and nuchal EMG activity during high-voltage and low-voltage sleep during the final day of recovery. Data are mean values from each 3-hour epoch ±SD. The dark period of the laboratory is shown in blue shading from 6pm–6am. *p < 0.05, control vs. UCO; #p < 0.05, high-voltage vs. low-voltage across both groups.
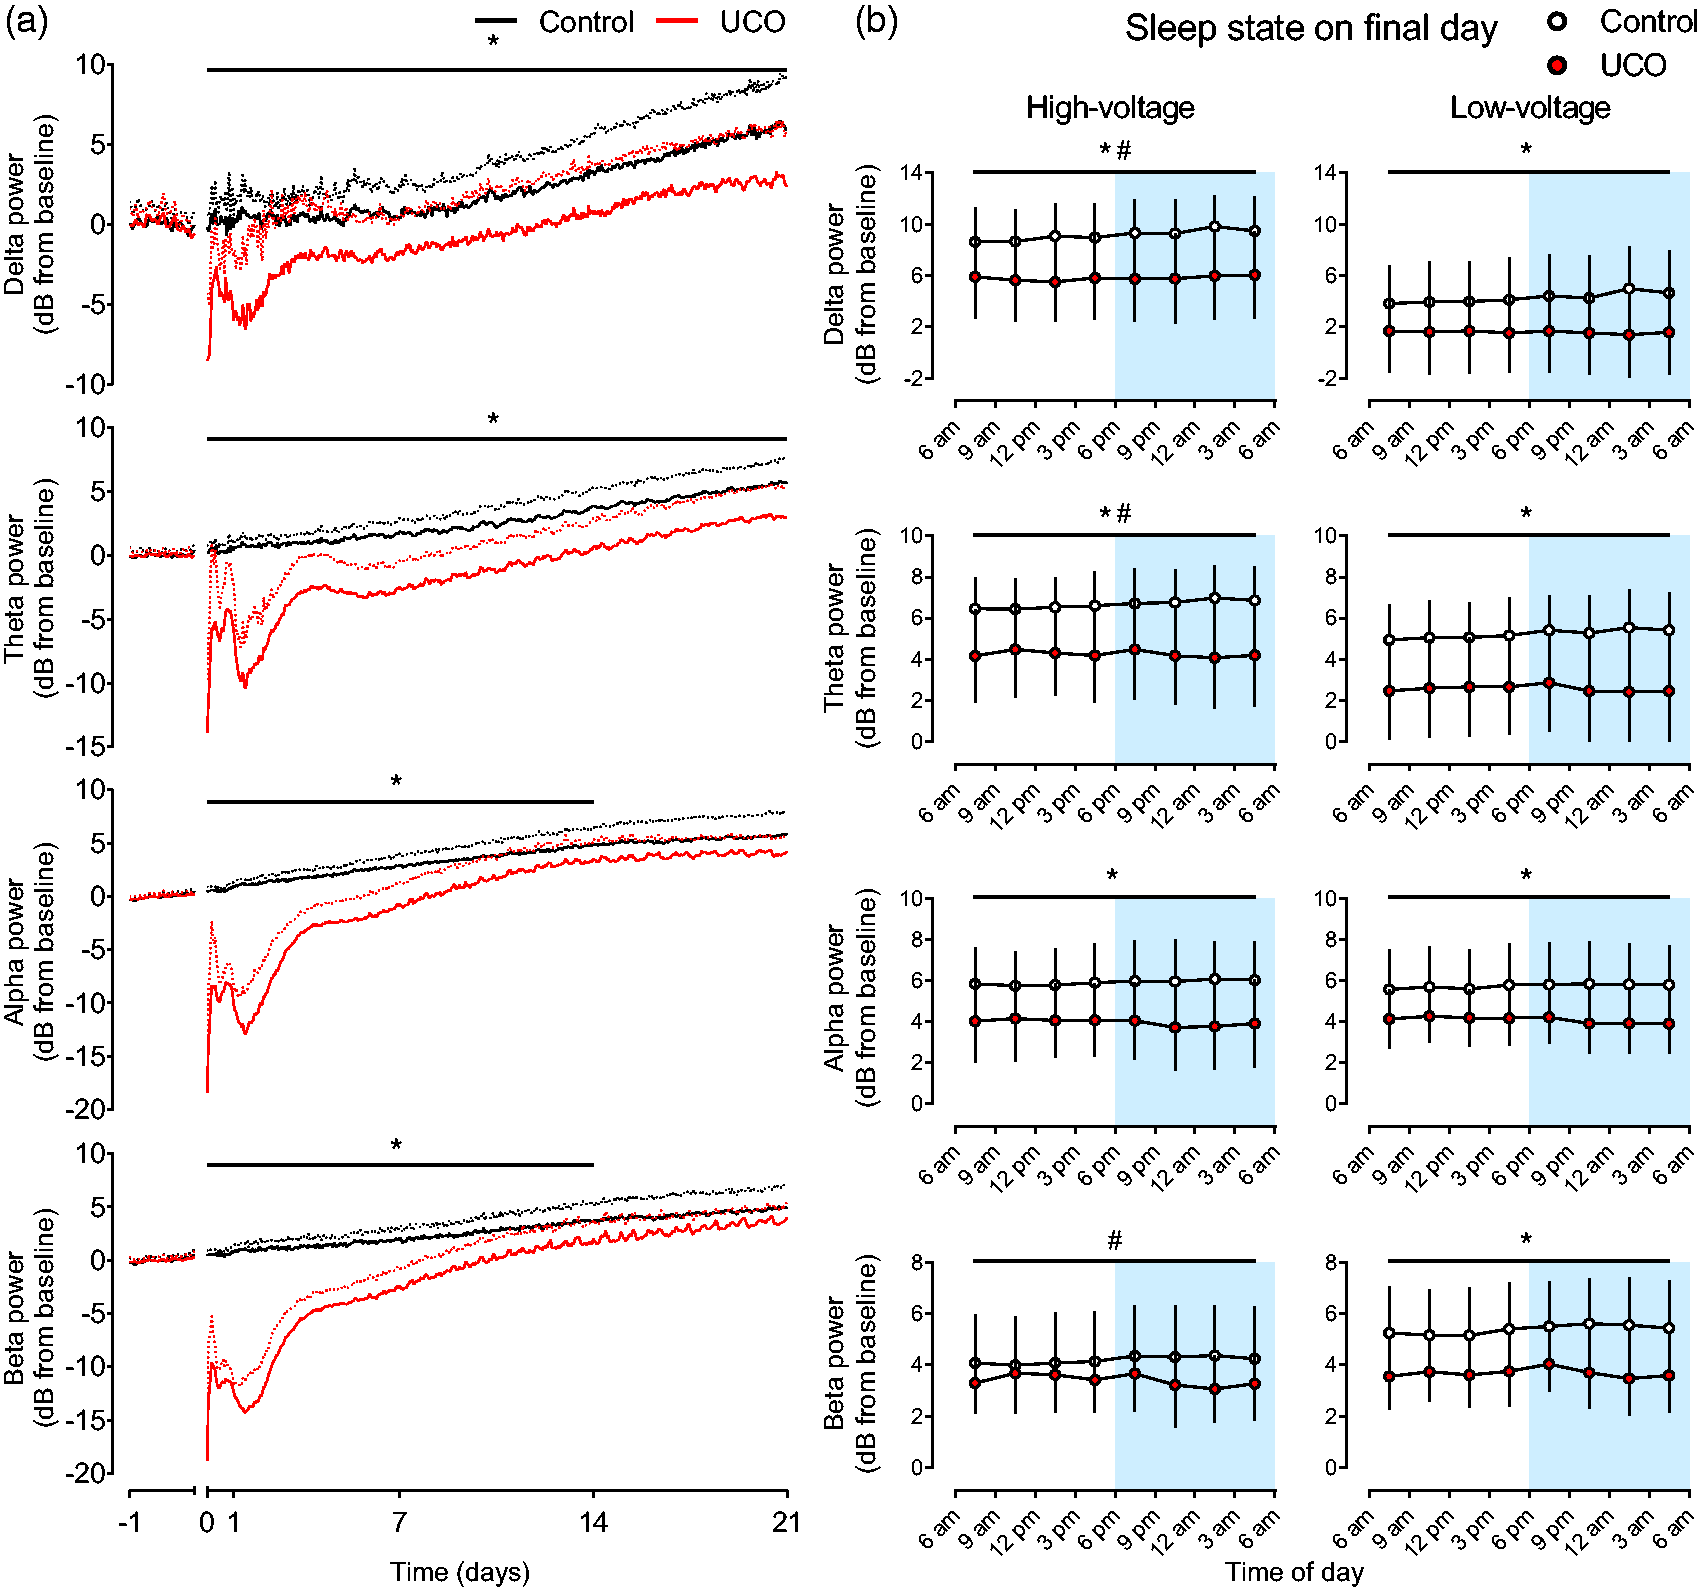
Recovery of spectral powers. (a) Recovery of EEG spectral band powers after UCO in the control (n = 9, black lines) and UCO groups (n = 9, red lines). The period of UCO is not shown but ended at time-point zero. Data are 1 h means ± SD relative to baseline. Mean values are displayed as solid lines, SD values are shown as dotted lines. *p < 0.05, control vs. UCO and (b) Spectral band powers during high-voltage and low-voltage sleep during the final day of recovery. Data are mean values from each 3-hour epoch ±SD. The dark period of the laboratory is shown in blue shading from 6pm–6am. *p < 0.05, control vs. UCO; #p < 0.05, high-voltage vs. low-voltage across both groups.
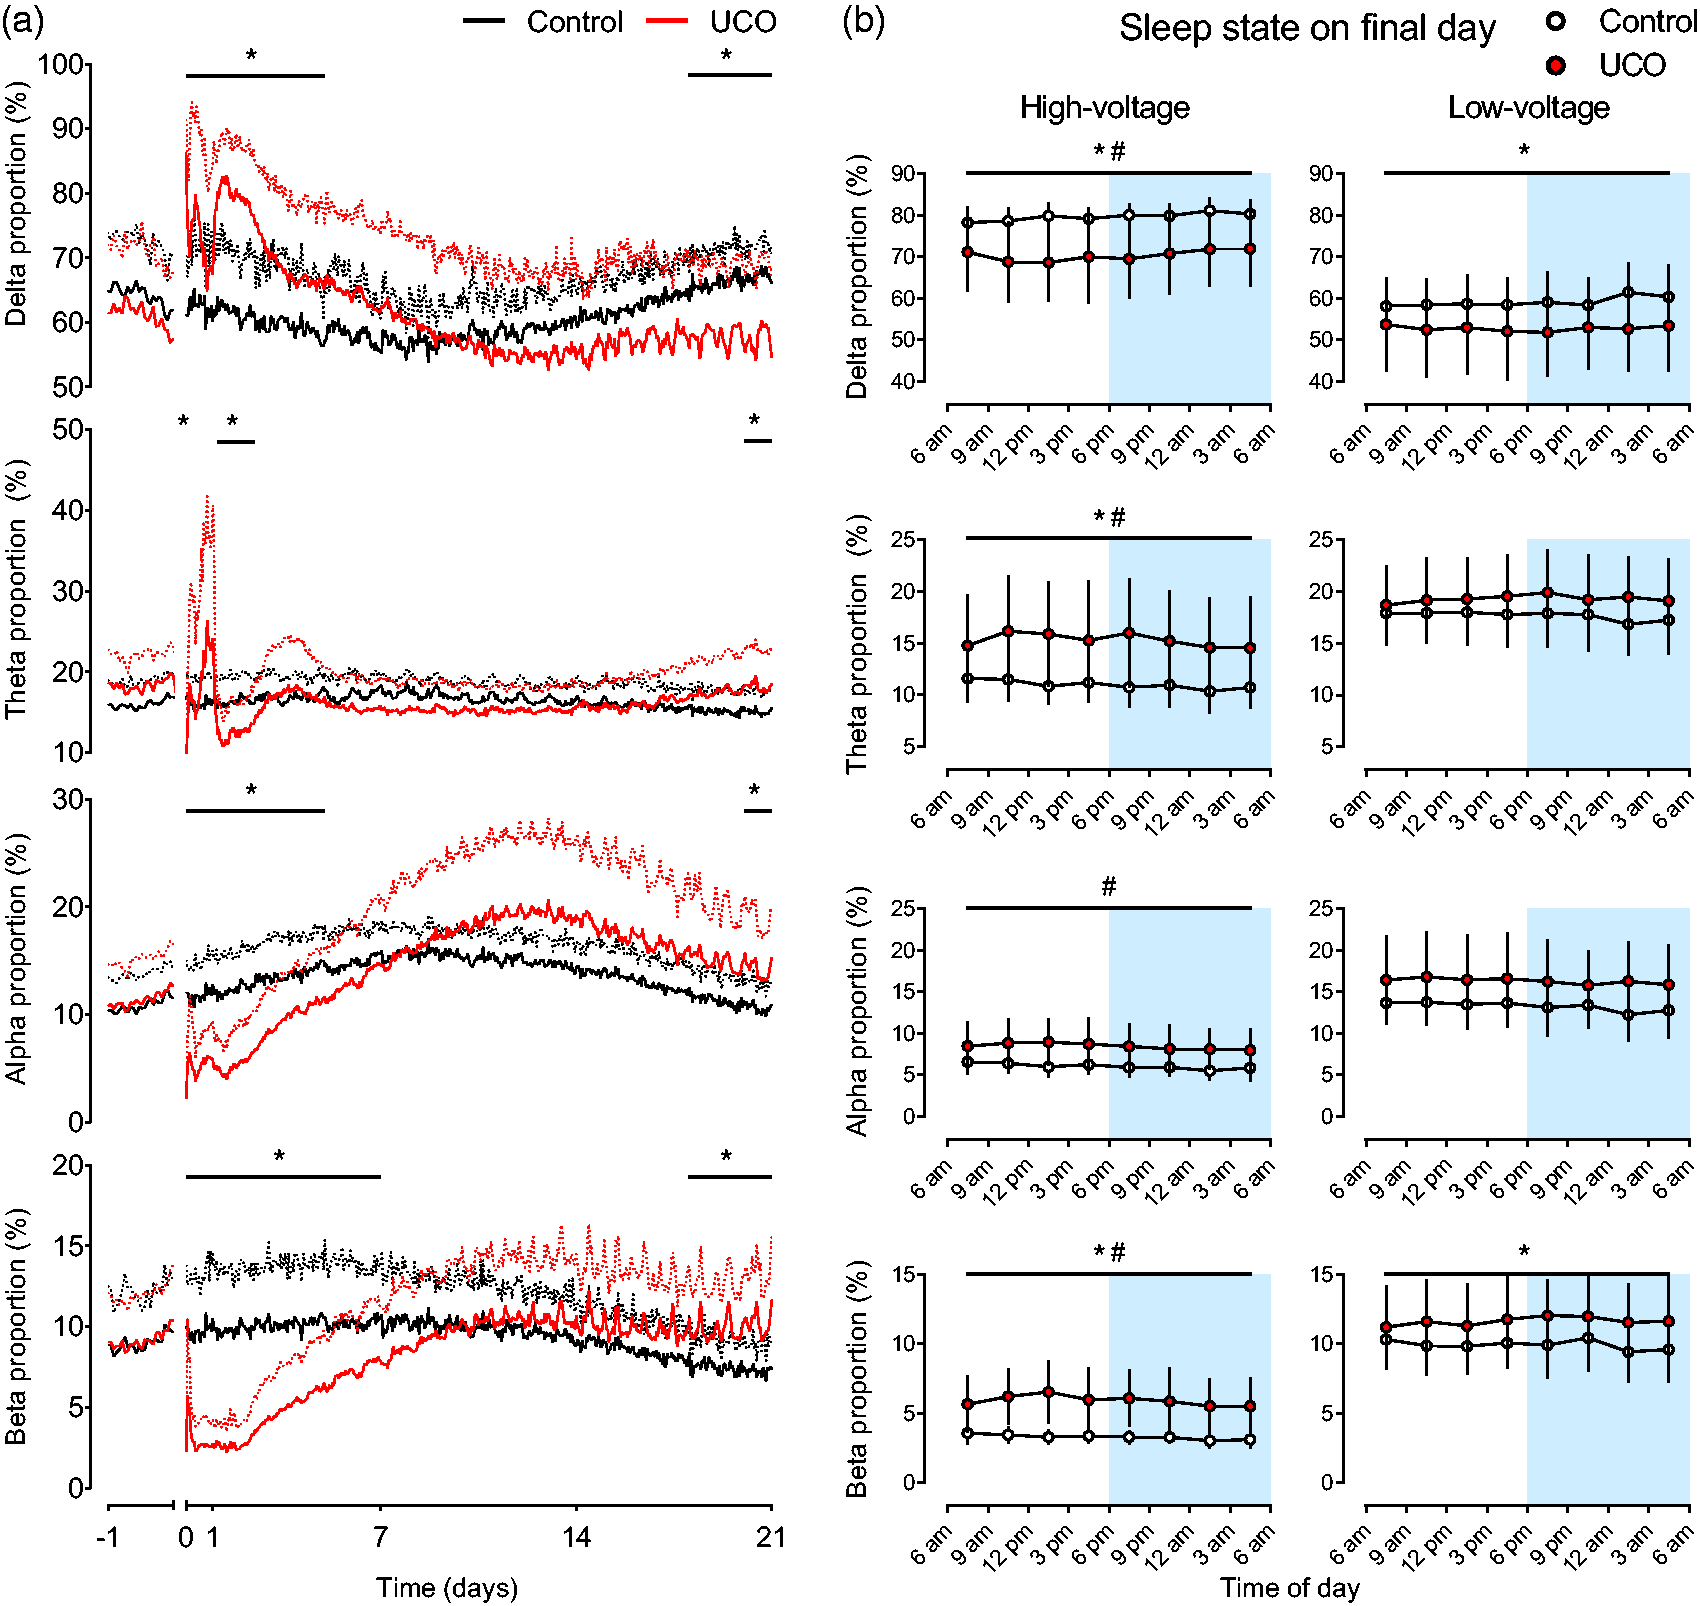
Recovery of spectral proportions. (a) Recovery of the proportion of EEG spectral band activities after UCO in the control (n = 9, black lines) and UCO groups (n = 9, red lines). The period of UCO is not shown but ended at time-point zero. Data are 1 h means ± SD relative to baseline. Mean values are displayed as solid lines, SD values are displayed as dotted lines. *p < 0.05, control vs. UCO and (b) Relative proportions of spectral band activities during high-voltage and low-voltage sleep during the final day of recovery. Data are mean values from each 3-hour epoch ±SD. The dark period of the laboratory is shown in blue shading from 6 pm–6 am. *p < 0.05, control vs. UCO; #p < 0.05, high-voltage vs. low-voltage across both groups.
Neurophysiological recovery in the UCO group
EEG activity was suppressed immediately after UCO, with reduced total power and all spectral powers in the UCO group. Partial recovery of EEG power including a progressive increase in total EEG power (Figure 2) and the power of all spectral bands (Figure 3) was observed in the UCO group over the 21-day recovery period, in addition to apparent maturational changes that were broadly similar in trajectory to that observed in the control group but clearly disrupted. UCO was associated with a persisting reduction in total EEG power (p < 0.01, Figure 2), and loss of power in the delta (p < 0.05, Figure 3) and theta bands (p < 0.05, Figure 3). In contrast, the effect of UCO on the power of the higher frequency alpha and beta bands was time-dependent (time*group, both p < 0.001), with loss of both alpha (p < 0.05) and beta power (p < 0.005) for the first 14 days of recovery. Alpha and beta power subsequently returned to control levels, with no difference between groups during the final 7 days of recovery (p = 0.082 and p = 0.069, respectively, Figure 3).
UCO was also associated with impaired maturation of EEG frequency, with a shift to lower EEG frequencies during early recovery followed by a shift to higher EEG frequencies towards the end of recovery. Consistent with this, the trajectory of spectral edge frequency was altered by UCO (time*group, p < 0.005, Figure 2), with an initial reduction in spectral edge frequency for the first 5 days of recovery in the UCO group (p < 0.05), but recovery to control levels at 5 days. The daily mean of spectral edge frequency in the UCO group peaked at approximately day 12–13 after UCO (approximately 116–118 days of gestation). This was followed by a progressive fall in spectral edge frequency, which was blunted relative to the control group and thus spectral edge frequency was higher in the UCO group during the final 3 days of recovery compared to the control group (p < 0.05, Figure 2).
The trajectories of the proportion of delta, alpha and beta activities were also altered by UCO (time*group, p < 0.005, p < 0.001, p < 0.001, respectively). During the first 5 days of recovery, UCO was associated with an increase in the proportion of low frequency delta activity (p < 0.005, Figure 4). Corresponding decreases in the proportions of higher frequency alpha activity during the first 5 days (p < 0.005) and beta activity during the first 7 days of recovery were observed (p < 0.005). The changes in lower frequency theta activity were more complex, with a lower proportion of theta activity observed for the first 3 hours after UCO (p < 0.05) and a more prolonged reduction from 28–60 hours after UCO (p < 0.05). The proportion of all EEG spectral bands after UCO returned to control levels between approximately 7–18 days of recovery (Figure 4).
Over the final 3 days of recovery, UCO was associated with a lower proportion of low frequency delta activity compared to the control group (p < 0.05, Figure 4). UCO was also associated with an increase in the proportion of high frequency beta activity over the final 3 days of recovery (p < 0.05), and with increases in the proportion of both theta (p < 0.05, Figure 4) and alpha activity over the final day of recovery compared to the control group (p < 0.05, Figure 4).
Sleep state impairment in the UCO group
We assessed the maturation of EEG activity into distinct two sleep states after UCO, firstly indirectly by assessing the distribution of spectral edge frequency across 24-hour periods (Figure 1(b)). On day 3 of recovery, both groups showed unimodal distributions, which were markedly shifted towards the lower frequency range by UCO, such that the UCO group had a higher percentage of activity between 3.0–8.0 Hz (p < 0.001) and a lower percentage between 10.0–14.0 Hz (p < 0.001 compared to controls). This recovered to be similar to the unimodal distribution seen in controls by day 7 after UCO. The maturation towards a bimodal distribution was delayed and impaired between days 13–21 after UCO, with a persisting lower percentage of spectral edge frequency at lower frequencies (day 13–15, 8.0–11 Hz, p < 0.05; day 17, 7.5–11.0 Hz, p < 0.05; day 19, 6.5–10.5 Hz, p < 0.05; day 21, 5.5–8.0 Hz, p < 0.005) compared to the control group (Figure 1(b)). A corresponding greater percentage of spectral edge frequency was seen at higher frequencies after UCO compared to controls (day 13–17, 12.0–13.5 Hz, p < 0.05; day 19, 11.5–13.5 Hz, p < 0.05; day 21, 11.5–14.0 Hz, p < 0.05).
Secondly, we assessed sleep state directly over the final day of recovery (from 6 am day 20 until 6 am day 21 after UCO), during which all fetuses in both the control and UCO group showed EEG patterns that cycled between episodes of high-voltage and low-voltage sleep (Figures 1 and 5). Both groups showed significant differences between the high-voltage and low-voltage states for the majority of measures assessed (Figures 2 to 4). The number of, average duration of and total percentage time spent (all per 24 hours) in low-voltage sleep states were higher than high-voltage sleep states (all p < 0.001, except number of states p < 0.005, Figure 5). Total, delta and theta EEG power, the proportion of delta activity, FHR and nuchal EMG activity were higher in high-voltage than in low-voltage sleep (all p < 0.001, Figures 2 to 4). In contrast, spectral edge frequency, beta power and the proportion of theta, alpha and beta activity were higher in low-voltage sleep than in high-voltage sleep (all p < 0.001). Alpha power was not different between the two states (Figures 2 to 4).
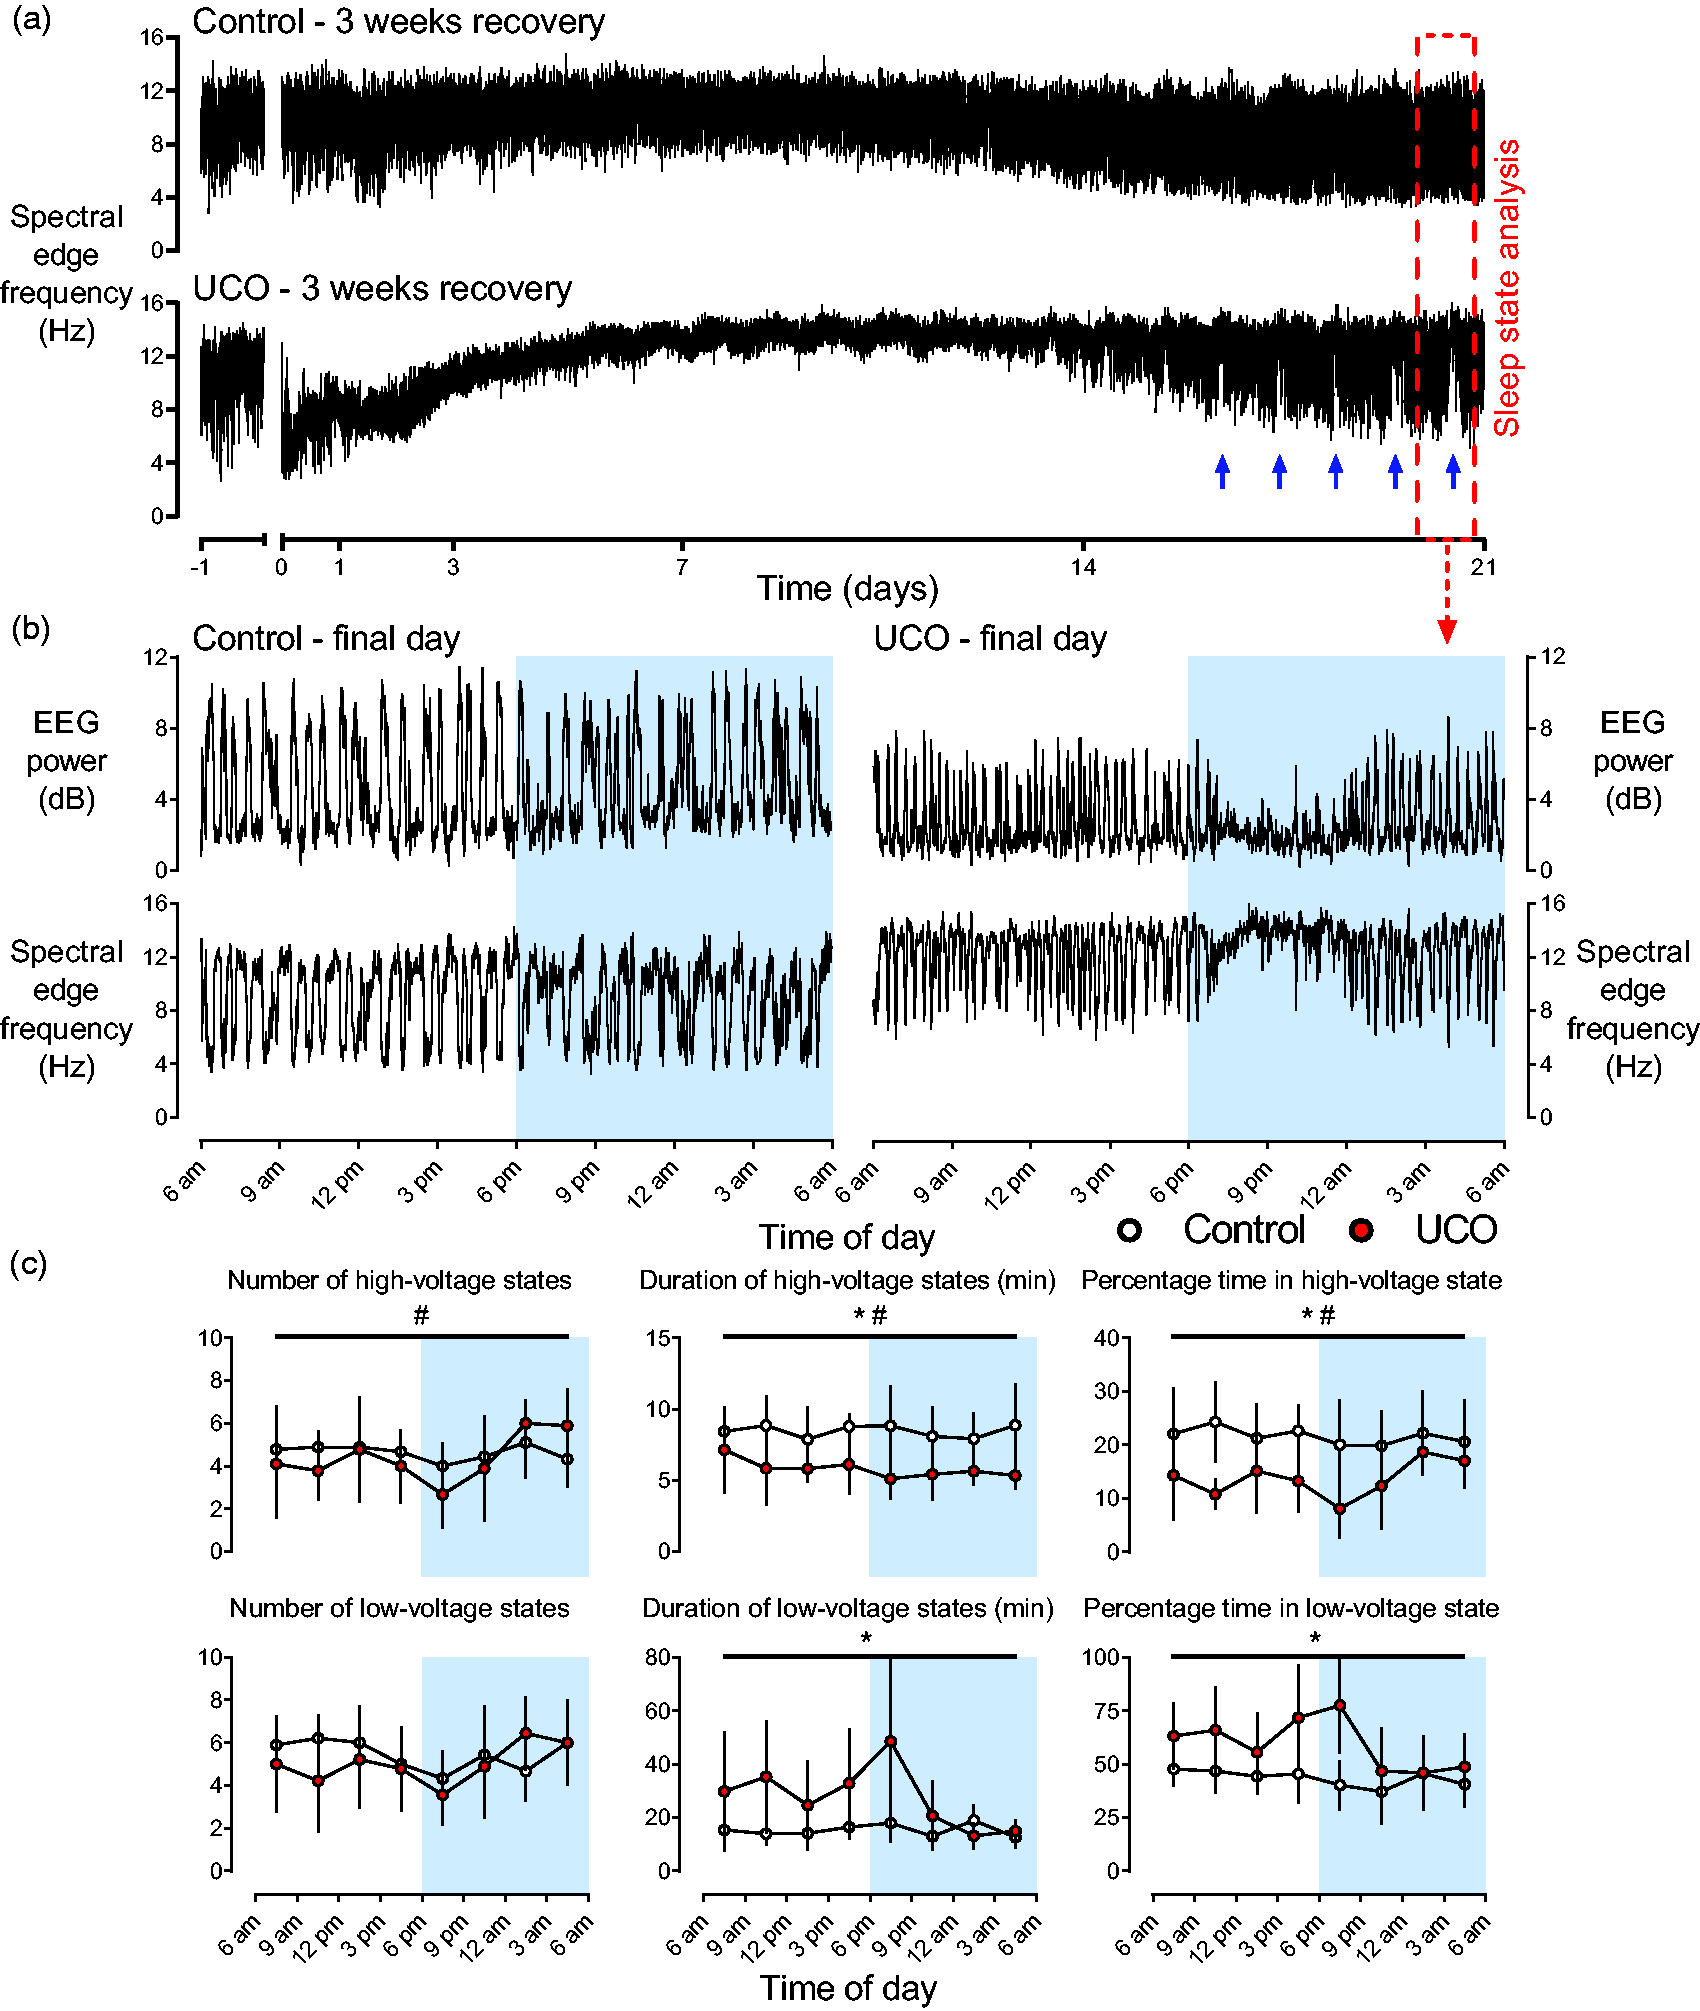
Sleep state at term maturity. (a) Representative examples from individual fetuses of spectral edge frequency over the baseline and three-week recovery period from the control (top panel) and UCO groups (bottom panel). Sleep state analysis was performed over 24 hours on the final day of recovery, identified by the red dashed box which is enlarged in b. Note the repetitive disruption of sleep state cycling over approximately the final five days of recovery as indicated by the blue arrows. Data are 1 min means. (b) Enlargement of the period indicated by red dashed box in a illustrating reciprocal changes in EEG power and SEF during the final day of recovery after UCO from the control (right panels) and UCO groups (left panels). These reciprocal changes are indicative of sleep state cycling between high-voltage (low-frequency) and low-voltage (high-frequency) sleep states. Note the comparatively stable appearance of sleep state cycling throughout the day in the control fetus compared to the prolonged period of disruption to sleep state cycling in the UCO fetus starting approximately 7pm. The shaded blue region indicates the dark cycle in our laboratory from 6pm–6am. Data are 1 min means and (c) The percentage of time spent in each state, the number of each sleep state (per 24 hours) and the duration of each sleep state over the course of the final day of recovery after UCO in the control (n = 9, white circles) and UCO groups (n = 9, red circles). Data are separated into high-voltage (top panels) and low-voltage sleep states (bottom panels). The shaded blue region indicates the dark cycle in our laboratory from 6pm–6am. Data are 3 h means ± SD.
Sleep state architecture over the final day of recovery was markedly impaired in the UCO group, which predominantly affected high-voltage sleep. UCO did not alter the numbers of each state per 24 hours (high-voltage: control 37.1 ± 6.8 vs. UCO 34.8 ± 6.5; low-voltage: control 43.6 ± 7.2 vs. UCO 40.1 ± 10.6) but was associated with shorter high-voltage (control 8.3 ± 1.2 vs. UCO 5.7 ± 1.0 min, p < 0.001) and longer low-voltage states (control 14.8 ± 3.5 vs. UCO 22.2 ± 5.8 min, p < 0.001) leading to reduced percentage time in high-voltage (control 21.6 ± 5.2% vs. UCO 13.6 ± 2.7%, p < 0.001) and increased percentage time spent in low-voltage states compared to controls (control 43.5 ± 5.9% vs. UCO 59.5 ± 12.3%, p < 0005, Figure 5). The percentage time classed as indeterminate sleep was no different between the control (34.9 ± 8.0%) and UCO groups (27.0 ± 10.8%, data not shown).
UCO was associated with lower total, delta, theta and alpha EEG powers (all p < 0.05, Figures 2 and 3) and a reduced proportion of delta activity (p < 0.05, Figure 4) for both sleep states compared to controls. UCO was further associated with a higher proportion of beta activity (p < 0.05, Figure 4), increased spectral edge frequency (p < 0.05) and increased nuchal EMG activity (p < 0.001) across both sleep states compared to controls (Figure 2). An interaction between UCO and sleep state was observed for spectral edge frequency (p < 0.05), beta power (p < 0.05), the proportion of theta activity (p < 0.05) and FHR (p < 0.05). Post-hoc testing suggested that spectral edge frequency (p < 0.01) and the proportion of theta activity (p < 0.05) were increased in high-voltage sleep whereas beta power (p < 0.05) was specifically increased in low-voltage sleep in the UCO group compared to controls (Figures 2 and 4). FHR was additionally lower in high-voltage sleep (p < 0.01) in the UCO group compared to controls, but was not different between groups in low-voltage sleep.
Recovery of FHR and nuchal EMG activity
There was a maturational fall in FHR over the 21-day recovery period in both groups (p < 0.001). Hourly average FHR was not different between groups throughout the recovery period (Figure 2). Overall, average nuchal EMG activity appeared to remain stable throughout the 21-day recovery period in the control group. There was clear compartmentalisation of nuchal EMG activity over the final day of recovery in the control group, as shown by higher nuchal EMG levels in high-voltage sleep than in low-voltage sleep (Figure 2). The raw EMG data showed periods of atonia, similar to that observed in the baseline period, predominantly during low-voltage sleep. A significant effect of time (p < 0.001), group (p < 0.001) and an interaction between time and group was observed for nuchal EMG activity (p < 0.001, Figure 2). Collectively, this suggests the changes over the 21-day recovery period were predominantly observed in the UCO group. We observed that nuchal EMG activity was reduced in the UCO group from 7–12 hours after UCO (p < 0.001), and subsequently increased from day 3–21 after UCO compared to controls (all p < 0.001). Assessment of the raw EMG of the UCO group showed that the increase was largely mediated by increased background EMG activity, with superimposed ongoing periodic increases in EMG activity.
Circadian disruption in the UCO group
The UCO group showed a repeating, abnormal triphasic circadian pattern, which became increasingly apparent over the final week of recovery (Figure 6, as well as Figures 2 to 5). This was observed across all EEG parameters and EMG activity, although the magnitude of the changes varied between parameters. We performed targeted feature analysis of the timing of circadian features in the UCO group over the final week of recovery. In spectral edge frequency, this triphasic pattern consisted of an early morning trough maximal at 3:22 am ± 50 min, followed by a bimodal increase across the rest of the day with a smaller amplitude peak in the late morning maximal at 9:01 am ± 52 min and a higher amplitude evening peak maximal at 7:58 pm ± 47 min (Figure 6 top left panel). Parallel patterns of an early morning trough followed by a bimodal peak in activity were observed in theta, alpha and beta powers and proportions (Figure 6 middle panels) and in nuchal EMG activity (Figure 6 top right panel). A corresponding inverse pattern was observed in total EEG power, delta power and the proportion of delta power. For total EEG power, this consisted of an early morning peak maximal at 3:22 am ± 50 min, followed by a bimodal decrease across the rest of the day with a smaller amplitude nadir in the late morning at 9:01 am ± 52 min and a higher amplitude evening nadir at 7:58 pm ± 47 min (Figure 6, bottom panels). In contrast, the circadian oscillations in the control group across all parameters were smaller and simpler, typically consisting of biphasic patterns (peak and trough) without the triphasic pattern that was observed in the UCO group (Figures 2 and 4).
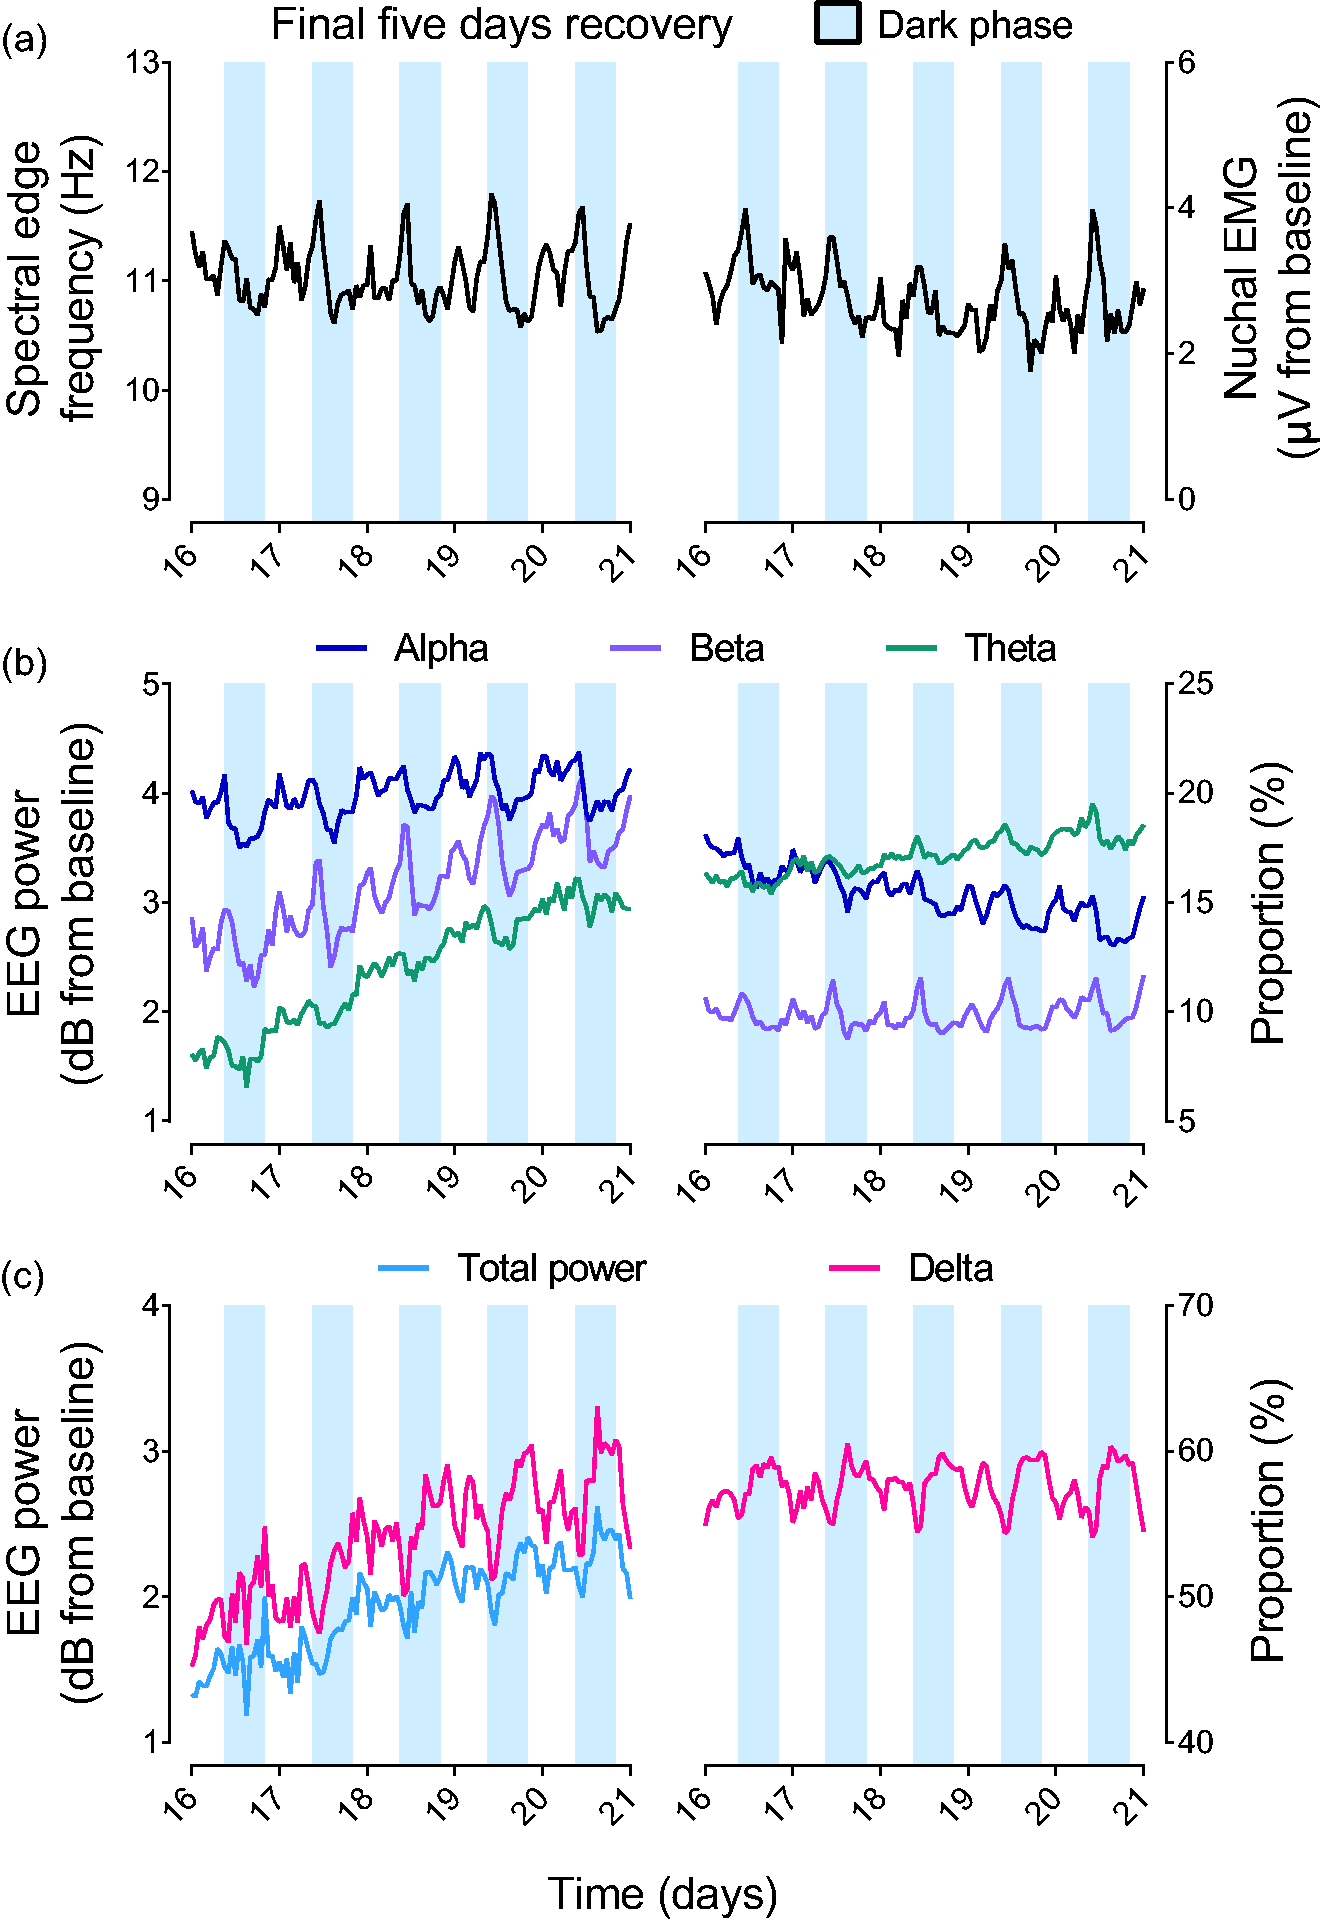
Disruption of circadian rhythms of EEG activity in the UCO group over the final 5 days of recovery. (a and b) Mean spectral edge frequency, nuchal EMG activity (top) along with theta, alpha and beta EEG power and proportions (middle) over the final 5 days of recovery after UCO in the UCO group alone (n = 9). Note the early morning trough, followed by a bimodal increase across the rest of the day with a smaller late morning peak and a greater evening peak in the parameters shown in the top and middle panels and (c) total EEG power and delta EEG power and proportion over the final 5 days of recovery after UCO in the UCO group alone (n = 9). Note that the parameters in the bottom panel illustrate the inverse pattern compared to the top and middle panels, consisting of an early morning peak, followed by a bimodal decrease across the rest of the day with a smaller late morning peak and a greater evening peak. Data displayed in all panels are 1 h means and are the final 5 days of the UCO group alone displayed in Figures 1 and 2 without error bars. EEG powers and nuchal EMG activity are shown relative to baseline. The shaded blue region indicates the dark cycle in our laboratory from 6pm–6am.
Intriguingly, all fetuses in the UCO group showed a daily, temporary impairment in sleep state cycling, whereby sleep state cycling abruptly stopped each night, which was never observed in the control group. The timing of this on the final night was 7:02 pm ± 47 min (range 5:55–8:19 pm), lasting 2 h 48 min ± 40 min (Figure 5). At the time when sleep state cycling stopped, it was replaced by persistent low-voltage, high-frequency EEG activity (classified as low-voltage sleep for the purpose of this analysis). This finding was statistically supported by complex interaction effects between the two sleep states, the time of day and the effect of UCO on the percentage time spent in each sleep state (p < 0.01) and the spectral edge frequency during each sleep state (p < 0.05). This phenomenon was evident each night over the final 3–5 days of recovery (blue arrows in Figure 5).
This period corresponded broadly with the start of the dark phase of our laboratory, and with the timing of the second (higher amplitude) bimodal features described above (i.e. the higher amplitude peak in spectral edge frequency, nuchal EMG activity, theta, alpha and beta powers and proportions and the higher amplitude nadir in total EEG power, delta power and delta proportion). Assessment of the raw EMG signals suggested an increase in abnormal tonic-like activity at this time. 2/9 fetuses in the UCO group also showed disruption of sleep state cycling in the morning at 6:51 am lasting 5 h 42 min and 8:41 am lasting 2 h 30 min (average 4 h 6 min ± 2 h 16 min), broadly in time with the first, smaller amplitude bimodal feature.
Relationship between histological and neurophysiological outcomes
UCO was associated with a spectrum of severe macroscopic WMI including cystic lesions, white matter atrophy and ventriculomegaly at 21 days after UCO, as previously described. 13 Consistent with this, white matter area (p < 0.05) and thalamic area (p < 0.05) were significantly smaller in the UCO group, while lateral ventricle area was significantly increased (p < 0.01) in the UCO group compared to the control group (Figure 7). Exploratory analysis including both groups suggested that smaller white matter area was linearly associated with lower total EEG power over the final 24 h of recovery (p < 0.05, R2 = 0.24, n = 18), a lower percentage time spent in high-voltage sleep (p < 0.05, R2 = 0.264, n = 18) and lower total EEG power during high-voltage sleep (p < 0.05, R2 = 0.24, n = 18). Similarly, smaller thalamic area was linearly associated with increased average nuchal EMG activity over the final 24 h of recovery (p < 0.05, R2 = 0.34, n = 18) and lower total EEG power during high-voltage sleep (p < 0.05, R2 = 0.32, n = 18). Larger lateral ventricle area was associated with lower average total EEG power (p < 0.01, R2 = 0.37, n = 18) and increased average nuchal EMG activity (p < 0.001, R2 = 0.51, n = 18) over the final 24 h of recovery, lower percentage time spent in high-voltage sleep (p < 0.05, R2 = 0.24, n = 18) and lower total EEG power during both high-voltage (p < 0.005, R2 = 0.42, n = 18) and low-voltage sleep (p < 0.005, R2 = 0.40, n = 18, Figure 7).
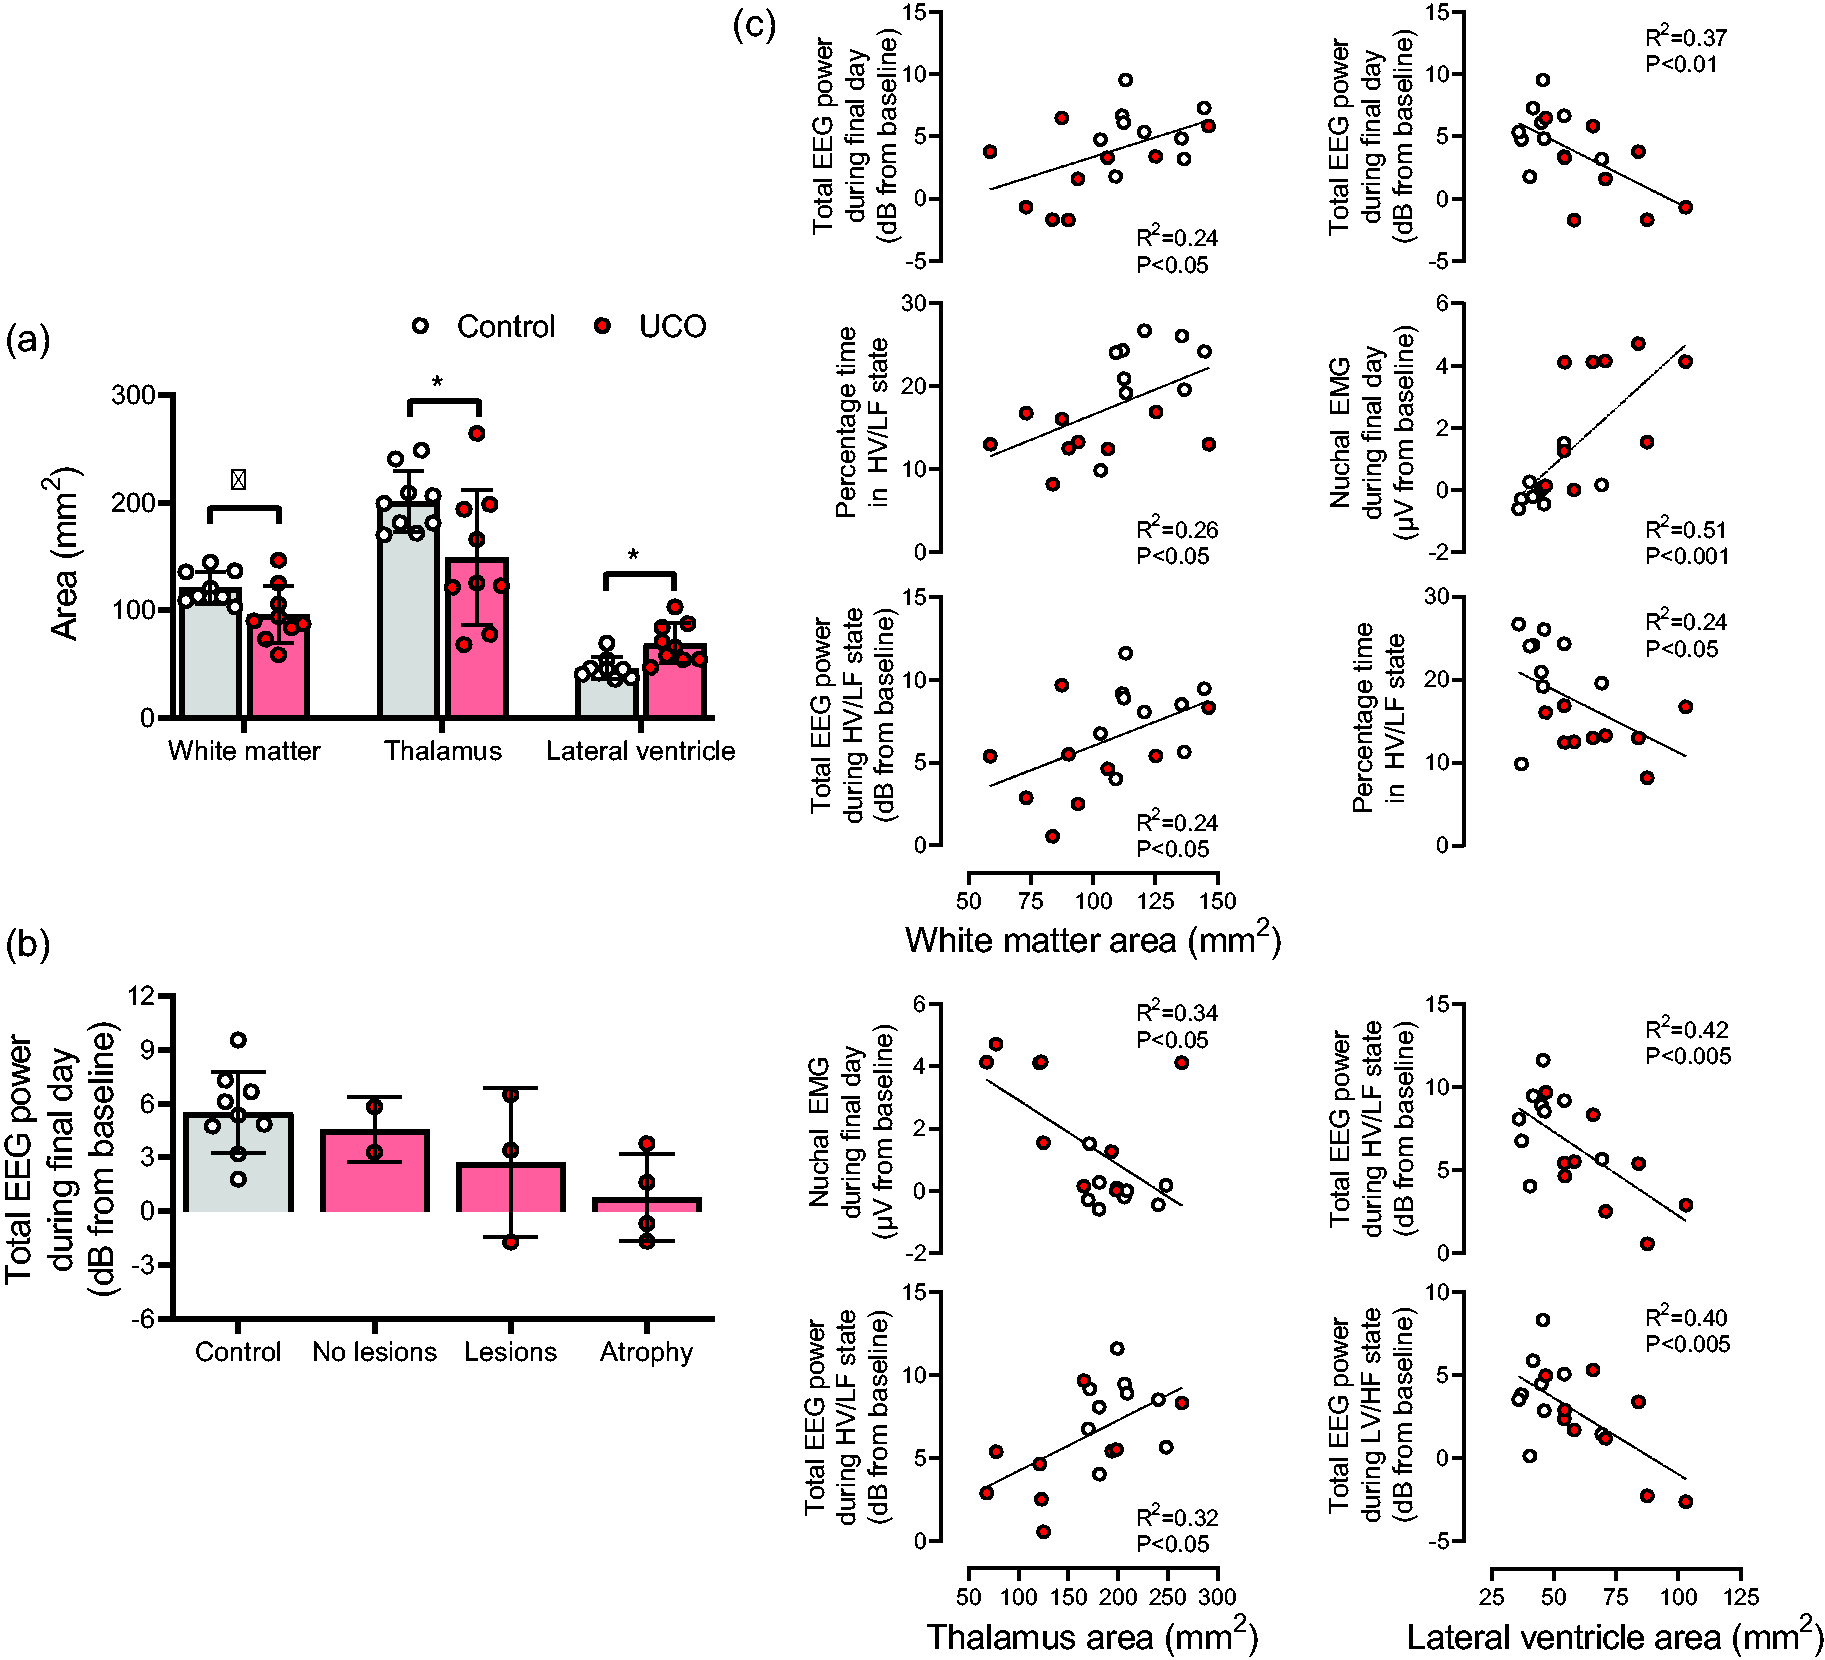
Histological outcomes and correlations with EEG recovery. (a) White matter, thalamic and lateral ventricle areas at 21-days recovery in the control and UCO groups. Data are means ± SD. *p < 0.05 control vs. UCO groups. (b) Total EEG power during the final day of recovery in the control group and the subgroups within the UCO group. Note that EEG power is broadly worse with more severe injury (atrophy being the most severe subgroup). See Lear et al for full descriptions of the subgroups in the UCO group. 53 Data are 24-hour means ± SD and shown relative to baseline and (c) Correlations between histological outcomes and selected EEG parameters. Note the broad worsening of multiple EEG parameters with lower white matter and thalamic area, and with increasing lateral ventricle area.
Discussion
The present study demonstrates that severe HI in preterm fetal sheep is associated with profound dysmaturation of EEG activity over the 3-week recovery period, with impaired sleep state maturation and abnormal sleep state architecture at term-equivalent. The paradigm of 25 min complete UCO triggers a pattern of slowly evolving severe WMI, which shares both microscopic and macroscopic characteristics with delayed cystic WMI in preterm humans, as previously reported. 13 In turn, we observed a broad relationship between the severity of macroscopic brain injury and abnormal EEG activity across multiple parameters at 3-weeks recovery (Figure 7). These findings are relevant to understanding the functional electroencephalographic consequences of WMI among high-risk neonates after exposure to HI at preterm gestation and offer a potential early biomarker for cerebral palsy at term equivalent.
When assessed as hourly averages irrespective of sleep state, severe HI was associated with a persistent loss of total, delta and theta EEG spectral power over the entire 3-week recovery period, whereas alpha and beta power were depressed for the first two weeks but recovered to control levels over the final week of recovery. Consistent with previous reports,22,28 the first five days of recovery were associated with a switch towards low frequency EEG activity driven by an increased proportion of delta activity, and reciprocally, reduced proportions of alpha and beta band activity, likely reflecting endogenous inhibition of cerebral metabolic activity.21,22,29 In turn, loss of high frequency activity is consistent with the ‘acute stage’ EEG abnormalities described within 72 h of birth in neonates who later develop cystic WMI.8,9 and have adverse neurodevelopmental outcomes. 12
Notably, by the final 3 days of recovery, UCO was associated with a shift towards higher frequency EEG activity, in an intriguing circadian pattern (Figures 5 and 6). As discussed in more detail below, this was mediated by reduced high-voltage sleep but also by daily triphasic increases of theta, alpha and beta band activity and increased spectral edge frequency. This rhythmic pattern was observed over the final week of recovery after UCO, and thus preceded or at least coincided with the appearance of sleep state cycling. Following an early morning nadir at approximately 3:20 am, the first smaller amplitude peak occurred at approximately 9 am, with a second higher ampltiude evening peak at approximately 8 pm. Higher frequency EEG activity then progressively fell for the rest of the night to the nadir. A corresponding inverse triphasic pattern with similar timings was observed in total EEG power and lower frequency delta band power and proportion. UCO was also associated with a persistent increase in nuchal EMG activity from 3–21 days after UCO, most likely related to hypertonia. Consistent with this, spasticity was often observed at post-mortem in these animals, although this was not quantified. A similar timecourse of hypertonia has been reported after HI in rabbit kits. 30 Intriguingly, the two daily peaks in alpha and beta activity were paralleled in time by a similar pattern in nuchal EMG activity, with the raw EMG showing that the peaks represented increased background activity, in keeping with tonic EMG activity.
The present paradigm of 25 min UCO at preterm equivalent age is also associated with striatal and thalamic neuronal death by 7 days recovery31 –33 and extensive hippocampal neuronal death by 3 days recovery that is still present by 21 days. 15 Impaired cortical growth is apparent at 21 days recovery without any loss of parietal or temporal lobe cortical neurons, 15 consistent with findings in a similar model in which loss of cortical area was related to impaired cortical synaptogenesis. 34 Furthermore, we observe a pattern of slowly evolving severe WMI, including white matter atrophy, cystic lesions and impaired oligodendrocyte maturation at 21 days after UCO. 13 This evolving pattern of WMI likely represents delayed programmed necrosis initiated by increased neuroinflammation, and critically by increased tumour necrosis factor. 35
The constellation of WMI, subcortical grey matter injury and impaired cortical growth, along with impaired neuronal connectivity, likely underpins the EEG dysmaturation observed in the present study. Loss of white matter and thalamic area were both associated with impaired EEG activity, aberrantly increased nuchal EMG activity and impaired sleep state architecture on the final day of recovery (Figure 7). Interestingly, lateral ventricle area showed the strongest association with impaired EEG, sleep state and nuchal EMG parameters. Considering that lateral ventricle area is affected by both white matter area and changes to grey matter structures including the thalamus, this finding likely reflects that lateral ventricle area in this study was a better proxy for the overall severity of brain injury across multiple regions compared to white matter or thalamic areas alone. We previously reported that the severity of impaired total EEG power in the present cohort was associated with cortical, white matter and lateral ventricle area. 15 Here we extend these findings to demonstrate that the severity of injury correlates with impairment of spectral bands and sleep state architecture. Overall, more severe macroscopic white matter injury was broadly associated with lower total EEG power on the final day (Figure 7(b)). Further, we have previously observed increased numbers of astrocytes and microglia in the hippocampus between 3–21 days recovery and the cortex between 3–14 days recovery. 15 Cortical microgliosis and astrogliosis is also observed 7 days after HI at near-term gestation. 36 Both glia and inflammatory cytokines regulate synaptic function,37 –41 and thus neuroinflammation may contribute to impaired EEG development after HI.
Over the recovery period, controls transitioned from an immature, discontinuous pattern of EEG activity to a mature pattern showing distinct periods of low-voltage and high-voltage sleep (Figure 1(c)). We indirectly assessed sleep state maturation using the methodology of Szeto 24 at multiple timepoints to assess the distribution of spectral edge frequency (Figure 1(b)). The immature, discontinuous EEG pattern at preterm gestation at the start of the experiment was reflected by a unimodal distribution centred around high-frequency activity. This distribution progressively became skewed and flattened with increasing maturation, until a second lower frequency peak developed from 13 days of recovery onwards (117–118 days of gestation). This reflects the development of sleep state cycling, with an initial predominance of low-voltage sleep (reflected as the larger high-frequency peak) and a progressive increase in the proportion of high-voltage sleep (reflected as the smaller but growing low-frequency peak in Figure 1(b)). This in turn corresponds with a gradual fall in spectral edge frequency over the final week of recovery in the control group. 42 Next, we performed an in depth analysis of sleep state architecture over the final day of recovery. This analysis showed that the proportion and average length of each state in the control group was similar to previous reports, 25 with the expected compartmentalisation of nuchal EMG activity between low-voltage and high-voltage states (Figure 2(b)),26,42 suggesting that our EEG-defined low-voltage and high-voltage states were broadly consistent with rapid eye movement (REM) and non-REM (NREM) sleep, respectively.
In the present study, UCO was associated with loss of the maturational increase in the proportion of high-voltage sleep. This can be observed indirectly as an impaired increase in the low-frequency peak in Figure 1. As well, our direct analysis of sleep state over the final day showed the UCO group had an overall reduction in time spent in high-voltage sleep, mediated by reduced average duration of high-voltage sleep, while the number of high-voltage sleep states remained unchanged (Figure 5). The quality of the remaining high-voltage sleep was impaired, with fetuses in the UCO group showing increased spectral edge frequency and a lower proportion of theta activity during high-voltage sleep compared to controls. We also observed lower FHR during high-voltage sleep in the UCO group, but not during low-voltage sleep. By contrast, we observed a specific increase in beta band power during low-voltage sleep. Outside these state-specific effects, there was reduced total, delta, theta and alpha power across both high-voltage and low-voltage states (Figures 2 to 4).
Further, the proportion of delta activity was reduced in both states, while, conversely, the proportion of beta activity was increased in both states (Figure 4). Collectively, this demonstrates substantial changes in sleep state architecture in the UCO group. Sleep state cycling represents an expression of a mature, intact central nervous system.19,43 Preterm infants show delayed development of sleep state architecture,43,44 with reduced time spent in NREM sleep, 44 consistent with the present findings. It is important to appreciate that our study cannot determine whether impaired sleep state cycling after preterm HI reflects delayed maturation or permanent disruption. Nevertheless, considering the severity of white and grey matter injury observed in the present cohort,13,15 it seems unlikely that this merely reflects delayed maturation.
Unexpectedly, we observed that every evening during the final week of recovery all fetuses exposed to UCO abruptly stopped sleep state cycling for several hours. On the final day of recovery, this occurred at 7:02pm ± 47 min (range 5:55–8:19pm) for 2.5 ± 0.2 hours (Figure 5). This interruption began approximately at the time of the second daily peak of alpha and beta activity. During this time the fetuses showed high frequency EEG activity with a marked reduction in time spent in high-voltage sleep. No such patterns were observed in control fetuses. It is interesting to note that the timing broadly corresponds with the start of the 12 h dark cycle within our laboratory. A few (2/9) fetuses in the UCO group also showed disruption to sleep state cycling in the morning.
Of potential relevance, children with cerebral palsy and/or cystic WMI have high rates of epilepsy including syndromes such as continuous spike-wave during sleep syndrome, 10 which may be related to thalamic injury. 45 We speculate that these nocturnal increases in high frequency EEG activity, tonic EMG activity and sleep state disruption may represent precursors for, and therefore potential biomarkers of, severe epileptic syndromes. In particular, the increased high frequency EEG activity may reflect the appearance of increased numbers of epileptiform discharges such as sharp waves, as observed in preterm humans with severe WMI.46 –48 The most severe WMI in the present cohort was located in the temporal lobe, 13 although there was no neuronal loss in the temporal lobe. 15 Unfortunately, EEG electrodes were only placed overlying the parietal lobe in the present study and so we may have been less able to detect epileptiform discharges originating in the temporal lobe.
The origin of the altered EEG and sleep state circadian rhythms are unknown. Circadian rhythms reflect the interaction between the central clock of the hypothalamic suprachiasmatic nucleus (SCN) and peripheral clocks. 49 Fetal circadian rhythms remain incompletely understood, but the SCN develops early in gestation and fetal circadian rhythmicity is entrained by the placental passage of maternal melatonin.50,51 Unfortunately, we did not take serial plasma samples to assess whether melatonin regulation was altered. Considering key maternal zeitgebers including food intake, day-night cycling and activity were unaltered across the experiment, it is unlikely that altered maternal production of melatonin is involved. We cannot rule out altered fetal responsiveness to maternal melatonin, but it equally seems unlikely responsiveness would fluctuate across the day. Although not formally quantified, we previously noted exaggerated EEG circadian rhythms after profound cystic injury (more severe than in the present study) caused by hyperglycaemia and HI in preterm fetal sheep. 52 Considering the profound injury in that study, we hypothesise that exaggerated EEG circadian rhythms reflected destruction of the majority of generators of the circadian rhythm of EEG activity. This may have uncovered a rudimentary but high amplitude circadian rhythm, perhaps reflecting a simple rhythm such as that of cortisol. With these concepts in mind, we speculate that our present findings may reflect the interaction between destruction of some generators of circadian rhythms combined with aberrant activity from other generators. Thalamic injury is a likely contributor to the impaired EEG maturation, 45 which will need to be investigated further in future studies.
We have previously reported altered circadian patterns in time and frequency domain measures of fetal heart rate variability (FHRV), as well as arterial blood pressure, in an overlapping cohort of the present animals. 53 This pattern involved an exaggerated circadian rhythm, with lower morning nadirs but a return to control levels at the evening peak. Interestingly, the alterations observed in FHRV do not match those observed in EEG activity in the present study. Further, the reader should note that cardiovascular parameters (fetal heart rate, time and frequency domain measures of FHRV and arterial pressure) in the UCO group showed a simpler, biphasic circadian pattern, consisting of a morning nadir and an evening peak. By contrast, all EEG parameters and nuchal EMG showed a complex triphasic rhythm, with one phase in the early morning, the second in the late morning and the third in the early evening.
FHRV is predominantly regulated by autonomic outflow from the hindbrain, specifically the medullary cardiovascular centres. 54 The comparison between EEG and cardiovascular parameters suggests that the circadian rhythms of the forebrain and hindbrain are distinct, at least after severe HI. As well, we must bear in mind the potential contribution of peripheral clocks, in particular the heart and its contribution to the circadian rhythm of FHRV. It is also interesting to note that the exaggerated circadian patterns in FHRV appeared to develop earlier during recovery from HI, while the exaggerated EEG circadian rhythms appeared to still be developing towards 21 days of recovery. This may reflect the relative trajectories and timings of histological injury in the forebrain and hindbrain, with potentially earlier evolution of brainstem injury compared to the forebrain. Characterising the development of hindbrain/brainstem injury in the present cohorts will be an important area for future studies. Additionally, fetal activity and body movements are key regulators of FHRV, 54 it is interesting that the disrupted circadian patterns in nuchal EMG activity paralleled the circadian patterns observed in EEG activity rather than those for FHRV.
The readers should consider some important points when interpreting our results in relation to the human preterm infant. In our model fetuses recover in utero with normal placental gaseous exchange and optimal supply of nutrients and growth factors. 19 The best evidence to date strongly supports that the fetus is maintained in a state of perpetual sleep, due to both local production and placental supply of potent neuroinhibitory factors. 55 The in utero environment is likely optimal for recovery from HI, 19 and thus human preterm infants recovering ex utero may have greater EEG impairment than we observed. 19 Furthermore, preterm infants may be exposed to in and ex utero inflammation/infection, and require ventilation support. 56 These factors likely modulate HI injury and EEG/sleep state maturation; this potential complexity is not captured within the present study. Although cystic WMI is the pattern most strongly associated with severe neurodevelopmental disability4,5 its incidence is gradually falling, 57 while milder diffuse WMI is increasingly common in contemporary cohorts. 58 In future studies we will assess EEG maturation after milder, diffuse WMI, without cystic injury.
Significance and perspectives
The present study is the first time that EEG maturation and sleep state architecture until term maturation have been systematically characterised after a defined period of HI at preterm gestation. This paradigm produces a spectrum of severe white matter degeneration, including cystic WMI similar to that observed in preterm humans. 13 Consistent with previous findings in both fetal sheep and humans,11,22,28 HI was initially associated with a shift to low frequency EEG activity during the first five days of recovery, that was progressively replaced by higher frequency EEG patterns by 21 days of recovery, including rhythmic daily increases in alpha and beta activity. Strikingly, fetuses exposed to severe HI abruptly stopped sleep state cycling for several hours each evening in a circadian fashion, suggesting that intermittent loss of fetal or neonatal cyclicity in the early evening may represent a biomarker for evolving severe WMI and thus risk of cerebral palsy, that should be studied in future studies.
Supplemental Material
sj-pdf-1-jcb-10.1177_0271678X241236014 - Supplemental material for Dysmaturation of sleep state and electroencephalographic activity after hypoxia-ischaemia in preterm fetal sheep
Supplemental material, sj-pdf-1-jcb-10.1177_0271678X241236014 for Dysmaturation of sleep state and electroencephalographic activity after hypoxia-ischaemia in preterm fetal sheep by Christopher A Lear, Benjamin A Lear, Joanne O Davidson, Victoria J King, Yoshiki Maeda, Alice McDouall, Simerdeep K Dhillon, Alistair J Gunn and Laura Bennet in Journal of Cerebral Blood Flow & Metabolism
Footnotes
Funding
The author(s) disclosed receipt of the following financial support for the research, authorship, and/or publication of this article: This study was funded by grants from the Health Research Council of New Zealand (grant numbers grant numbers 17/601, 22/559) and the Auckland Medical Research Foundation (1122002).
Declaration of conflicting interests
The author(s) declared no potential conflicts of interest with respect to the research, authorship, and/or publication of this article.
Authors’ contributions
These experiments were conducted in the Fetal Physiology and Neuroscience Group laboratory, at the University of Auckland. CAL, LB and AJG conceived the hypotheses, experimental design and analysis protocols for this study. CAL, BAL, JOD, YM, VJK and SKD were responsible for data collection. CAL, AM and VJK performed the physiological analysis. BAL performed the histological analysis. CAL drafted the manuscript. All authors were involved in data interpretation and critically reviewed the manuscript. All authors listed qualify for authorship and approved the final version of the manuscript.
Supplementary material
Supplemental material for this article is available online.
References
Supplementary Material
Please find the following supplemental material available below.
For Open Access articles published under a Creative Commons License, all supplemental material carries the same license as the article it is associated with.
For non-Open Access articles published, all supplemental material carries a non-exclusive license, and permission requests for re-use of supplemental material or any part of supplemental material shall be sent directly to the copyright owner as specified in the copyright notice associated with the article.