
Abstract
This systematic review, meta-analysis, and novel time course analysis examines microvascular failure in the treatment of acute ischemic stroke (AIS) patients undergoing endovascular therapy (EVT) and/or thrombolytic administration for stroke management. A systematic review and meta-analysis following PRIMSA-2020 guidelines was conducted along with a novel curve-of-best fit analysis to elucidate the time-course of microvascular failure. Scopus and PubMed were searched using relevant keywords to identify studies that examine recanalization and reperfusion assessment of AIS patients following large vessel occlusion. Meta-analysis was conducted using a random-effects model. Curve-of-best-fit analysis of microvascular failure rate was performed with a negative exponential model. Twenty-seven studies with 1151 patients were included. Fourteen studies evaluated patients within a standard stroke onset-to-treatment time window (≤6 hours after last known normal) and thirteen studies had an extended time window (>6 hours). Our analysis yields a 22% event rate of microvascular failure following successful recanalization (95% CI: 16–30%). A negative exponential curve modeled a microvascular failure rate asymptote of 28.5% for standard time window studies, with no convergence of the model for extended time window studies. Progressive microvascular failure is a phenomenon that is increasingly identified in clinical studies of AIS patients undergoing revascularization treatment.
Introduction
Acute ischemic stroke (AIS) is a leading cause of death and long-term disability in the United States.1,2 While advances in recanalization strategies have led to increased rates of successful recanalization up to >85%,3 –6 they have not translated to an equivalent improvement in functional clinical outcomes. One possibility for this limited recovery is that beyond vessel occlusion, cerebral ischemia and reperfusion unleash a complex physiological response that involves robust thrombo-inflammatory processes that are not targeted by revascularization therapy7 –14 and result in progressive microvascular dysfunction and secondary tissue injury.15 –18 Growing recognition of the importance of reperfusion as distinct from recanalization9,10,14 has led to recent interest in the phenomenon of progressive microvascular failure as a potential treatment target for mitigating the disparity between recanalization success and motor and cognitive recovery in patients.
Progressive microvascular failure is a time-dependent phenomenon that evolves following successful recanalization in LVO stroke as determined by angiography, in which patients demonstrate incomplete reperfusion on post-revascularization perfusion imaging studies. Unlike the no-reflow phenomenon, progressive microvascular failure does not encompass embolization of original thrombus fragments into the distal vasculature that may present as impaired cerebral blood flow on angiography following LVO revascularization.19,20 Stalled neutrophils 21 , microvascular pericyte constriction22,23, and deleterious vascular remodeling secondary to acute neuroinflammation 24 are proposed as the underlying mechanisms of progressive microvascular failure that are compatible with the pathophysiology timeline identified in existing AIS studies.8,25 The loss of capillary integrity and autoregulation results in progressive vasoconstriction and ultimately flow arrest.26,27 The resulting circulatory failure is defined as hypoperfusion in the vascular territory that is distal to the site of recanalization, and does not include ischemic injury associated with embolization of inciting thrombus that may be directly associated with the revascularization intervention. 20 At a molecular level, elevated proinflammatory cytokines (IL-1, IL-6)28 –30, increased neutrophil-to-leukocyte ratio 31 , and increased Egr-1 expression 32 have been associated with the structural and functional microvascular dysfunction resulting in impaired perfusion. 25 Progressive microvascular failure has largely been characterized as a microcirculatory phenomenon that localizes to arterioles and capillaries. However, venule obstruction secondary to leukocyte adhesion and subsequent thrombus formation has been identified in middle cerebral artery stroke, and supports a more generalized microcirculatory dysfunction not confined to vessel subtypes.20,33
Following recanalization, the prognostic value of reperfusion and its relationship to clinical and functional outcomes has been difficult to characterize. 9 Hypoperfusion volume in AIS patients has been associated with early neurologic decline at 72 hours of stroke onset. 34 Recent pooled analysis from three RCTs35 –37 has provided Class II evidence that hypoperfusion, in the setting of complete revascularization, was independently associated with early functional decline at 24 hours and poor functional outcomes at 90-days (modified Rankin Scale score ≥3) that is independent of final infarct volume. 7 However, clinical studies that examine progressive microvascular failure have generally been limited in scope to static, associative relationships between reperfusion and patient outcomes that do not necessarily track the temporal evolution of post-intervention reperfusion.7,38,39
There is heterogeneity with respect to the definition of progressive microvascular failure and effective reperfusion which necessitates a structured approach to evaluating the phenomenon in clinical studies. The overarching goal of this systematic review and meta-analysis is to evaluate the frequency of progressive microvascular failure across studies that and clarify its time course across the included studies, which are generally limited to a single post-recanalization reperfusion assessment that precludes the temporal analysis of progressive microvascular dysfunction. This approach clarifies the temporal dimension of microvascular failure in AIS, a novel contribution to the emergent study of progressive microvascular dysfunction and its timeline in ischemia/reperfusion injury. Based on prior clinical studies of microvascular dysfunction in AIS13,38, we expect that there will be a time-dependent course of progressive microvascular failure following revascularization therapy, that likely evolves between 30 minutes and five days from angiographically-confirmed recanalization.8,10,40 The rate of change of microvascular dysfunction may be affected by revascularization method, reperfusion imaging modality, and time window of intervention.8,13,38,41,42
Methods
Eligibility criteria
Studies that evaluated the degree of recanalization and reperfusion following EVT, intravenous thrombolysis, or a combined approach (EVT + thrombolytic) for the treatment of acute ischemic stroke were included in the analysis. Table 1 summarizes the relevant inclusion and exclusion criteria for studies used during the screening process. The methodology for quantification of the extent of recanalization and reperfusion varies in the existing literature of microvascular failure. 13 As operational definitions of progressive microvascular failure are evolving and reflect technological advancement in the ability to capture impaired reperfusion on imaging studies, no singular definition of successful reperfusion was implemented as a screening criterion. Instead, an article was included if the proportion of patients who had microvascular failure (patients with successful or complete recanalization without reperfusion) could be determined with the respective criteria and thresholds outlined in the study’s methodology. To avoid mischaracterization of progressive microvascular failure with the distal thrombus embolization associated with no-reflow, we excluded studies that evaluated downstream macrovascular occlusion following initial revascularization. With respect to recanalization, measures of patency at the site of occlusion (e.g. AOL) and patency of vasculature distal to the site of occlusion (e.g. TICI) were both considered valid if tissue-level microvascular reperfusion was determined using a validated methodology with a different and discrete threshold.43 –47 Non-English manuscripts, editorials, abstracts, and case reports were not included in the systematic review. Studies that assessed the microvascular failure in the same cohort of patients were not included to avoid double-counting of patient data and ensure the meta-analysis of microvascular failure rate was limited to unique patients.
Inclusion and exclusion criteria for study screening using the PRISMA-2020 framework for systematic reviews.
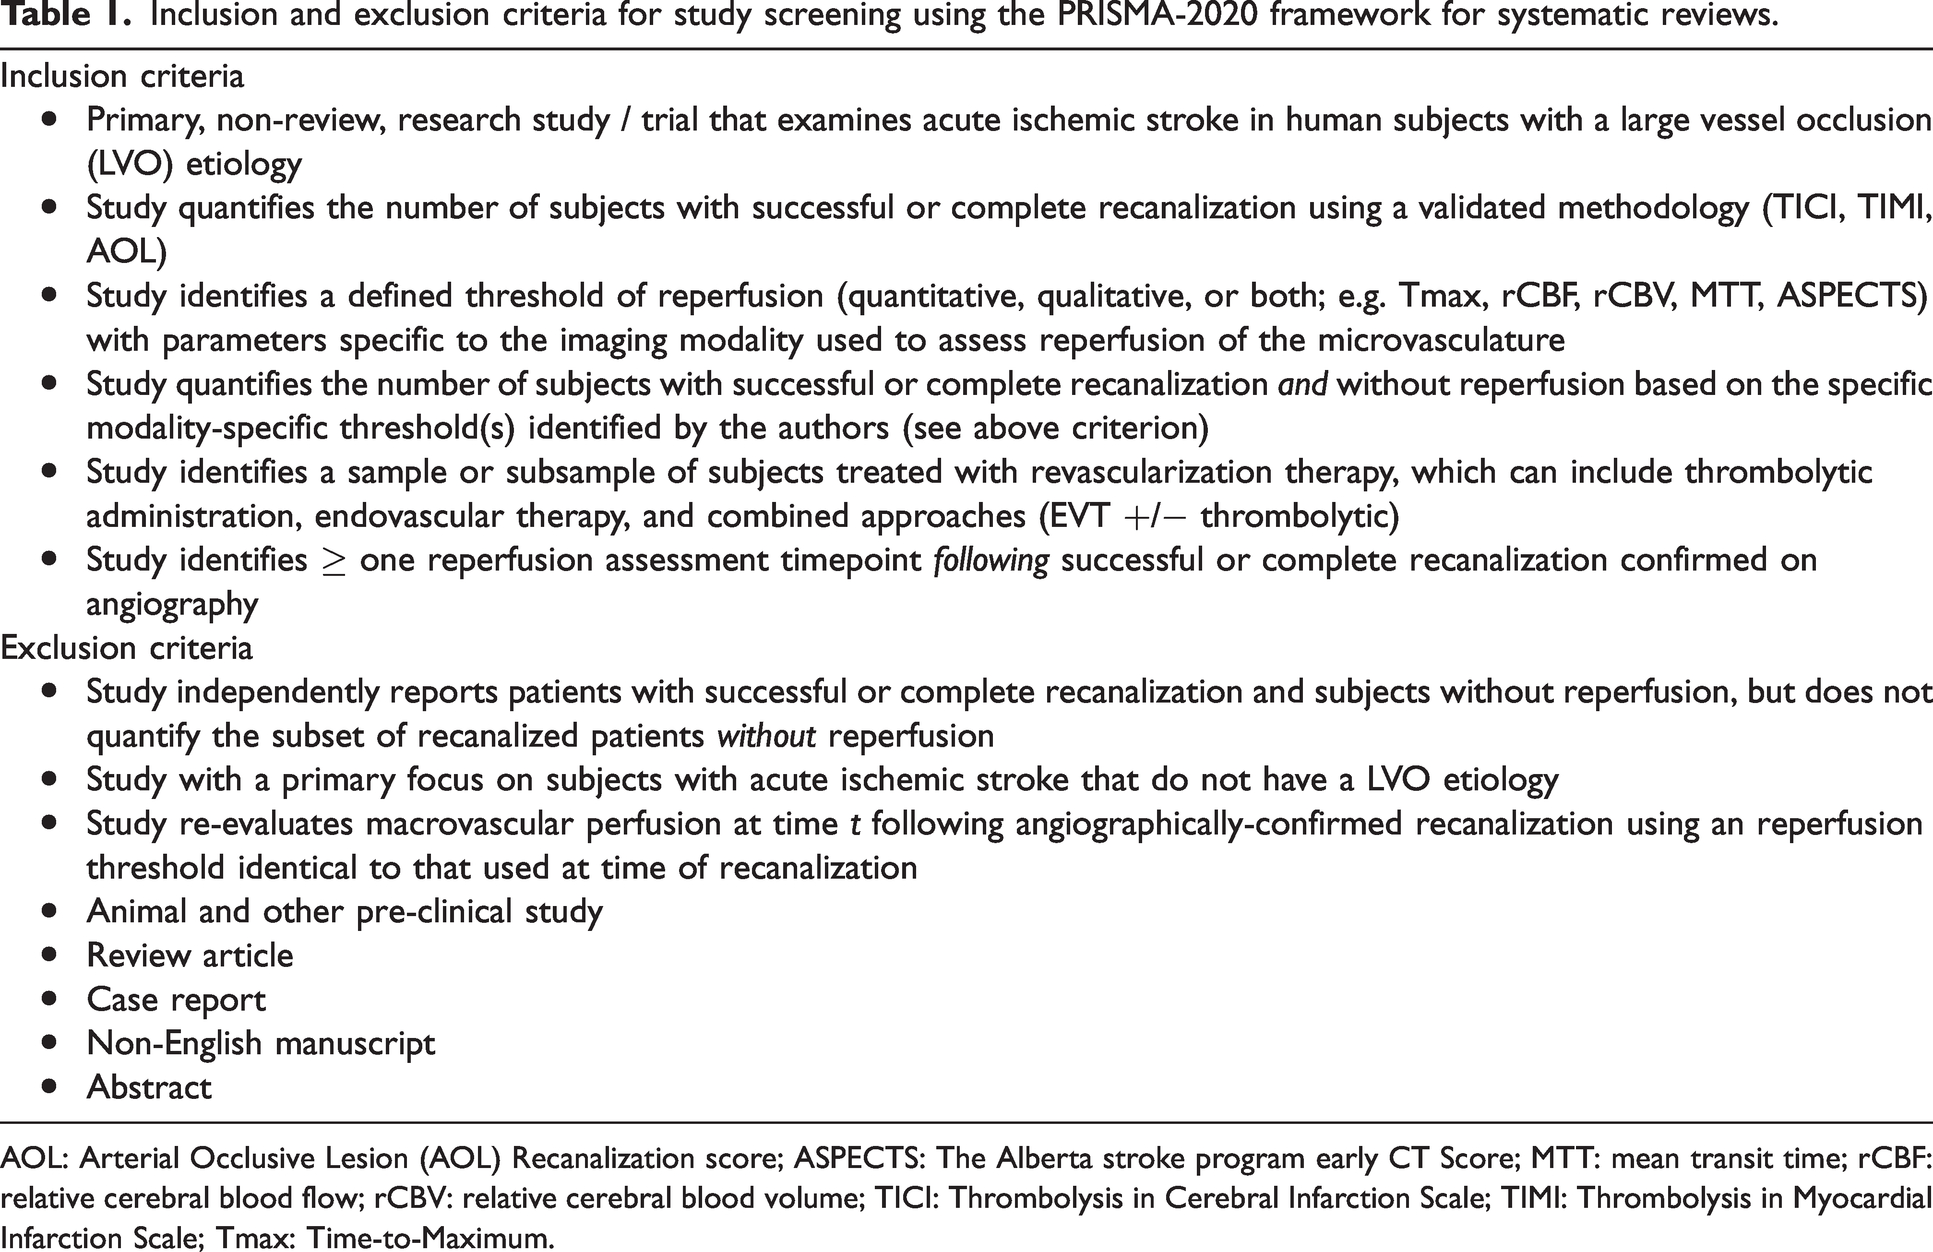
AOL: Arterial Occlusive Lesion (AOL) Recanalization score; ASPECTS: The Alberta stroke program early CT Score; MTT: mean transit time; rCBF: relative cerebral blood flow; rCBV: relative cerebral blood volume; TICI: Thrombolysis in Cerebral Infarction Scale; TIMI: Thrombolysis in Myocardial Infarction Scale; Tmax: Time-to-Maximum.
Information and data sources, search methodology
PubMed and Scopus were searched using free-text and MeSH terms relevant to microvascular failure, including “no-reflow”, “microvascular failure”, “recanalization without reperfusion”, “thrombolytic therapy”, “perfusion imaging”, “cerebral revascularization”, “thrombectomy”, “fibrinolytic agents”, and their relevant synonyms in appropriate combinations. No filters were used during the initial search process.
Article selection and data collection
Two independent co-authors (TT, EFS) sourced articles from the aforementioned databases and compiled them in a Microsoft Excel database. All duplicate articles were removed and studies in the database were subsequently screened for eligibility. Article titles and abstracts were initially reviewed for relevance to the systematic review and meta-analysis. Then, articles were reviewed in full to observe if appropriate the eligibility criteria were met and outcomes of interest were included in the study. Studies that met all screening criteria were then discussed among co-authors. In any instances of disagreement regarding the inclusion of a specific study, results were discussed with an additional co-author (ESC). Data from included studies including acute revascularization intervention type, imaging modality used to assess recanalization and reperfusion status, and time of assessment of reperfusion were recorded. Summary data from each study were gathered and pooled into the Microsoft Excel database, and did not represent an aggregation of individual patient data. If there were any conflicted data values for a given study, an additional researcher (ESC) was involved in confirming the appropriate data entry value.
Assessment of risk of bias
The National Institutes of Health Quality Assessment Tools were used to evaluate bias across included case series, cohort studies, and meta-analyses. ROB-2 and ROBINS-I tools were used for randomized and non-randomized studies respectively to systematically assess for risk of bias in the included studies based on the Cochrane methodology outlined in Version 6.3 of the Cochrane Handbook for Systematic Reviews of Interventions. 48
Determination of overall “low”, “medium”, “high”, or “critical” risk of bias for randomized trials using ROB-2 and ROBINS-I was made using the algorithms provided by Cochrane based on aggregation of rater sub-scores across the five and seven domains of bias respectively (refer to Cochrane Handbook for specific calculation of overall bias algorithms based on domain sub-scores). 48 Thresholds for overall bias calculated using NIH quality assessment tools for case series, cohort studies, and meta-analyses were made using two-rater determination based on the tool-specific “General Guidance” instructions developed to determine a study’s internal validity. 49 If there was disagreement between the ratings by the two reviewers (TT, EFS), final scoring was evaluated by a third reviewer (ESC) as a tie-breaker. 49 Peters’ linear regression test for funnel plot asymmetry was used to assess for small study effects in the meta-analysis.
Statistical analysis
RStudio software version 4.0.1 (RStudio Team (2020). RStudio: Integrated Development for R. RStudio, Inc., Boston, MA) was used for the meta-analysis, including the use of “meta”, “metafor”, “drc”, and “ggplot2” packages.50 –52 MATLAB software version: 9.13.0 (R2022b; The MathWorks Inc. Natick, MA) with the “Statistics and Machine Learning Toolbox” was used for curve-fitting of a two-parameter negative exponential model of microvascular failure rate from over time from successful recanalization for the included studies. Random-effects modeling was selected for estimating effect sizes across the included studies to account for heterogeneity in trial design, patient samples, and recanalization interventions (Supplemental Table 1).
To compare the number of patients who demonstrated progressive microvascular failure, the effect size for a given study was reported as the proportion of patients with successful recanalization without reperfusion. A patient was deemed to have microvascular failure if they had successful recanalization without reperfusion using the criteria outlined by a given study. The meta-analysis calculated a pooled effect size and 95% confidence interval. Between-study heterogeneity was reported using I2 statistic 53 to evaluate the percentage variability in effect sizes not attributable to sampling error and τ2 to quantify the variance of the true effect sizes. Subgroup analyses were conducted by recanalization method, imaging modality used to assess reperfusion status, and time window of revascularization using a mixed-effects model, with an independent or common estimate of τ2 used for analyses with subgroup size k> or ≤5 respectively. 54 Meta-regression of microvascular failure rate against study characteristics (time window, reperfusion assessment timepoint, recanalization method) was conducted using a mixed-effects, maximum likelihood-fitted model.
Results
Systematic review
The systematic review follows PRIMSA-2020 guidelines for systematic review reporting. 55 Using PubMED and Scopus, 299 articles were identified using a comprehensive list of search terms selected to identify records associated with progressive microvascular failure in the setting of AIS (Figure 1). Records were screened based on title and abstract, and 69 records were excluded due to abstract irrelevance, two duplicate records were removed, and one record was removed as it was not published in the English language. Subsequently, 227 reports were sought for retrieval, and one was not retrieved after extensive search. The search yielded 226 reports that were assessed for eligibility in the screening process, with 5 preclinical studies and 186 studies with the outcomes of interest not reported. Eleven review articles and seven case reports were further removed during the screening process. Additionally, 14 additional studies were sourced primarily from citation and reference analysis from the original study sample. Following exclusion of reports in this subset that did not evaluate microvascular failure in unique patients and review articles, ten of these studies were ultimately included in the analysis. Ultimately, 27 studies were included in the systematic review and meta-analysis.
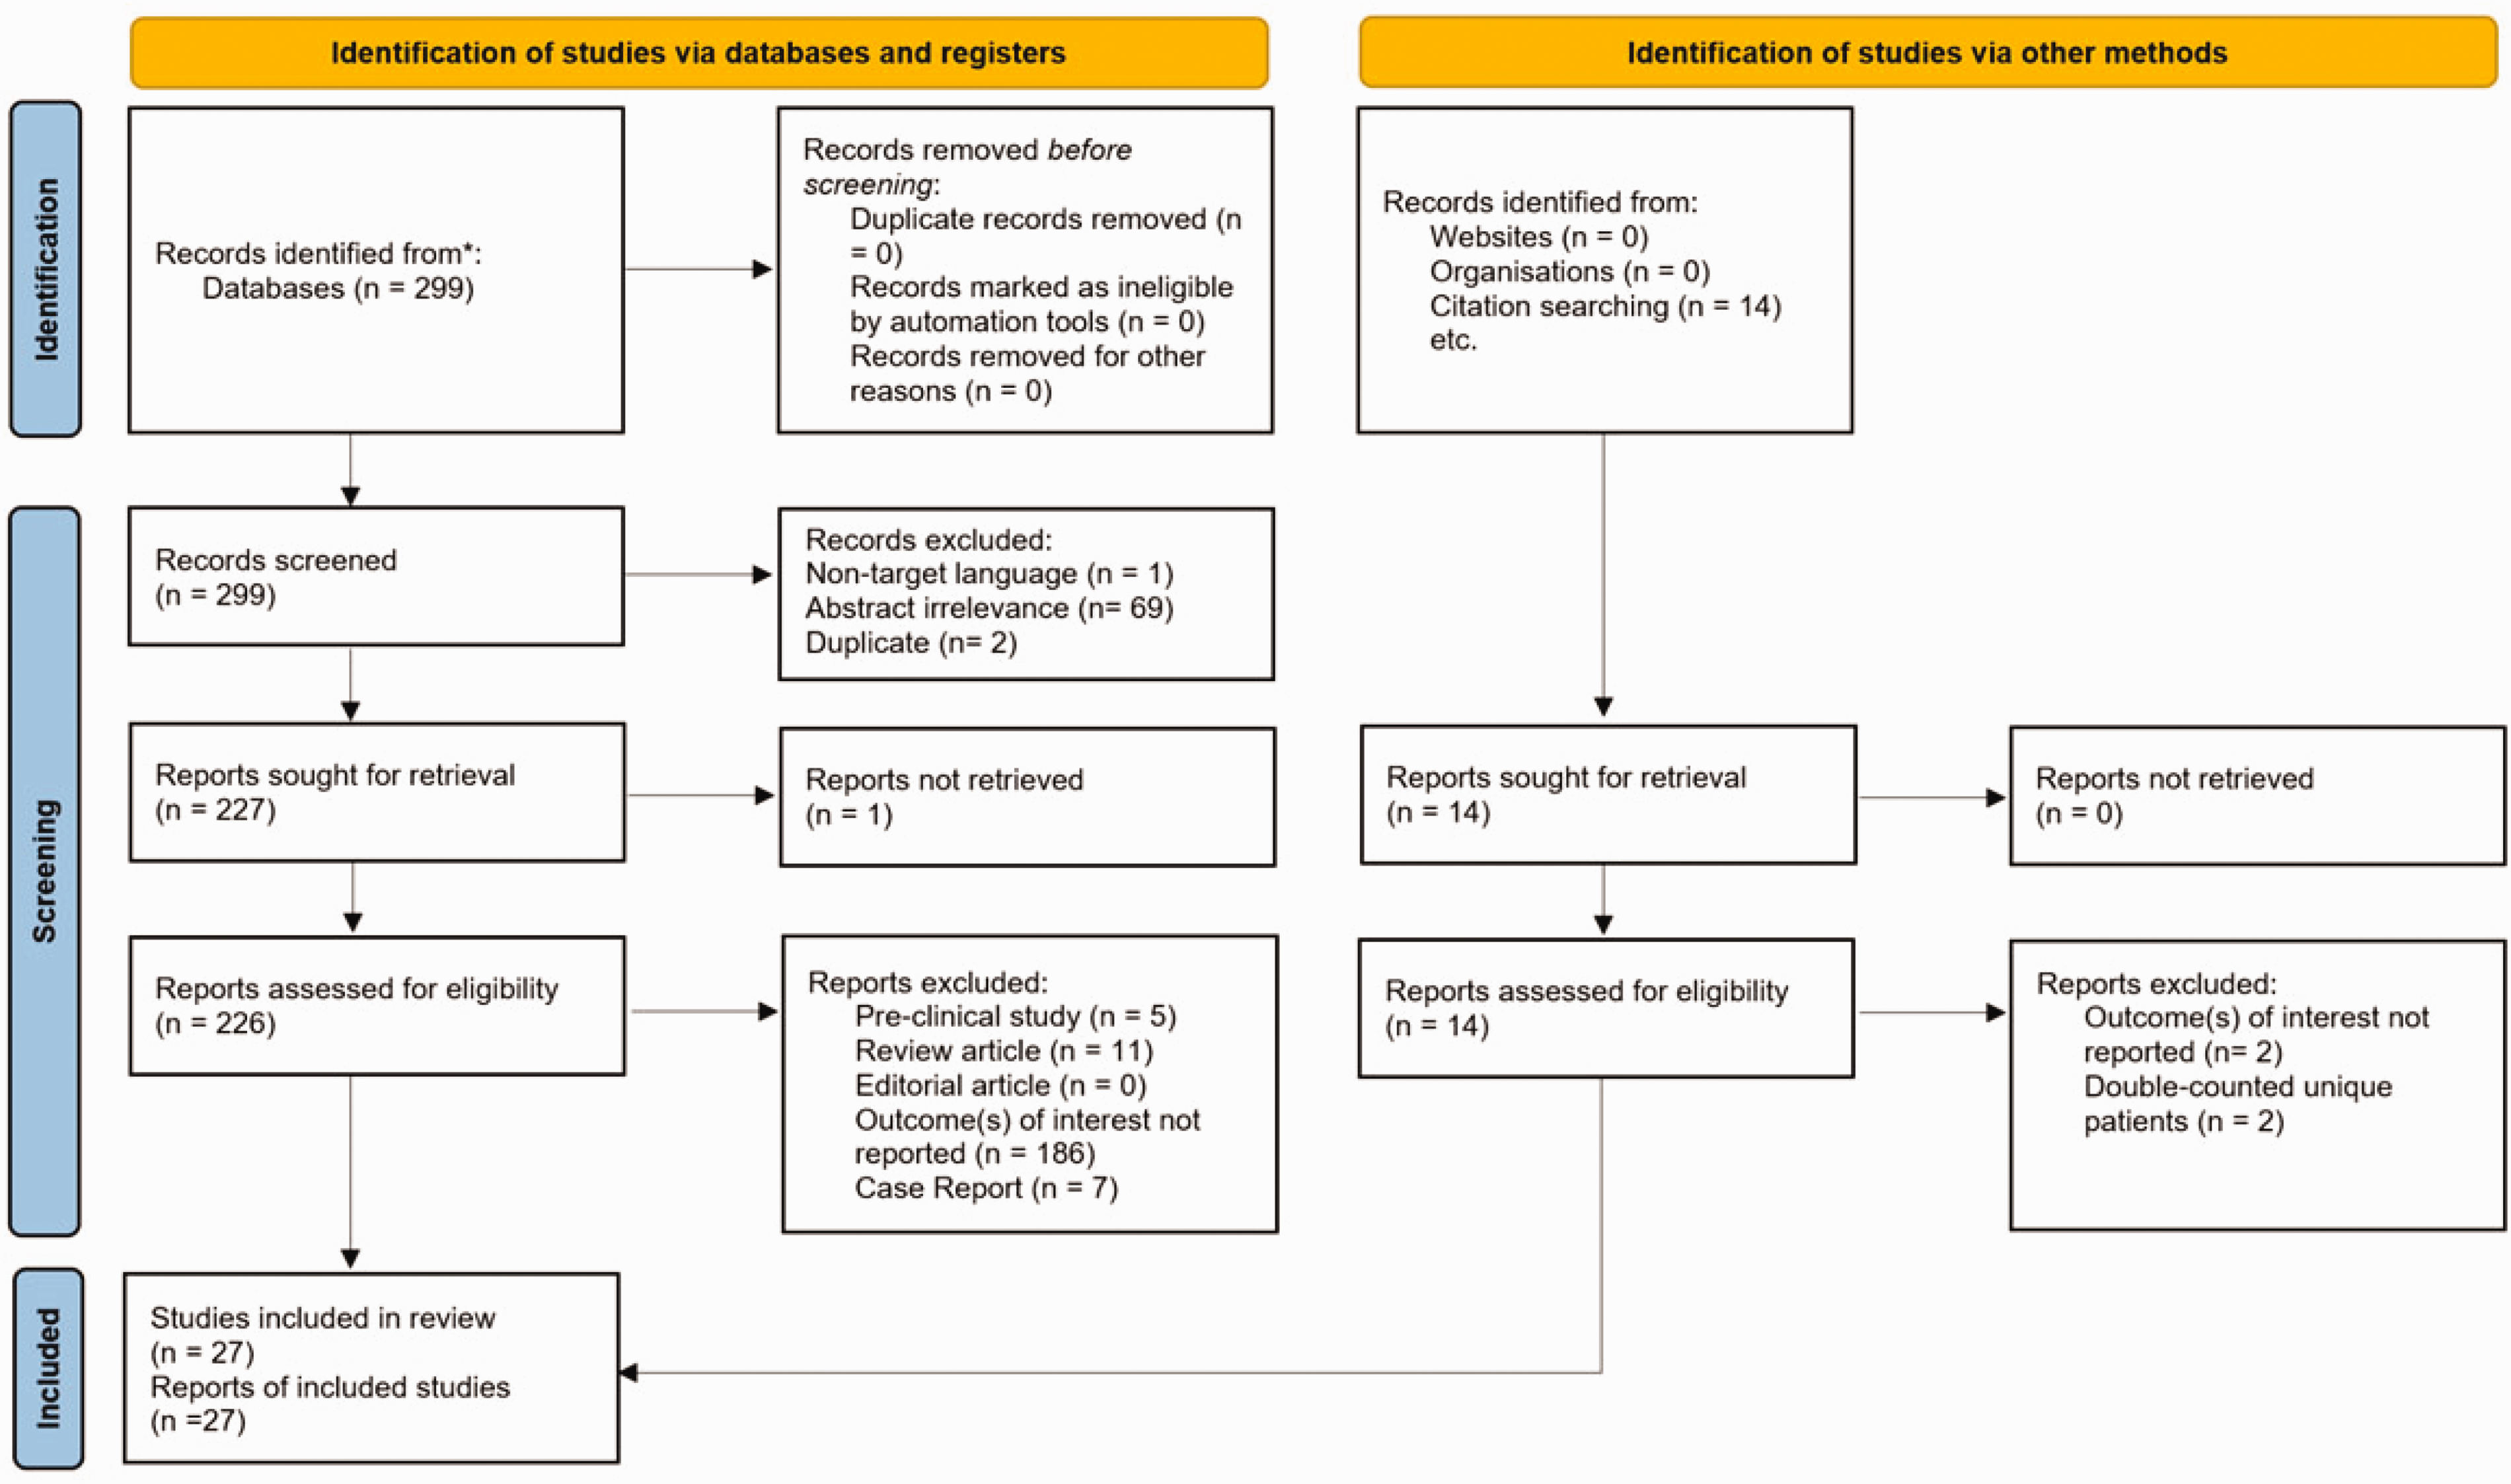
PRISMA-2020 flowchart of studies describing the identification, screening, and inclusion process.
Figure 2 identifies the risk of publication bias of randomized and non-randomized studies that were included in the systematic review. Of the 27 studies included, two were deemed to have high levels of overall bias as determined by the appropriate risk-of-bias tool. No included studies had critical levels of overall bias that precluded their downstream analysis in the systematic review and meta-analysis.
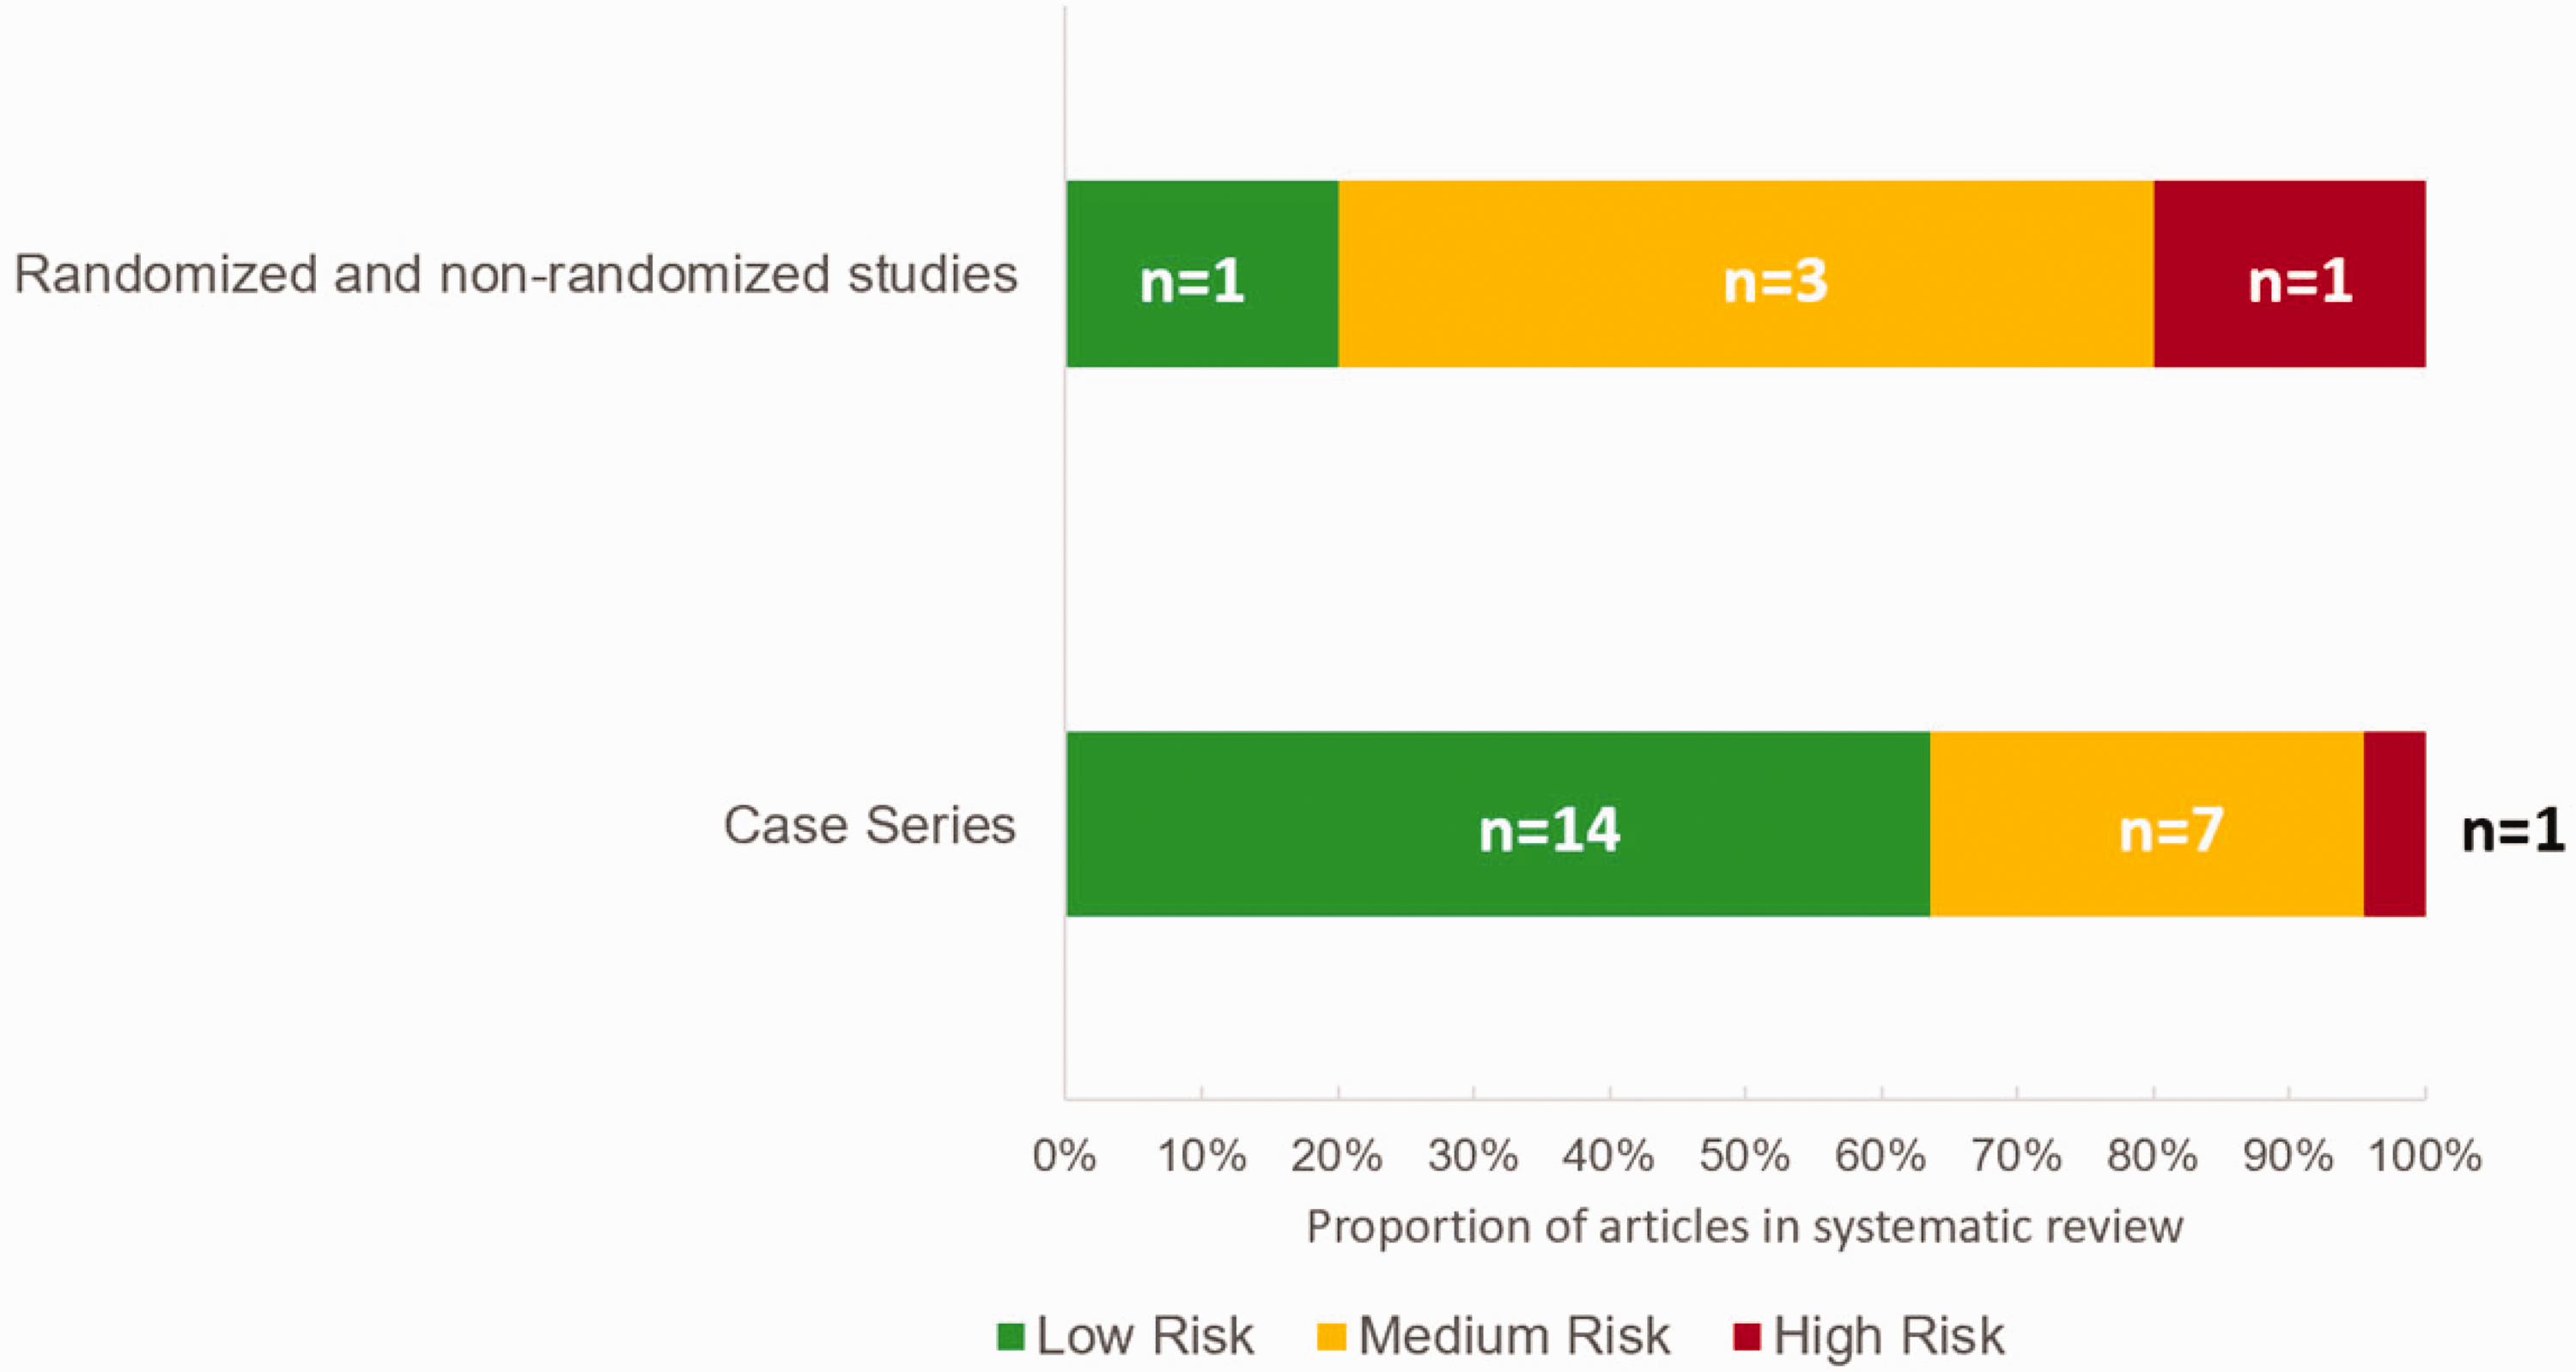
Risk of publication bias assessed with NIH Quality Assessment Tools for case series, cohort studies, meta-analyses and Cochrane ROB-2 and ROBINS-I risk-of-bias assessment tools for randomized & non-randomized studies. Proportion of n = 27 studies in systematic review with low, medium, or high risk-of-bias with size of subgroup in each risk category.
Table 2 summarizes the characteristics of each study, including study size, imaging modalities used to assess patients, and relevant timepoints of interventions.
Characteristics of included studies and recanalization and reperfusion outcomes of AIS patients undergoing revascularization treatment.
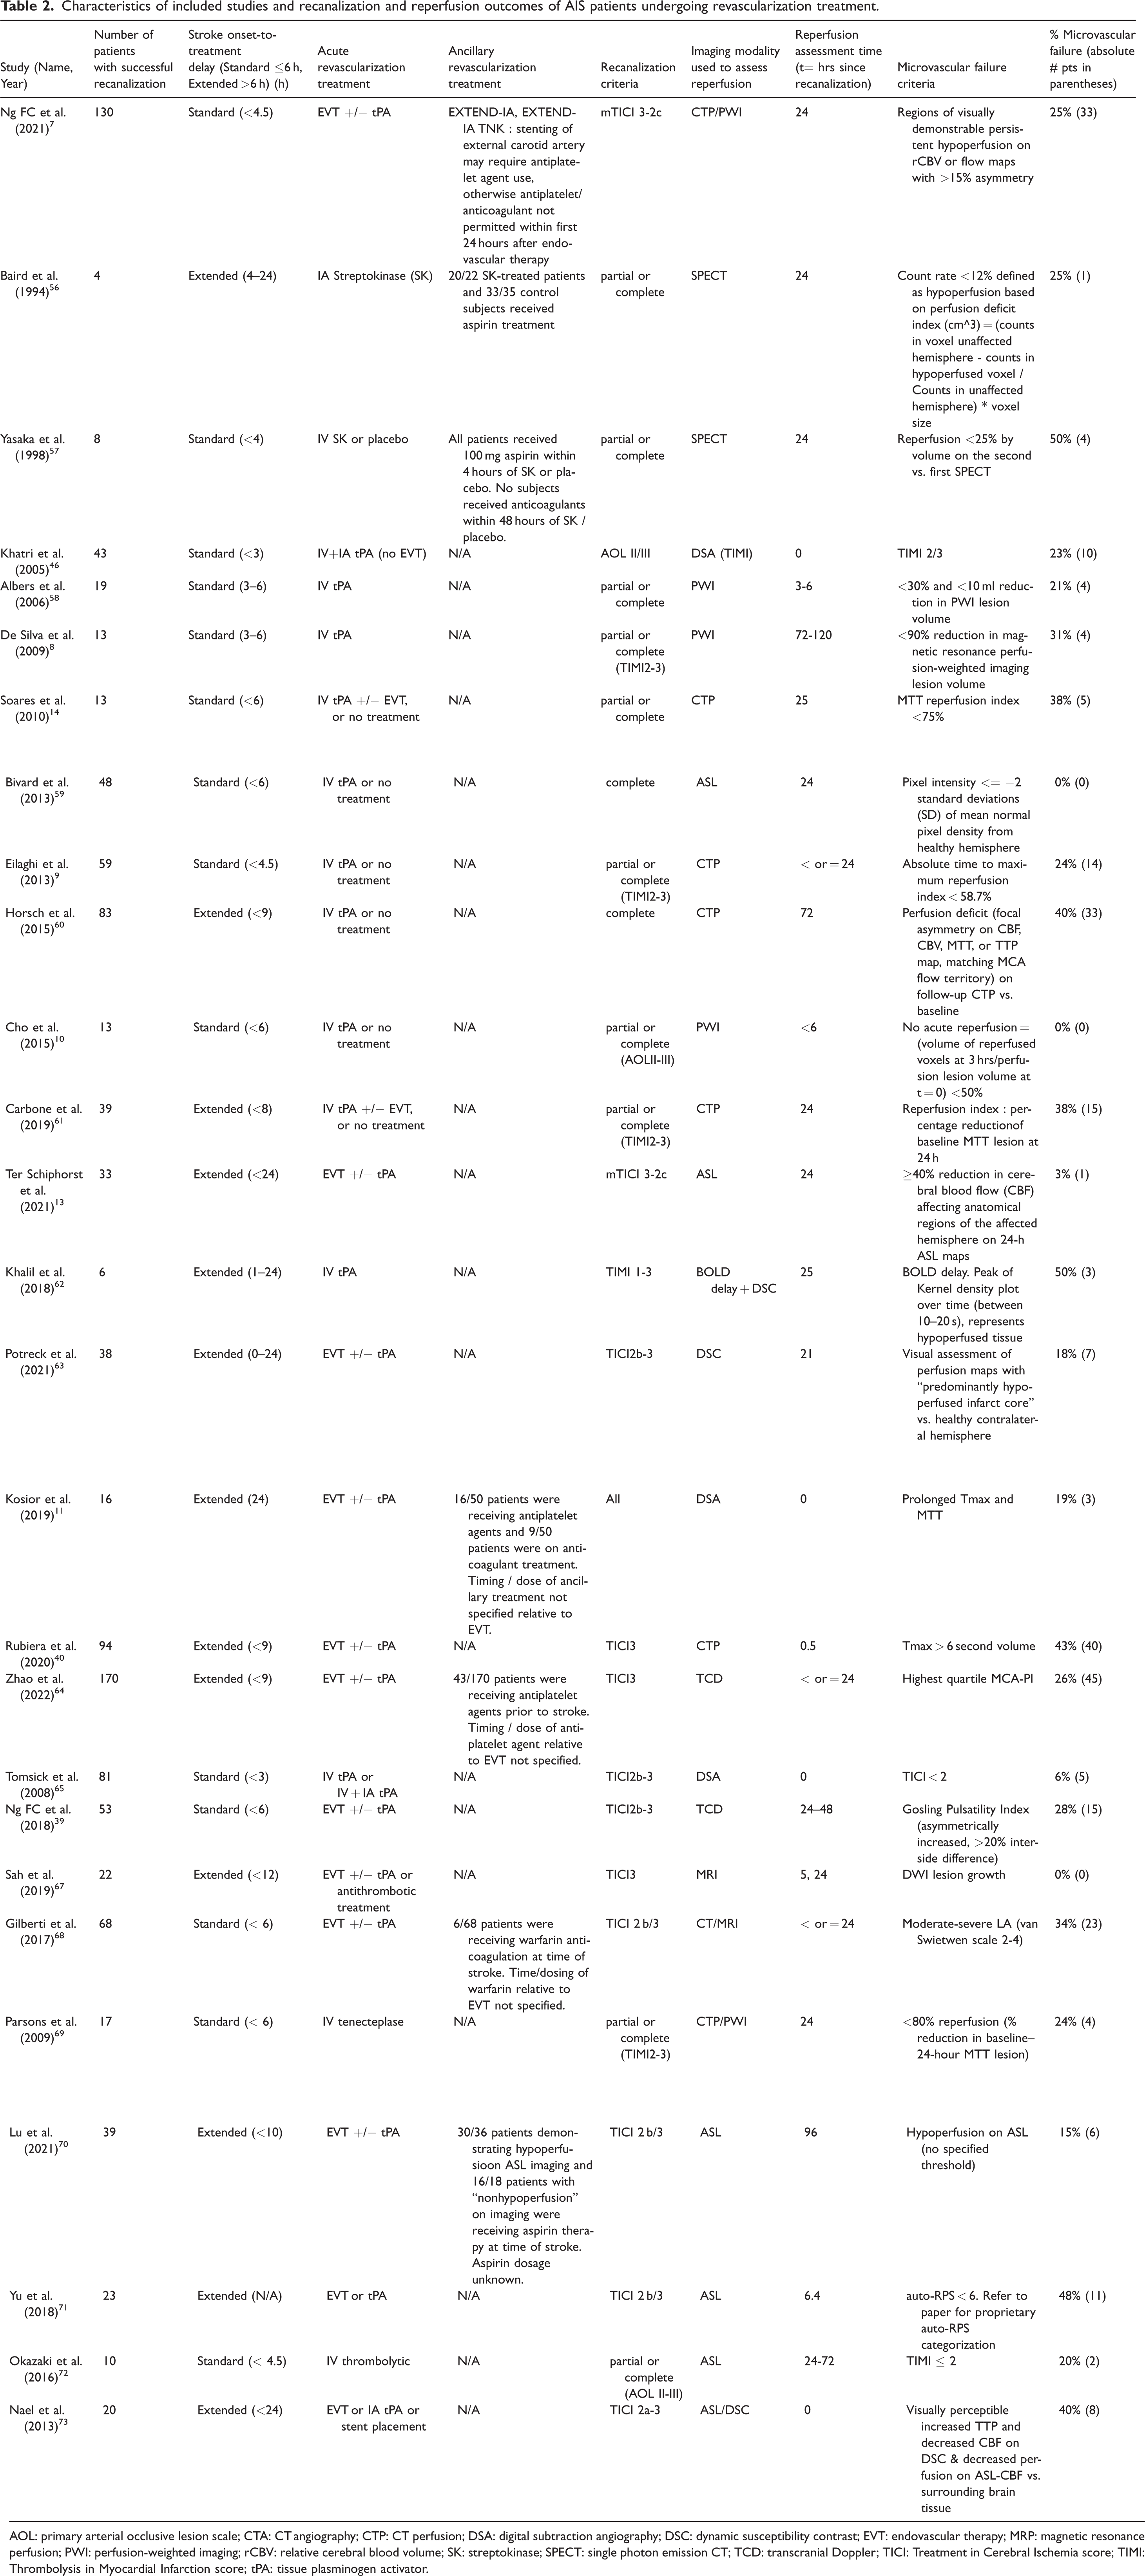
AOL: primary arterial occlusive lesion scale; CTA: CT angiography; CTP: CT perfusion; DSA: digital subtraction angiography; DSC: dynamic susceptibility contrast; EVT: endovascular therapy; MRP: magnetic resonance perfusion; PWI: perfusion-weighted imaging; rCBV: relative cerebral blood volume; SK: streptokinase; SPECT: single photon emission CT; TCD: transcranial Doppler; TICI: Treatment in Cerebral Ischemia score; TIMI: Thrombolysis in Myocardial Infarction score; tPA: tissue plasminogen activator.
Meta-analysis and regression
The results of the meta-analysis identified 1151 unique patients with available recanalization and perfusion data (Figure 3). The pooled proportion of patients that had progressive microvascular failure (patients with successful recanalization without reperfusion) was 0.22 (95% CI: 0.16-0.30, I2 = 53%, τ2 = 0.71). Bias from small-study effects was examined using Peters’ regression test (t = 0.51, p = 0.62, df = 22), indicating no significant plot asymmetry. After excluding studies with a high degree of bias (n = 2) as determined with the appropriate risk-of-bias tool, the adjusted pooled proportion of patients with progressive microvascular failure was 0.24 (95% CI: 0.18-0.31, I2 = 57%, τ2 = 0.45; Supplemental Figure 1).
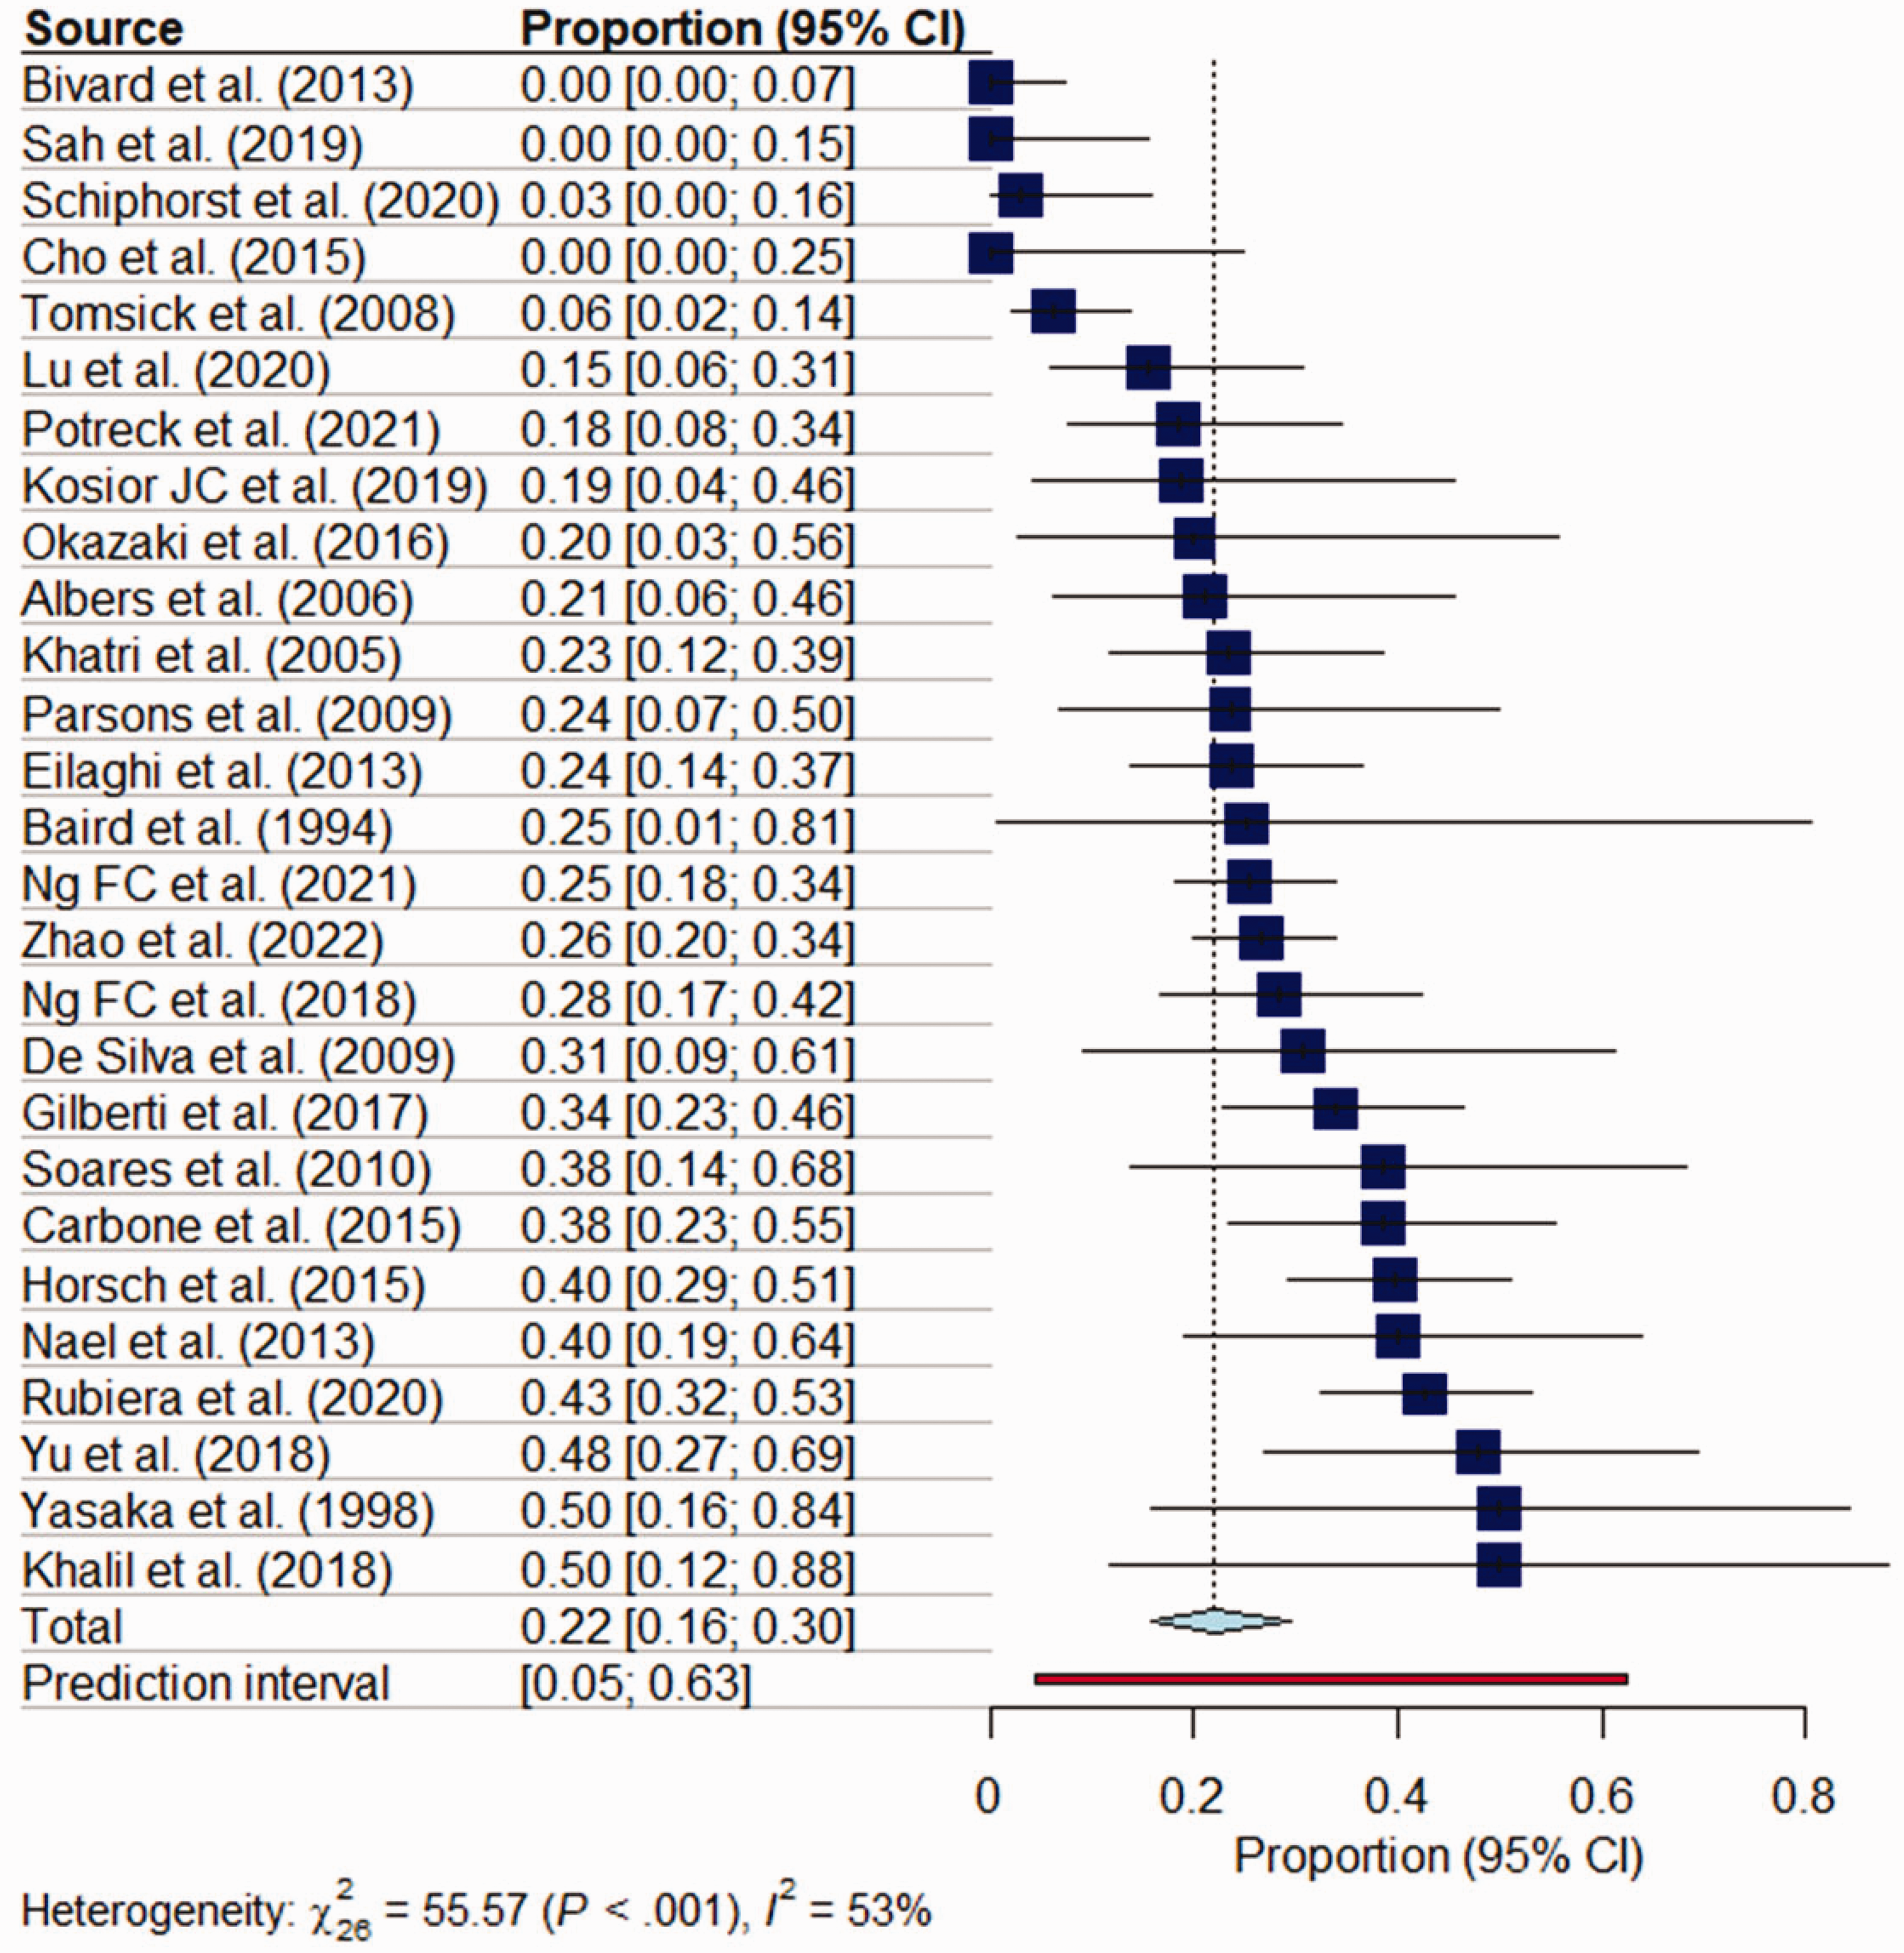
Meta-analysis of proportion of patients demonstrating inadequate reperfusion following recanalization (progressive microvascular failure phenomenon) for the treatment of AIS. Random-effects model used for pooled effect size estimation.
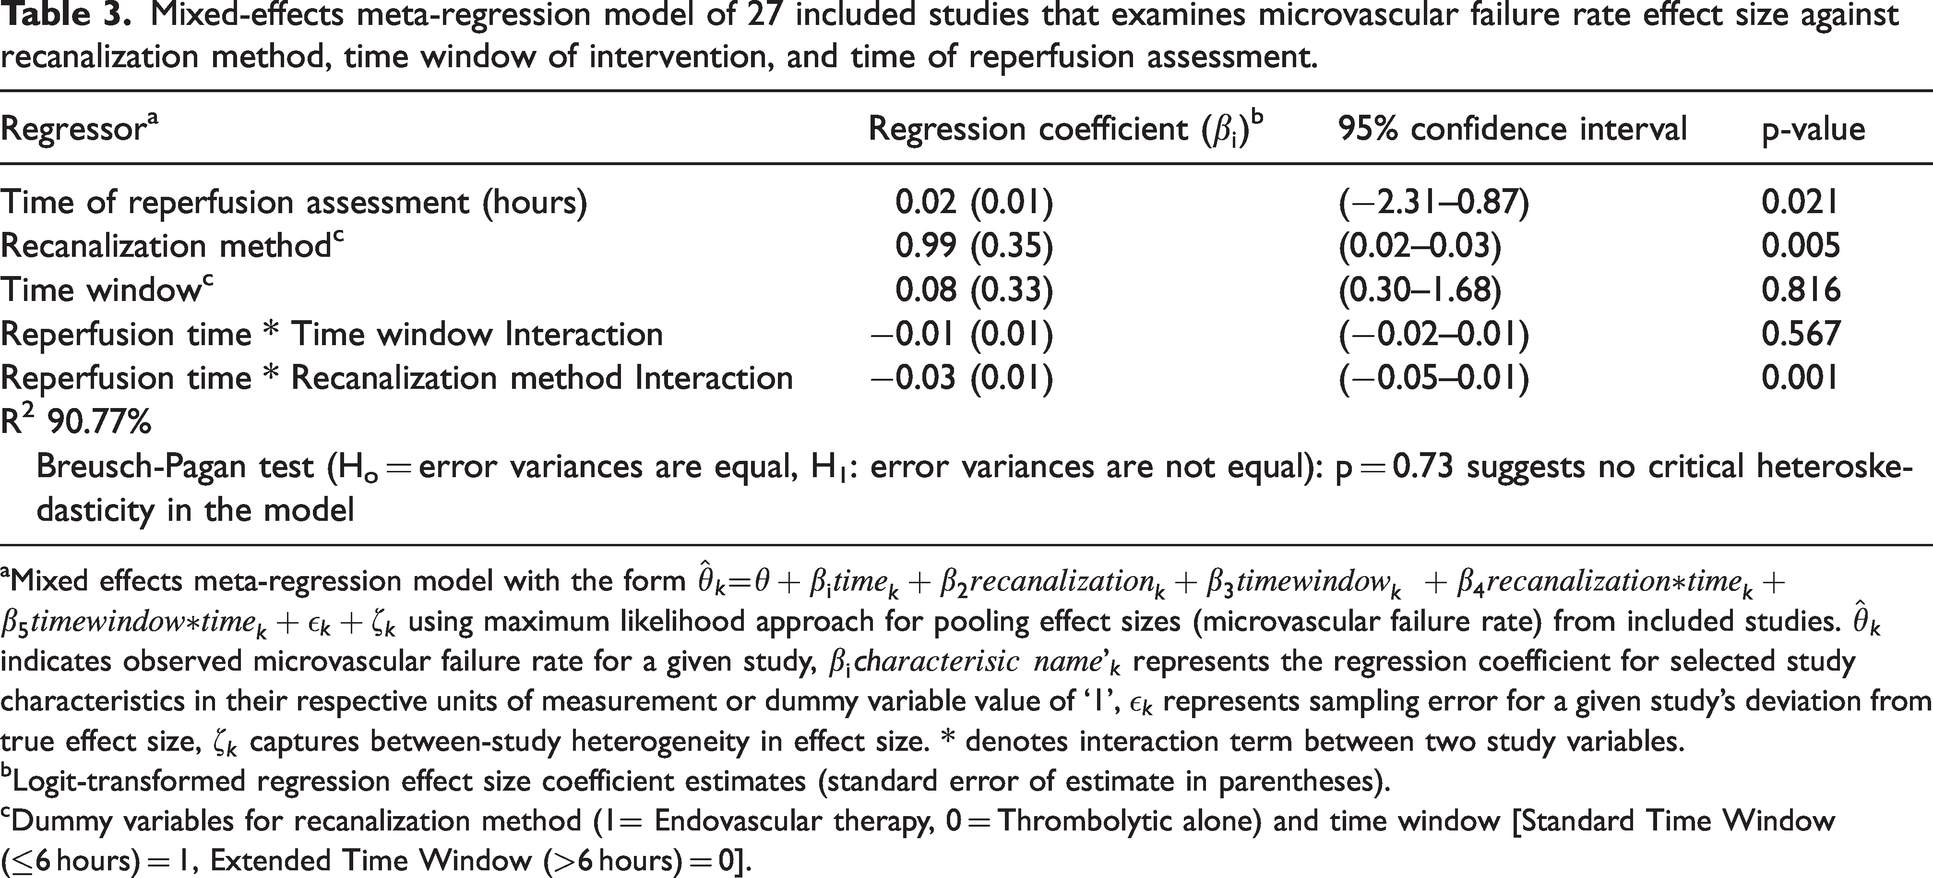
Subgroup analysis revealed that neither recanalization method used (thrombolytic-alone k = 13, EVT + thrombolytic combined treatment, k = 14; Q = 1.00, p = 0.32) nor imaging modality used to assess reperfusion (F = 1.73, p = 0.16) demonstrated significant inter-group differences in the proportion of patients demonstrating progressive microvascular failure. When stratified by standard time window (k = 14) versus extended time window (k = 13) for revascularization, subgroup analysis revealed no significant difference in the proportion of patients with microvascular failure (Q = 0.68, p = 0.41). Meta-regression of microvascular failure rate against study characteristics indicated that time in hours following recanalization (p < 0.05), recanalization method (p < 0.01) and the interactive effect between recanalization method and time following revascularization (p < 0.001) are individually significant predictors of progressive microvascular failure rate (Table 3).
Mixed-effects meta-regression model of 27 included studies that examines microvascular failure rate effect size against recanalization method, time window of intervention, and time of reperfusion assessment.
Mixed effects meta-regression model with the form
Logit-transformed regression effect size coefficient estimates (standard error of estimate in parentheses).
Dummy variables for recanalization method (1= Endovascular therapy, 0 = Thrombolytic alone) and time window [Standard Time Window (≤6 hours) = 1, Extended Time Window (>6 hours) = 0].
Microvascular failure rate analysis
A two-parameter negative exponential curve with of best fit was generated in MATLAB with the form
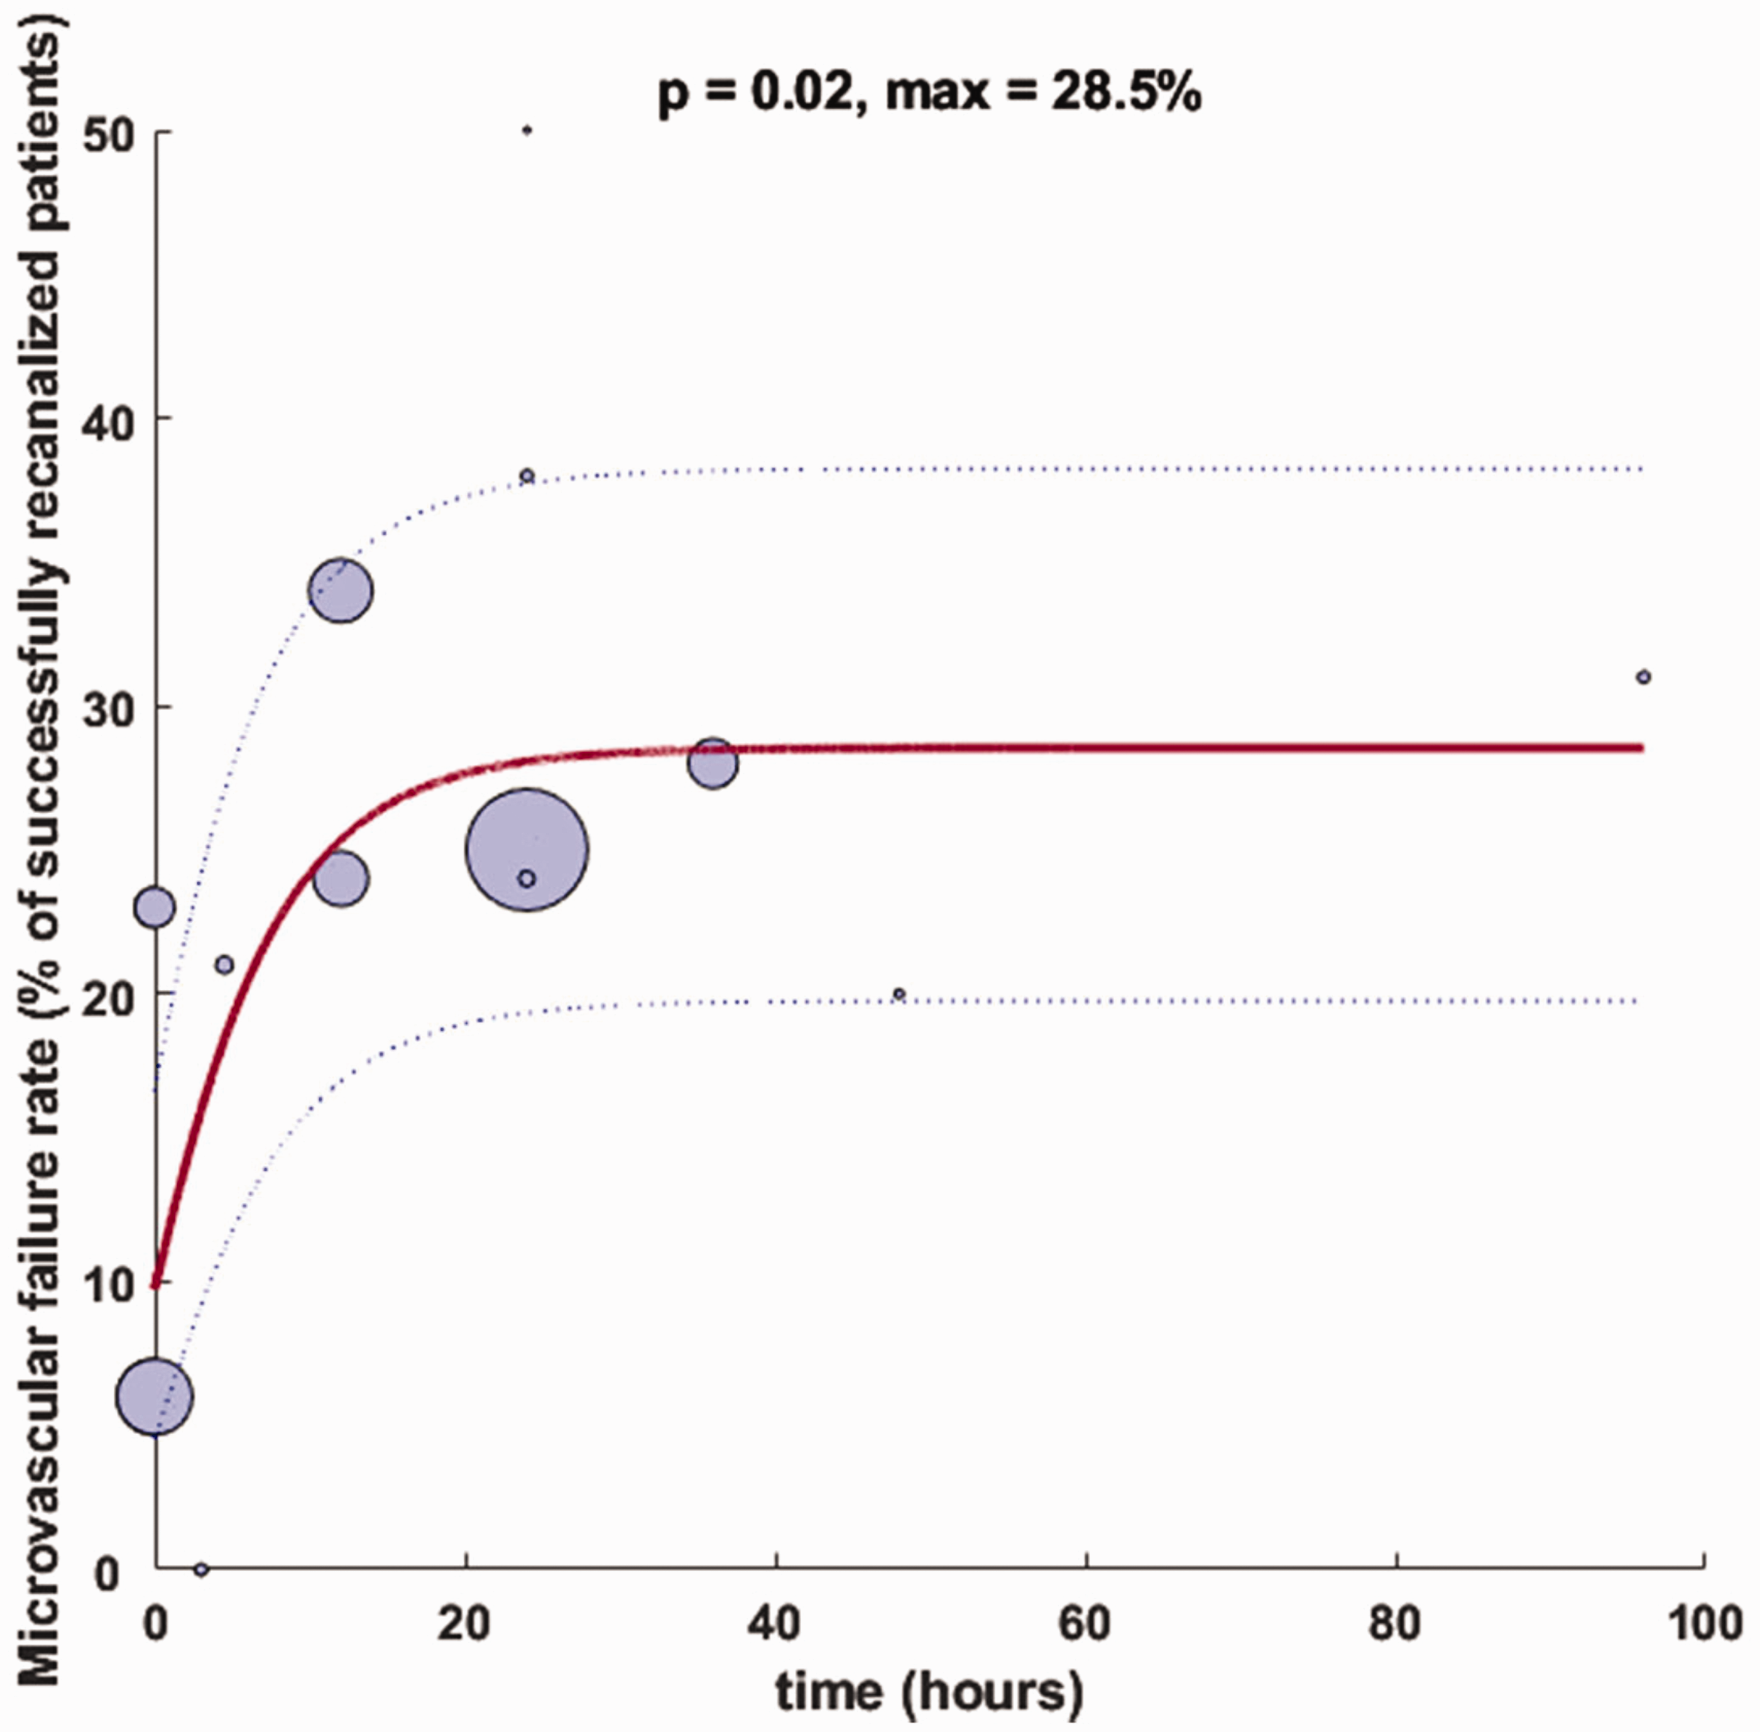
Negative exponential curve-of-best-fit for microvascular failure of standard time window studies. Bubble size represents sample size of patients with successful recanalization as defined by the authors for each respective study, with curve estimates (solid blue) weighted by study sample sizes and confidence bands (dashed blue lines) representing the 95% confidence interval. Bubble location on x-axis indicates midpoint time of reperfusion assessment.
Discussion
This systematic review and meta-analysis indicates that microvascular failure in AIS is a pathophysiologic phenomenon that is increasingly captured in clinical stroke studies, with over 70% of studies included in our analysis published within the last ten years. The reported pooled proportion of AIS patients demonstrating microvascular failure (patients with successful recanalization without reperfusion) of 22% (95% CI: 16–30%) was consistent with previous reviews of the phenomenon, with Dalkara et al. 38 noting a composite 26% (95% CI: 19–35%) event rate of recanalization without reperfusion, based on the analysis of seven studies included in our meta-analysis. In a more recent analysis of eleven studies, ter Schiphorst and colleagues 13 note a range of 0–81% for the event rate of hypoperfusion in the setting of recanalization, which is adjusted to 21– 40% after excluding studies that utilized DSA as the method of reperfusion assessment 46 and used a partial recanalized patient as an example of microvascular failure. 56 Varying exclusion criteria based on degree of recanalization (e.g. TICI 2 b-3 versus TICI 2c-3) and imaging modalities used to assess reperfusion are controversial parameters in the determination of microvascular failure.
As there are no consensus operational definitions of successful microvascular reperfusion based on a specific imaging modality 42 , we aim to present a comprehensive view of progressive microvascular failure in our current analysis that represents the breadth of imaging parameters and thresholds for effective reperfusion that is reflective of real-world AIS trial design. The existence of progressive microvascular failure itself is controversial 7 due to difficulties at evaluating recanalization and reperfusion status without invasive angiography in earlier studies. Future standardization of reperfusion cut-offs, imaging protocols, and post-processing analyses will enable robust between-study comparison of the microvascular failure phenomenon.
Two studies were determined to have a high risk of bias due to partially missing outcome data that did not affect the determination of progressive microvascular failure rate and unclear case definitions.56,59 Exclusion of these studies results in an adjusted pooled proportion of patients that was not significantly different than the unadjusted meta-analysis. The I2 range between 50–60% suggests that there is a moderate degree of study heterogeneity that is robust after exclusion of studies with a high degree of bias, and is likely associated with the variable reperfusion imaging modalities and thresholds used across studies (Supplemental Table 1). 48 Even with the exclusion of the Baird et al. 56 study, which may be associated with low precision due to the small subsample of patients with recanalization (n = 4), the degree of variability across studies not attributed to sampling error did not decrease substantially.
A singular time point of reassessment of reperfusion following recanalization, a common feature across prior studies of microvascular dysfunction in AIS, does not necessarily capture the temporal evolution of impaired flow downstream of revascularized LVO. The limitations of imaging modalities used to evaluate cerebral blood flow, including contrast toxicity and radiation concerns, have precluded the serial assessment of reperfusion following recanalization that is necessary to characterize the dynamic process of microvascular failure and elucidate its underlying mechanism.70,74,75 Multiple data collection points with non-invasive imaging techniques may enable clinicians to differentiate pathologic microvascular failure from physiologic responses of cerebrovasculature to ischemia/reperfusion injury over clinically relevant time horizons.10,76
Our negative exponential curve-of-best-fit indicates that there may be a more pronounced increase in microvascular failure rate within the first 24 hours after recanalization with a tapering off beyond that point. This time trend is pronounced and significant for studies with a standard time window of revascularization (p = 0.02; Figure 4) versus no clear or significant relationship between microvascular failure rate and time for studies with an extended intervention window (p = 0.90; Figure 5). The modeled asymptote of 28.5% for standard-time window studies is in-line with a previously reported composite rate of recanalization without reperfusion across seven studies, six of which had a standard time window of treatment initiation. 38 This maximum value estimates a steady-state microvascular failure rate across standard time window studies included in our analysis as time passes from successful recanalization.
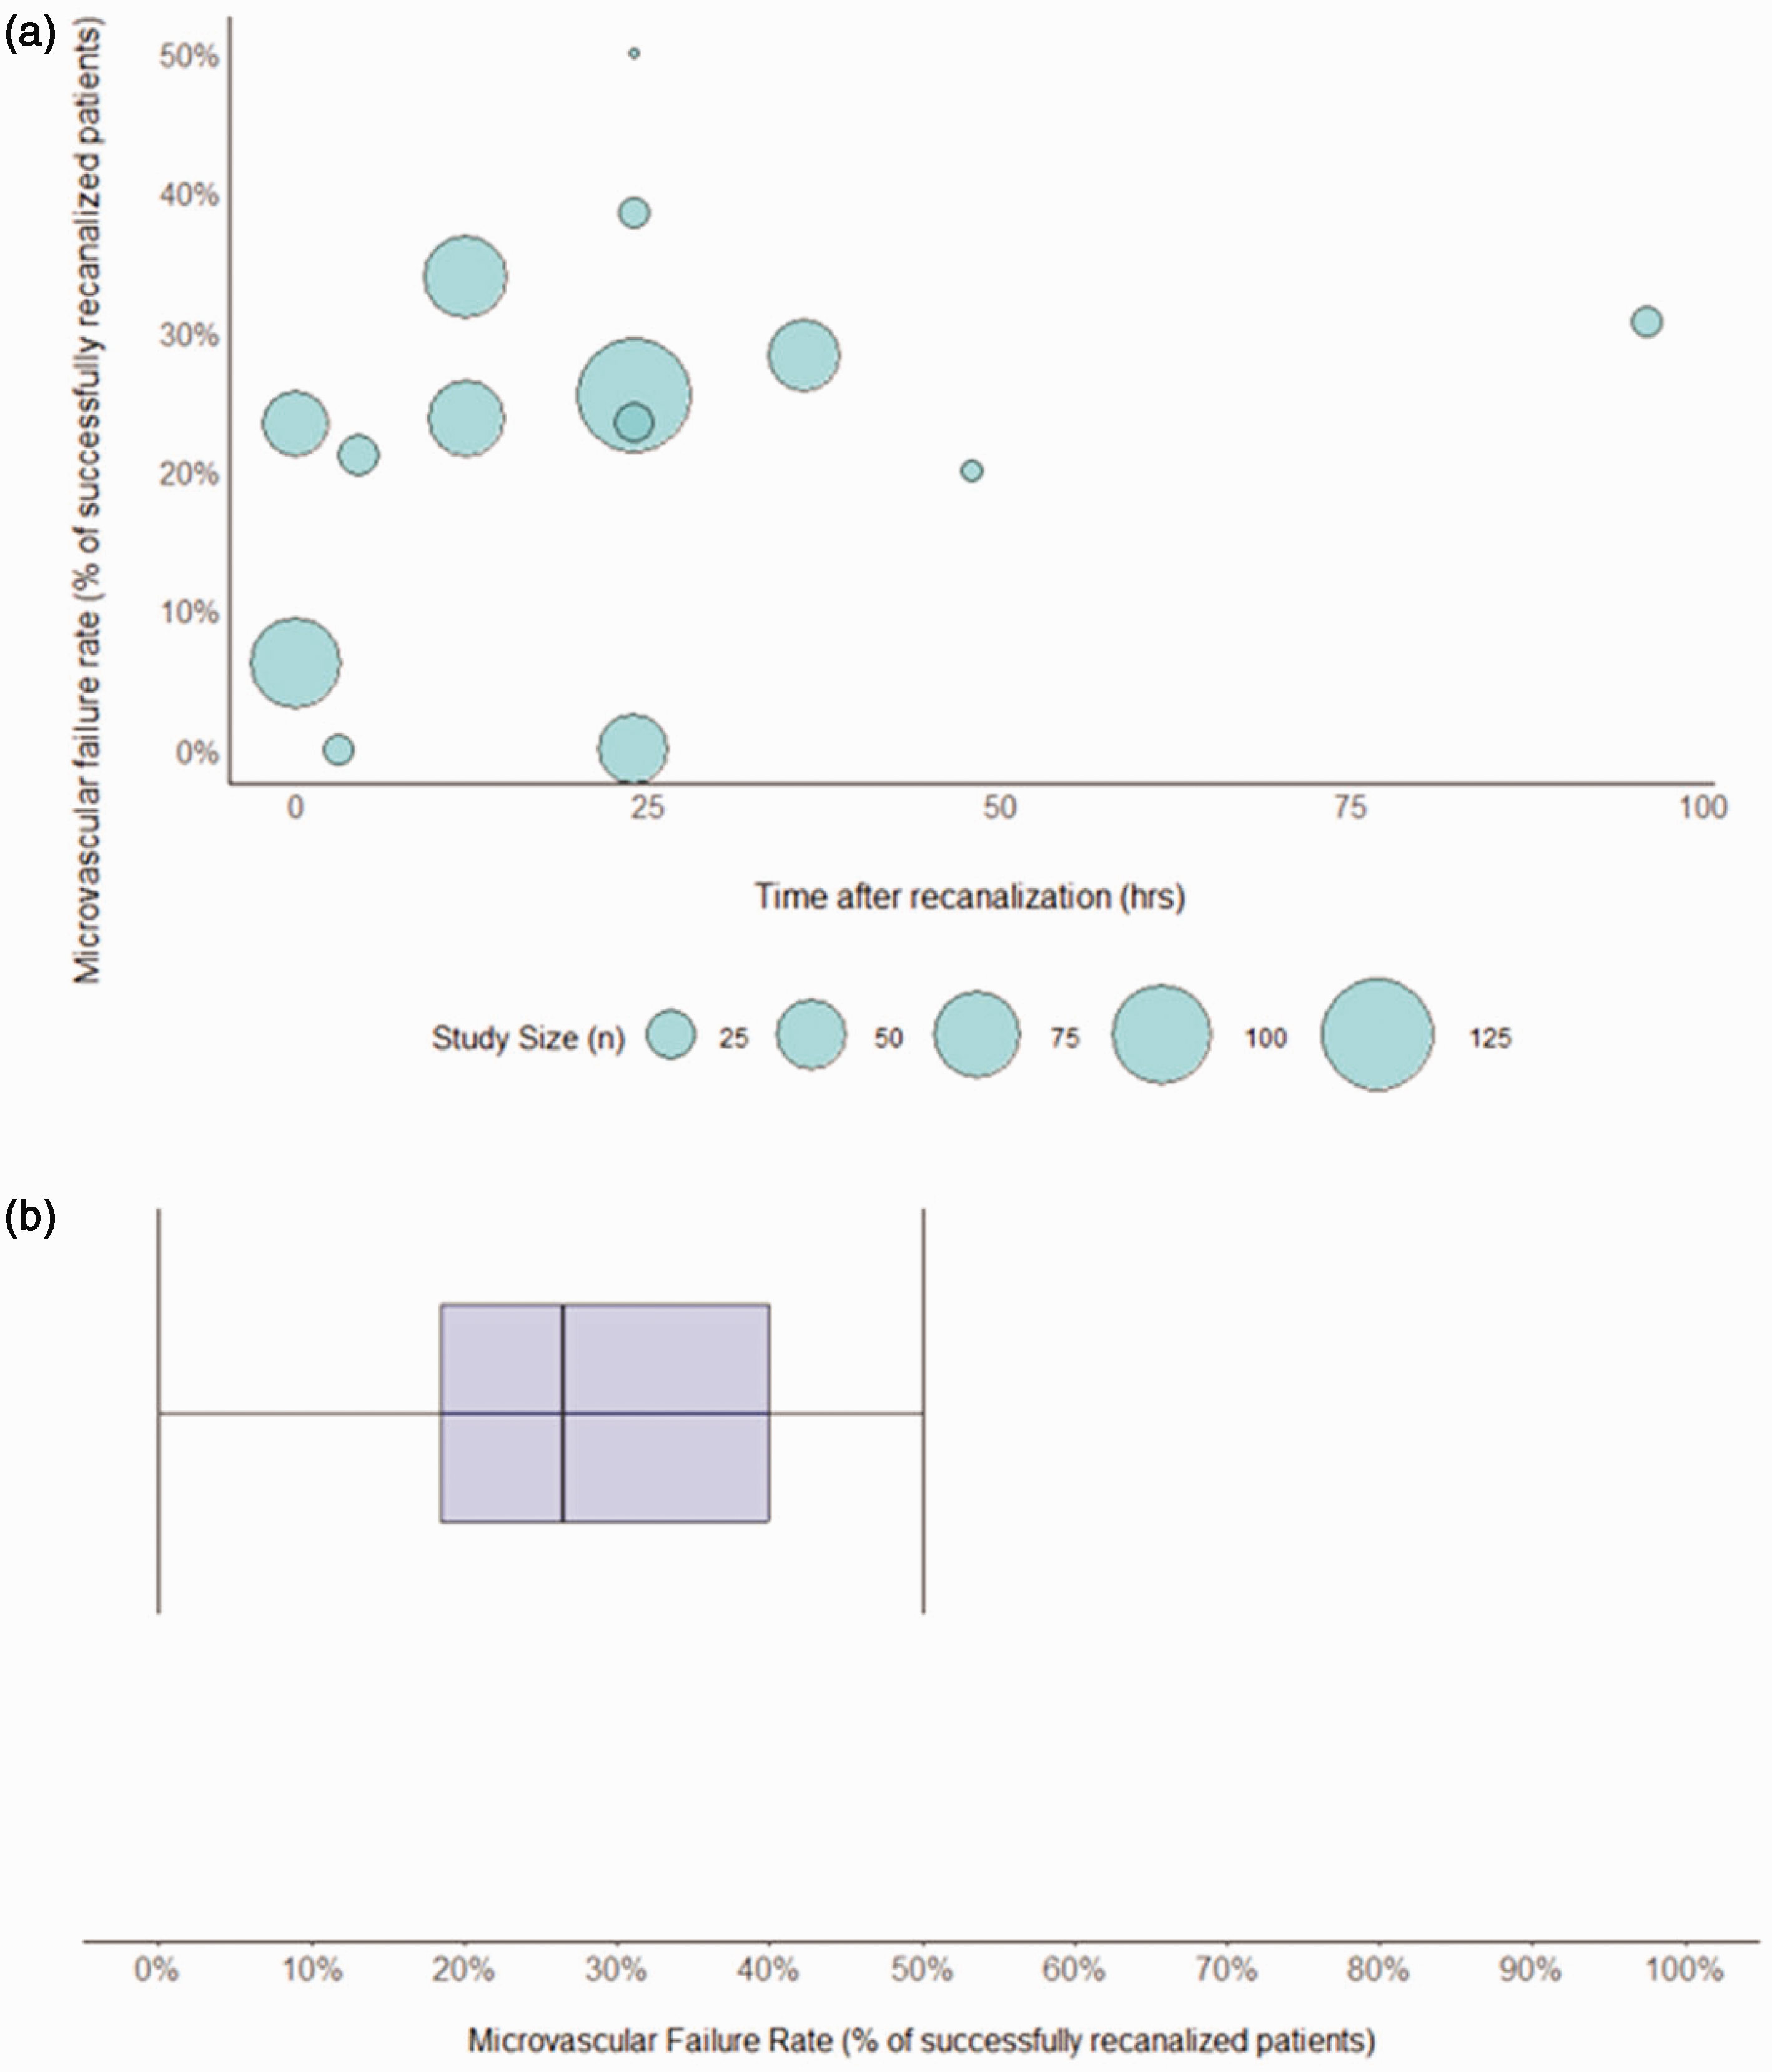
(a) Bubble plot of microvascular failure rate of extended time window studies (>6 hrs from LKN; k = 13) over time from recanalization in hours. Bubble size represents sample size of patients with successful recanalization as defined by the authors for each respective study and (b) Boxplot for extended time window studies. Box represents the median and interquartile range of microvascular failure rate for extended time window studies and whiskers indicate the 95% confidence interval.
In contrast, both linear and negative exponential models of microvascular failure rate over time for extended time window studies were not significant. Figure 5 demonstrates the substantial variation in microvascular failure rate over time in this study subgroup. Progressive microvascular failure following successful recanalization in extended time window studies may not show a significant time trend due to the underlying pathophysiology of microcirculatory dysfunction; dynamic changes in the decoupling of successful recanalization and effective reperfusion may be attributed to structural and functional changes in cerebral microvasculature that are more pronounced in patients with early intervention.8,10,41
Previous studies have suggested that recanalization and reperfusion rates decline as time from revascularization therapy passes.8,41 This proposed time course may be the result of microvascular events such as pericyte disruption, endothelial cell dysfunction, and stalled neutrophils that are most prominent in the first 24 hours after revascularization, with more static changes thereafter.33,38,42,77 Animal studies indicate that both extrinsic compressive forces from perivascular edema and endothelial cell swelling and intravascular obstruction secondary to platelet activation, leukocyte adhesion, and fibrin deposition are rapidly activated as early as one hour following LVO. 33 The rapid appearance of activated platelets and subsequent increase and persistence of leukocyte adhesion factors including P-selectin, E-selectin, and intercellular adhesion moelcule-1 (ICAM-1) on activated endothelium at 24 hours following vessel occlusion78,79 may form the pathophysiologic basis of increasing progressive microvascular failure over this time period.
These interrelated sequelae likely contribute to the cortical spreading depression, vasoconstrictive effect associated with elevated extracellular K+, and cycles of hypoperfusion and hyperemia that result in secondary tissue injury following revascularization.76,80 Likewise, the delayed appearance of pro-angiogenic factors after 24 hours, such as the biphasic elevation of ang-2 transcripts at 24 hours and 14 days following focal ischemic and increase in tie-2 mRNA transcripts beginning at 24 hours in a rat model81,82, may counteract the aberrant microcirculatory response following recanalization, and form the basis of the “tapering-off” effect in microvascular failure observed beyond 24 hours. However, these phenomena have yet to be clarified in human AIS patients.
Meta-regression of included studies using a robust mixed-effects model demonstrates that recanalization method and its interaction with time of reperfusion assessment are significant estimators of microvascular failure rate and may be critical factors that should be considered in quantitative analyses that examine microvascular failure in the extended time window. The lack of significant fit of our curve-fitting analysis for extended interventions compared to standard time window studies supports the preliminary evidence that time of intervention following stroke onset may influence post-revascularization outcomes.10,83 Future studies that specifically examine patients with an extended time window of intervention (treatment initiation 6–24 hours from LKN) will clarify if stroke treatment time window mediates differential rates of microvascular failure over time.
The analysis of progressive microvascular failure over time is inherently limited by the singular time point of reperfusion assessment for the majority of studies. An analysis of microvascular failure rate over time across studies is affected by variability in study methodology, reperfusion imaging modality, and operational definitions of successful reperfusion (Table 2) that may limit generalizability of an implied time trend.
Differentiation of progressive microvascular failure versus progressive microvascular ischemia is also limited by technical consideration; it can be difficult to evaluate the microvasculature at the desired temporal and spatial resolution with current imaging modalities and metabolic analysis techniques. 38 Given the meta-analysis study methodology involves summary data from each study using respective thresholds for reperfusion that vary by imaging modality and associated post-processing software, interpolating common attributes among microvascular failure events may result in ecological fallacy. Patient-level factors including age, sex, and NIHSS at time of presentation were not uniformly reported across included studies. These relevant parameters were omitted as potential covariates in meta-analysis and meta-regression due to the cumulative effect of reporting bias that may impact downstream analysis following data aggregation. However, the findings of our meta-analysis are limited due to the inherent omitted-variable bias and associated confounding that may be attributed to the inconsistent reporting of these parameters and affect the progression of microvascular failure.
Variability in imaging modality itself, in addition to reperfusion assessment time point, may contribute to the observed variability in microvascular failure rate in AIS patients. CT perfusion (CTP) is one of the most common imaging modalities used to assess reperfusion status in AIS patients given cost considerations and limitations of MR-based approaches in emergent settings and resource-limited settings. 84 Our systematic review includes five studies in which CTP is the primary assessment tool of reperfusion and two studies in which it is combined with perfusion-weighted imaging (PWI). Magnetic resonance-based PWI studies offer a radiation free alternative to CT-based approaches, which may be contraindicated in certain clinical scenarios due to contrast and radiation toxicity and a lengthy washout period that precludes serial imaging. 85
Arterial spin labeling (ASL) is a quantitative, non-invasive functional MRI (fMRI) technique using voxel-wise comparison that does not require gadolinium contrast enhancement, unlike PWI, which may be preferential in patients with severe renal impairment or those with repetitive prior perfusion imaging.70,74,75 Compared to PWI, hyperperfusion on ASL has demonstrated better information about penumbral salvage and was a better predictor of early clinical outcome, 59 indicating that it may be an effective marker of tissue reperfusion with positive early clinical correlation for acute ischemic stroke patients. While CTP and PWI have been the most common imaging techniques used in prior investigations of microvascular failure, between-study heterogeneity is likely to increase in future meta-analyses of this phenomenon as novel modalities such as ASL and BOLD-delay are used to circumvent gadolinium contrast toxicity and radiation concerns associated with serial imaging.
Conclusion
In terms of future considerations of microvascular failure in clinical care and therapeutic development, our analysis suggests that the biomarkers, imaging studies, and clinical evaluations needed to evaluate the phenomenon are increasingly included in the study of post-recanalization AIS patients. However, the literature is inconsistent in the reporting of the component measures and imaging outcomes that are necessary to determine microvascular dysfunction. In total, 186 studies were excluded from the analysis as the component variables needed to calculate microvascular failure rate in the study were not present. Most of these studies included the measurement of both recanalization and reperfusion using validated methodologies in their trial design, but did not explicitly report the subset of patients with partial or successful recanalization without perfusion on post-treatment imaging.
While advanced perfusion imaging has been leveraged extensively in the pre-recanalization setting to optimize revascularization strategy for a given patient, it has been used sparingly following treatment to identify reperfusion dynamics in post-revascularized brain tissue. Serial imaging throughout the pre- and post-recanalization phases may provide prognostic information regarding microvascular failure dynamics that may guide the ongoing development of experimental therapeutics, including complement inhibition86,87 and targeted cerebral edema therapies 88 , that may target the neuroinflammatory basis of progressive microcirculatory dysfunction and potentially minimize secondary injury.
Supplemental Material
sj-pdf-1-jcb-10.1177_0271678X231216766 - Supplemental material for Progressive microvascular failure in acute ischemic stroke: A systematic review, meta-analysis, and time-course analysis
Supplemental material, sj-pdf-1-jcb-10.1177_0271678X231216766 for Progressive microvascular failure in acute ischemic stroke: A systematic review, meta-analysis, and time-course analysis by Thilan Tudor, Eleonora F Spinazzi, Julia E Alexander, Grace K Mandigo, Sean D Lavine, Jack Grinband and E Sander Connolly Jr in Journal of Cerebral Blood Flow & Metabolism
Footnotes
Funding
The author(s) received no financial support for the research, authorship, and/or publication of this article.
Declaration of conflicting interests
The author(s) declared no potential conflicts of interest with respect to the research, authorship, and/or publication of this article.
Supplementary material
Supplemental material for this article is available online.
References
Supplementary Material
Please find the following supplemental material available below.
For Open Access articles published under a Creative Commons License, all supplemental material carries the same license as the article it is associated with.
For non-Open Access articles published, all supplemental material carries a non-exclusive license, and permission requests for re-use of supplemental material or any part of supplemental material shall be sent directly to the copyright owner as specified in the copyright notice associated with the article.