
Abstract
Transfer function analysis (TFA) of dynamic cerebral autoregulation (dCA) is based on linear system theory to examine the relationship between changes in blood pressure and cerebral blood flow. With TFA, dCA is characterized as a frequency-dependent phenomenon quantified by gain, phase, and coherence in the distinctive frequency bands. These frequency bands likely reflect the underlying regulatory mechanisms of the cerebral vasculature. In addition, obtaining TFA metrics over a specific frequency band facilitates reliable spectral estimation and statistical data analysis to reduce random noise. This commentary discusses the benefits and cautions of banding TFA parameters in dCA studies.
Keywords
Dynamic cerebral autoregulation (dCA) protects the brain during transient changes in arterial blood pressure (BP). Among several methods available for assessing dCA, transfer function analysis (TFA) of beat-by-beat changes in mean BP and cerebral blood flow (CBF) or cerebral blood velocity (CBV) measured by transcranial Doppler is widely used in clinical and physiological cerebrovascular research. With TFA, dCA is characterized with three metrics: gain, phase, and coherence function (Figure 1). Gain represents a magnitude relation between changes in BP (input) and CBF (output) while phase reflects a temporal lead or lag between them in the frequency domain. Coherence function is used to reveal to what extent changes in CBF are linearly correlated to changes in BP with values ranging from 0 to 1, with 1 suggesting a perfect linear correlation analogous to a coefficient of determination (R2), and <1 suggesting the presence of measurement noise, system nonlinearity, or other inputs to the system. 1 TFA of dCA exhibits high-pass filter characteristics which suggest dCA is less effective in damping transmission of faster change in BP to CBF.
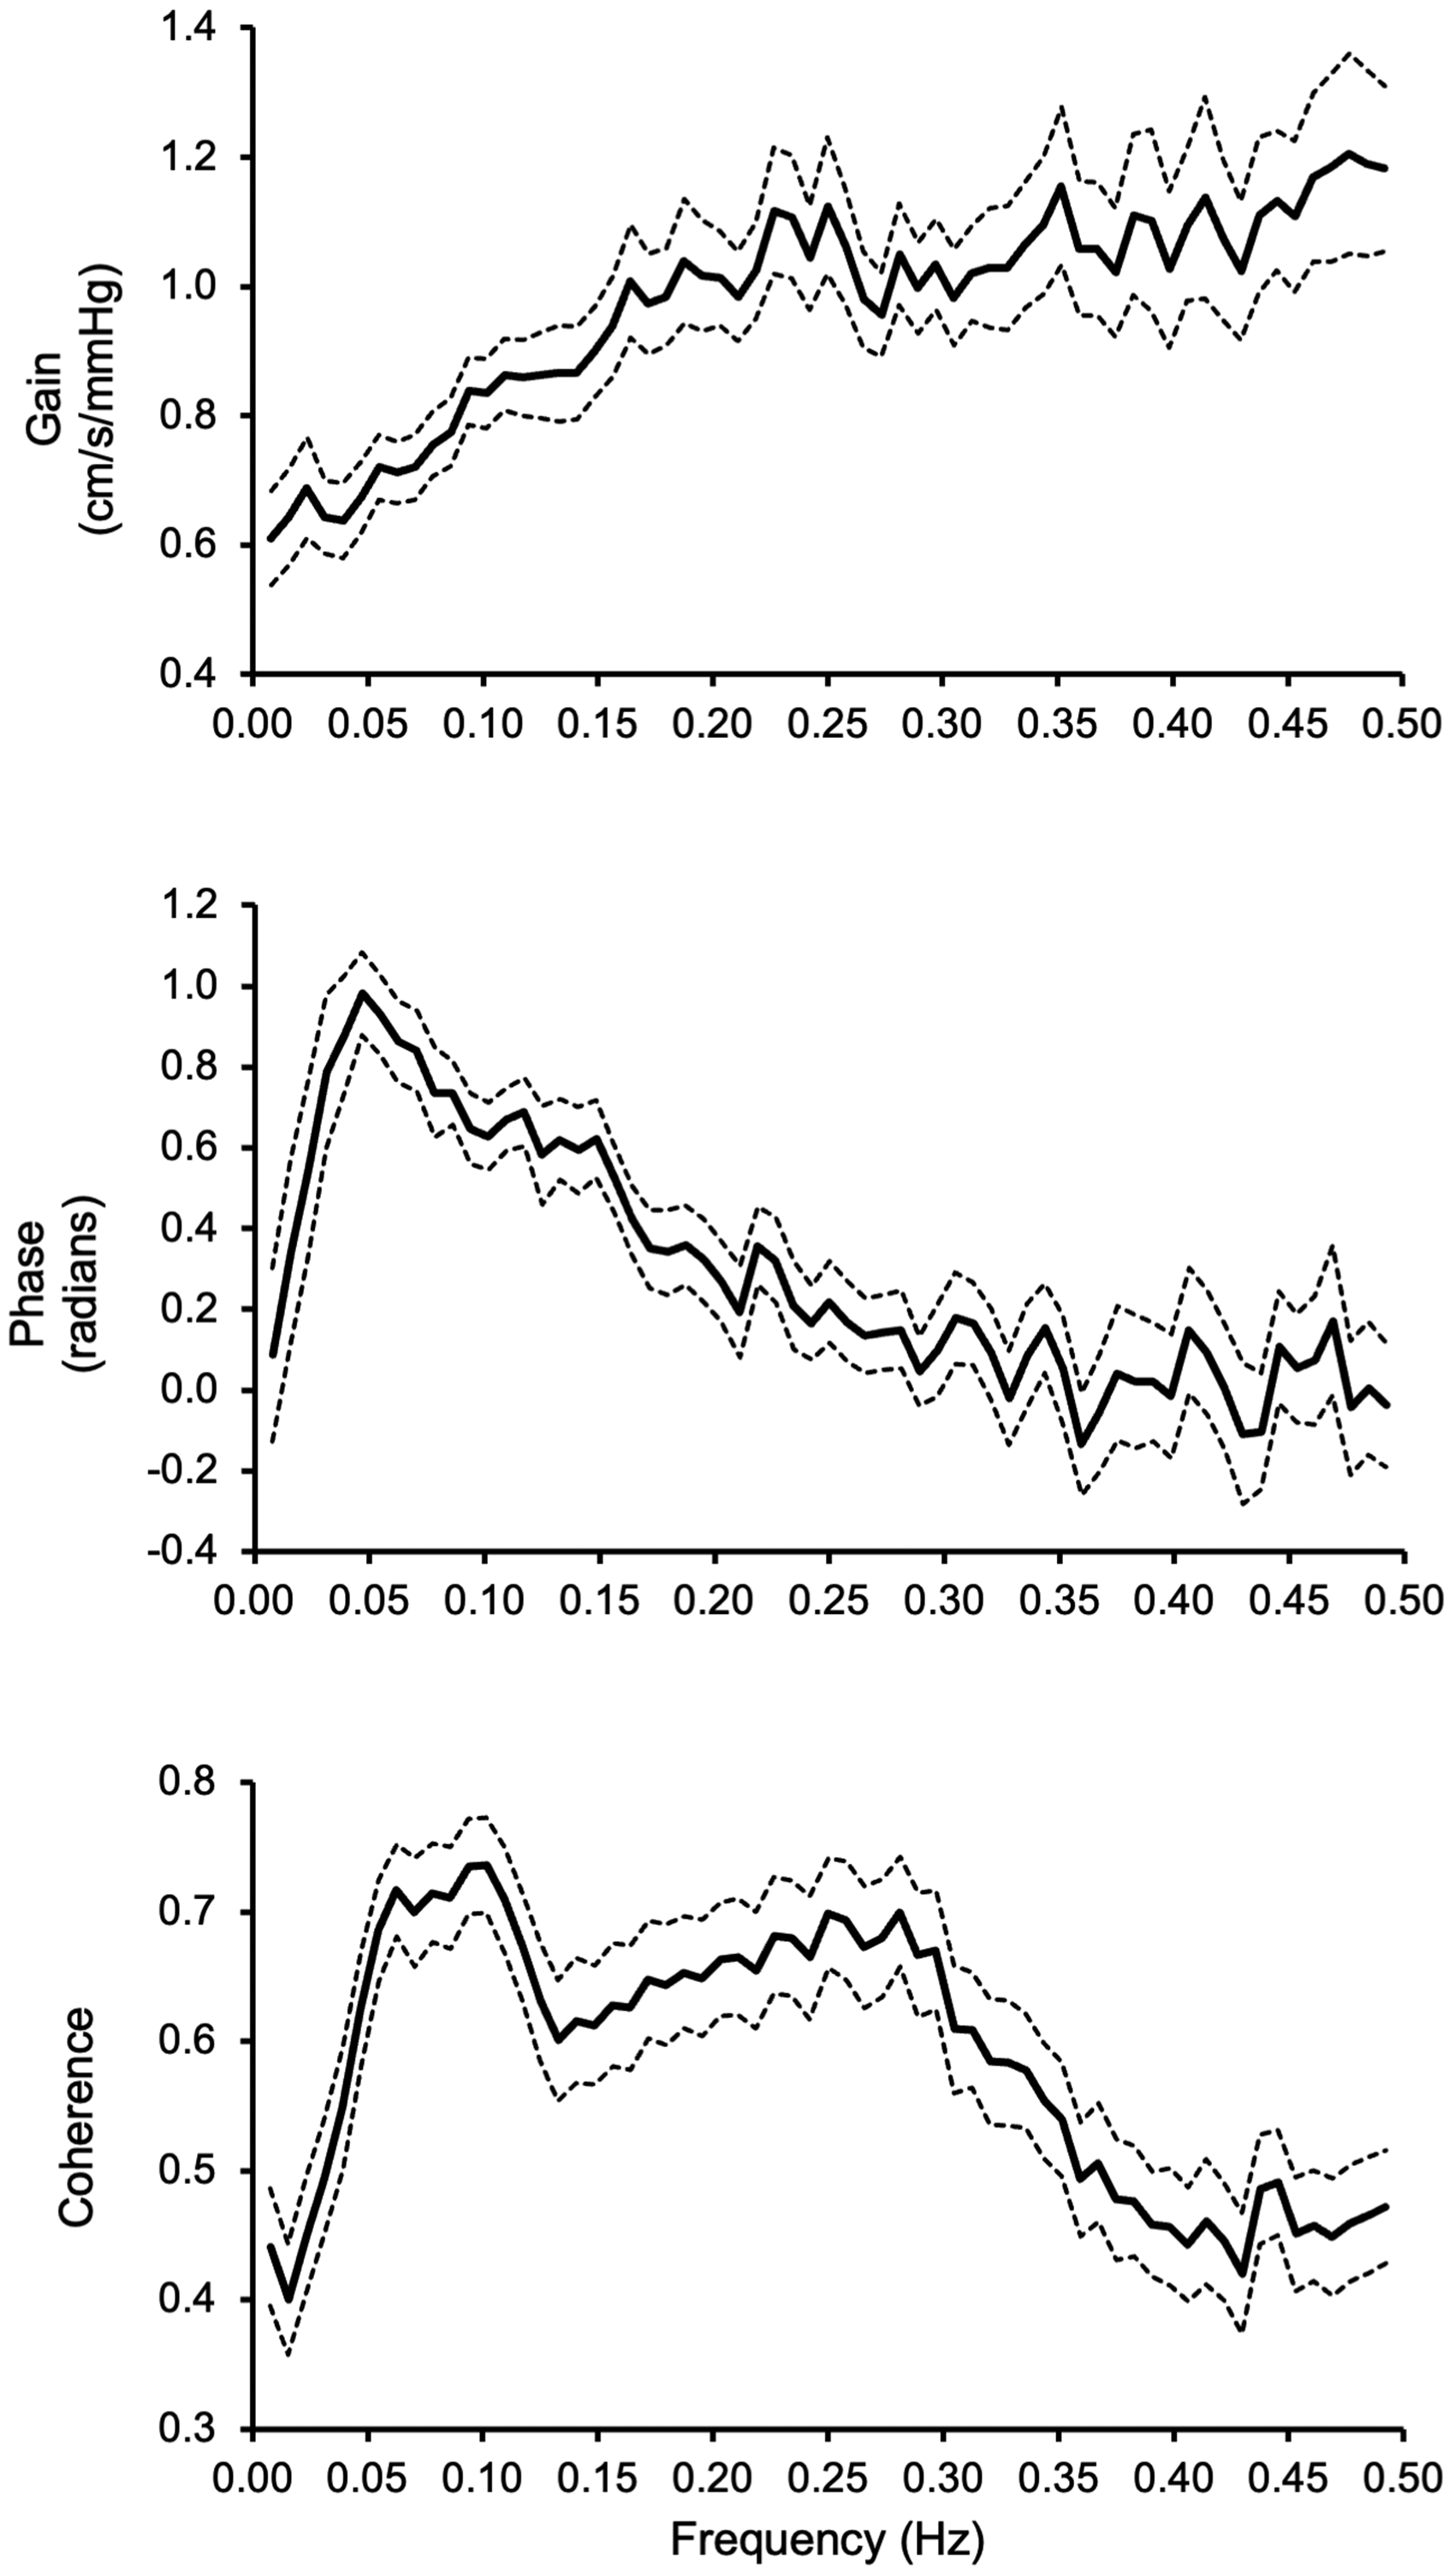
Transfer function gain (top), phase (middle), and coherence (bottom) calculated from beat-by-beat changes in finger mean blood pressure and cerebral blood velocity in the middle cerebral artery recorded by transcranial Doppler. Data were collected from 136 participants aged 21–80 years (81 women) during a 5-minute spontaneous rest, as reported in our previous study. 8 Solid lines represent group-averaged mean values; dashed lines represent lower and upper bound 95% confidence intervals.
In an early study in healthy young adults, we proposed that the frequency distribution of dCA could be divided into the very low (0.02–0.07 Hz), low (0.07–0.20 Hz), and high (0.20–0.50 Hz) frequency bands based on the spectral characteristics of gain, phase, and coherence function. 1 Furthermore, we speculated that these frequency bands may reflect distinctive cerebrovascular autoregulatory mechanisms operating at each of these frequency bands. 1 From a modeling and data analysis perspective, deriving the transfer function metrics such as gain, phase, and coherence as averaged values in each frequency band is equivalent to spectral smoothing, thus reduces measurement random noise and improves spectral estimate reliability. Moreover, statistical data analysis of TFA metrics in each frequency band rather than those derived from individual frequencies (not to band) reduces the multiple comparison problems and the risk of both false-positive and false-negative findings.
While the frequency bands should be used in obtaining TFA metrics, the cut-off frequencies may need to be determined under different experimental conditions because the operational frequency ranges of cerebrovascular autoregulation may shift. In addition, it is important to realize that TFA is a linear system approach relating changes in BP to CBF. Thus, reliable estimations of gain and phase assume linearity between changes in BP and CBF, as revealed by coherence function. 1 As presented in Figure 1, coherence function is lower than a critical value of 0.5 at most of the very low frequency band (i.e., 0.02–0.07 Hz). Thus, interpretation of gain and phase in this frequency range needs caution. 1 Interestingly, when compared with resting conditions, coherence increased significantly at the very low frequencies associated with significant increases in the spectral power of BP and CBV during repeated squat-stand maneuvers while the TFA gain and phase remained unchanged. 2 These observations further suggest the presence of nonlinearity between change in BP and CBF at these very low frequencies, indicating that estimation of coherence function may be influenced by the BP and CBF spectral power. 2
The physiological mechanisms underlying each frequency band of dCA may be different. In healthy participants, ganglion blockade of sympathetic and parasympathetic neural activities increased TFA gain and decreased phase in the very low frequency band of 0.02–0.07 Hz. 3 Consistently, blocking sympathetic 4 and cholinergic 5 activities increased gain at 0.06–0.08 Hz during oscillatory lower body negative pressure (OLBNP). On the other hand, in animal studies, blockade of cerebrovascular myogenic function with Ca2+ channel blockade increased TFA gain and decreased phase at the frequencies below 0.1 Hz. 6 Collectively, these observations suggest that cerebral autoregulatory mechanisms such as myogenic, metabolic, or autonomic neural control likely operate at each of the distinctive frequency bands rather than at individual frequencies, thus supporting the recommendations of banding TFA parameters (gain, phase, and coherence) for dCA assessment. 1
The proposed frequency bands for TFA of dCA under resting conditions may not be suitable if BP was forced to oscillate at a specific frequency. Recently, forced BP oscillation techniques such as repeated sit-stand maneuvers and OLBNP were used to assess dCA to strengthen the linear associations between changes in BP and CBF, thus the robustness of gain and phase estimations. 2 In these conditions, gain, phase, and coherence function may be calculated at a point frequency or frequencies where BP oscillations were experimentally enhanced.
In conclusion, we recommend banding TFA metrics in dCA studies unless BP was oscillated forcibly at a specific frequency. The frequency banding likely reflects the underlying vascular regulatory mechanisms, improves spectral estimation reliability, and reduces the risk of statistical errors. However, caution should be taken when determining the cut-off frequencies because the operational frequencies of dCA may shift under different conditions. Given these caveats, before we have a better understanding of the frequency-dependent cerebrovascular regulatory mechanisms,3–7 the currently recommended banding at the very low (0.02–0.07 Hz), low (0.07–0.20 Hz), and high (0.20–0.50 Hz) frequencies should be used to calculate the TFA metrics for dCA and to facilitate comparisons across studies. 1 To further improve the sensitivity and specificity of TFA for assessment of dCA, future studies need to investigate whether TFA metrics are altered under different experimental conditions and whether changing frequency band limits would affect the sensitivity and specificity of TFA metrics.
Footnotes
Funding
The author(s) received no financial support for the research, authorship, and/or publication of this article.
Declaration of conflicting interests
The author(s) declared no potential conflicts of interest with respect to the research, authorship, and/or publication of this article.