
Abstract
Sleep, a state of reduced consciousness, affects brain oxygen metabolism and lowers cerebral metabolic rate of oxygen (CMRO2). Previously, we quantified CMRO2 during sleep via Fick’s Principle, with a single-band MRI sequence measuring both hemoglobin O2 saturation (SvO2) and superior sagittal sinus (SSS) blood flow, which was upscaled to obtain total cerebral blood flow (tCBF). The procedure involves a brief initial calibration scan to determine the upscaling factor (fc), assumed state-invariant. Here, we used a dual-band sequence to simultaneously provide SvO2 in SSS and tCBF in the neck every 16 seconds, allowing quantification of fc dynamically. Ten healthy subjects were scanned by MRI with simultaneous EEG for 80 minutes, yielding 300 temporal image frames per subject. Four volunteers achieved slow-wave sleep (SWS), as evidenced by increased δ-wave activity (per American Academy of Sleep Medicine criteria). SWS was maintained for 13.5 ± 7.0 minutes, with CMRO2 28.6 ± 5.5% lower than pre-sleep wakefulness. Importantly, there was negligible bias between tCBF obtained by upscaling SSS-blood flow, and tCBF measured directly in the inflowing arteries of the neck (intra-class correlation 0.95 ± 0.04, averaged across all subjects), showing that the single-band approach is a valid substitute for quantifying tCBF, simplifying image data collection and analysis without sacrificing accuracy.
Introduction
The cerebral metabolic rate of oxygen (CMRO2), expressed in units of moles of oxygen consumed per unit time and tissue mass (expressed here as µmol O2/min/100 g), is a fundamental physiological parameter that reports on the cellular energy status of the brain, which relies almost exclusively on glucose catabolism to support ATP turnover. The oxygen-glucose utilization stoichiometry varies depending on the state of consciousness of the brain: while during functional activation or active waking the cerebral metabolic rate of glucose (CMRGlc) is higher than the metabolic rate of oxygen (CMRO2), under resting conditions glucose utilization and oxygen consumption are coupled, and during sleep CMRGlc decreases more than does CMRO2, due to oxidation of various other substrates.1,2
CMRO2 is derived from measurable parameters, exploiting Fick’s Principle, CMRO2 = Ca · CBF · (SaO2–SvO2), with Ca being the oxygen carrying capacity of blood, CBF the cerebral blood flow, expressed in units of blood volumetric flow per unit time and mass, and SaO2 and SvO2 representing the fractional arterial and venous blood oxygen saturations, respectively. Global CMRO2 at rest is remarkably stable, owing primarily to neurovascular coupling, a tightly regulated homeostatic system that maintains the balance between oxygen and glucose supply by blood flow and ensuing uptake and utilization by neurons. 3 Increases in neural activity requires greater oxygen and glucose extraction from arterial blood. In response, CBF increases and SvO2 decreases, along with an increase in CMRO2.
On the other hand, it has been shown that uncoupling between CBF and SvO2 occurs in healthy individuals during slow-wave sleep (SWS),4,5 although the precise biological function of this process is still being elucidated. The ensuing reduction in CMRO2 is suggested to be crucial for maintaining cellular homeostasis, including synaptic downscaling,6,7 elimination of metabolic waste through the cerebrospinal fluid,8,9 and clearance of reactive oxygen species.10–12 Madsen et al. reported a 25% decrement in CMRO2 during SWS verified by polysomnography, but the technique used is highly invasive, requiring catheterization of the radial artery and internal jugular vein, and providing poor temporal resolution, associated with timed blood draws. 4
Beyond providing basic insight into brain energetics during sleep, monitoring of CMRO2 is of considerable clinical relevance, in that it informs on metabolic alterations in sleep disorders, such as in obstructive sleep apnea (OSA). This breathing/sleep disorder was shown to be associated with a glucose hypometabolism 13 as measured by fluorodeoxyglucose-positron emission tomography (FDG-PET), and, very recently, by some of the present authors, with a reduction in CMRO2 with respect to healthy controls, as measured by MRI. 14
Several methods for CMRO2 quantification that do not require invasive procedures or the use of radioactive or exogenous tracers currently exist, exploiting the versatility of MRI contrasts. Some of these MRI-based methods quantify both the cerebral blood flow and oxygen extraction fraction (for a comprehensive review, see, for instance 15 ).
Among the phase-based methods, an approach for tracking CMRO2 during wakefulness and sleep has been applied by some of the present authors 5 derived from a class of MRI techniques known as OxFlow.16–19 OxFlow incorporates susceptibility-based oximetry (SBO) 20 and phase-contrast MRI, 21 yielding SvO2 in the superior sagittal sinus (SSS) in an axial head imaging slice, and total CBF (tCBF) in the internal carotid (ICAs) and vertebral arteries (VAs) in a parallel imaging slice at the neck. Meanwhile, simultaneous, in-scanner electroencephalography (EEG) provides unambiguous determination of the brain’s sleep state. Of particular interest is the occurrence of SWS, characterized by a given increase in synchronous δ-wave brain activity. 22 A customized, post-processing procedure is used to extract changes in δ-wave activity, quantified in terms of δ-power spectral density (δ-PSD) – a challenge, as the neuronal signals of interest are three orders-of-magnitude lower in intensity than the induced voltages generated by the MRI gradients.
Using OxFlow with simultaneous EEG, Caporale et al. reported strong, negative correlations between δ-PSD and CMRO2, which exhibited decrements ranging from 14 to 32% relative to wakefulness during EEG-verified SWS. 5 However, this prior sleep study potentially sacrificed CMRO2 accuracy by combining SvO2 and CBF quantification into the single-band OxFlow protocol, 17 which is based on the assumption that superior sagittal sinus blood flow (SSS-BF) can be upscaled to approximate tCBF, required for computing CMRO2 via Fick’s principle (see above), and that the upscaling or calibration factor remains invariant during the entire time series. While this is known to be the case during short time-series scans in the awake state, 17 use of a fixed upscaling factor requires validation for measurements during states of reduced consciousness as during sleep. Generally, the upscaling factor fc is obtained from a short calibration scan preceding single-band OxFlow time-series measurements, providing tCBF from phase-contrast measurements at the neck arteries, interleaved with SSS-BF quantification in the head.
To evaluate the hypothesis of state invariance of fc we used dual-band OxFlow (DB-OxFlow), 18 which simultaneously excites and acquires signals at both the neck and head slice levels with minimal reduction of temporal resolution. In this manner, global SvO2, SSS-BF, and tCBF were obtained at each time-point. CMRO2 was then computed from upscaled SSS-BF and compared to that based on tCBF measured directly in the neck arteries.
Methods
Study subjects and protocol
All research was performed in accordance with the principles stated in the Helsinki Declaration of 1975 (and as revised in 1983). The study protocol, illustrated in Figure 1, was approved by the Institutional Review Board of the University of Pennsylvania (IRB# 832748). Ten healthy subjects (6/4 M/F, ages 26 ± 4 years) with no contraindication to MRI (no claustrophobia, metal implants, pacemaker, clips, and suspected pregnancy) and who reported normal sleep habits, were recruited. Informed written consent was obtained from each subject. Further, the participants agreed to be contacted on the following day to complete an email survey on their sleep habits, and their comfort level during the study (see Supplementary Material). The studies took place between 9 pm and 12 am (eight studies started around or after 10 pm, two after 9 pm), to coincide with the typical circadian bedtime and occurrence of the first sleep cycle, when a significant proportion of time can be expected to be spent in SWS relative to later sleep cycles, during which proportionally more time is spent in REM sleep. Subjects refrained from caffeine intake for eight hours prior to the exam and wore comfortable attire to facilitate sleep. Hemoglobin was measured via finger prick before the MRI scan, using Hemocue Hb 201 (HemoCue America, CA, US). Imaging was performed at 3T (Siemens Prisma) using a 64-channel head-neck receiver coil, equipped with a rear port to pass the EEG cable. At the end of the protocol an anatomical T1-weighted image is acquired via magnetization-prepared rapid gradient-echo T1-MPRAGE 23 to obtain brain tissue mass for normalizing CMRO2.
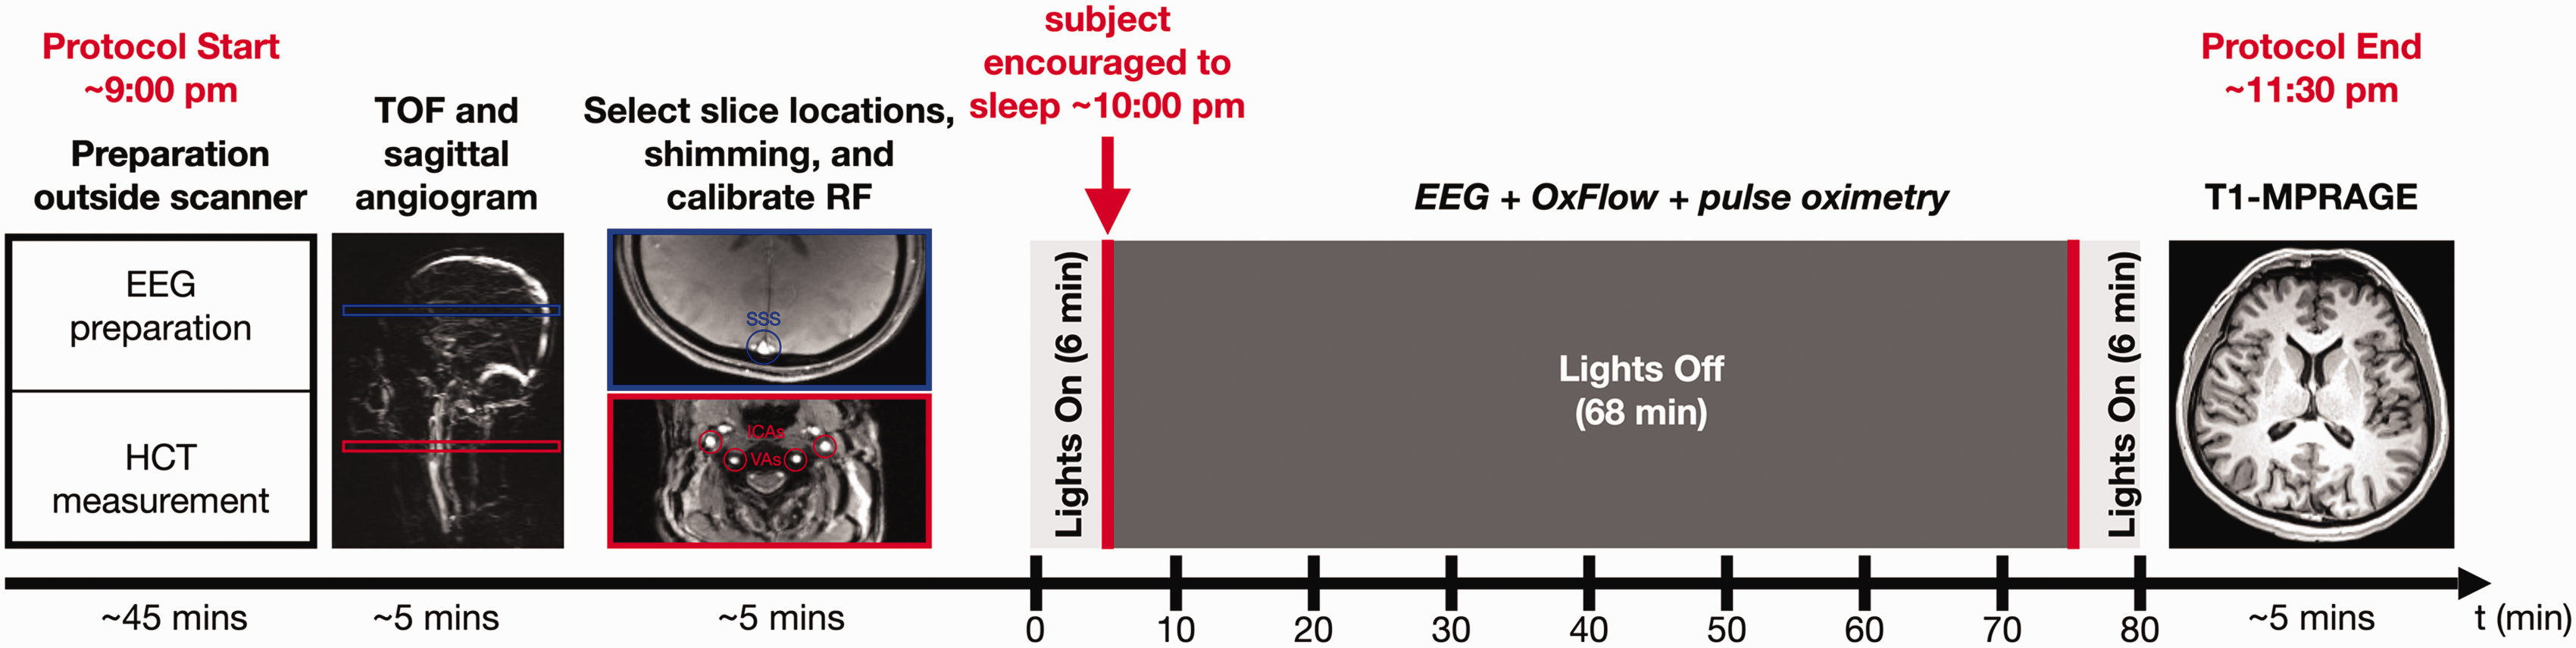
Illustration of study protocol. EEG preparation includes cap placement on the head and tests of signal quality with eyes open and closed to compare ⍺-wave activity. Hematocrit (HCT) is measured before the MRI scan using a finger-stick blood sample. Sagittal MRI angiograms and axial scout images are acquired to prescribe the neck and head imaging slices. Dual-band OxFlow is run for 80 minutes with concurrent EEG and pulse oximetry. Finally, a magnetization-prepared rapid gradient-echo measurement (MPRAGE) is performed to obtain brain tissue mass for normalizing CMRO2.
OxFlow MRI data acquisition, processing, and analysis
A timing diagram for the dual-band (DB)-OxFlow pulse sequence is shown in Figure 2. DB-OxFlow was selected over the earlier, interleaved implementations of OxFlow,16,24 because it provides tCBF and SSS-BF at every point of the time series, as the dual-band implementation acquires both sets of data simultaneously. Modifications to the standard DB-OxFlow pulse sequence 18 were made using the SequenceTree pulse sequence design and editing tool. 25 To dampen acoustic noise, as a means to facilitate sleeping inside an MRI scanner, maximum imaging gradient amplitudes along the slice-selection/flow encoding and phase encoding directions were reduced from values of 20–28 mT/m to 10 mT/m, and slew-rates were capped at 50 T/m/s, compared to 100–140 T/m/s. This modification resulted in an average reduction in acoustic noise of 7.3 dB over the audible range, when comparing the sequence with 10 mT/m relative to 20 mT/m (see Figure S1 in the Supplementary material for details on acoustic noise analysis; a sound pressure/level meter would have been required to determine absolute acoustic noise level). Due to the described modifications, there was concomitant increase in the inter-echo spacing (ΔTE) from 3.71 to 6.16 ms, and an increase in the minimum pulse repetition time, TR. TR = 40 ms was chosen to allow alignment of the MRI data with the EEG time series data during gradient artifact subtraction (described below), since 40 ms is an integer multiple of the 4 ms sampling time of the processed EEG data. Thus, the effective time interval between excitation of successive k-space lines was TR* = 2 · TR = 80 ms, since two datasets with flow compensation and flow encoding were acquired (see Figure 2). Other imaging parameters were: voxel size = 1 × 1 × 5 mm3, FOV = 200 ×200 mm2, sampling frequency bandwidth (BW) = 312.5 Hz/pixel, first echo time (TE1) = 9.17 ms, ΔTE = 6.16 ms, TR = 40 ms, flip angle (head/neck) = 36/12° or 20/12°, velocity encoding (VENC) = 80 cm/s for both slice locations, acquisition time to quantify global CMRO2 (temporal resolution) = 16 s, and number of temporal frames acquired = 300.
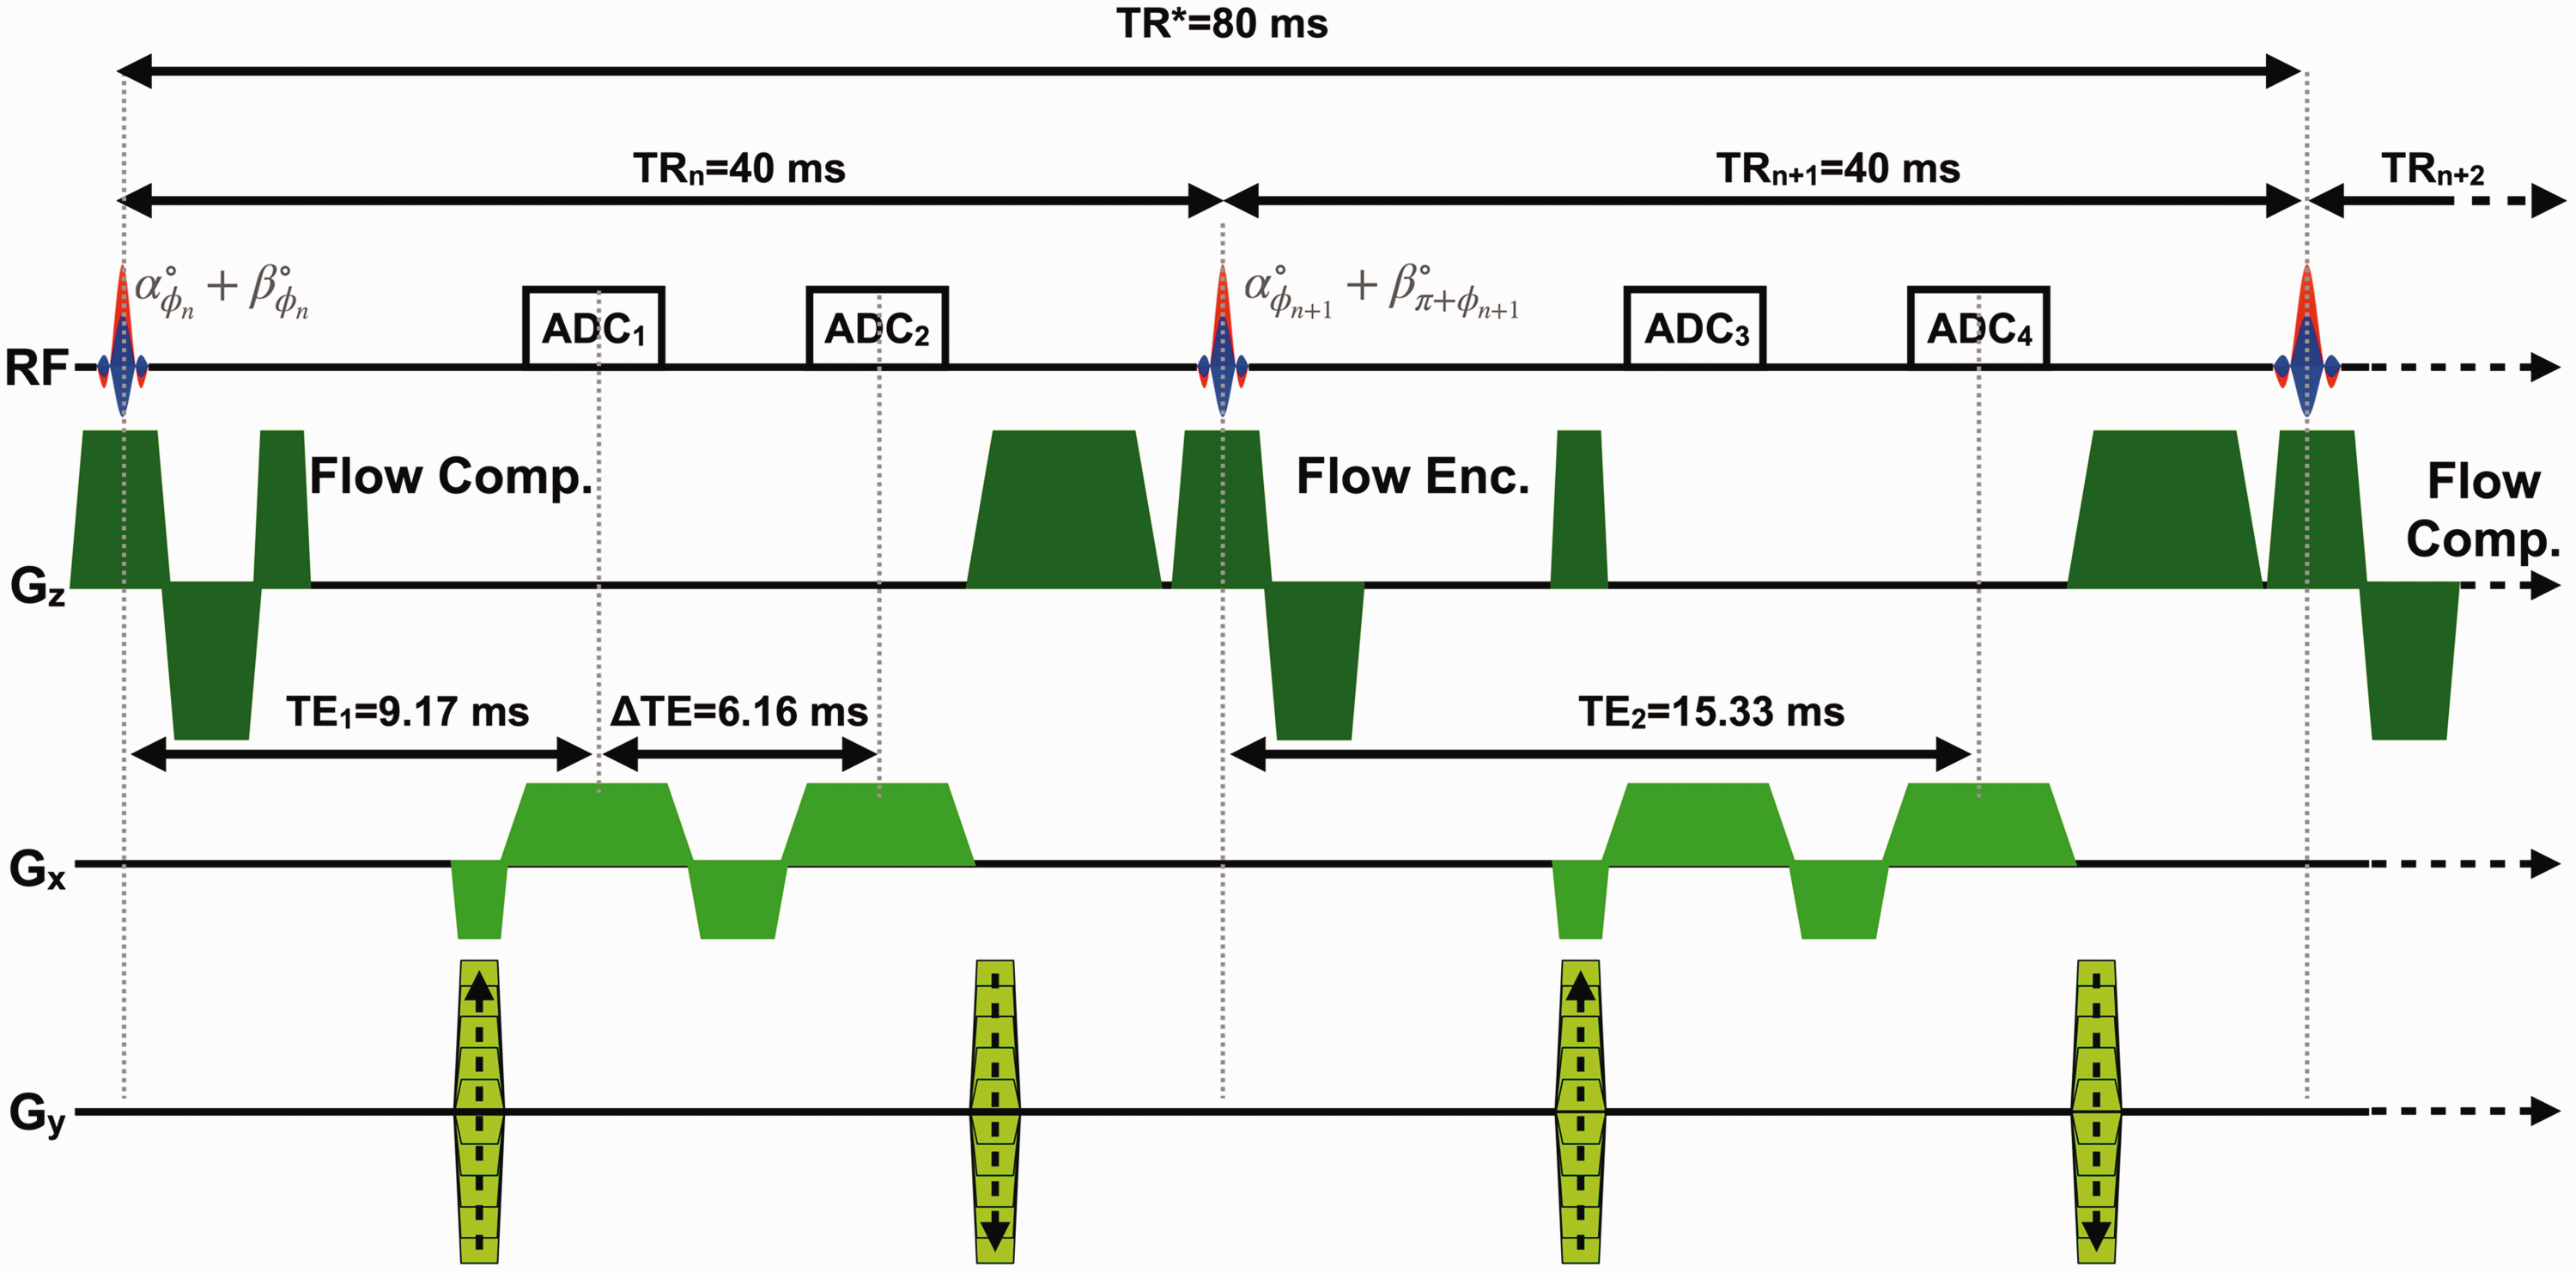
Dual-band OxFlow (DB-OxFlow) MRI pulse sequence timing diagram. Gz: slice-selection/flow-encoding gradients; Gx: frequency encoding gradients; Gy: phase-encoding gradients; RF: dual-band radio frequency excitation pulse; α, β: flip angles for neck and head, respectively; ϕn: phase of the nth dual-band RF pulse; TRn: pulse repetition time; TR*: effective pulse sequence repetition time, accounting for the flow compensated (Flow Comp.) and flow encoded (Flow Enc.) interleaves; TE: echo time; ΔTE: inter-echo spacing; ADCn: analog-to-digital converter during signal acquisition.
Total CBF was quantified in two ways, both directly in the neck arteries as well as approximated by multiplication of SSS-BF with a scaling factor fc = tCBF/SSS-BF obtained from mean values of tCBF and SSS-BF collected while the subject was awake, covering the first 15 measurements of the time series, and constituting the ‘baseline’ value. Field maps were acquired to quantify SvO2 in the SSS after correcting for background field inhomogeneity, as described previously. 26 Image reconstruction (zero-padded matrix size = 400 × 400), processing, and data analysis were performed with MATLAB (The MathWorks, Inc., Natick, MA, USA).
The blood-flow ratio, BFR = SSS-BF/tCBF (which is the reciprocal of fc), was computed for each temporal frame from directly measured values obtained at the four arteries in the neck (yielding tCBF) and SSS (yielding SSS-BF). This ratio was then compared with the baseline value to determine possible state-dependent deviations. BFR was then averaged over 4 min-intervals during the entire time series.
The difference [BFR(t) – BFR(t = 0)] was obtained in all subjects who had achieved SWS during the time series. Lastly, CMRO2 was computed with directly measured CBF from the neck arteries and compared with values obtained by estimating CBF by upscaling SSS-BF. As a measure of agreement, the intra-class correlation coefficient was computed for the two methods. Analogous to the definition of baseline BFR, the CMRO2 averaged in a 4-min epoch acquired during the initial ‘lights-on’ period was considered as an estimate of ‘baseline’ CMRO2.
EEG data acquisition, processing, and analysis
EEG was recorded using a 15-channel MR-compatible sleep cap and a 32-channel amplifier (BrainCap and BrainAmp MR plus, respectively, from Brain Products GmbH, Gilching, Germany). The EEG cap montage included 7 channels positioned according to the international 10/20 system, two reference channels (M1, M2), two electrooculography (EOG) channels, three electromyography (EMG) channels, and one electrocardiogram (ECG) channel. EEG was recorded at 5000 Hz sampling rate. Before the recordings inside the scanner, a calibration acquisition was performed in the control room, with eyes open and eyes closed (3 mins for each condition). Electrode impedances were checked in the scanner, and the EEG was acquired in the scanner bore, first without any MRI protocol, and subsequently while the DB-OxFlow was running.
EEG data were processed with Brain Vision Analyzer (Version 2.1, Brain Products, Gilching, Germany). As a first step, imaging and electrocardiographic (ECG) pulse artifacts were removed using the average artifact subtraction method. 27 In brief, MR artifacts due to gradients applied in the slice selection (Gz), phase encoding (Gy), and readout direction (Gx) were automatically marked based on recurring patterns. The length of these patterns was TR* = 80 ms (Figure 2), as this constitutes the minimum period of gradient-generated artifacts. Gradient artifacts were removed using a sliding window average of 21 intervals, and the EEG data were subsequently downsampled to 500 Hz. ECG pulse artifacts were removed by subtracting an average ECG artifact template, after appropriate correction of the R-peak detection, if needed. Subsequently, a passband filter encompassing the range from 0.5 to 24 Hz was applied, with a notch filter at 60 Hz. Correction for eye blinks was performed via independent component analysis, with a semi-automated procedure, followed by visual inspection. The data were again visually inspected for residual artifacts, such as eye movement and muscle activation and further downsampled to 250 Hz.
The preprocessed data were segmented into
Data and code availability
Data will be made available upon request to the corresponding author following anonymization. MATLAB scripts and Brain Vision Analyzer history templates will also be shared upon request.
Results
Table 1 provides subject demographics and their prior MRI scanning experience. In addition, the table indicates the number of image frames that exhibited either motional blurring or a shift in registration relative to the coil sensitivity maps obtained at the start of the scan, when a reference image is acquired to be used for disentangling the overlapped dual-slice images during data processing. 18 The ‘sleep’-portion of the MRI examination was conducted within ±1 hour of the average participants’ bedtime. Four subjects (3, 6, 9 and 10) achieved EEG-verified SWS. These four participants reported having had at least one head MRI scan previously. In addition to these four, subject 7 exhibited a CMRO2 decrement consistent with SWS (see Table 2), but the EEG data were non-interpretable due to excessive ground impedance. Four of the subjects who did not achieve EEG-verified SWS (1, 2, 4, and 8) had little to no prior experience with head MRIs. Subjects 1, 2, and 8 moved frequently during the scan, resulting in image blurring at a temporal resolution of 16 s, or positional shifts in registration relative to the coil sensitivity maps, precluding accurate reconstruction. Subject 5 and 9 were familiar with the MRI scanner environment, but did not achieve SWS, and moved during scanning, corrupting some of the image frames (which were excluded from analysis without relevant loss of data given the temporal resolution of image acquisition). Subject 4, who also did not achieve SWS, yielded good-quality data with minimal motion artifacts, permitting a detailed analysis, discussed below.
Demographics and subjects’ prior experience with MRI, and number of image frames corrupted by involuntary subject movements during scanning.
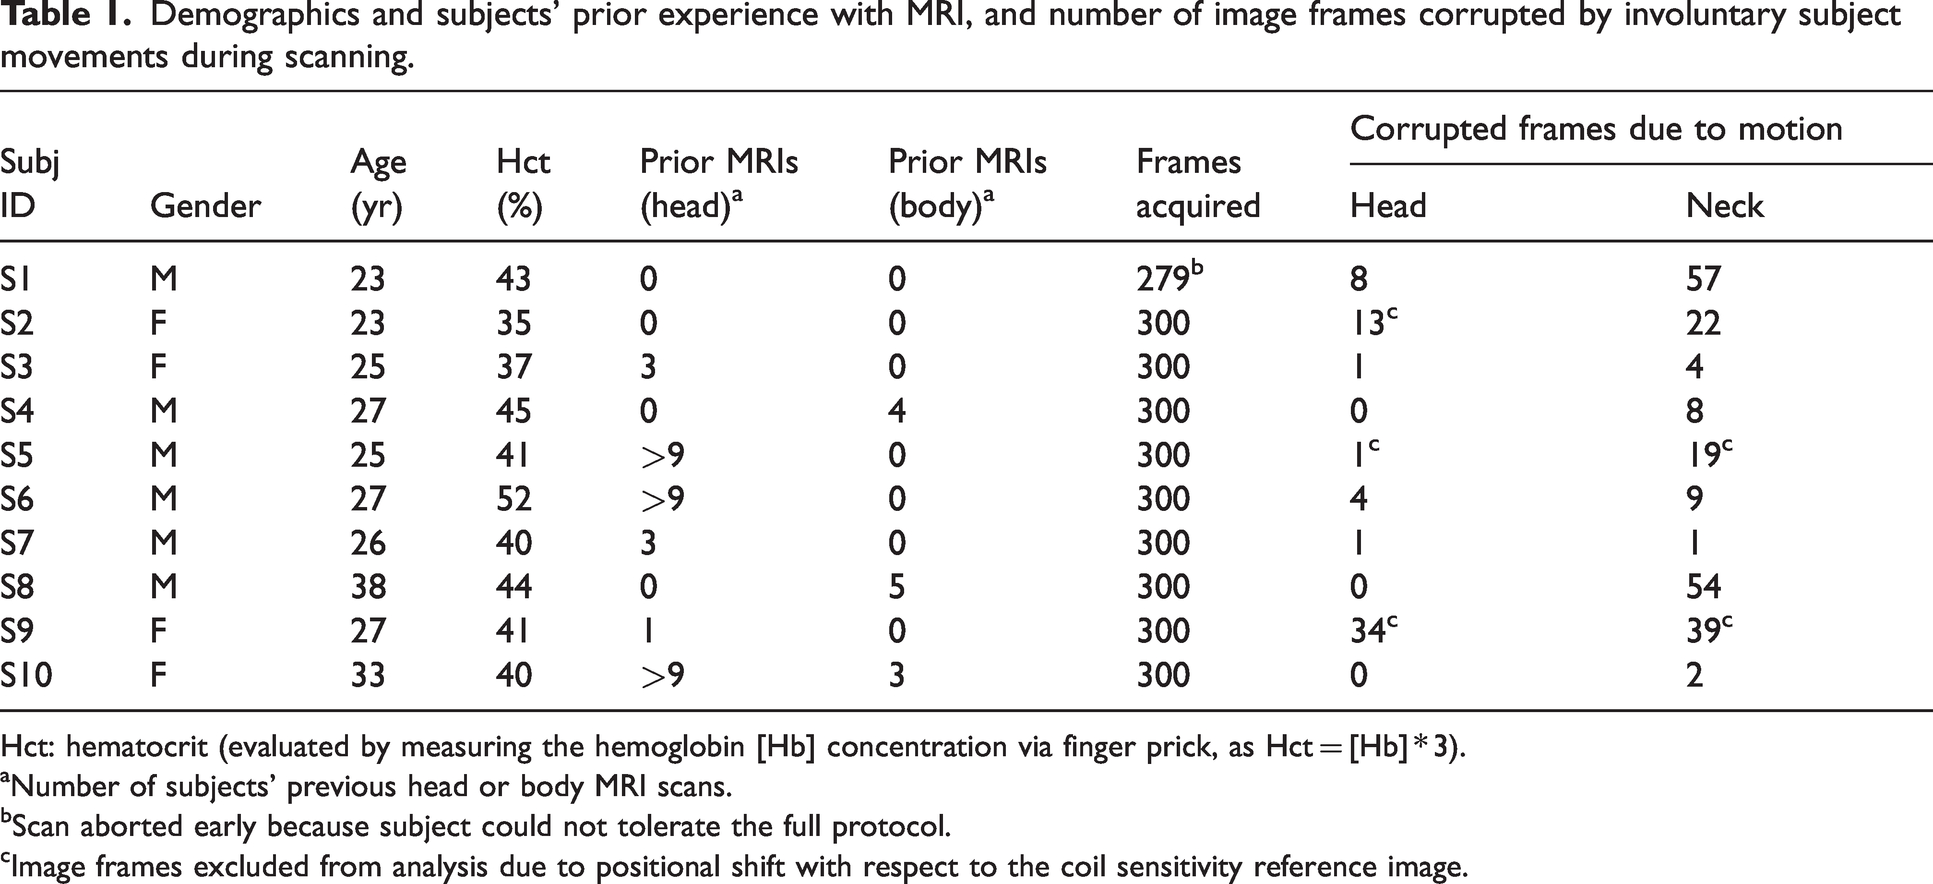
Hct: hematocrit (evaluated by measuring the hemoglobin [Hb] concentration via finger prick, as Hct = [Hb] * 3).
aNumber of subjects’ previous head or body MRI scans.
bScan aborted early because subject could not tolerate the full protocol.
cImage frames excluded from analysis due to positional shift with respect to the coil sensitivity reference image.
MRI-derived physiologic parameters sampled during eyes open and eyes closed periods (or during the entire protocol, where indicated). For the subjects achieving slow wave sleep (SWS), the period of SWS was considered, while for the remaining subjects, an average over the ‘eyes closed’ period was considered. Values are reported as mean ± standard deviation.
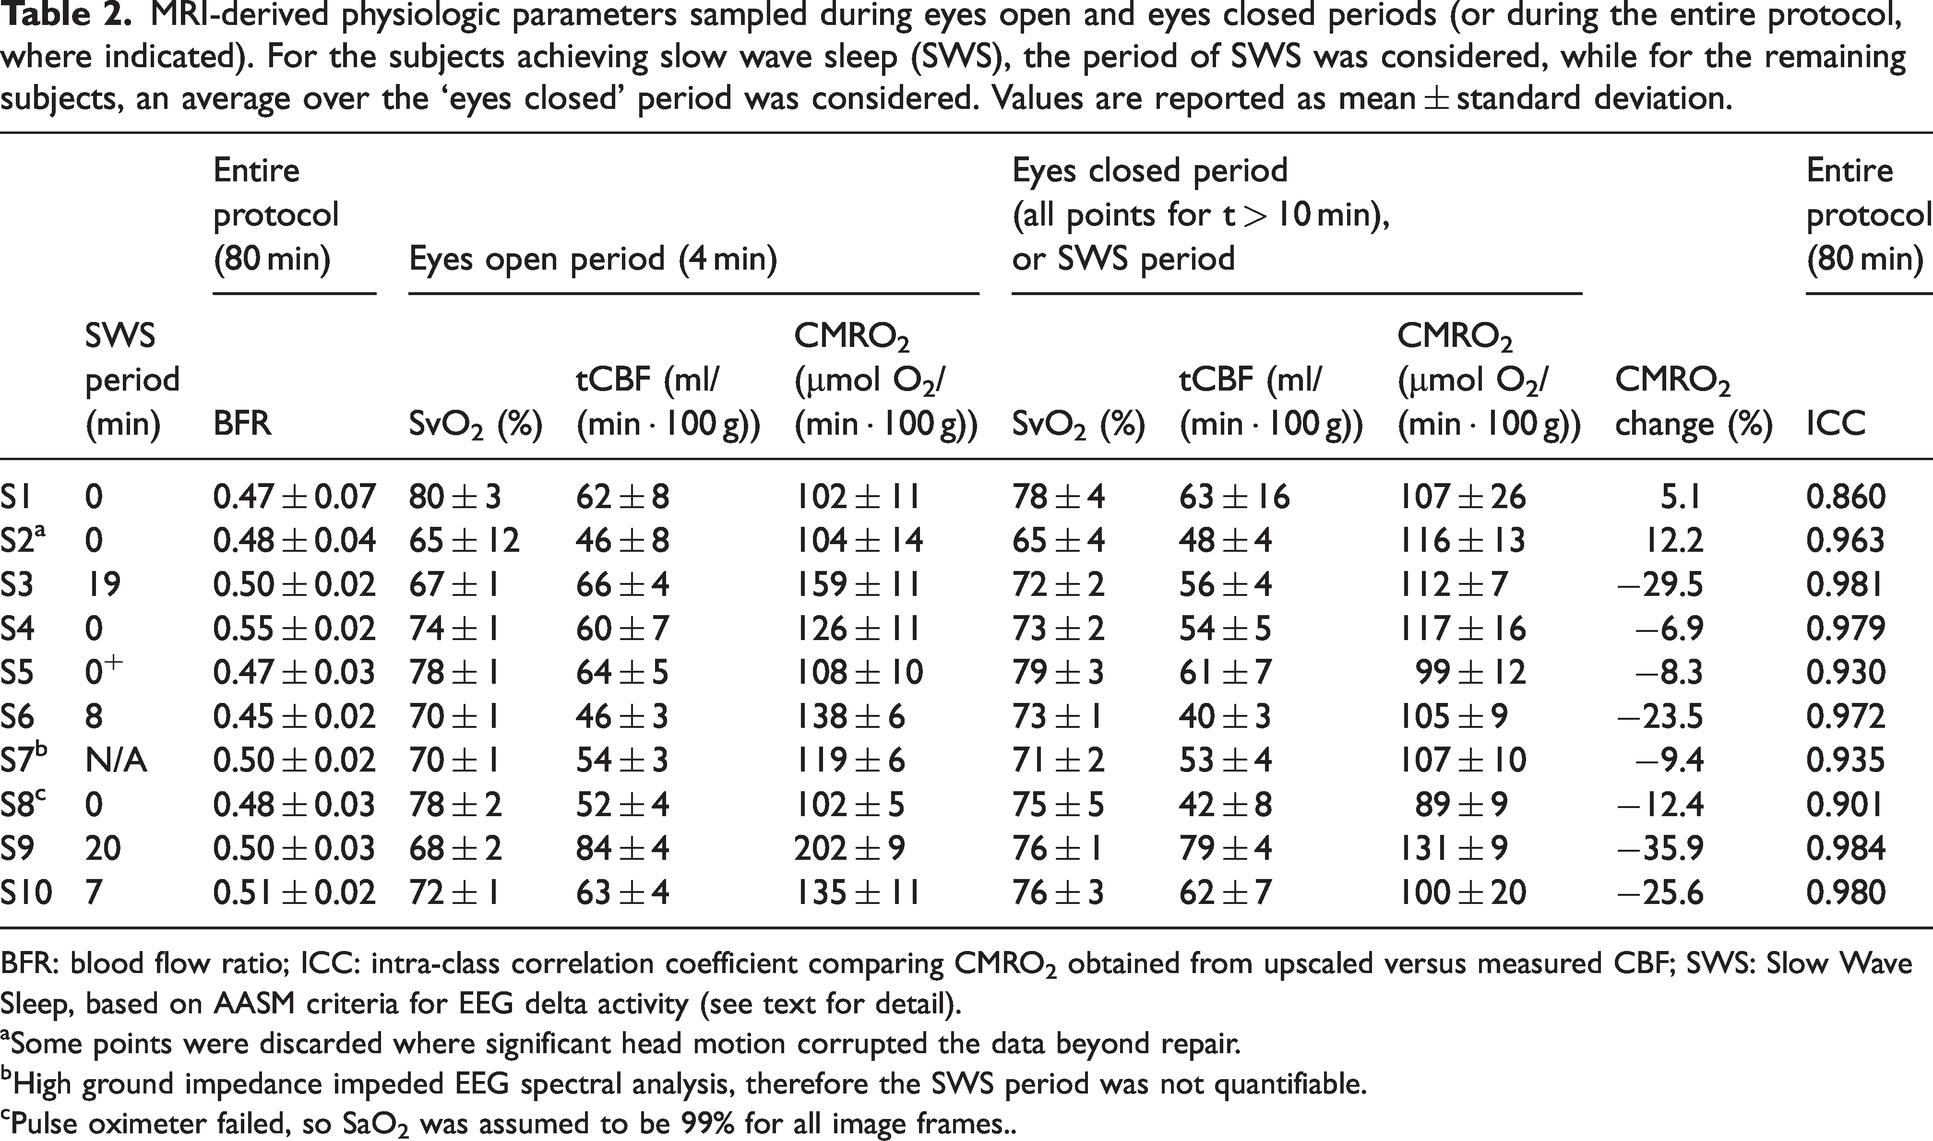
BFR: blood flow ratio; ICC: intra-class correlation coefficient comparing CMRO2 obtained from upscaled versus measured CBF; SWS: Slow Wave Sleep, based on AASM criteria for EEG delta activity (see text for detail).
aSome points were discarded where significant head motion corrupted the data beyond repair.
bHigh ground impedance impeded EEG spectral analysis, therefore the SWS period was not quantifiable.
cPulse oximeter failed, so SaO2 was assumed to be 99% for all image frames..
Table 2 provides the MRI-derived physiologic parameters and duration of slow-wave sleep, for all study subjects, determined as per AASM criteria for δ-wave power. Subjects 3, 6, 9 and 10 exhibited CMRO2 decrements of 29.5, 23.5, 35.9, and 25.6% relative to pre-sleep wakefulness, respectively. The physiological data from all subjects, comprising a total of 3000 temporal frames, each yielding CBF, SvO2 and CMRO2 data, served as the basis for evaluating the hypothesis of agreement between the two different methods of determining CBF, i.e. upscaling SSS-BF versus direct measurement from the four arterial inflow conduits (see Section 2.2). The intraclass-correlation coefficient (ICC) between the CMRO2 evaluated with the two methods (upscaled-CMRO2 and dual-band CMRO2) is reported in Table 2 for all subjects (the ICC 95% confidence intervals can be found in the Supplementary Material, Table S1). The full time-course of all MRI-derived physiologic parameters and δ-PSD for one of the subjects is plotted in Figure 3, while representative graphs for two of the subjects who achieved SWS are plotted in Figures 4 and 5.
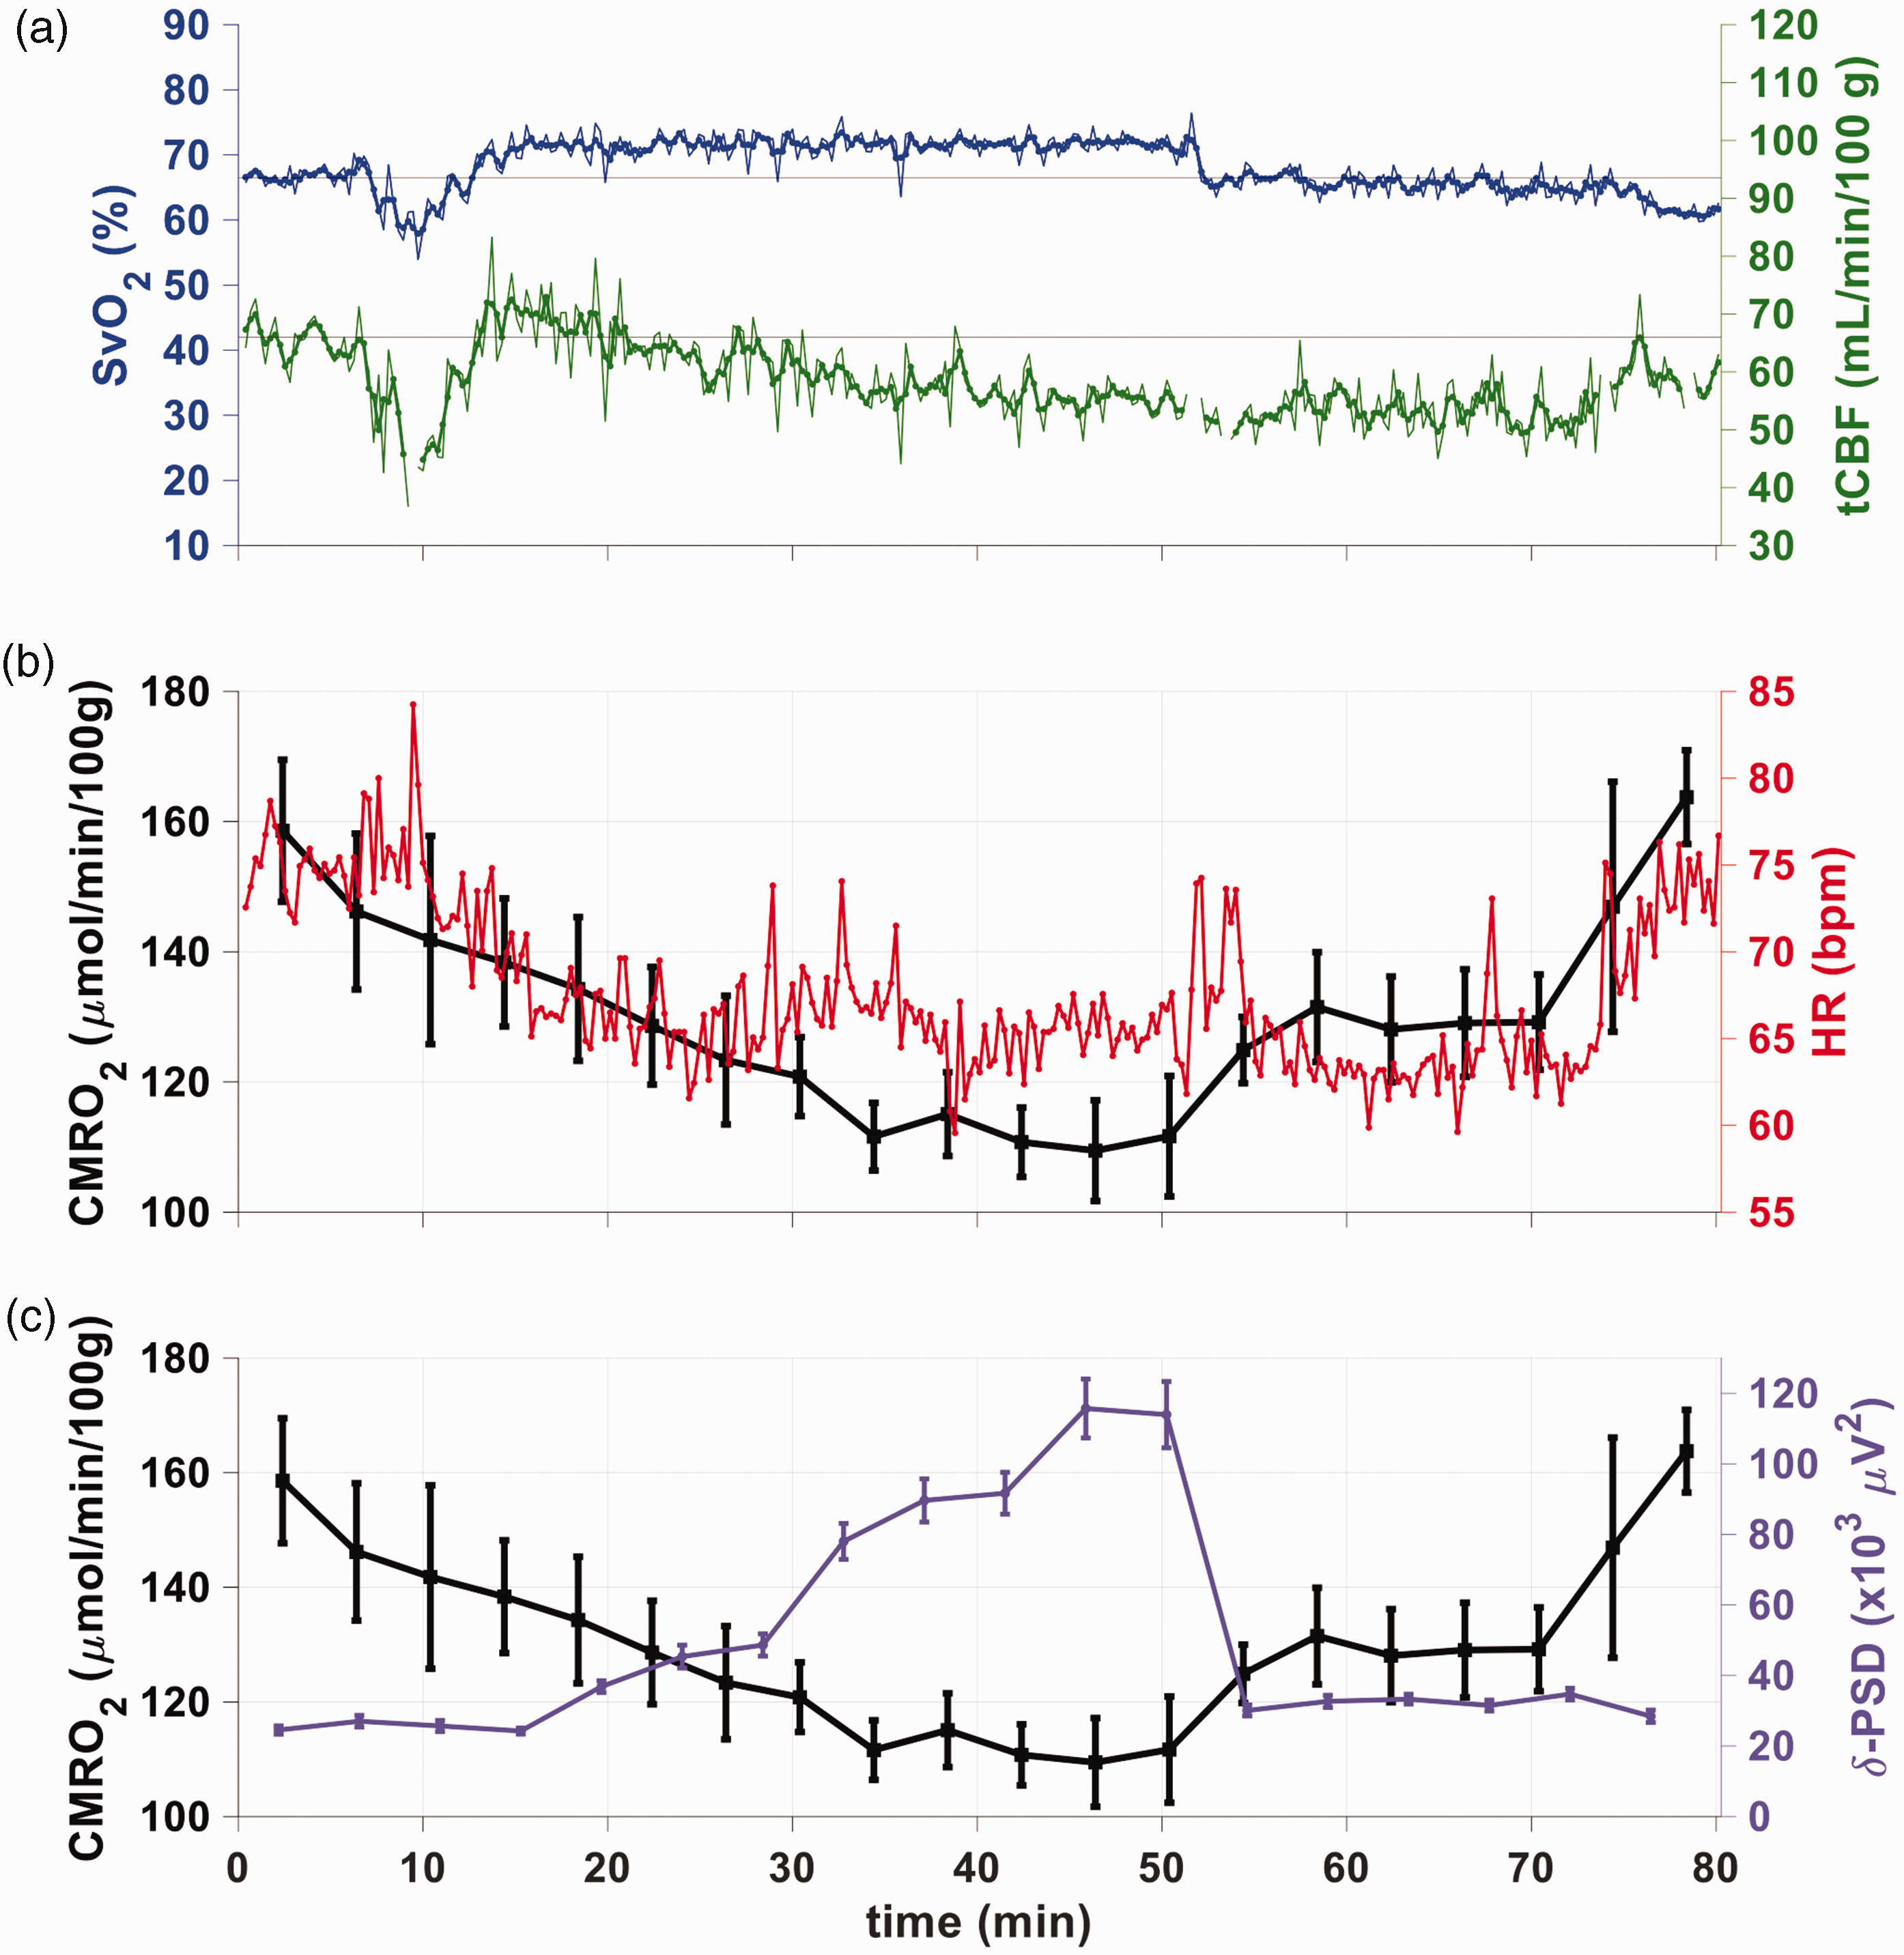
Physiological parameters obtained with the OxFlow sequence of Figure 2 for a subject who achieved slow-wave sleep. (a) Time-course showing SvO2 (blue), assessed by susceptometry-based oximetry in the SSS, and tCBF (green), obtained with phase-contrast MRI in the neck arteries, using the dual-band OxFlow sequence of Figure 2 (see Table 1 for list of subjects). Unsmoothed and smoothed (3-point moving average) data are displayed as thin and thick lines, respectively. Thin horizontal lines (top panel) indicate averages of the first 4 minutes for each parameter to guide the eye. A limited number of data points is missing due to motion-related corruption of image frames. (b) CMRO2 plotted as means ± 1 standard deviation (n time frames = 15) for each 4-minute time segment (black), along with heart rate (red), plotted as 16 second averages to coincide with the OxFlow temporal resolution and (c) CMRO2 along with delta power spectral density (δ-PSD, purple, mean ± 1 standard deviation), highlighting the opposing behavior of the two parameters.
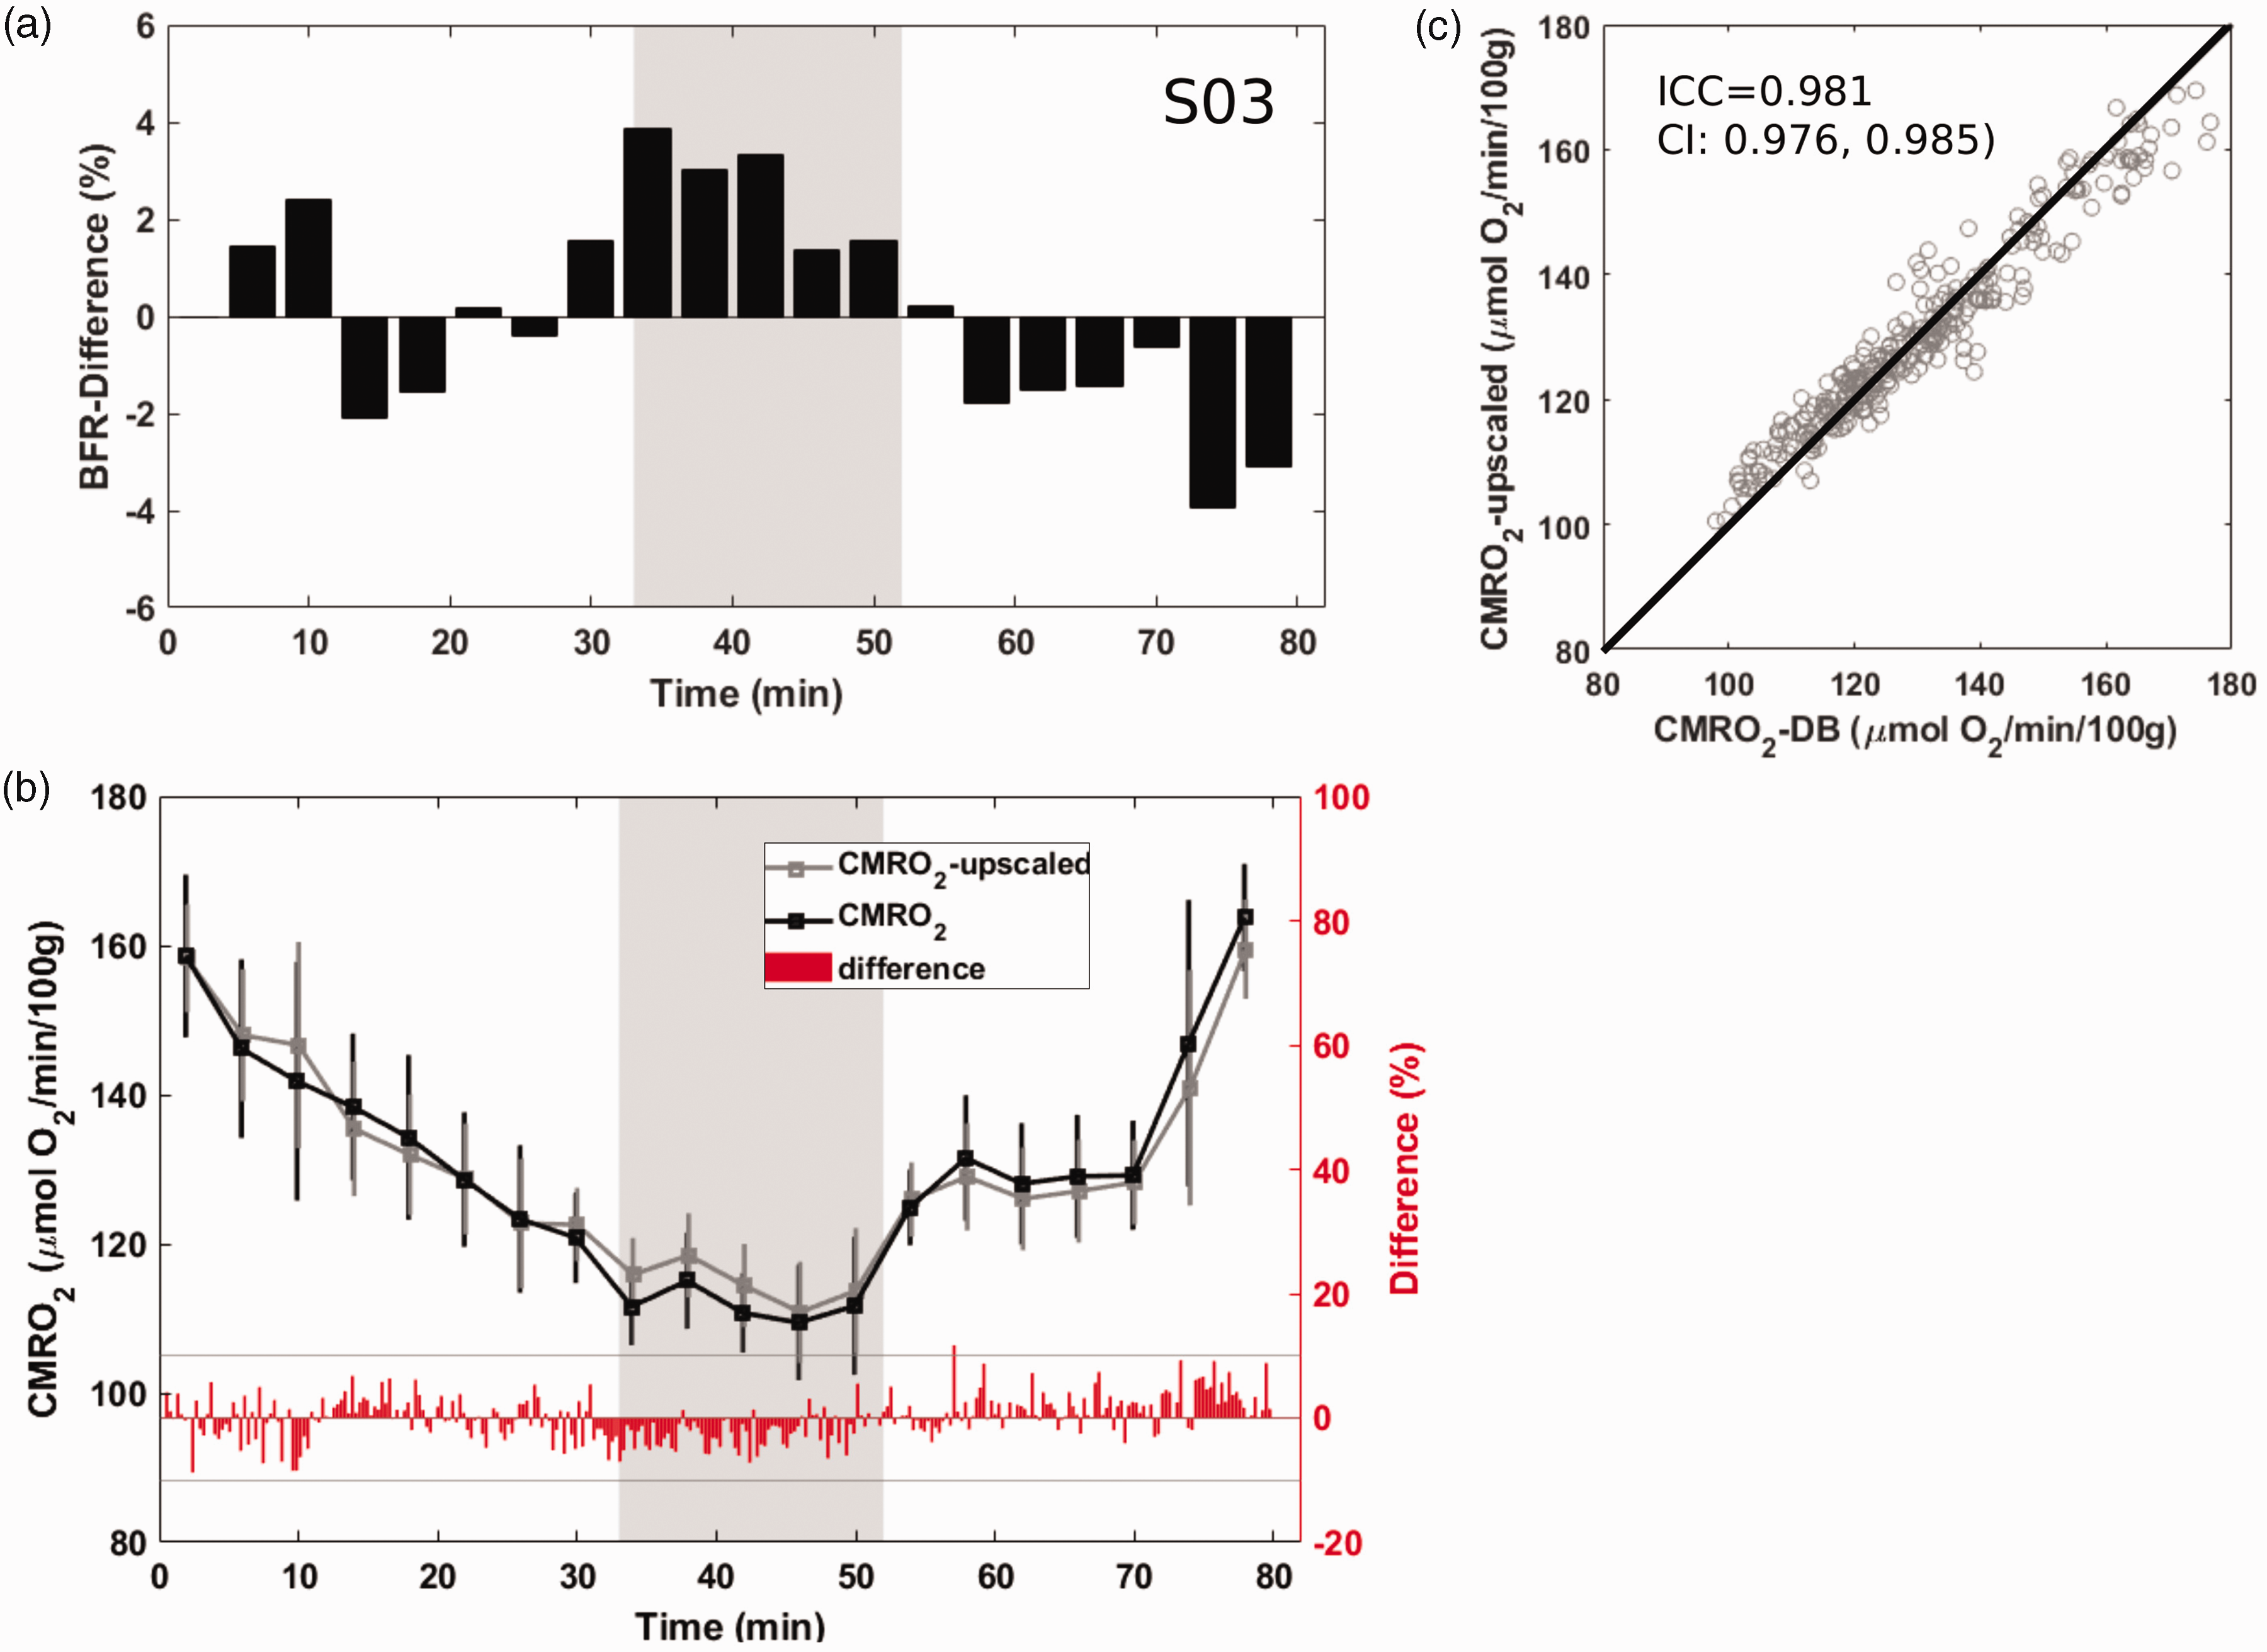
Agreement between the two estimates of cerebral metabolic rate of oxygen (CMRO2) during early spontaneous progression into sleep. (a) Blood flow ratio (BFR) relative change with respect to the first four minutes of wakefulness. (b) CMRO2 evaluated by upscaling the superior sagittal sinus blood flow (gray) or by direct measurement of CBF from inflowing blood through the neck arteries (black), and their difference (red trace; the gray horizontal lines indicate +/− 10% difference limits). The grey areas in panels a and b represent the time interval during which the subject was in slow-wave sleep. Average CMRO2 over 4-min time intervals is plotted along with standard deviations and (c) correlation between the two estimates of CMRO2 comprising all 300 image frames. Intra-class correlation coefficient (ICC) of 0.98, together with 95% confidence intervals (CI) suggest very high level of agreement between the two methods. Straight line is line of identity.
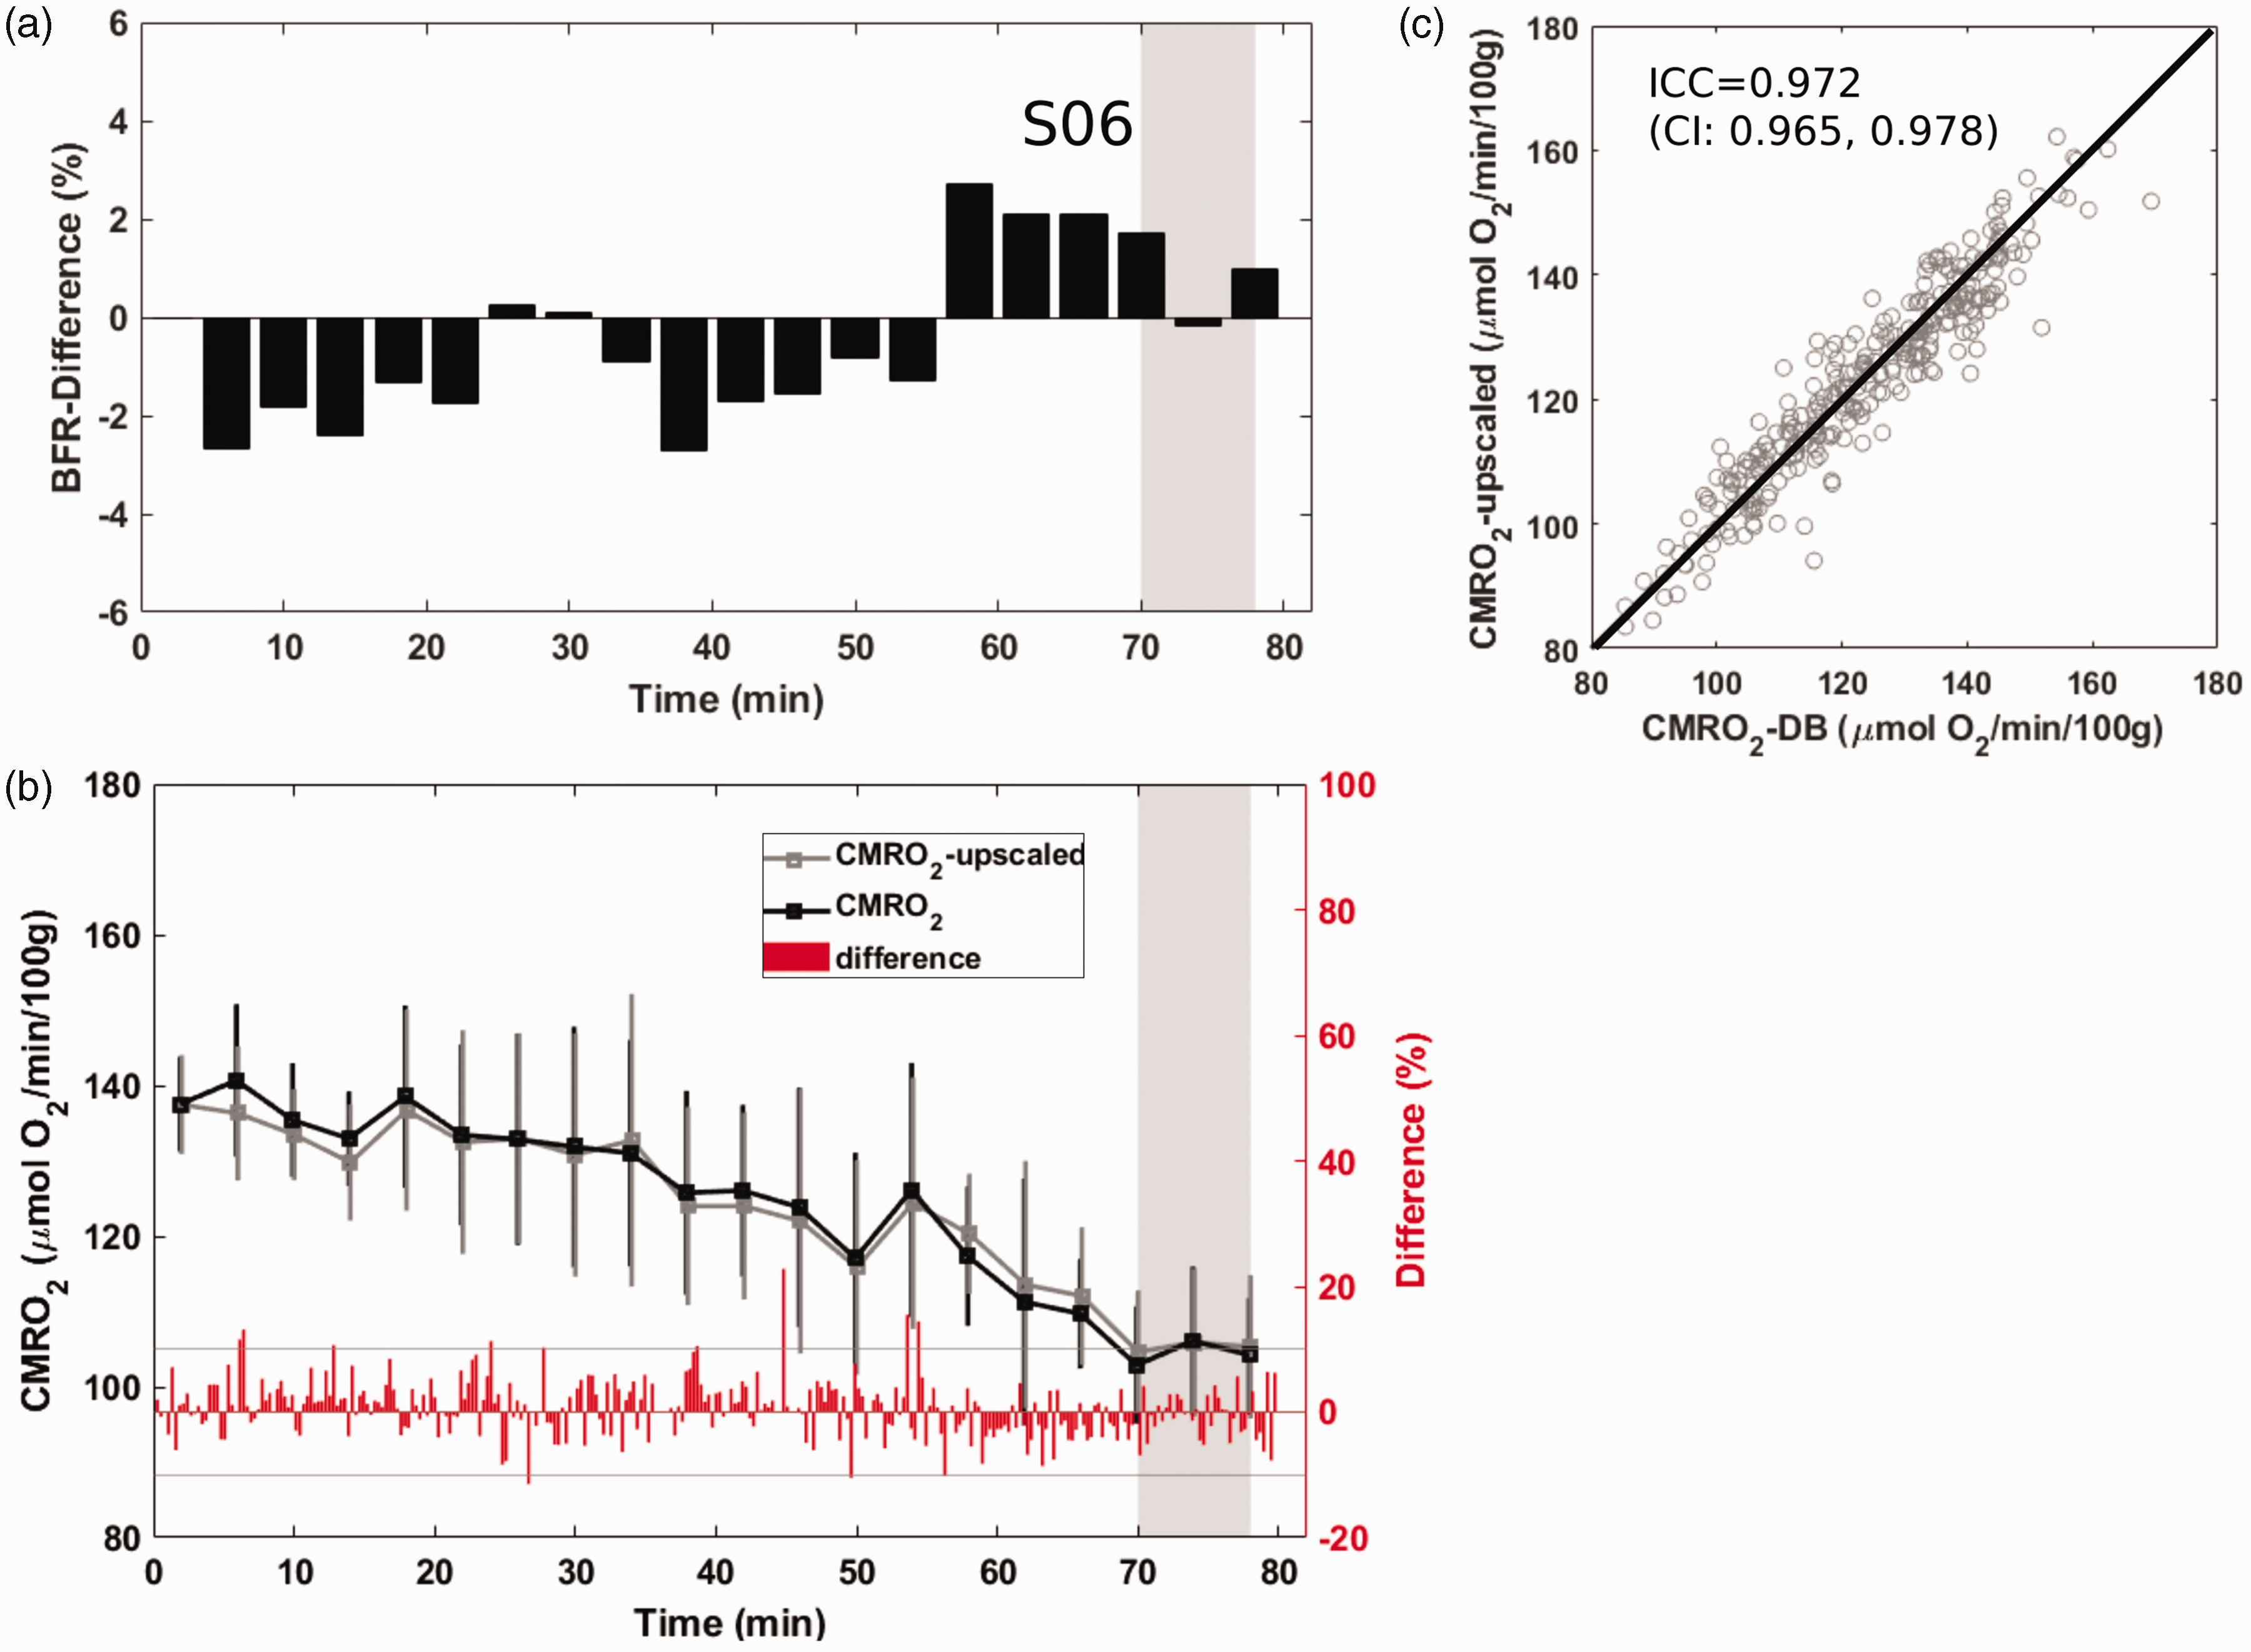
Agreement between the two estimates of cerebral metabolic rate of oxygen (CMRO2) during late spontaneous progression into sleep. For details of presentation see Figure 4. Again, the ICC of 0.97 suggests near perfect agreement between the two methods for CMRO2 calculation.
Figure 3 illustrates, in a subject achieving SWS, the expected uncoupling between SvO2 and tCBF during sleep, as indicated by the gradual rise in SvO2 starting at around t = 15 min, followed by a decrease in tCBF beginning at t ∼ 30 min (Figure 3(a)) along with concomitant drop in heart rate (Figure 3(b)). While SWS was not achieved at t ∼ 15 min, according to δ-PSD (Figure 3(c)), the subject does begin to relax, as evidenced by the decrease in heart rate (Figure 3(b)). At t ∼ 30 min, δ-PSD begins to rise, coinciding with the decoupling between SvO2 and tCBF, manifesting in a ∼30% decrement in CMRO2, relative to pre-sleep wakefulness (Figure 3(c)). The subject awakes spontaneously from SWS at around t = 55 min, coincident with a sharp drop in SvO2, and rise in tCBF, leading to a return of CMRO2 toward the baseline value, in this particular case.
Figures 4 and 5 show time-resolved data in two of the four subjects who succeeded in descending into slow-wave sleep (early versus late sleep onset). Panel (a) displays the difference between actual blood flow ratio (BFR) quantified at each point of the time series from measurement of CBF at the base of the skull and superior sagittal sinus, and estimated values calculated from the first four minutes while the subject was awake. Results indicate these differences to fluctuate within a range of ±4%. In panel (b), CMRO2 determined on the basis of the two different ways of estimating CBF, i.e. by upscaling superior sagittal sinus blood flow using the initially determined scaling factor (using data from the first 4 minutes of acquisition, as described in the Methods), versus actual measurements at each time point, is shown. The deviations are obviously minor, in that there is a very high agreement between the two approaches of CMRO2 quantification, as indicated by the intraclass correlation coefficient (ICC) found to exceed 0.97 in both subjects shown (panel (c)). The ICC for the two remaining subjects (see Supplementary Material, Figs. S3–S4) were 0.98 and 0.984.
Discussion
The main objective of the present work was to examine whether the hypothesis of state invariance of the upscaling factor fc (and thus, of the blood-flow ratio, BFR = 1/fc) that allows estimation of total CBF (tCBF) from initial measurement of CBF in the neck arteries and SSS-BF during wakefulness, is valid. If true, tCBF can be estimated during the time series by obviating the need of independent tCBF measurement at each time-point. Our results suggest that upscaled SSS-BF approximates tCBF with negligible bias, thereby simplifying image acquisition, reconstruction, and data analysis in future studies. In fact, the same region of interest can be segmented in the SSS to extract SvO2 and tCBF values, rather than having to segment the SSS and the four neck arteries throughout the time series (which is more challenging, because motion of carotid and vertebral arteries is more likely to occur).
In Table 2 the CMRO2 values during the ‘eyes open’ portion of the protocol are listed for the group of subjects. During this period the subjects where in a state of quite wakefulness. These values, ranging from 102–159 µmol/min/100g tissue, are in good agreement with the literature, with average CMRO2 of adult human brain GM and WM having been reported as 134.2 ± 21.1 and 79.4 ± 12.6 µmol O2/(min
The differences between actual and estimated total cerebral blood flow were not significant, being well within measurement error and did not affect the derived CMRO2 in any meaningful manner (ICC 0.86–0.984, see Table 2). Prior work demonstrated that the BFR remained constant during short scans in the awake state. 17 However, the invariance of the contribution of cortical to total cerebral blood flow in time series lasting over one hour as in the present work, and involving spontaneous, physiological changes in the state of consciousness, had not previously been examined.
The application of DB-OxFlow was critical to this finding, as it provides coincident measurement of tCBF in the neck arteries and SSS-BF in the SSS, hence yielding the BFR for every time point in the image series, 18 with one full measurement of all relevant physiological parameters every 16 seconds (in spite of increased TR necessary to accommodate reduced gradient amplitudes and slew rates used to dampen acoustic noise).
The mean decrement in CMRO2 relative to wakefulness for the four subjects who achieved EEG-verified SWS in this study was 28.6 ± 5.5%, in good agreement with previous findings from the authors’ laboratory using a single-band technique deriving blood flow rate and SvO2 in the superior sagittal sinus and estimating CBF via upscaling as described above. 5 One additional participant exhibited a maximum CMRO2 decrement of 21% consistent with SWS during the 80-minute scan period, but anomalous ground impedance precluded a definitive determination by EEG. Of note is that this subject had dense long hair, which made it more difficult to maintain desired electrode impedance. The observed reductions in CMRO2 during slow-wave sleep are also in good agreement with results of a much earlier study based on flow measurements using the Kety-Schmidt technique with 133Xe as an inert gas tracer 4 and blood gas analysis of venous O2 saturation. In another early study by Boyle et al. using the same invasive technique, a reduction in CMRO2 (of around 16%) was found in a group of 12 healthy volunteers during sleep (sleep stages II and III). The reasons for this discrepancy merit further investigation, considering that a smaller reduction in oxygen metabolism is expected, compared to the reduction in glucose metabolism, in the sleeping brain than during wakefulness. 2 The decrease in CBF for the subjects achieving SWS (average: −9%; range: −2–15%), was lower compared to the reduction in CMRO2, and slightly lower compared to other studies using the Kety-Schmidt techniques 4 or transcranial Doppler ultrasound. 31
In light of the findings of CMRO2 changes, the concept of ‘baseline CMRO2’ was not strictly defined or controlled in the current work. In fact, the assumption that the volunteer reached a steady-state during the initial ‘lights-on’ period was purely empirical, and would warrant further scrutiny. Moreover, we notice that due to baseline definition, CMRO2 changes (evaluated as the percent difference from baseline) during SWS are correlated with baseline CMRO2 (r = −0.976, P = 0.024 when including only subjects achieving SWS, versus r = −0.835, P = 0.003 when all subjects are included). The definition of CMRO2 baseline may be a potential limitation of the present study, and the sleep induced CMRO2 changes should be handled with care. However, the establishment of a definitive way to evaluate CMRO2 changes induced by sleep was beyond the scope of this study, which was instead focused on demonstrating that cerebral blood flow (CBF) can be quantified in the superior sagittal sinus instead of using the neck arteries (which is more challenging), yielding comparable estimates of CMRO2.
Beyond resolving the uncertainty about possible variations in cortical flow as a fraction of total CBF, the present study showed that it is possible – albeit difficult – to conduct sleep studies in the MRI scanner with concomitant EEG monitoring for extended periods of time, allowing to follow changes in brain energetics during relatively rapidly varying states comprising at least one entire sleep cycle. The dual-band sequence used to evaluate the partitioning of cortical versus inner brain blood flow, is more susceptible to involuntary head movement than a single-band sequence, which monitors SSS flow only during the time series. The data in the present work also show that despite the greater complexity of the sequence, gradient artifacts masking the EEG signal could be effectively suppressed using the average artifact subtraction method 27 (see supplementary Figure S2). The acoustic noise attenuation approach based on reducing imaging gradient ramps did objectively lower the audible sound exposure (by about 7 dB – see Figure S1). However, it is not clear to what extent this measure greatly alleviated subject discomfort by facilitating sleep onset and maintenance since no comparison data are available. Among the reasons that prevented the subjects from falling asleep (Supplementary Material, Fig. S3), there were the psychological pressure of being observed or simply having to achieve the task of falling asleep (N = 1), itching due to the application of the electrolyte gel on the scalp (N = 1), discomfort of laying still (N = 1) or sleeping in the supine position (N = 1). While half the study participants achieved slow-wave sleep, the data suggest that habituation to the scanner environment is helpful in that the majority of participants who failed to descend into sleep had little or no prior exposure to body MRI and, most importantly, to head MRI (Supplementary Material, Figs. S5 and S6). Other than abstention from intake of nerve-stimulating fluids such as coffee or tea and conducting the procedure at night, no attempts at active sleep deprivation were made as in some prior other EEG-correlated MRI studies during sleep. 32
Conclusions
Simultaneous measurement of total cerebral blood flow in the feeding neck arteries and cerebral cortical flow in the superior sagittal sinus with a dual-band OxFlow sequence revealed that the ratio of the two measurements remained unaltered between wakefulness and sleep. Upfront calibration of this blood flow ratio in a sleep study involving extended-duration time-series measurement with simultaneous EEG is shown to yield both venous O2 saturation along with reliable estimation of total cerebral blood flow from a single measurement site, thereby obviating the need to acquire whole-brain flow data at the neck during the entire time series of several hundred successive scans. Therefore, single-band OxFlow simplifies processing and analysis for obtaining temporally resolved global CMRO2 quantification. Results from young healthy subjects yielded a mean decrement in global CMRO2 during slow-wave sleep of 28% relative to wakefulness, consistent with prior findings in the authors’ laboratory.
Supplemental Material
sj-pdf-1-jcb-10.1177_0271678X231164423 - Supplemental material for Superior sagittal sinus flow as a proxy for tracking global cerebral blood flow dynamics during wakefulness and sleep
Supplemental material, sj-pdf-1-jcb-10.1177_0271678X231164423 for Superior sagittal sinus flow as a proxy for tracking global cerebral blood flow dynamics during wakefulness and sleep by Alessandra S Caporale, Alexander M Barclay, Jing Xu, Hengyi Rao, Hyunyeol Lee, Michael C Langham, John A Detre and Felix W Wehrli in Journal of Cerebral Blood Flow & Metabolism
Footnotes
Funding
The author(s) disclosed receipt of the following financial support for the research, authorship, and/or publication of this article: Research reported in this publication was supported in part by the National Center for Advancing Translational Sciences of the National Institutes of Health (NIH) under Award Number UL1TR001878, and NIH grants T32 EB020087, R21 AG051981, R21 AG065816 and P41 EB029460.
Acknowledgements
The authors are indebted to Dr. Hee Kwon Song for helpful discussions, and to Dr. Wenshen Guo for advice on the statistical analysis.
Declaration of conflicting interests
The author(s) declared no potential conflicts of interest with respect to the research, authorship, and/or publication of this article.
Authors’ contributions
AS Caporale and AM Barclay conducted the MRI procedures, and the preliminary tests for acoustic and electronic noise evaluation. H Lee provided the original dual-band sequence. AM Barclay optimized the MRI sequence, with suggestions from MC Langham, while AS Caporale optimized the EEG acquisition, with advice from H Rao. AM Barclay and AS Caporale analyzed the MRI and EEG data, assisted by J Xu in the interpretation of EEG data. AS Caporale, AM Barclay, and FW Wehrli drafted the manuscript. FW Wehrli and H Rao conceived the overall study. FW Wehrli and AS Caporale reviewed and edited the manuscript, along with, MC Langham, JA Detre. All authors read and approved the final version of the manuscript.
Supplemental material
Supplemental material for this article is available online.
References
Supplementary Material
Please find the following supplemental material available below.
For Open Access articles published under a Creative Commons License, all supplemental material carries the same license as the article it is associated with.
For non-Open Access articles published, all supplemental material carries a non-exclusive license, and permission requests for re-use of supplemental material or any part of supplemental material shall be sent directly to the copyright owner as specified in the copyright notice associated with the article.