
Abstract
Hemodialysis patients exhibit anemia-related cerebral hyperperfusion and iron deposition (ID). However, the mechanisms underlying the pathology of cerebral ID are not clear. We investigated the role of cerebral blood flow (CBF) in the pathophysiology of cerebral ID in hemodialysis patients with anemia. This study recruited 33 hemodialysis patients with anemia and thirty-three healthy controls (HCs). All the subjects underwent quantitative susceptibility mapping (QSM) and arterial spin labeling (ASL) to measure ID and CBF in the cerebral nuclei. Furthermore, we evaluated lacunar infarction (LI), cerebral microbleeds, and total white matter hyperintensity volume (TWMHV). Hemodialysis patients with anemia showed significantly higher ID and CBF in some nuclei compared to the HCs after adjusting for age, sex, and total intracranial volume (TIV) [P < 0.05, false discovery rate (FDR) corrected]. CBF showed a positive correlation with ID in both patients and HCs after adjustments for age, gender, and TIV (P < 0.05, FDR corrected). Serum phosphorus, calcium, TWMHV, hypertension, and dialysis duration were independently associated with ID (P < 0.05). Hemoglobin, serum phosphorus, and LI were independently associated with CBF (P < 0.05). Mediation analysis demonstrated that CBF mediated the effects between hemoglobin and ID. Our study demonstrated that CBF mediated aberrant cerebral ID in hemodialysis patients with anemia.
Keywords
Introduction
End-stage renal disease (ESRD) is a major health problem in the elderly and is a major chronic non-communicable disease worldwide. 1 Hemodialysis decreases the risk of death in patients with ESRD than peritoneal dialysis. 2 However, ESRD patients undergoing hemodialysis are also associated with various neural complications such as cerebrovascular diseases, 3 cerebral atrophy, 4 and cognitive impairment, 5 which cause high hospitalization rates and poor compliance.
Previous cross-sectional and longitudinal studies demonstrated increased iron deposition (ID) in the bilateral putamen of patients undergoing hemodialysis.6,7 An increase in ID was associated with the reduced volume of the gray matter nuclei. 7 Li et al. demonstrated ID in multiple regions of the basal ganglia in patients with advanced Alzheimer’s disease; moreover, ID in the bilateral putamen was a potential imaging biomarker for the early diagnosis of Alzheimer’s disease. 8 The free ferrous iron (Fe2+) reacts with hydrogen peroxide and generates highly toxic reactive oxygen species and ferric iron (Fe3+), which damage the lipids, proteins, and DNA of the neuronal cells. 9 Therefore, abnormal cerebral ID is evaluated in hemodialysis patients suspected of iron overload. Iron deficiency-related anemia is a common complication in hemodialysis patients and contradicts cerebral iron overload. Furthermore, the mechanisms of cerebral iron overload in hemodialysis patients with iron-deficiency anemia are unclear.
Recently, arterial spin labeling (ASL), as a noninvasive technique, had been proven to be highly reliable and reproducible. It also showed good consistency with PET-CT and dynamic susceptibility contrast (DSC) examinations.10,11 ASL was widely applied to evaluate cerebral blood flow (CBF) in the normal aging population, 12 Alzheimer's disease, 13 Parkinson's disease, 14 and cerebrovascular disease,15,16 etc. CBF is a vital physiological indicator to investigate the metabolic activities in the brain because it influences the availability or delivery of metabolites, including iron. However, the association between cerebral ID and CBF changes is unknown. Characterization of the relationship between iron metabolism and CBF may provide complementary information to understand the pathophysiology of ID. Since subcortical gray matter nuclei played a critical role in the regulation of motor control, executive and affective functions, cognition, and emotion. 17 These neural activities required energy consumption and combined with changes in CBF and metabolic rate of oxygen. 18 It has been reported that the cerebral metabolic rate of oxygen showed a significantly and weakly positive correlation with ferritin, which was the main form of iron stored in the brain, and indicated that energy consumption demanded the iron. 19 Moreover, iron was prone to accumulate in the cerebral nuclei because these structures were abundant with astrocytes and microglia, which had plenty of ferritin.20–22 The amount of iron of subcortical nuclei was the most in the brain. 23 Therefore, we hypothesized that the evaluation of ID changes in the cerebral nuclei might be clinically significant. We also assumed a potential link between CBF, cerebral ID, and anemia in patients undergoing hemodialysis.
Therefore, in this study, we investigated (1) the changes in ID and CBF of the cerebral nuclei in hemodialysis patients compared with healthy controls (HCs); (2) the possible relationship between ID and CBF in hemodialysis patients and HCs; (3) the potential inner relationship between anemia, cerebral ID, and CBF in the hemodialysis patients with anemia using mediation analysis.
Materials and methods
Study participants
The Medical Research Ethics Committee of our hospital approved this prospective study, which was compliant with the health insurance portability and accountability act. We obtained written informed consent forms from all the study participants in accordance with the Declaration of Helsinki. The inclusion criteria for the hemodialysis patients were as follows: (1) right-handed and older than 18 years; (2) magnetic resonance imaging (MRI) data including T1-and T2-weighted images, susceptibility-weighted imaging (SWI), ASL, and 3 D T1-magnetization-prepared rapid acquisition gradient echo (T1-MPRAGE); (3) absence of MRI contraindications; (4) no history of other treatment modalities such as peritoneal dialysis and renal transplantation, and (5) quality of data was acceptable for postprocessing and analysis. The exclusion criteria were as follows: (1) diagnosed with congenital disorders by conventional MRI examination; (2) history of cerebral hemorrhage, stroke, cerebral injury or contusion, cerebral tumor, age- or genetic-related neurodegenerative disorders, drug or substance abuse, epilepsy and convulsions, and others; (3) severe blood loss or blood donation, or massive transfusion during the recent six months; (4) history of other chronic systemic diseases that affected brain functions; (5) head motion greater than 1.0° or 1.0 mm during MRI scanning.
Laboratory examinations
Biochemical parameters such as hemoglobin (Hb), serum urea nitrogen (BUN), serum creatinine, serum triglyceride, serum iron, serum calcium and abio-phosphorus, glucose, and parathyroid hormone were analyzed using the Vitros350 Automatic biochemical analyzer (Johnson & Johnson, New Jersey, USA) on the day before or after the MRI examinations. The duration of dialysis for each patient was also recorded. Biochemical parameters were not evaluated for the healthy subjects.
MRI protocol
The 3-Tesla MAGNETOM Trio a Tim System (Siemens Healthcare, Erlangen, Germany) equipped with an 8-channel phased-array head coil was used for scanning the study participants. The participants were instructed to close their eyes but remain awake during the scanning protocol. T1W imaging, T2W imaging, and T2W fluid-attenuated inversion recovery imaging were used to rule out subjects with cerebral structural abnormalities. Then, high-resolution 3D flow-compensated SWI, pulsed ASL (pASL), and 3D T1-MPRAGE sequences were performed for all the study subjects. The parameters for all these sequences are listed in Supplementary Table 1.
MRI data processing and analysis
QSM data was reconstructed from the original phase and magnitude data using the SMART processing software (Susceptibility Mapping and Phase Artifacts Removal Toolbox, Detroit, Michigan, USA). The processing steps are provided in the Supplementary Materials. The quantitative measurement of ID in the cerebral nuclei of the QSM images was also performed with SPIN (Signal Processing in Nuclear Magnetic Resonance, Detroit, MI) software. The subcortical cerebral nuclei included the bilateral caudate head (CA), putamen (PUT), globus pallidus (GP), thalamus (THA), red nucleus (RN), substantia nigra (SN), and the dentate nucleus (DN) (Figure 1). The ID measurement in the cerebral nuclei was according to the protocols published in previous studies6,7 and is shown in the Supplementary Materials. The ID values in the cerebral nuclei of all the 33 hemodialysis patients with anemia and 33 HCs were measured by a radiologist (C.C. with nine years’ experience in neuroimaging) who was blinded to the clinical information of all subjects. After one month, the ID values were remeasured for a cohort of 19 randomly chosen HCs by the same radiologist (C.C.) to evaluate intrareader reliability. Another radiologist (H.Y.W. with five years’ experience in neuroimaging) who was also blinded to the clinical information of all the subjects independently measured the ID values for the above cohort of 19 randomly chosen HCs to evaluate interrater reliability. The iron content in the cerebral nuclei was represented as the mean value ± standard deviation. The susceptibility values were expressed as parts per billion (ppb).
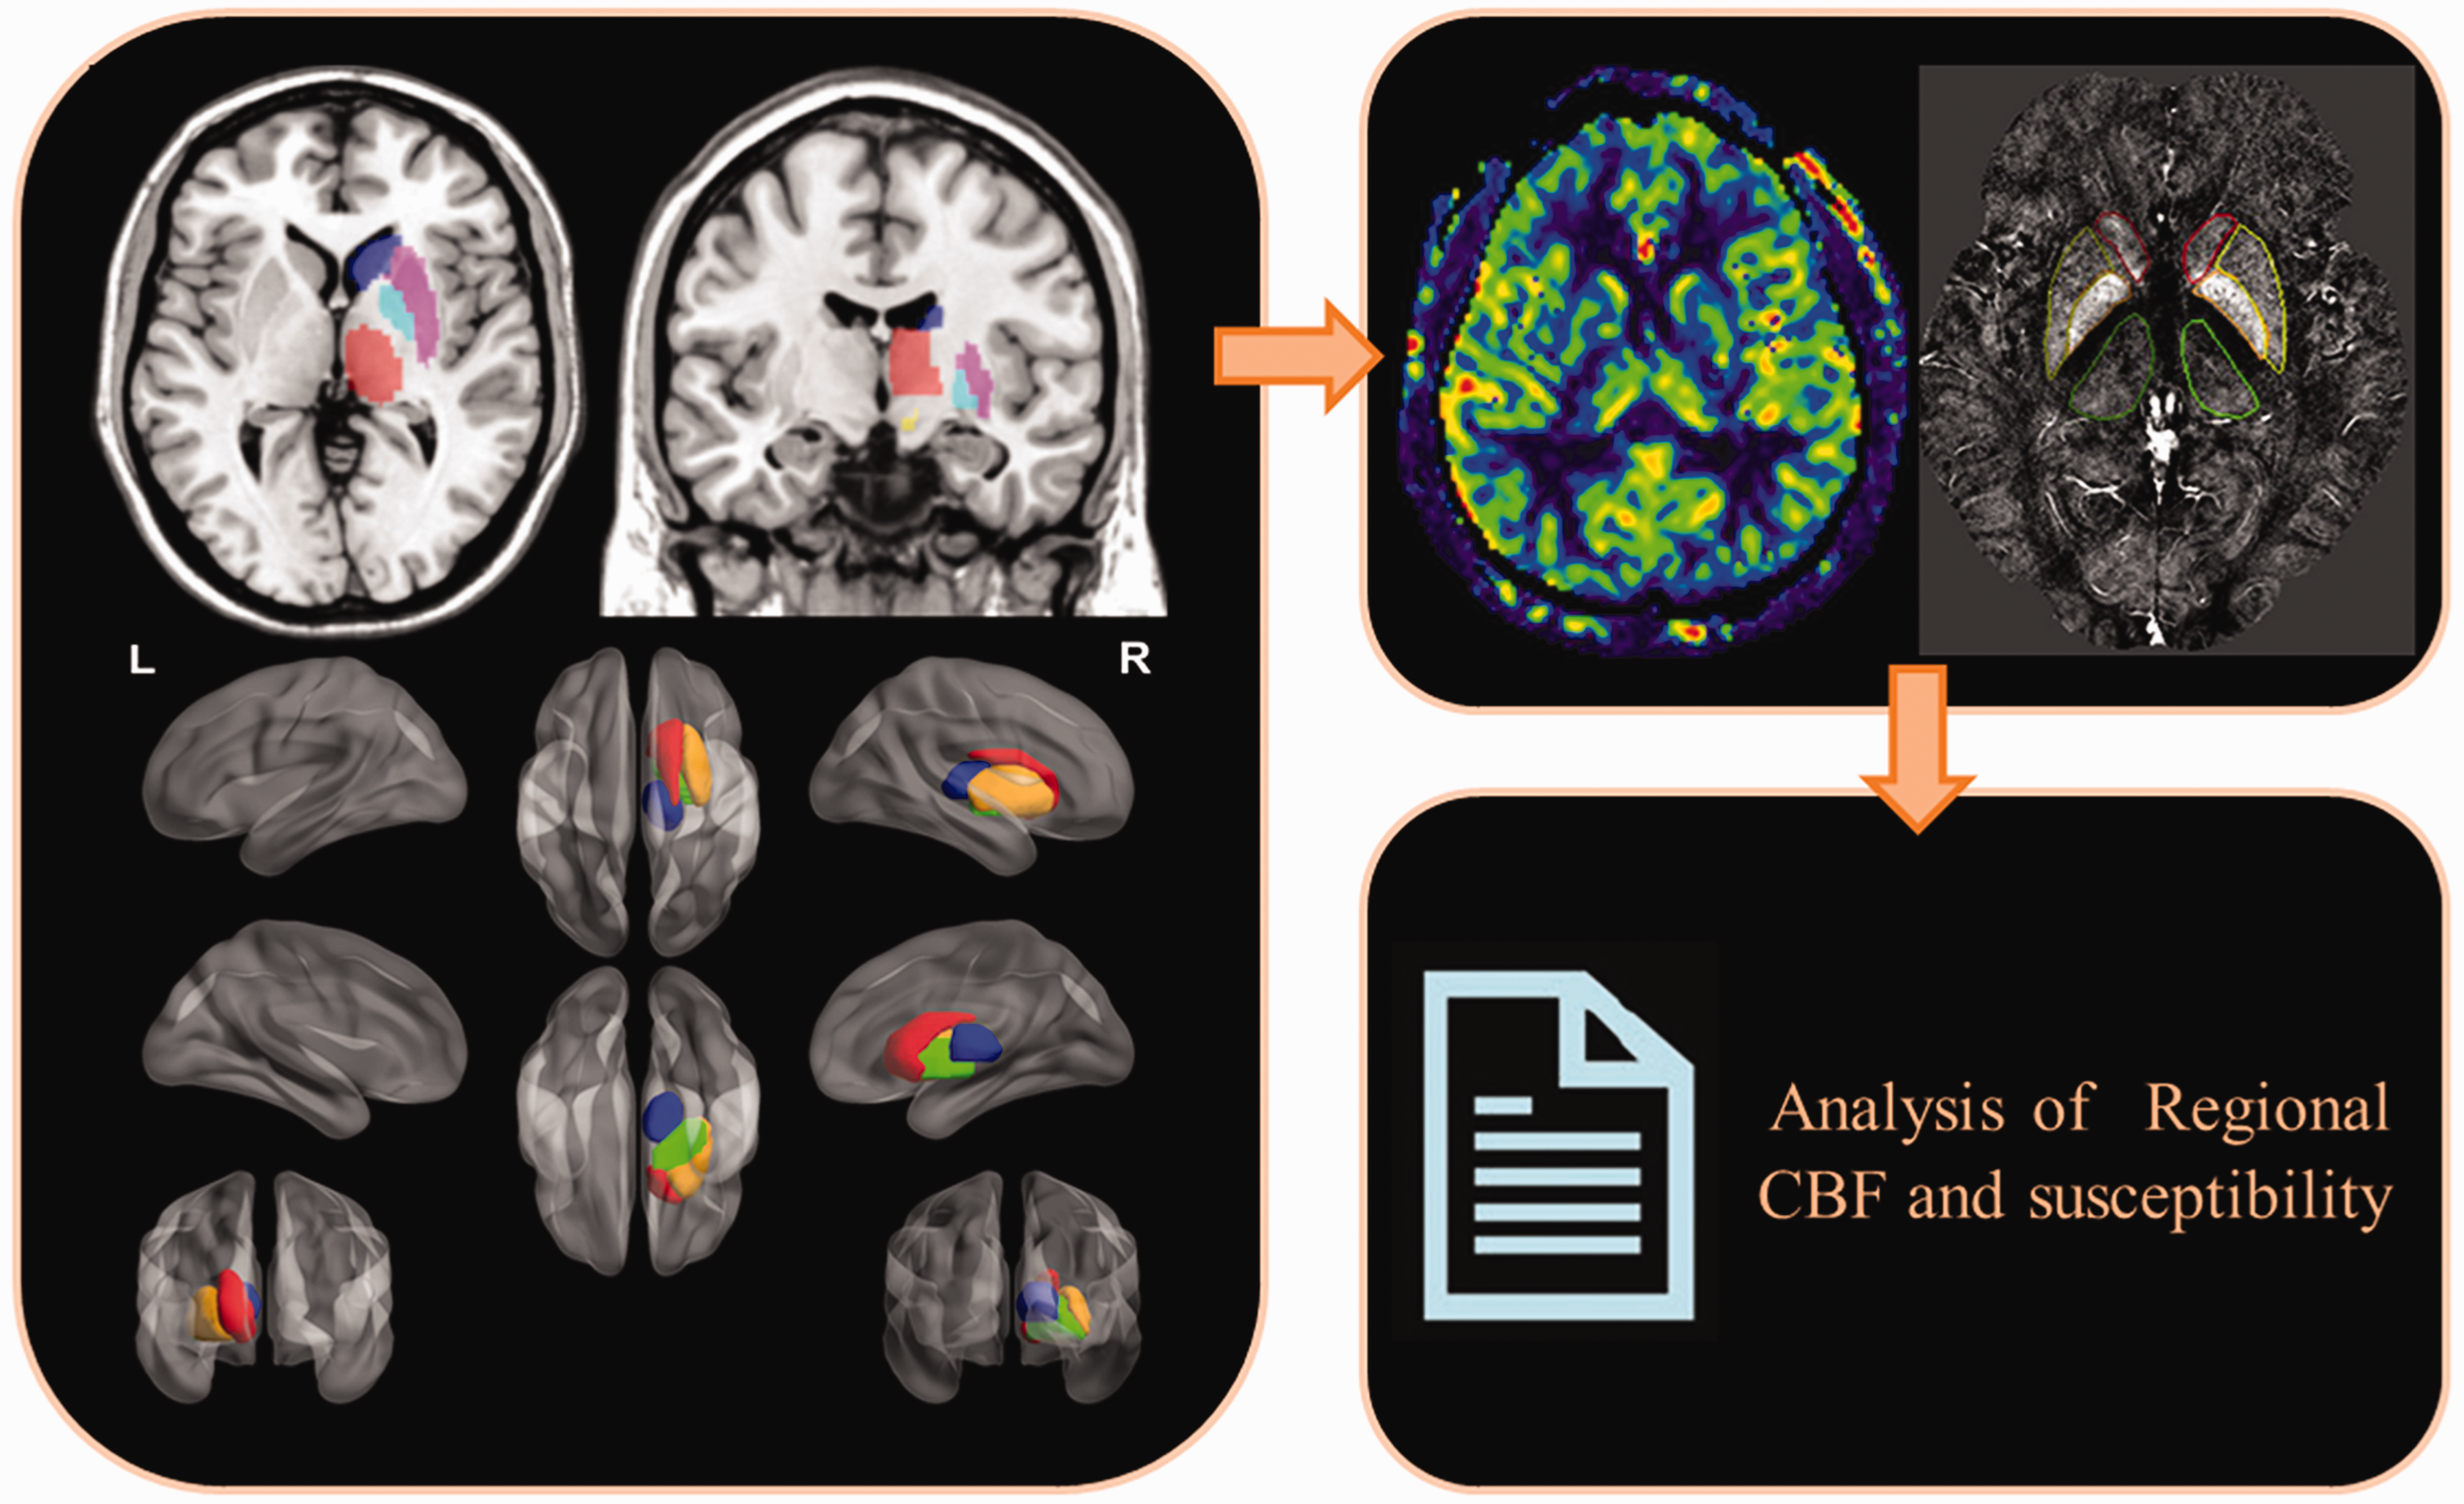
The schematic diagram illustrates the protocol for measuring cerebral blood flow and iron deposition in the cerebral nuclei.
ASL data were processed with the Matlab2010b software (MathWorks, Natick, MA, USA) using the SPM12 Toolbox (https://www.fil.ion.ucl.ac.uk/spm/software/spm12/). The steps of ASL data processing are shown in the Supplementary Materials. To compensate for the atrophy of cerebral nuclei and eliminate partial volume effects, individuals’ cerebral nuclei masks, which were used to measure the individuals’ gray-matter-corrected CBF, were created by applying the inverse transformation matrix from individual T1 structural images to MNI space into probabilistic atlases. The probabilistic atlas included regions of the brain such as bilateral CA, GP, PUT, THA, SN, RN, and DN. The mean and standard deviation of CBF for the cerebral nuclei was measured as ml/100g/min. After one month, 16 HCs agreed to undergo a second follow-up ASL scanning to verify the repeatability, whereas the remaining HCs refused.
The effects of cerebral small vessel disease (CSVD) on ID and CBF were analyzed by estimating lacunar infarction (LI), cerebral microbleeds (CMBs), and white matter hyperintensity (WMH) volume in the hemodialysis patients using MRI.24,25 The details of the methods and the definitions are listed in the Supplementary Materials. Since cerebral volume can influence ID and CBF measurements, the mean and standard deviation values of the total intracranial volume (TIV) for all the study subjects were recorded after performing corrections to age and gender. 3D T1-MPRAGE was performed with voxel-based morphometry (VBM) analysis using CAT12 Toolbox (Computational Anatomy Toolbox, C. Gaser, Structural Brain Mapping group, Jena University Hospital, Jena, Germany) running on Matlab2010b. The postprocessing steps are described in the Supplementary Materials. The TIV was presented with the mean value and standard deviation.
Statistical analysis
Statistical analysis was performed with the SPSS software (IBM SPSS Inc., Chicago, IL, USA) and the Matlab2010b software (MathWorks, Natick, MA, USA). In order to investigate the reliability and reproducibility of QSM and ASL, Pearson’s correlation analysis was performed between the susceptibility value of cerebral nuclei of HCs in our study and iron concentrations of cerebral nuclei reported in the post-mortem tissues, 23 and between the CBF of cerebral nuclei of HCs in our study and those values reported in the previous studies. 26 The intra-reader interclass correlation coefficients (ICCs) and the coefficients of variation were calculated to measure inter-rater reliability and intra-reader reproducibility. Kolmogorov-Smirnov test was used to assess the normal distribution of data. The differences in age, gender, and TIV between the hemodialysis patients and HCs were analyzed by the two independent samples t-test and the Chi-square test. The Mann-Whitney test was used to evaluate the difference in education levels between hemodialysis patients and the HCs.
The differences in the ID and CBF values of the cerebral nuclei between the hemodialysis patients and the HCs were evaluated by the two independent samples t-test after adjusting for age, gender, and TIV. The relationship between the ID and CBF values of the cerebral nuclei in the hemodialysis patients was evaluated by the partial correlation analysis after adjusting for age, gender, and TIV. Multiple stepwise regression analysis was performed to identify the clinical risk factors (biomedical parameters and CSVD) for ID and CBF in hemodialysis patients. A false discovery rate (FDR) corrected P < 0.05 was considered statistically significant for the multiple comparisons in the analysis mentioned above.
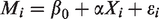
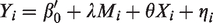
Mediation analysis was used to investigate the potential inner relationship between the clinical risk factors, CBF, and cerebral ID in hemodialysis patients. In the mediating model, the clinical risk factors, CBF, and cerebral ID were classified as the predictor, mediator, and outcome, respectively. The mediation analysis was performed with the PROCESS macro for SPSS.27,28 The mediation analysis was performed based on the following two linear mixed-effects (LME) models.
27
Post-hoc power analysis was conducted to calculate the sample size with 80% power and a 5% significance level. 29
Results
Basic characteristics of the study subjects
Fifty-two hemodialysis patients at the Department of Hemodialysis were enrolled between September 15, 2012, and May 17, 2015, for this study. Based on these inclusion and exclusion criteria, five patients with the motion artifacts in SWI, four patients with head motion greater than 1.0° or 1.0 mm, two patients with a subarachnoid cyst, three patients with a cavernous hemangioma or arteriovenous malformation, and five patients with hepatitis were excluded. Finally, 33 hemodialysis patients were included in the analysis (Supplementary Figure 1). The duration of hemodialysis for the enrolled patients was 34.9 ± 27.6 months. The flowchart of enrollment and etiologies of the recruited 33 hemodialysis patients was shown in Supplementary Figure 1. The patients underwent hemodialysis using the Fresenius 4008 s Hemodialysis Machine (Fresenius SE & Co. KGaA, Bad Homburg, Germany) for 4 hours in each session, three times a week. The patients were intravenously injected with 100 mg iron agent one or two times a week because of renal anemia. Thirty-three age-, gender- and education-matched HCs were enrolled from the general community by advertisement.
The clinical information of the hemodialysis patients and HCs are shown in Table 1. The mean age was similar between the hemodialysis patients and the HCs (44.7 ± 12.0 years, range: 26 to 63 years vs. 46.4 ± 12.4 years, range: 25 to 70 years; P = 0.563). The gender distribution was also similar between the hemodialysis patients and the HCs (male: female, 20:13 vs. 22:11; P = 0.609). Furthermore, no significant differences were observed in the number of years of education between the hemodialysis patients and the HCs (mean education levels, 14 years (13, 15) vs. 14 years (11, 15); P = 0.872). The TIVs of the hemodialysis patients and the HCs were similar (1502.2 ± 118.7 vs.1520.9 ± 167.4; FDR corrected P-value = 0.601). The inter-rater and intra-reader reliability was significantly high for ID and CBF measurements (0.723–0.999) (Supplementary Table 2 and Table 3).
Demographic and clinical data of the hemodialysis patients and healthy controls.
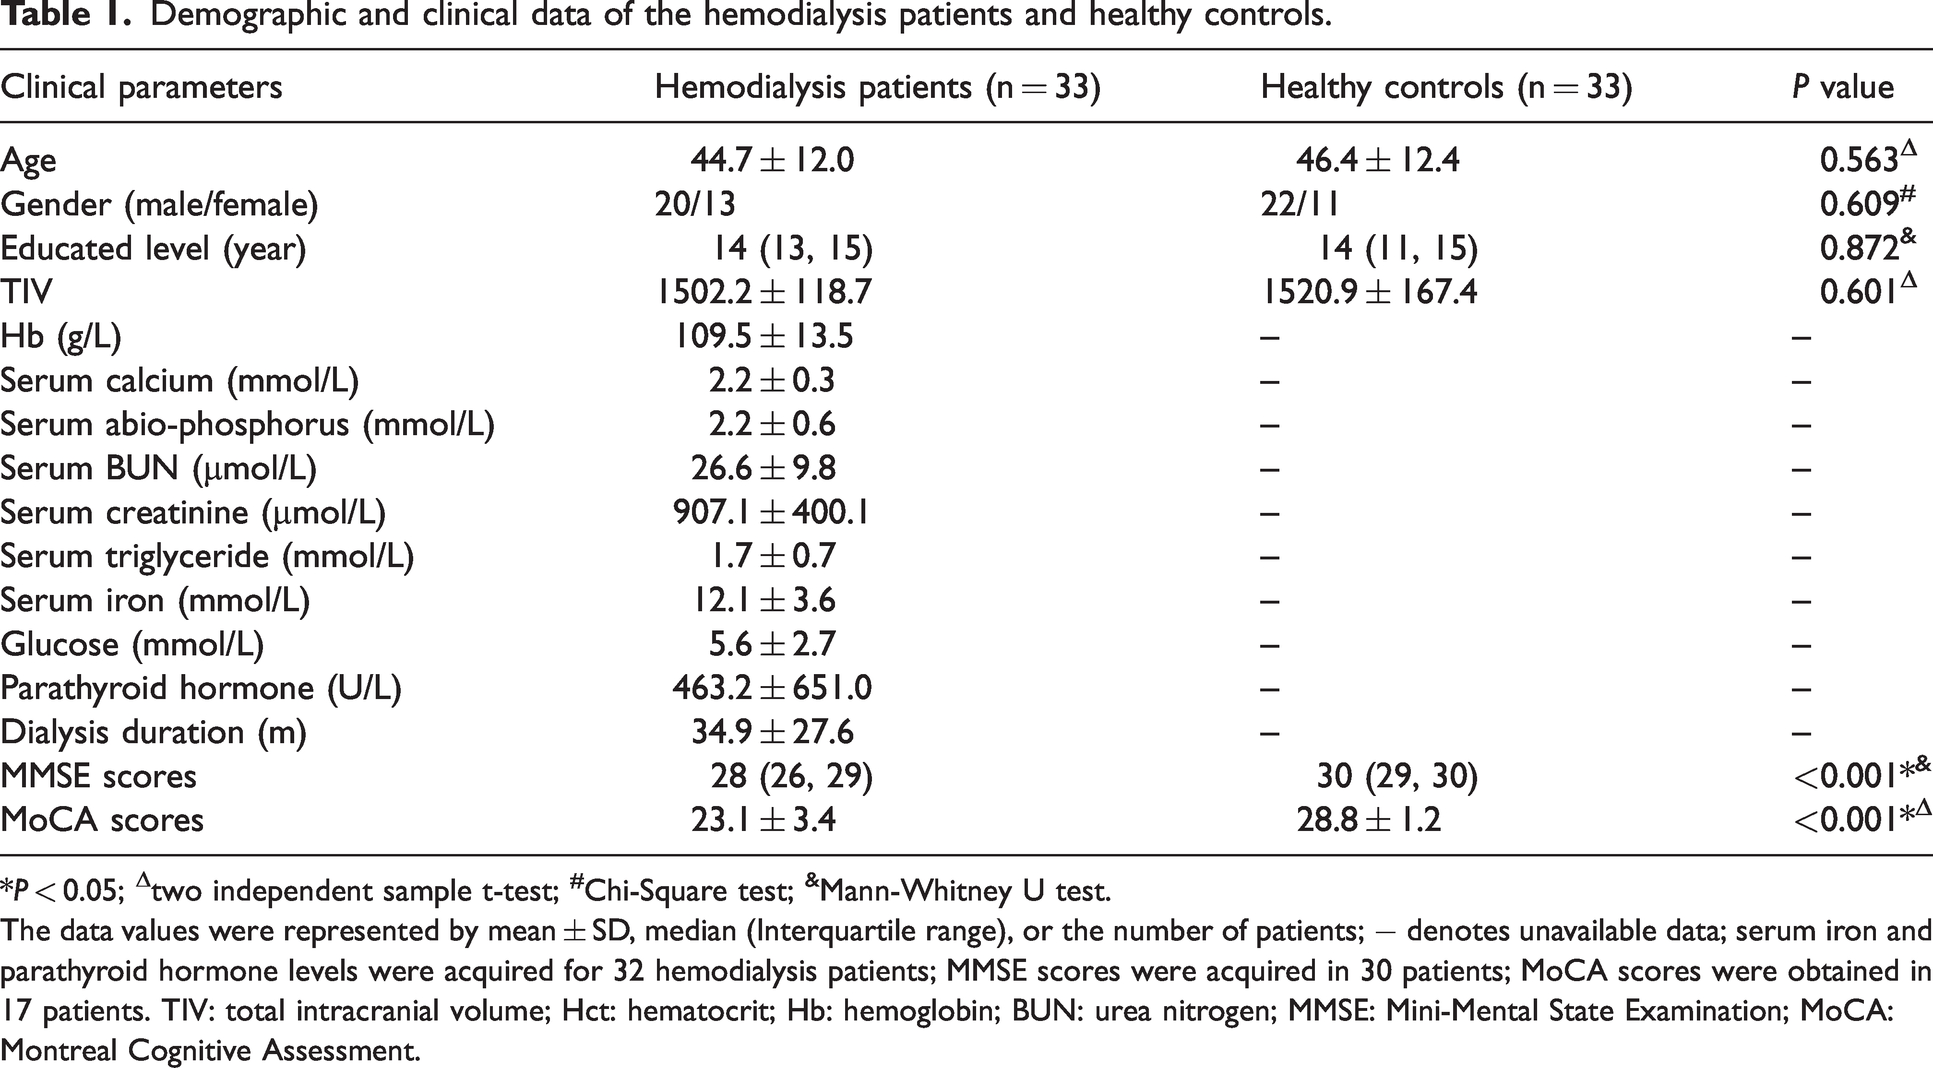
*P < 0.05; Δtwo independent sample t-test; #Chi-Square test; &Mann-Whitney U test.
The data values were represented by mean ± SD, median (Interquartile range), or the number of patients; − denotes unavailable data; serum iron and parathyroid hormone levels were acquired for 32 hemodialysis patients; MMSE scores were acquired in 30 patients; MoCA scores were obtained in 17 patients. TIV: total intracranial volume; Hct: hematocrit; Hb: hemoglobin; BUN: urea nitrogen; MMSE: Mini-Mental State Examination; MoCA: Montreal Cognitive Assessment.
Reliability analysis of QSM and ASL
The normal CBF range (from 29.5 to 66 ml/100 g/min) of the gray matter nuclei of HCs in our study was consistent with the normal range (from13.4 to 66.7 ml/100 g/min) of CBF value reported in some studies26,30,31 The normal range (2.1 to 98.7 ppb) of susceptibility value of gray matter nuclei was also consistent with the normal range (2.5 to 121.1 ppb) reported in the previous studies.32–35
The susceptibility values of gray matter nuclei in HCs of our study were significantly correlated with iron concentrations of nuclei of post-mortem cerebral tissues reported in previous study (r = 0.875; P = 0.01)23 (Supplementary Figure 2). The CBF of gray matter nuclei in HCs (all the subjects, men, and women) of our study were significantly correlated with those reported in the previous study 26 (all the subjects: r = 0.934; P = 0.001; men: r = 0.932; P = 0.01; women: r = 0.921; P = 0.01) (Supplementary Figure 3).
The intrarater interclass correlation coefficients (ICCs) for two measurement of susceptibility of all the cerebral nuclei by the radiologist (C.C.) were 0.990-0.999. The interrater ICCs for two measurement of susceptibility between two radiologists (C.C. and H.Y.W.) were 0.992-0.999 (Supplementary Table 1). The ICCs for two measurement of CBF were 0.723–0.978 (Supplementary Table 2).
Post hoc sample size analysis
Based on the maximal coefficient of variation value of 4.86% (range 1.52 to 4.86%) in our reproducibility analysis, to detect 5% difference in susceptibility values of gray matter nuclei, the required most sample sizes of two groups was 40 (80% power, 0.05 significance), which was smaller than ours (n = 66 for two groups); to detect 7.5% and 10% difference, the required sample size was 18 and 10, respectively. As the differences between groups in our results were mostly >5%, our study had a sufficient sample size to draw safe conclusions.
Comparison of iron and CBF between patients and HCs
The susceptibility values for the bilateral CA, SN, RN, DN, and RPUT were significantly higher in the hemodialysis patients compared to the HCs after adjusting for age, gender, and TIVs (P < 0.05, FDR corrected) (Table 2). Furthermore, CBF was significantly higher in the bilateral PUT, THA, and RGP of the hemodialysis patients compared with the HCs after adjusting for age, gender, and TIVs (P < 0.05, FDR corrected) (Table 2).
Susceptibility values and CBF in the cerebral nuclei of the hemodialysis patients and healthy controls.
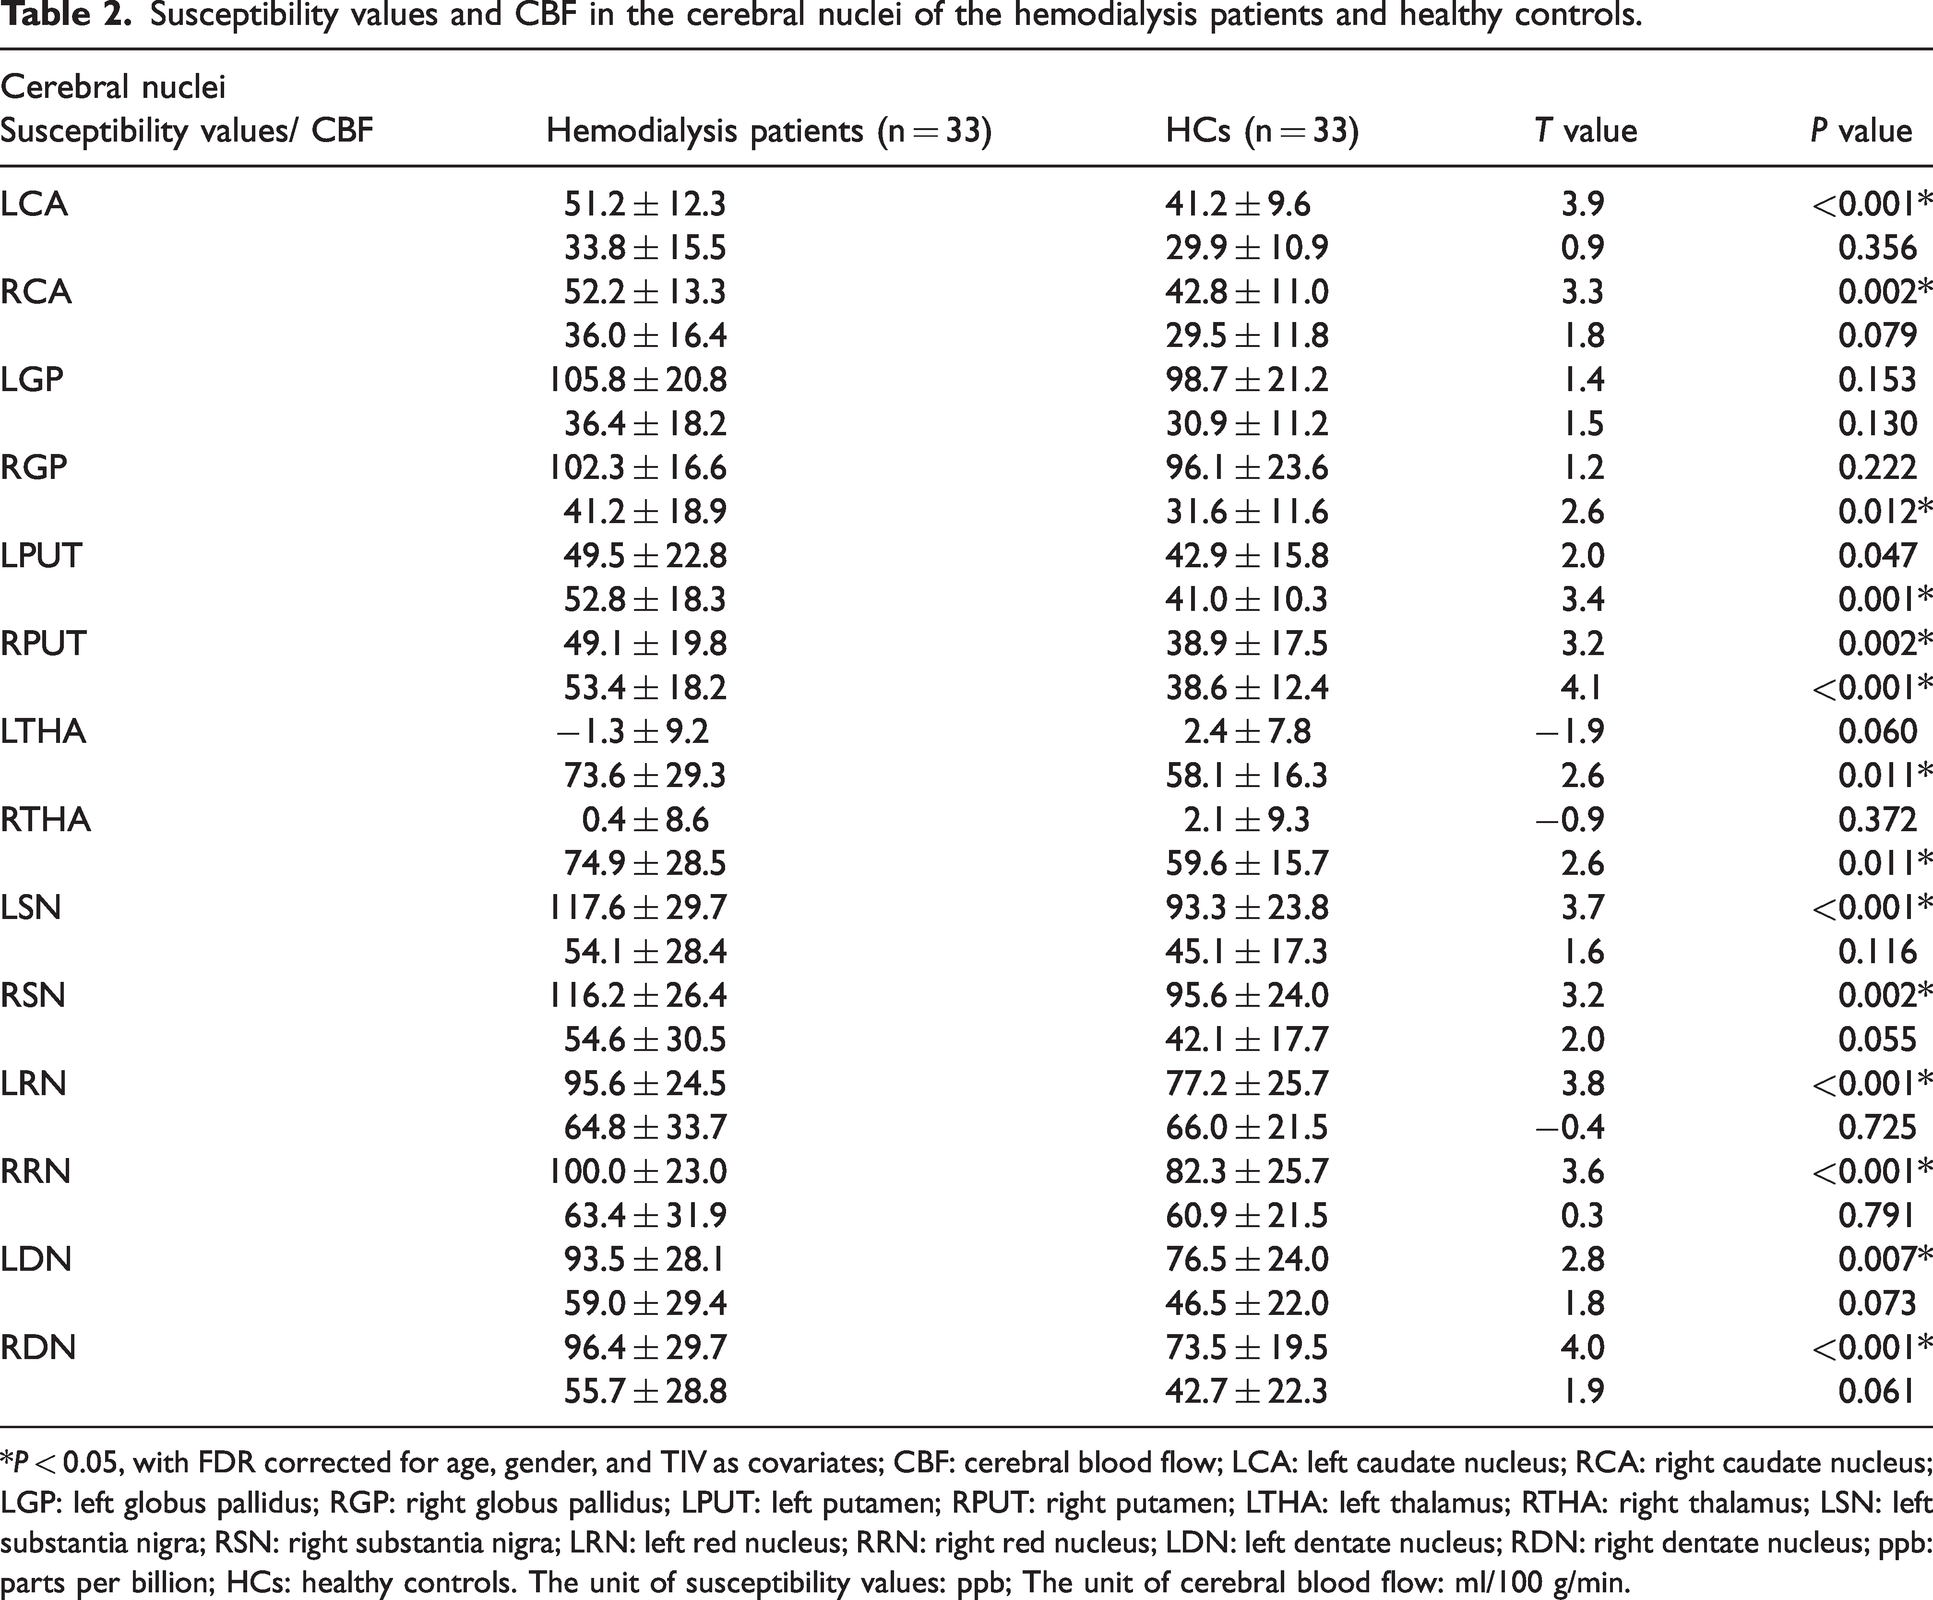
*P < 0.05, with FDR corrected for age, gender, and TIV as covariates; CBF: cerebral blood flow; LCA: left caudate nucleus; RCA: right caudate nucleus; LGP: left globus pallidus; RGP: right globus pallidus; LPUT: left putamen; RPUT: right putamen; LTHA: left thalamus; RTHA: right thalamus; LSN: left substantia nigra; RSN: right substantia nigra; LRN: left red nucleus; RRN: right red nucleus; LDN: left dentate nucleus; RDN: right dentate nucleus; ppb: parts per billion; HCs: healthy controls. The unit of susceptibility values: ppb; The unit of cerebral blood flow: ml/100 g/min.
Cerebral iron deposition correlates with cerebral blood flow in both HCs and hemodialysis patients
In the HCs, ID showed a positive correlation with CBF in the RCA (r = 0.382, PFDR = 0.037), LPUT (r = 0.569, PFDR = 0.001), and RPUT (r = 0.426, PFDR = 0.019) after adjusting for age, gender, and the TIVs (Figure 2(a) to (c)). In the hemodialysis patients, ID showed a positive correlation with the CBF in the LCA (r = 0.511, PFDR = 0.004), RCA (r = 0.517, PFDR = 0.002), and RPUT (r = 0.584, PFDR = 0.001) after adjusting for age, gender, and the TIVs (Figure 2(d) to (f)). Furthermore, we calculated the mean ID and CBF of the bilateral cerebral nuclei and observed positive correlation in the HCs between ID and CBF in the CA (r = 0.351, PFDR = 0.049) and PUT (r = 0.565, PFDR = 0.001) after adjusting for age, gender, and the TIVs (Figure 2(g) and (h)). Moreover, in the hemodialysis patients, mean ID showed a positive correlation with the CBF in the CA after adjusting for age, gender, and the TIVs (r = 0.458, PFDR = 0.007) (Figure 2(i)).
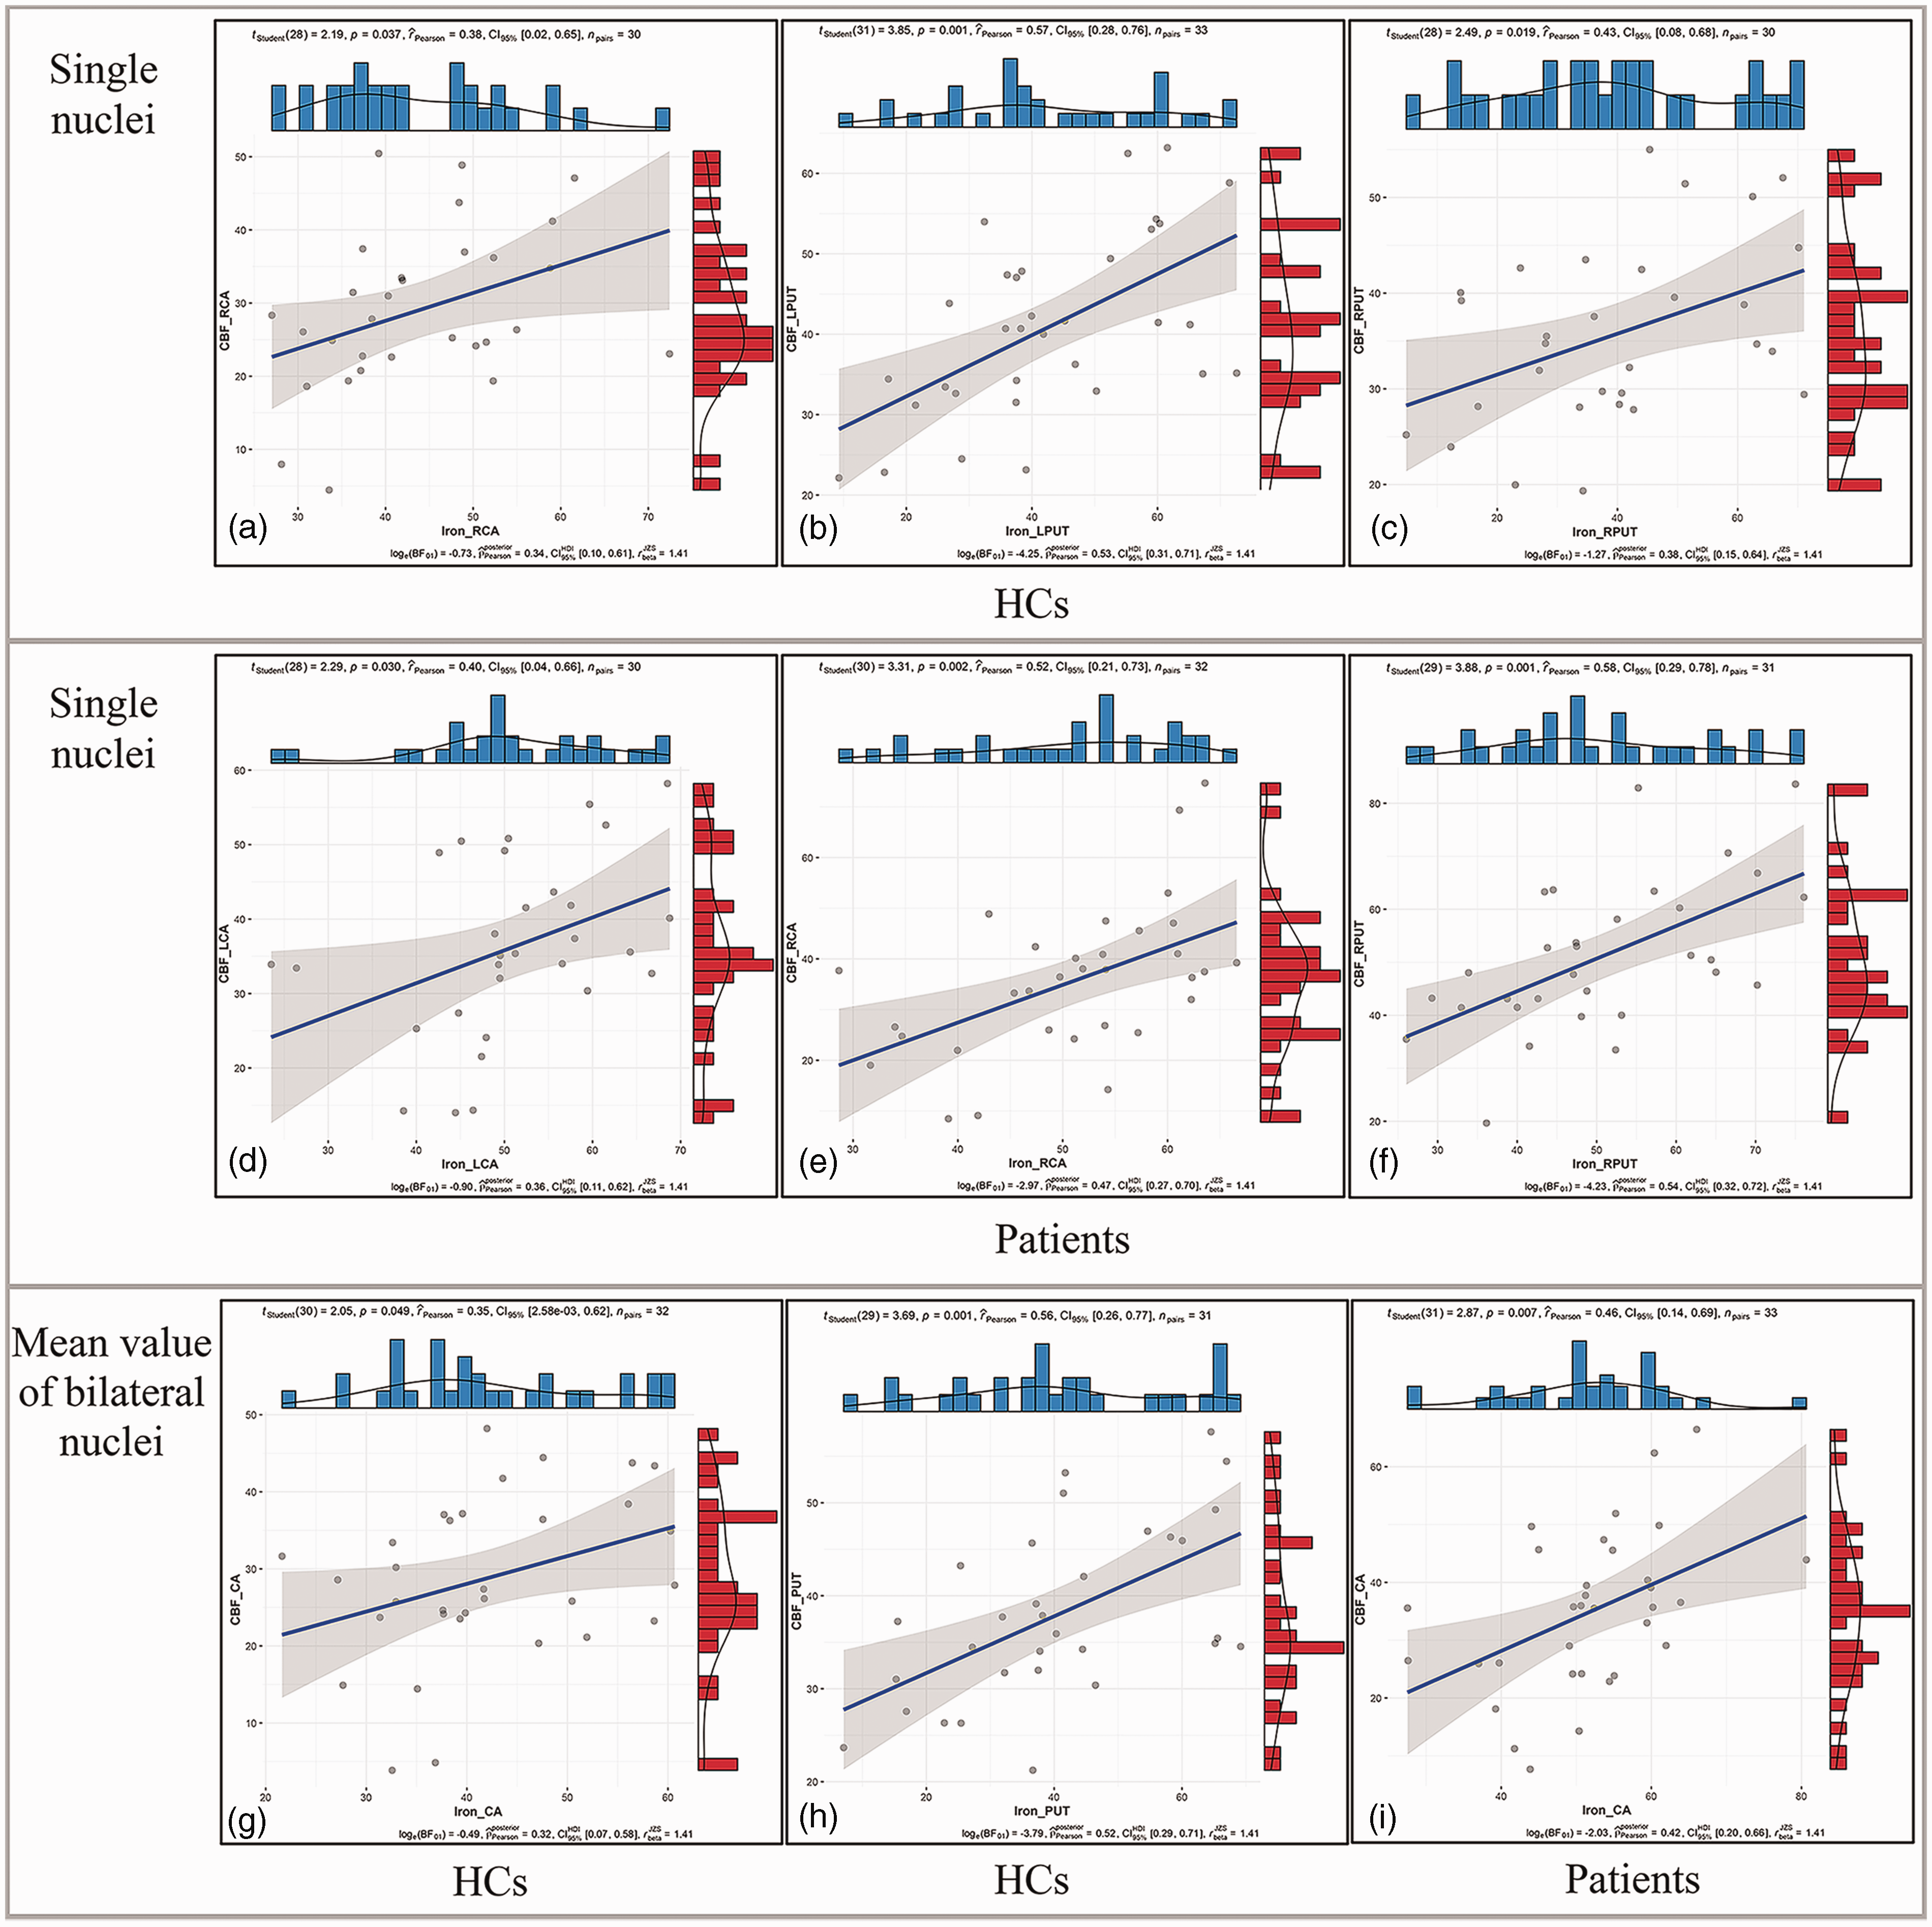
The correlations between susceptibility and CBF in the cerebral nuclei. (a–c) CBF showed positive correlations with susceptibility in the RCA (r = 0.382, PFDR = 0.037), LPUT (r = 0.569, PFDR = 0.001), and RPUT (r = 0.426, PFDR = 0.019) of the HCs (FDR corrected) after adjusting for age, gender, and the TIVs. (d–f) CBF showed positive correlations with susceptibility in the LCA (r = 0.511, PFDR = 0.004), RCA (r = 0.517, PFDR = 0.002) and RPUT (r = 0.584, PFDR = 0.001) of the hemodialysis patients after adjusting for age, gender, and the TIVs. (g and h) Mean susceptibility showed positive correlation with CBF in the CA (r = 0.351, PFDR = 0.049) and PUT (r = 0.565, PFDR = 0.001) of HCs after adjusting for age, gender, and the TIVs. (i) CBF showed positive correlations with mean susceptibility in the CA of hemodialysis patients after adjusting for age, gender, and the TIVs (r = 0.458, PFDR = 0.007).
Identification of clinical risk factors for the cerebral iron deposition and CBF in the hemodialysis patients
The independent predictive factors for the ID and CBF of cerebral nuclei in hemodialysis patients are shown in Tables 3 and 4. Total white matter hyperintensity volume (TWMHV), hypertension, serum phosphorus, serum calcium, and duration of dialysis were independent predictive factors for the ID of cerebral nuclei (all P < 0.05, FDR corrected). The variance inflation factor (VIF) ranged from 1.000 to 1.017. This indicated the absence of multicollinearity between the independent variables in the multiple stepwise regression analysis. Lacunar infarction (LI), Hb, and serum phosphorus were independent predictive factors for CBF (all P < 0.05, FDR corrected). The VIF ranged from 1.000 to 1.030. This indicated the absence of multicollinearity among the independent variables.
The risk factors for iron deposition in hemodialysis patients using the stepwise multiple regression analysis.
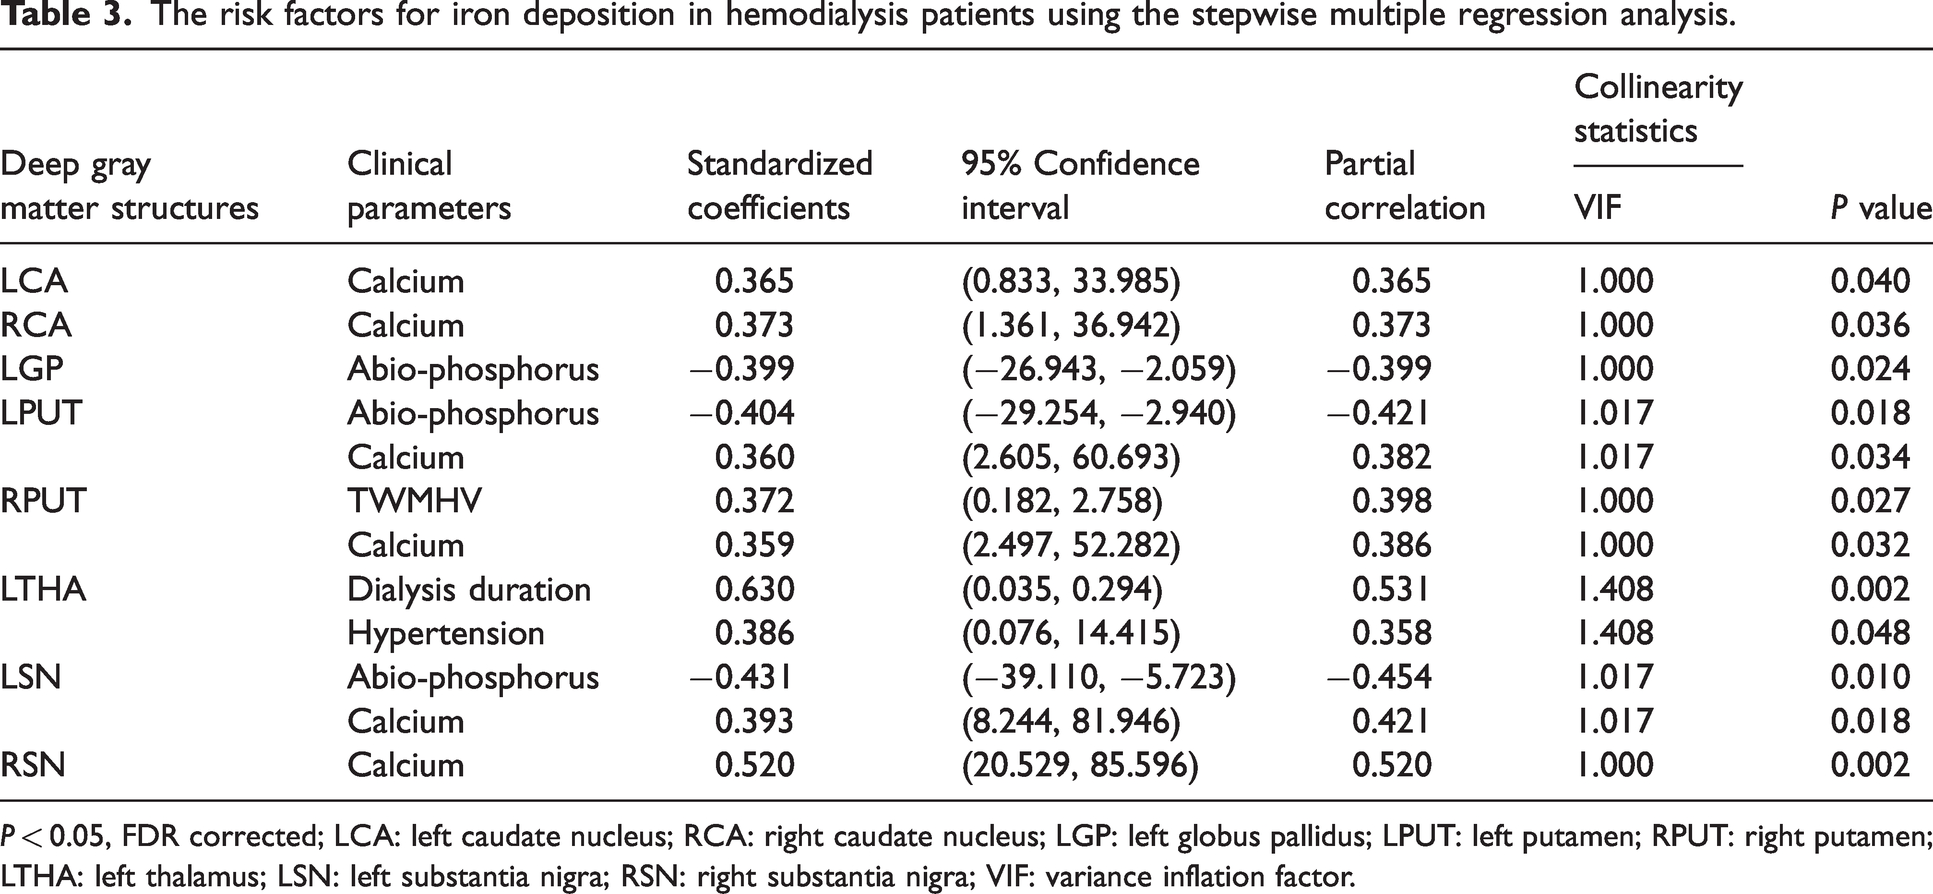
P < 0.05, FDR corrected; LCA: left caudate nucleus; RCA: right caudate nucleus; LGP: left globus pallidus; LPUT: left putamen; RPUT: right putamen; LTHA: left thalamus; LSN: left substantia nigra; RSN: right substantia nigra; VIF: variance inflation factor.
The risk factors for CBF in the hemodialysis patients using the stepwise multiple regression analysis.
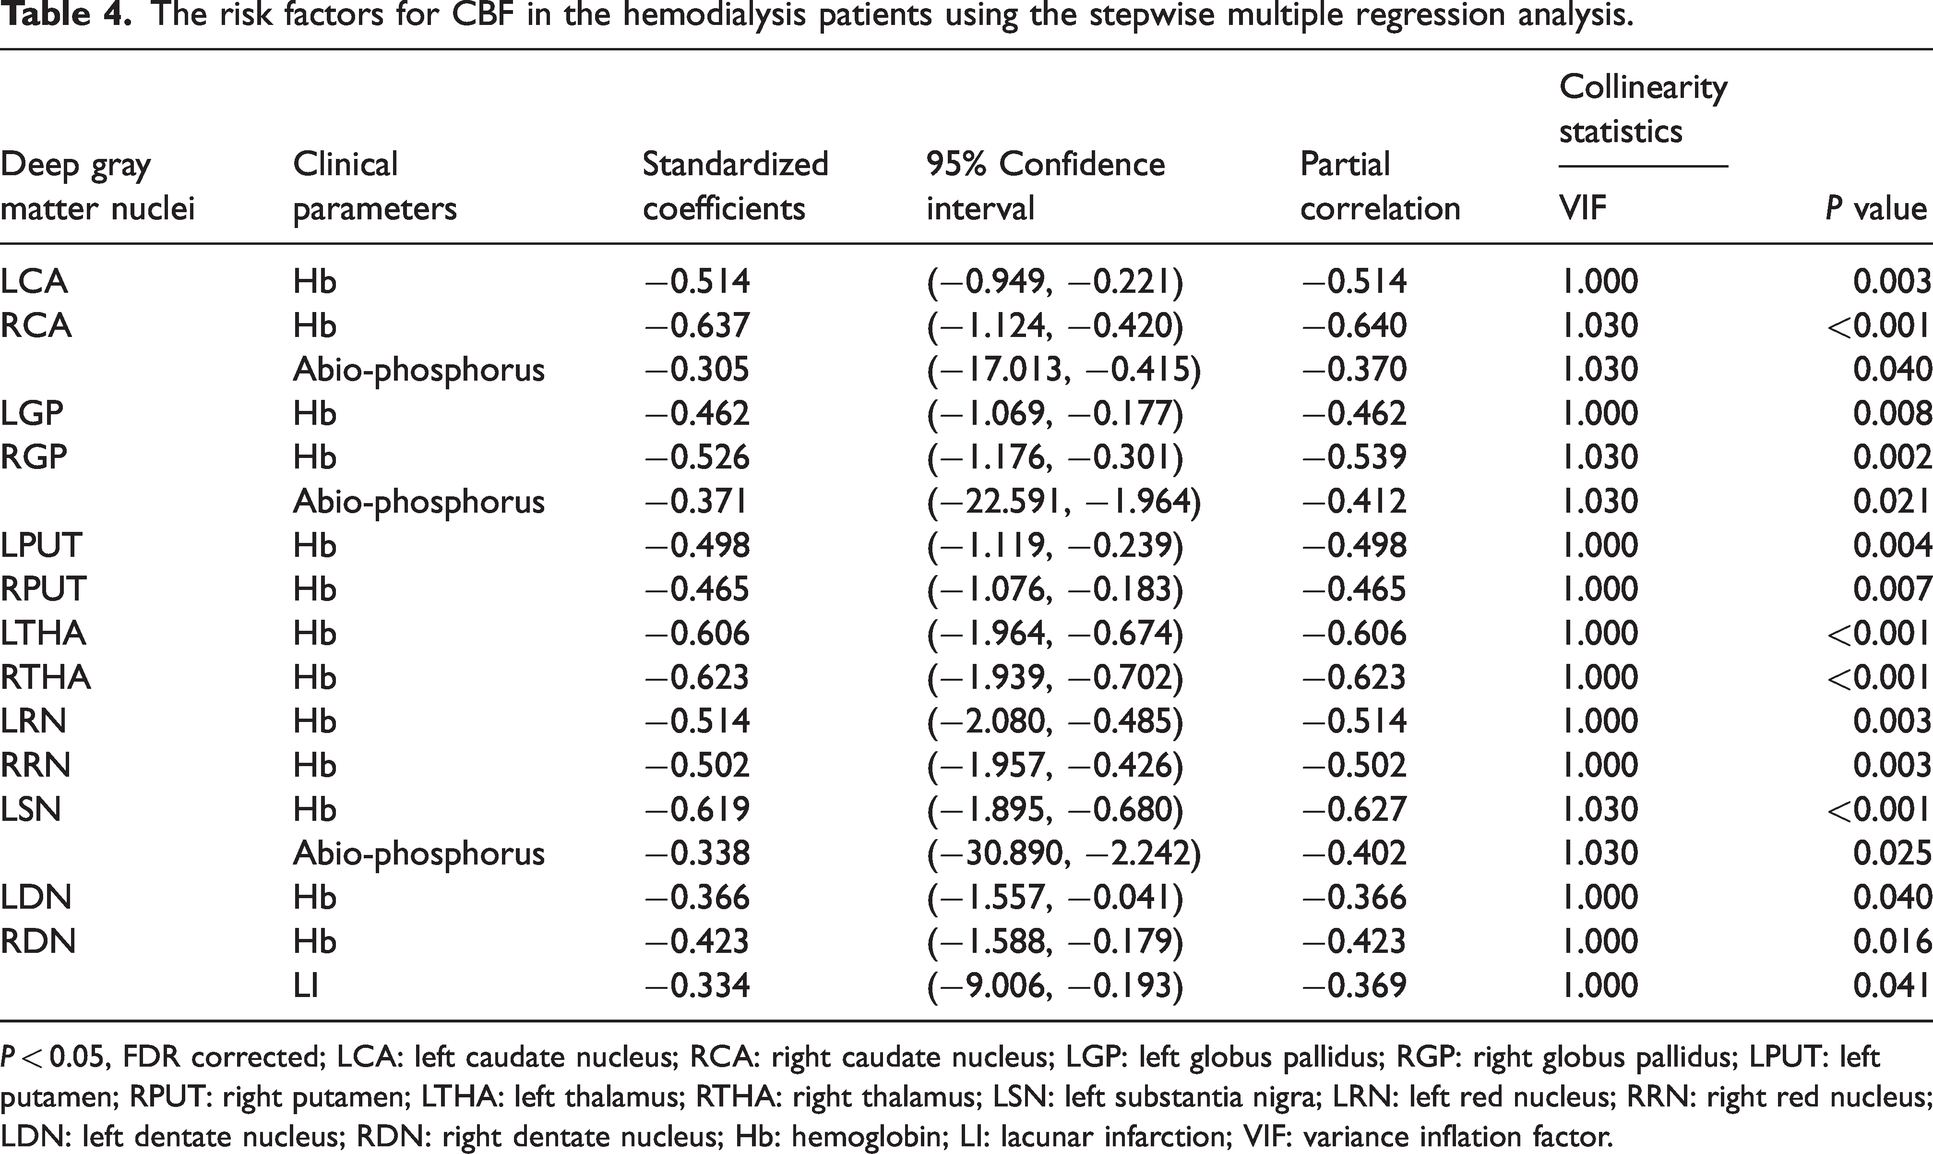
P < 0.05, FDR corrected; LCA: left caudate nucleus; RCA: right caudate nucleus; LGP: left globus pallidus; RGP: right globus pallidus; LPUT: left putamen; RPUT: right putamen; LTHA: left thalamus; RTHA: right thalamus; LSN: left substantia nigra; LRN: left red nucleus; RRN: right red nucleus; LDN: left dentate nucleus; RDN: right dentate nucleus; Hb: hemoglobin; LI: lacunar infarction; VIF: variance inflation factor.
CBF mediates the association between anemia and cerebral iron deposition in the hemodialysis patients
Mediation analysis (listed in Supplementary Materials) was performed with the clinical risk factors (biomedical parameters and CSVD) as candidate predictors, CBF as the mediator, and cerebral ID as the outcome. Mediation analysis results showed correlation between Hb and CBF of RCA (a = −0.568, 95%CI: −0.934 to −0.215; P = 0.001). This demonstrated a direct effect of the predictor on the mediator. CBF of RCA was associated with ID of RCA after controlling for Hb (b = 0.638, 95%CI: 0.245 to 1.044; P = 0.002). This demonstrated a direct effect of the mediator on the outcome after controlling for the predictor. Moreover, Hb correlated with the ID of RCA after controlling for the CBF of RCA (c′ = 0.499, 95%CI: 0.046 to 0.933; P = 0.012). This demonstrated direct effect of the predictor on the outcome after controlling for mediator. However, Hb did not show significant association with the ID of RCA without controlling for the CBF (c = 0.137, 95%CI: −0.314 to 0.578; P = 0.448). This implied the direct effect of the predictor on the outcome. The mediation analysis results showed that the mediated effect (a × b) was equal to c-c,′ and the opposite signs for the direct effect (c) and mediated effect (a × b) of Hb on ID suggested a full mediation effect of CBF. 36
Furthermore, Hb was significantly correlated with CBF in the RPUT (aRPUT = −0.463, 95%CI: −0.784 to −0.112; P = 0.007) and the LSN (aLSN = −0.501, 95%CI: −0.907 to −0.142; P = 0.003). After controlling for Hb, CBF showed significant association with ID of RPUT (bRPUT = 0.510, 95%CI: 0.105 to 1.073; P = 0.009) and ID of LSN (bLSN = 0.478, 95%CI: 0.128 to 0.838; P = 0.013). After controlling for CBF, Hb showed significant correlation with ID of RPUT (c′RPUT = 0.383, 95%CI: 0.033 to 0.752; P = 0.043) and ID of LSN (c′LSN = 0.529, 95%CI: 0.202 to 1.020; P = 0.007). However, without controlling for CBF, Hb did not show any association with ID of RPUT (cRPUT = 0.147, 95%CI: −0.282 to 0.616; P = 0.413) and ID of LSN (cLSN = 0.289, 95%CI: −0.059 to 0.700; P = 0.103).
We also calculated the sum of ID and CBF in all the cerebral nuclei and found correlation between Hb and CBF of all the nuclei (a = −0.606, 95%CI: −10.650 to −2.954; P < 0.001). Furthermore, CBF of all the nuclei showed significant correlation with the ID of all the nuclei after controlling for Hb (b = 0.530, 95%CI: 0.117 to 0.832; P = 0.013). Moreover, Hb showed significant correlation with the ID of all the nuclei after controlling for the CBF of all the nuclei (c′ = 0.558, 95%CI: 1.684 to 9.481; P = 0.09). However, Hb did not show any significant association with ID without controlling for the CBF (c = 0.237, 95%CI: −2.213 to 6.704; P = 0.185). These data demonstrated that CBF mediated the association between Hb and ID. The results were not statistically significant for the mediation analyses when other clinical risk factors (biomedical parameters and CSVD excepting for Hb) were tested as predictors, respectively (all P > 0.05). The schematic diagram of the mediation analysis between Hb, CBF, and cerebral ID is shown in Figure 3.
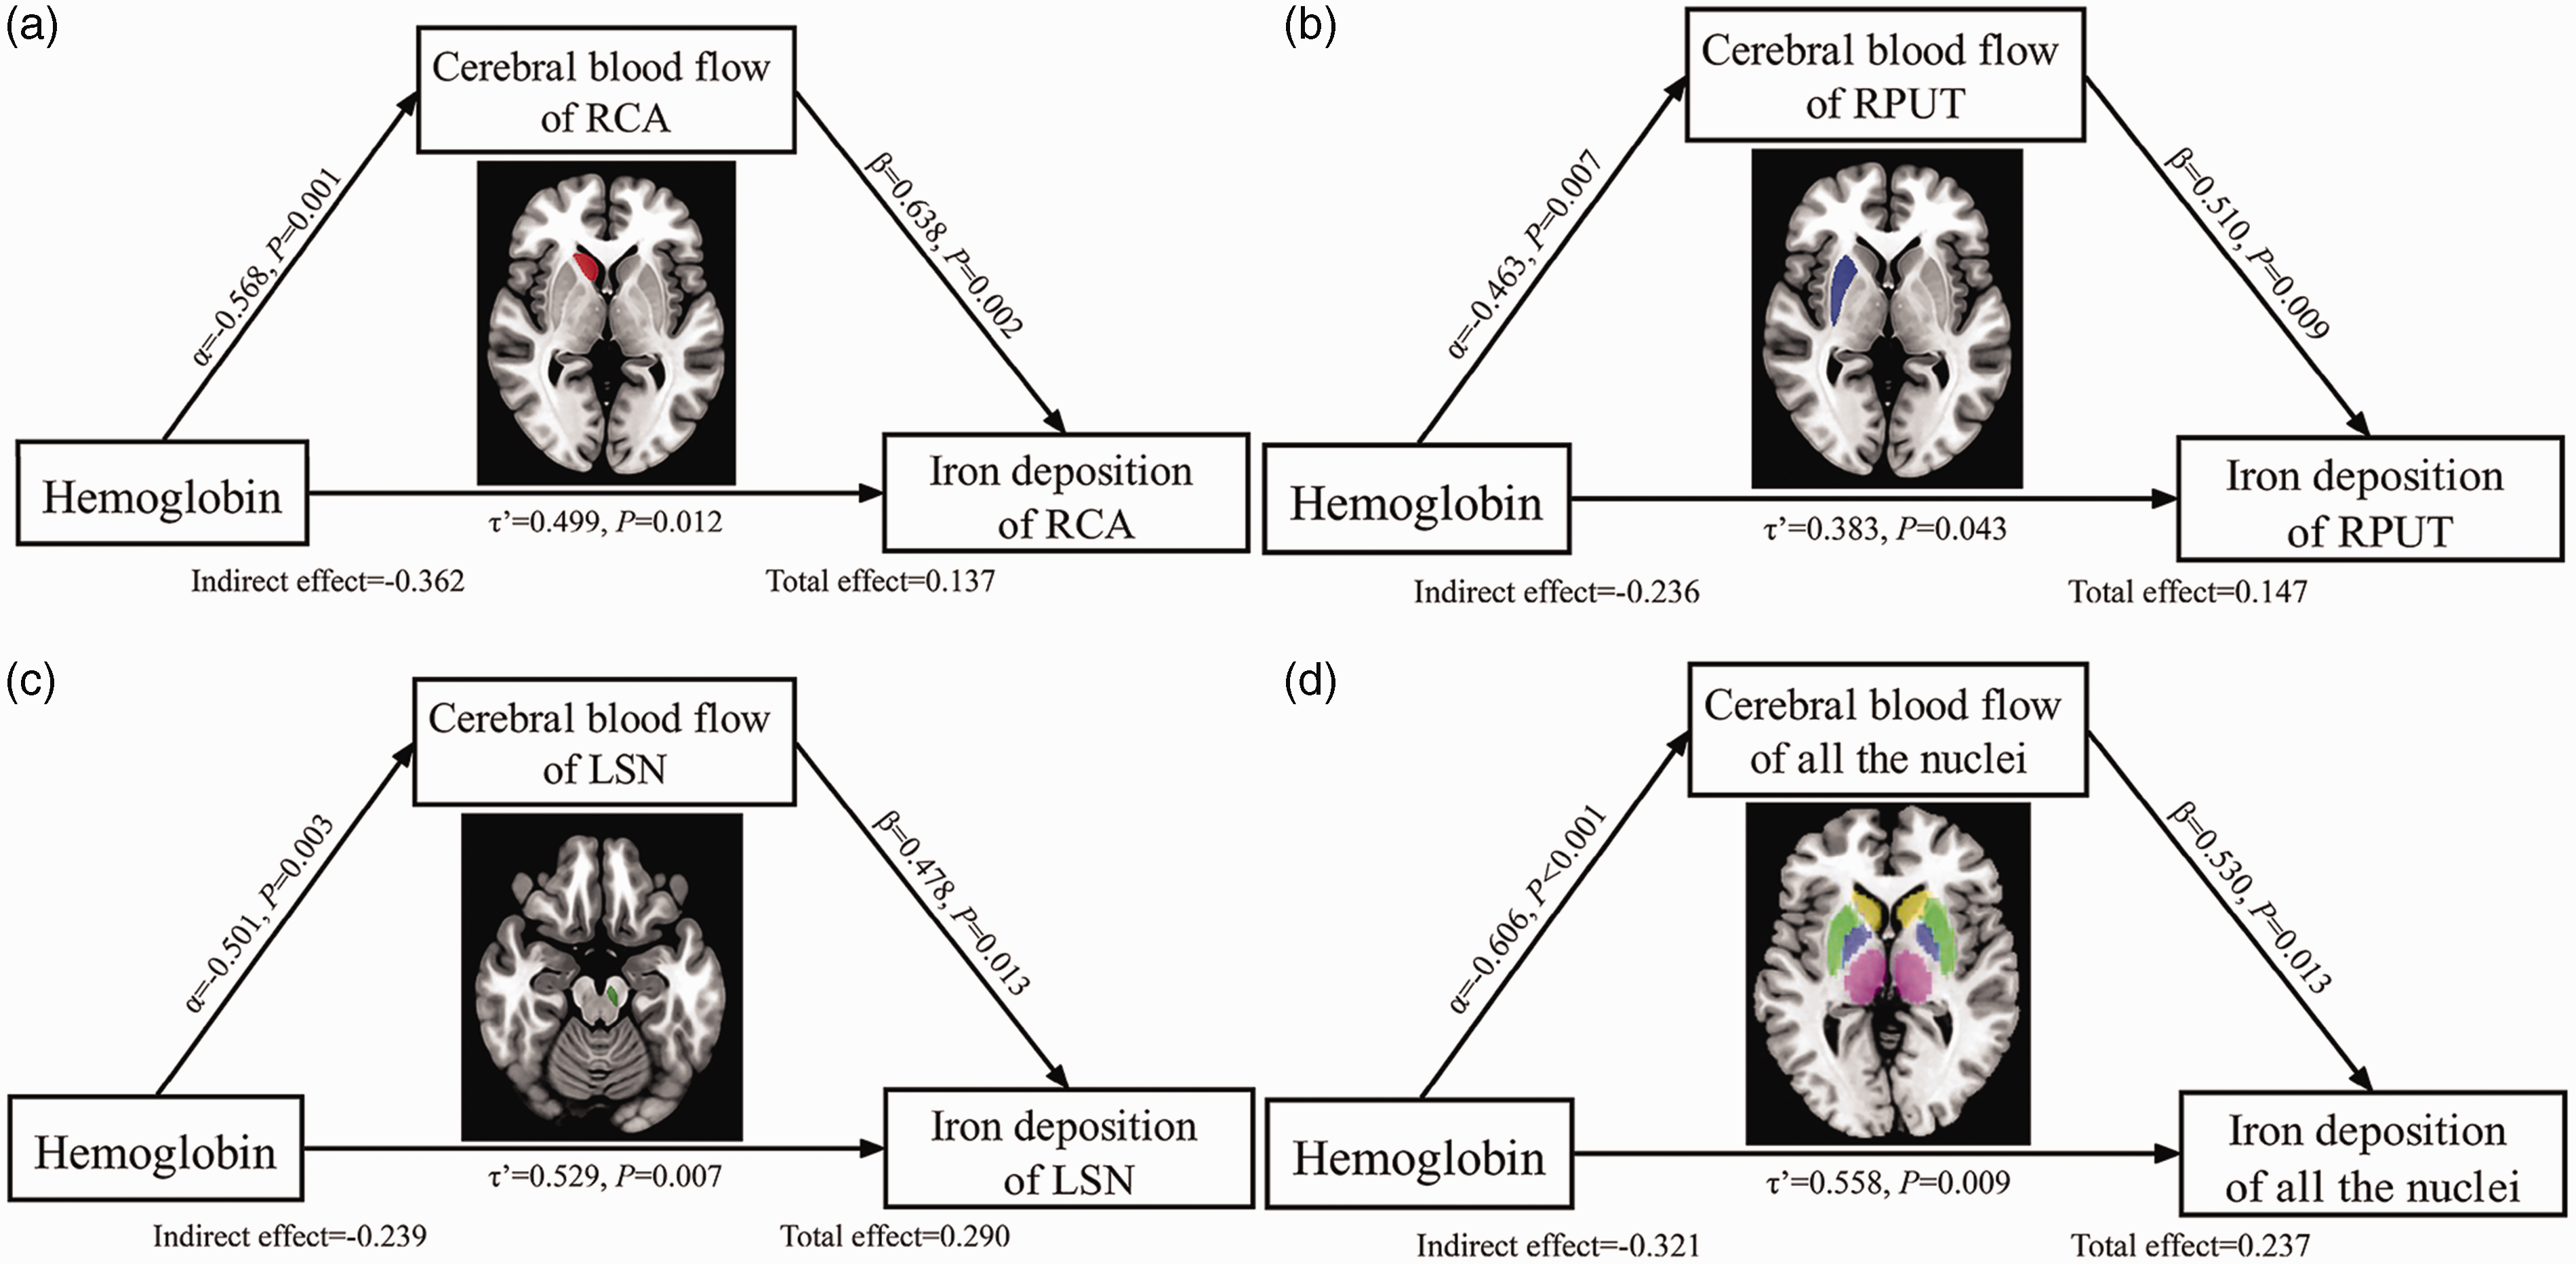
Mediation analysis between Hb, CBF, and iron deposition in the hemodialysis patients. The mediation analysis demonstrated that renal anemia caused by renal failure enhanced CBF, which subsequently increased iron accumulation in the cerebral nuclei of hemodialysis patients who were treated regularly with an intravenous iron supplement. This indicated the inner relationship between Hb, CBF, and cerebral iron deposition.
Discussion
To the best of our knowledge, this is the first study to investigate the potential biological mechanisms underlying cerebral ID in patients undergoing hemodialysis with anemia. Our mediation analysis results showed a negative correlation between lower Hb levels and increased CBF of some cerebral nuclei (RCA, RPUT, LSN). The increased CBF in the RCA, RPUT, and LSN regions showed positive correlations with increased ID. Furthermore, lower Hb levels showed positive correlations with increased ID after controlling the CBF. These findings might demonstrate a potential plausible mechanism for cerebral ID.
The physiological level of iron is usually kept constant, and the intestine maintains homeostasis by strictly regulating iron uptake. 37 Similarly, high oxygen consumption in the brain leads to high demand for iron. 38 Therefore, after the iron is taken up by the gastrointestinal tract, it is subsequently transported into the bloodstream and then deliver into the brain tissues by circulation. The iron can cross the blood brain barrier (BBB) into brain parenchyma in vivo, at the luminal membrane of the endothelial cell by the form of transferrin binds to its receptors 39 Ferritin is stored in microglia and astrocytes of gray matter, especially the subcortical nuclei, because the microglia and astrocytes are the most iron-consumption cells in the brain.20–22 In addition, gray matter nuclei have a high demand for iron to meet energy metabolism which cause iron to be more prone to accumulate in these regions. 19 What’s more, a post-mortem study demonstrated that iron was more prone to deposit into putamen rather than other cortical gray and white matter structures in the healthy human brain. 40 Therefore, the subcortical gray matter nuclei were selected as the region of interest in our study.
The nuances of CBF are affected by many physiological factors, such as sex, age, and Hb in healthy subjects.30,31,41,42 The findings of the studies on the changes of CBF with aging were contrasting. Some studies demonstrated the increased CBF with aging in some brain regions, especially in the middle cingulate gyrus, fusiform, and putamen, etc.31,41 While they also showed decreased CBF with aging in some other brain regions including the bilateral superior frontal gyrus, right middle frontal gyrus, and left superior parietal lobule.31,41 In addition, a recent study found that CBF of the whole brain was higher in women than in men. 30 Therefore, in order to avoid the effect of age and sex, we added age, and sex as covariates in our study. Meanwhile, we also added the TIV as the covariate to eliminate the effect of cerebral volume.
Hb was another important factor affecting CBF42. A previous study demonstrated Hb level was decreased and had a weak negative correlation with age in elder people, although the level of Hb was in the normal range. 42 The slightly decreased amount of Hb compensatively resulted in the slightly increased CBF and increased demand for iron amount because iron has a major role as a critical part of Hb that transports oxygen from the lung to brain tissues. Therefore, the slightly increased CBF might deliver more iron into the brain by physiological regulation. Interestingly, we found positive correlations between ID and CBF in bilateral PUT, RCA, CA, and PUT in the HCs group after adjusting for age, gender, and TIV as covariates. These can validate our above hypothesis. The reason may be that about 80% of the iron in the human body was related to Hb, which was essential for oxygen transport and supply, and the amount of Hb was related to changes in CBF. Meanwhile, the physiological function metabolism of gray matter nuclei required the participation of Hb and iron.19,43 In addition, it has been reported that there was a significant but weak positive correlation between ferritin and cerebral metabolic rate of oxygen, indicating the oxygen metabolism of cerebral tissues demanded the participation of ferritin. 19 When Hb was slightly decreased, the oxygen metabolism of cerebral tissues became weak or not obviously changed. 44 When increased CBF delivered iron into the brain tissues, the iron was excess and unconsumed, which was mainly stored as the form of ferritin in the subcortical nuclei. Therefore, in the healthy subjects, the amount of CBF was also related to the ID in our study.
Our study found increased CBF in bilateral PUT, THA, and RGP in hemodialysis patients compared with HCs. It was similar to the previous findings.45–46 The reason for the increased CBF might be due to renal anemia, the hemodialysis patients had pathologically reduced Hb due to the loss of kidney function. Renal anemia can cause compensatively increased CBF47. We also found that the ID of cerebral nuclei was significantly increased and was also significantly correlated with augmented CBF of cerebral nuclei in hemodialysis patients. The reason might be that: in order to treat anemia, hemodialysis patients regularly intravenously injected iron agents but the iron agent cannot be fully used for the production of erythropoietin because the loss of kidney function cannot be fully cured. 47 The increased CBF can deliver excess unused iron into the cerebral tissues and store as the main form of ferritin in the subcortical nuclei, which caused cerebral iron overload. 23 Furthermore, mediation analysis of our studies also revealed that Hb affects the cerebral ID changes by the inconsistent (suppression) mediated effect of CBF, indicating that the Hb might firstly cause the compensative increases in CBF, subsequently increased CBF cause the increased ID. This further validated the inner relationship among Hb, CBF and cerebral ID.
Positive correlations between ID and CBF occurred in the LCA, RCA, and RPUT of hemodialysis patients and in RCA, LPUT, RPUT of HCs. We noted that significant correlations occurred in the one-sided (right side) and some specific brain regions. The reasons for the right-sided correlations are that: first, previous studies showed that the normal human brain exhibited asymmetries in brain anatomy and function.48–52 Ali Abedelahi et al. 52 demonstrated that normal individuals showed significant rightward asymmetry of brain volume, especially in the CA and PUT regardless of gender difference. The increased ID changes in hemodialysis patients were more obvious in the relatively larger one-sided nuclei, which was consistent with this hypothesis. Second, compared to the left hemisphere, the right side usually had a higher level of hyper-perfusion pattern and cerebral oxygen saturation in the normal right-hand population.53–55 Therefore, the right hemisphere had obvious CBF increases in hemodialysis patients due to renal anemia. So, the significant correlation between ID and CBF increases occurred in the RPUT of hemodialysis patients. Third, some studies found a greater information flow from the right to the left hemisphere which may suggest an important role of the right hemisphere in the resting state, 56 and more nerve cells were evoked in the right motor region of right-handed subjects. 57 Therefore, we hypothesized that the right hemisphere demanded more energy metabolism, and energy metabolism demanded more iron, which was delivered by the increased CBF. So, after injection of the iron agents, excess iron was delivered and accumulated in the right-sided gray matter nuclei by the increased CBF, and the correlations between increased CBF and ID occurred in the right side of hemodialysis patients. In the HCs, the correlations between ID and CBF also occurred in the right side, also supporting the rightward asymmetry from the normal physiological view.
The correlations between increased ID and CBF occurred in the specific brain regions including the CA and PUT in both HCs and hemodialysis patients. The neostriatum (CA and PUT) has been reported to play an important role in controlling motor function, planning and execution, and cognition.52,58 The neural activity of neostriatum required energy consumption and combined with changes in CBF and metabolic rate of oxygen.18,57 Brain tissue's high energy and oxygen consumption may be closely related to iron. These supported our findings.
Permeability of BBB has been reported to be related to brain ID.59,60 The permeability of the BBB was increased with aging, 60 which might lead to an increase in brain iron when the iron was delivered to the brain tissues by the bloodstream. 59 In addition, CSVD has proven to cause a significantly increased BBB leakage, 59 so the CSVD causes more ID. Our study demonstrated TWMHV was a risk factor for ID while LI was a risk factor for the reduced CBF in hemodialysis patients, which supported this hypothesis. Considering that CSVD might affect the integrity of the BBB, which further caused ID, we also included these small vessel diseases-related risk factors to perform mediation analysis. However, the results were not statistically significant when these risk factors were tested as predictors, respectively. The in vivo evaluation of the integrity of the BBB in hemodialysis patients was difficult because the evaluation should be performed using dynamic contrast enhancement examination with gadolinium contrast agents. If these patients underwent contrast-enhanced MRI, they may have the risk of fatal diseases, such as nephrogenic systemic fibrosis. 61 In the future, animal experiments should be performed to explore the inner relationship among CSVD, BBB, and ID.
Although we found the significant results of mediation analysis among Hb, CBF and cerebral ID after we calculated the sum of ID and CBF in all cerebral nuclei, the significant results of mediation analysis can only be found in the single nuclei including RCA, RPUT and LSN. This may be attributed to the small sample size. Although the sample size was sufficient enough to draw safe conclusions, the small sample size might cause the choice bias of enrolled subjects. The choice bias might cause significant results only in some nuclei. We observed that the higher ID was seen in all cerebral nuclei except for bilateral THA, and higher CBF was seen in all cerebral nuclei except for LRN in the hemodialysis patients than the HCs, although statistically significant differences in the ID and CBF between hemodialysis patients and HCs only be found in some cerebral nuclei. In the future, the enlarged sample size will help us to find significant correlations in more cerebral nuclei.
Our study showed that LI, Hb, and serum abio-phosphorus were predictive factors for CBF and also showed that TWMHV, hypertension, serum calcium, serum phosphorus, and dialysis duration were predictive factors for ID. The discussions for these findings were presented in the Supplementary Materials.
Our study has a few limitations. First, we measured CBF by using pASL. 62 However, pASL is associated with a lower signal-noise ratio and higher dependency on the arterial arrival time. Therefore, pulsed, continuous ASL or post-labeling delay method may be a better choice for perfusion assessment in future studies. We used pASL, which is commonly used in our hospital. Secondly, although the post hoc power analysis indicated that our study had a sufficient sample size to draw safe conclusions and we observed similar associations between CBF and ID in both HCs and hemodialysis patients, which supported our findings with each other, the sample size in our study was still small. This could limit the statistical power in correlation analysis and cause the choice bias of enrolled subjects, which causes the significant correlations in some not all the nuclei. Thirdly, our study used the regions of interest method to measure ID and CBF of the cerebral nuclei and not the voxel-based method because ID was more pronounced in the cerebral nuclei compared to the other cerebral regions. Finally, our study is exploratory in design. The majority of exploratory studies only supply qualitative information, and interpretation of the findings usually is judgmental. Furthermore, findings determined by qualitative research could be susceptible to significant interpreter bias. Therefore, we should give cautious explanations of our findings and just supply a hypothesis for further testing and confirmation. In the future, animal experiments will be needed to further verify our findings.
In conclusion, our study showed that renal anemia enhanced CBF and subsequently increased ID in the cerebral nuclei of the hemodialysis patients, demonstrating a possible biological mechanism for iron overload in the hemodialysis patients. Our findings have important implications for the probably understanding of iron overload pathology in anemia-related diseases such as hemodialysis, aplastic anemia, and thalassemia. However, further longitudinal studies are necessary to fully elucidate the relationship between CBF and ID. We also demonstrated that serum phosphorus, serum calcium, TWMHV, hypertension, and dialysis duration were the risk factors for ID. Furthermore, Hb, serum phosphorus, and LI were the risk factors for CBF. Moreover, mediation analysis demonstrated that CBF mediated the association between Hb and ID.
Supplemental Material
sj-pdf-1-jcb-10.1177_0271678X221147363 - Supplemental material for Cerebral blood flow regulates iron overload in the cerebral nuclei of hemodialysis patients with anemia
Supplemental material, sj-pdf-1-jcb-10.1177_0271678X221147363 for Cerebral blood flow regulates iron overload in the cerebral nuclei of hemodialysis patients with anemia by Huiying Wang, Chao Chai, Gemuer Wu, Jinping Li, Chenxi Zhao, Dingwei Fu, Shengtong Zhang, Huapeng Wang, Beini Wang, Jinxia Zhu, Wen Shen, Shuang Xia in Journal of Cerebral Blood Flow & Metabolism
Footnotes
Funding
The author(s) disclosed receipt of the following financial support for the research, authorship, and/or publication of this article: This work was supported by the Natural Scientific Foundation of China (81901728 to C.C.; 82171916 to S.X.; 81871342 to S.X; 81873888 to W.S.), the Natural Scientific Foundation of Tianjin (21JCQNJC01480 to C.C.), Open fund of key laboratory of bioactive materials of ministry of education of Nankai University (SWHX-202201 to C.C.), Tianjin Health Commission Science and Technology Key Project (ZD20002 to W.S.), Tianjin Key Medical Discipline (Specialty) Construction Project (TJYXZDXK-041A).
Acknowledgements
We appreciated Mr. Xin Chang and Cheng Luo of University of electronic science and technology for their helpful discussion on mediation analysis. We appreciated Mr. Zeshan Yao, who was a specialist for the development and clinical application of ASL technique, for his help in the interpretation of CBF findings. We thank all the neurologists and medical radiation technologists in our hospital.
Declaration of conflicting interests
The author(s) declared no potential conflicts of interest with respect to the research, authorship, and/or publication of this article.
Authors’ contributions
Supplementary material
Supplemental material for this article is available online.
References
Supplementary Material
Please find the following supplemental material available below.
For Open Access articles published under a Creative Commons License, all supplemental material carries the same license as the article it is associated with.
For non-Open Access articles published, all supplemental material carries a non-exclusive license, and permission requests for re-use of supplemental material or any part of supplemental material shall be sent directly to the copyright owner as specified in the copyright notice associated with the article.