
Abstract
Elevated flow velocities in adults with sickle cell anemia (SCA) may cause rapid erythrocyte transit through capillaries. This phenomenon could present as dural venous sinus hyperintensity on arterial spin labeling (ASL)-MRI and could be indicative of capillary shunting. Here, the prevalence of ASL venous hyperintensities and association with relevant physiology in adults with SCA was investigated. SCA (n = 46) and age-matched control (n = 16) volunteers were recruited for 3.0 T MRI. Pseudo-continuous ASL-MRI was acquired for cerebral blood flow (CBF) calculation and venous hyperintensity determination; venous signal intensity and a categorical venous score (three raters; 0 = no hyperintensity, 1 = focal hyperintensity, and 2 = diffuse hyperintensity) were recorded. Flow velocity in cervical internal carotid artery segments was determined from phase contrast data (venc = 40 cm/s) and whole-brain oxygen extraction fraction (OEF) was determined from T2-relaxation-under-spin-tagging MRI. Cerebral metabolic rate of oxygen was calculated as the product of OEF, CBF, and blood oxygen content. ASL venous hyperintensities were significantly (p < 0.001) more prevalent in SCA (65%) relative to control (6%) participants and were associated with elevated flow velocities (p = 0.03). CBF (p < 0.001), but not OEF, increased with increasing hyperintensity score. Prospective trials that evaluate this construct as a possible marker of impaired oxygen delivery and stroke risk may be warranted.
Keywords
Introduction
Sickle cell anemia (SCA) is a genetically inherited blood disorder in which polymerization of hemoglobin-S results in sickling of erythrocytes. 1 The presence of sickled erythrocytes, which lyse faster than normal erythrocytes, leads to lower hematocrit, reduced oxygen affinity of blood, 2 and elevated risk of arterial steno-occlusion, silent cerebral infarction, and overt stroke,3,4 However, no standard currently exists for stratifying adults with SCA at high risk for stroke to aggressive therapies, such as chronic blood transfusion, surgical revascularization, or stem cell transplant, for stroke prevention. Furthermore, silent infarcts, which are present in upwards of 50% of adults with SCA, 5 may represent a different pathological process than overt strokes due to the involvement of small cerebral vessels. 6
Tissue-level hemodynamic relationships may be altered in individuals with SCA to compensate for reduced blood oxygen content and arterial steno-occlusion, and thus imaging of tissue-level hemodynamic compensation patterns may be beneficial for assessing risk for strokes and silent infarcts. 7 One mode of compensation is through upregulation of cerebral blood flow 8 (CBF; ml/100 g/min), which has been previously demonstrated in adults with SCA and can be achieved through changes in microvascular resistance and corresponding autoregulatory increases in cerebral blood volume (CBV; ml blood/100 ml brain) with or without concomitant increases in arterial flow velocity. 9 Importantly, high flow velocities may result in rapid erythrocyte transit through cerebral capillaries, reducing capillary transit times, and in turn oxygen offloading efficiency (i.e. capillary shunting). Such shunting may be indicative of suboptimal tissue oxygen delivery in SCA even in the presence of high CBF, and would manifest as reduced oxygen delivery to tissue per unit of blood. Indeed, heterogeneity of capillary blood velocities has been associated with the presence of small vessel infarction in other populations 10 ; however, measuring these effects has proven difficult.
Magnetic resonance imaging (MRI) techniques have been previously used to detect intracranial arteriovenous shunting
11
and perfusion abnormalities within developmental venous anomalies
12
; however, MRI has yet to be utilized for characterization of capillary shunting in SCA. Pseudo-continuous arterial spin labeling (pCASL)13,14 is a noninvasive MRI technique that allows for CBF quantification using radiofrequency labeling of blood water. Here, a short (1–2 s) train of radiofrequency pulses is used to endogenously label blood water in cervical arteries. Images are then acquired after a post-labeling delay (PLD = 1.5–3.0 s) which allows for the labeled cervical blood water to exchange with brain tissue water. In the presence of capillary shunting, a larger amount of labeled blood water may traverse the capillaries without exchanging with tissue water, leading to an attenuation of signal in draining veins (e.g. dural venous sinuses). When comparing with a control image in which blood water is not labeled, this would manifest as dural venous sinus hyperintensity (Figure 1). Since arterial flow velocities are elevated in adults with SCA,
9
we hypothesize that this venous hyperintensity phenomenon is more prevalent in this population than in healthy controls and scales with increasing arterial flow velocity. The purpose of this study is to determine (1) the prevalence of pCASL venous hyperintensity in a well-characterized cohort of adults with SCA, (2) whether venous hyperintensity is associated with elevated flow velocities, and (3) if present, how this imaging finding co-varies with cerebral small vessel disease (SVD) seen on structural MRI of the brain, as well as other markers of parenchymal hemodynamics including CBF, oxygen extraction fraction (OEF), and the cerebral metabolic rate of oxygen consumption (CMRO2; µmol/100 g/min).
This schema illustrates the mechanistic model for venous hyperintensity in cerebral blood flow (CBF) maps in adults with sickle cell anemia (SCA) for differing blood water longitudinal magnetization (Mz) and equilibrium magnetization (M0). In a subject with no venous hyperintensity (a), exchange between blood water and tissue water in the capillaries following labeling results in the dominance of unlabeled water (i.e. Mz ∼ + M0) in the draining veins compared to labeled water (i.e. Mz < M0). The venous signal in the CBF image is near zero since Mz/M0 in the control and label cases are approximately +1. In a subject with venous hyperintensity present (b), more labeled blood water passes through the capillaries without exchanging with tissue water. The subsequent large difference in magnetization between the control and label in the veins results in a larger venous signal in CBF maps (orange arrow).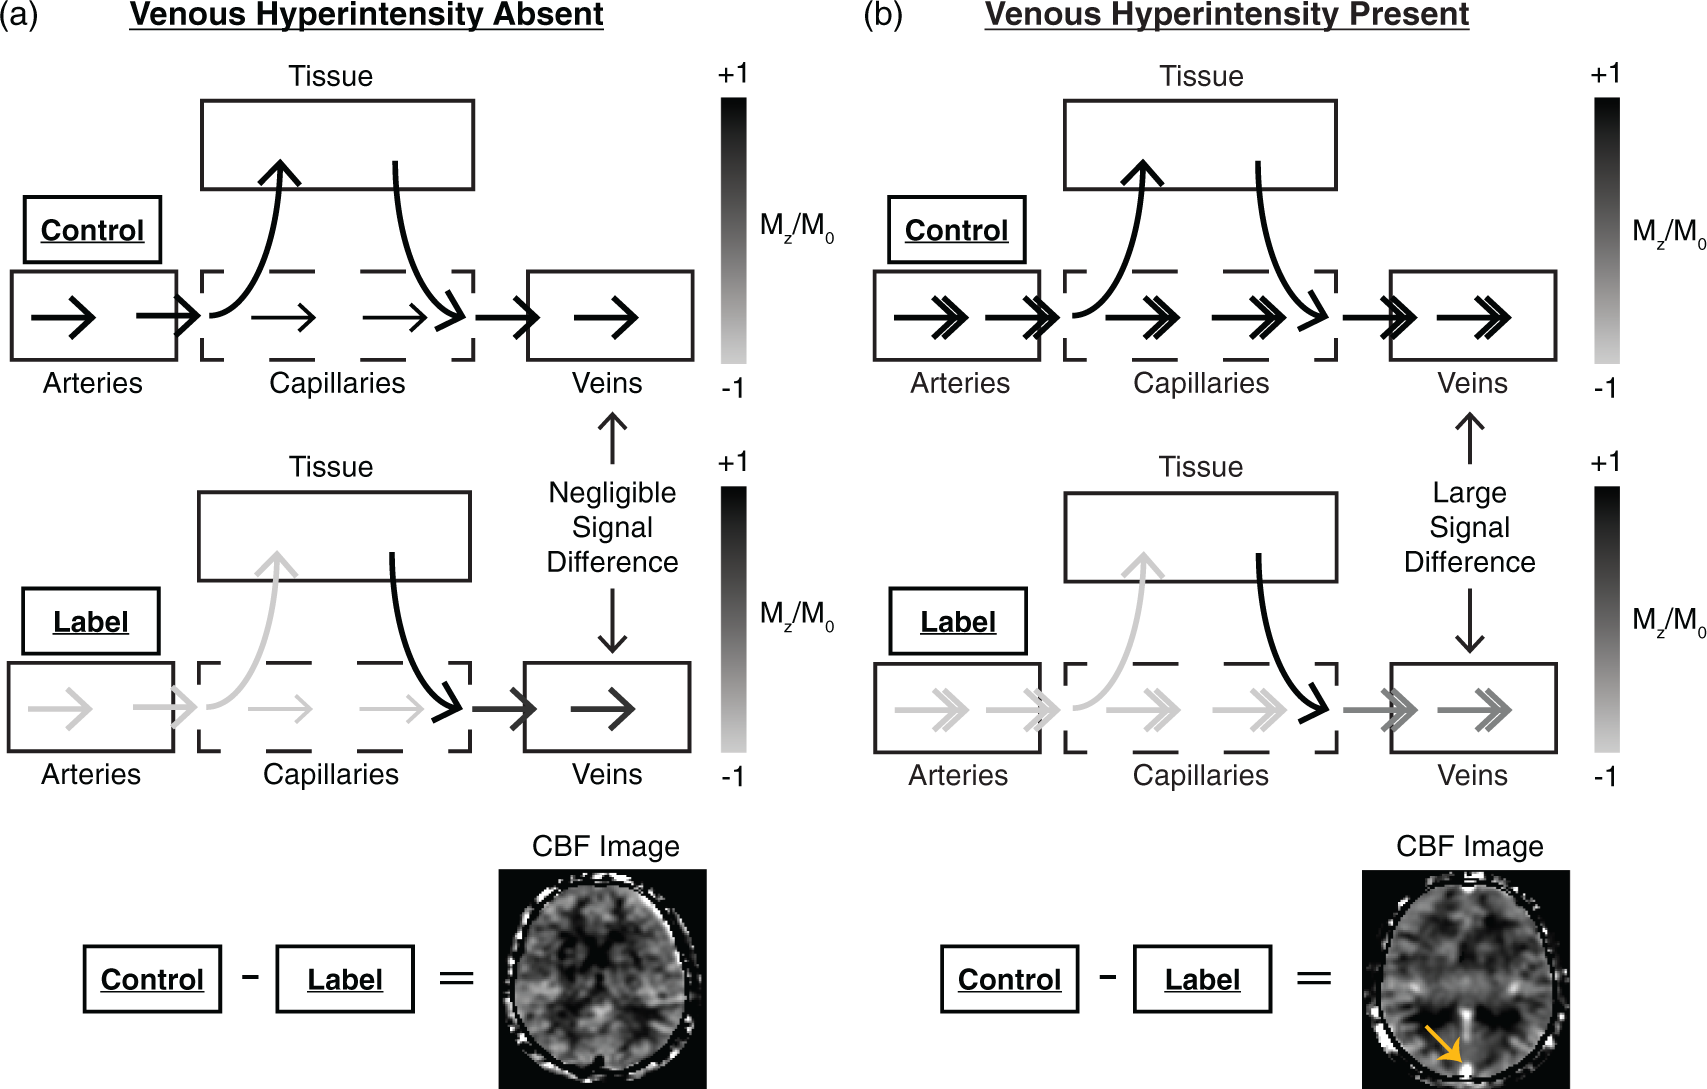
Materials and methods
Volunteer demographics
Summary of control and sickle cell anemia participants.
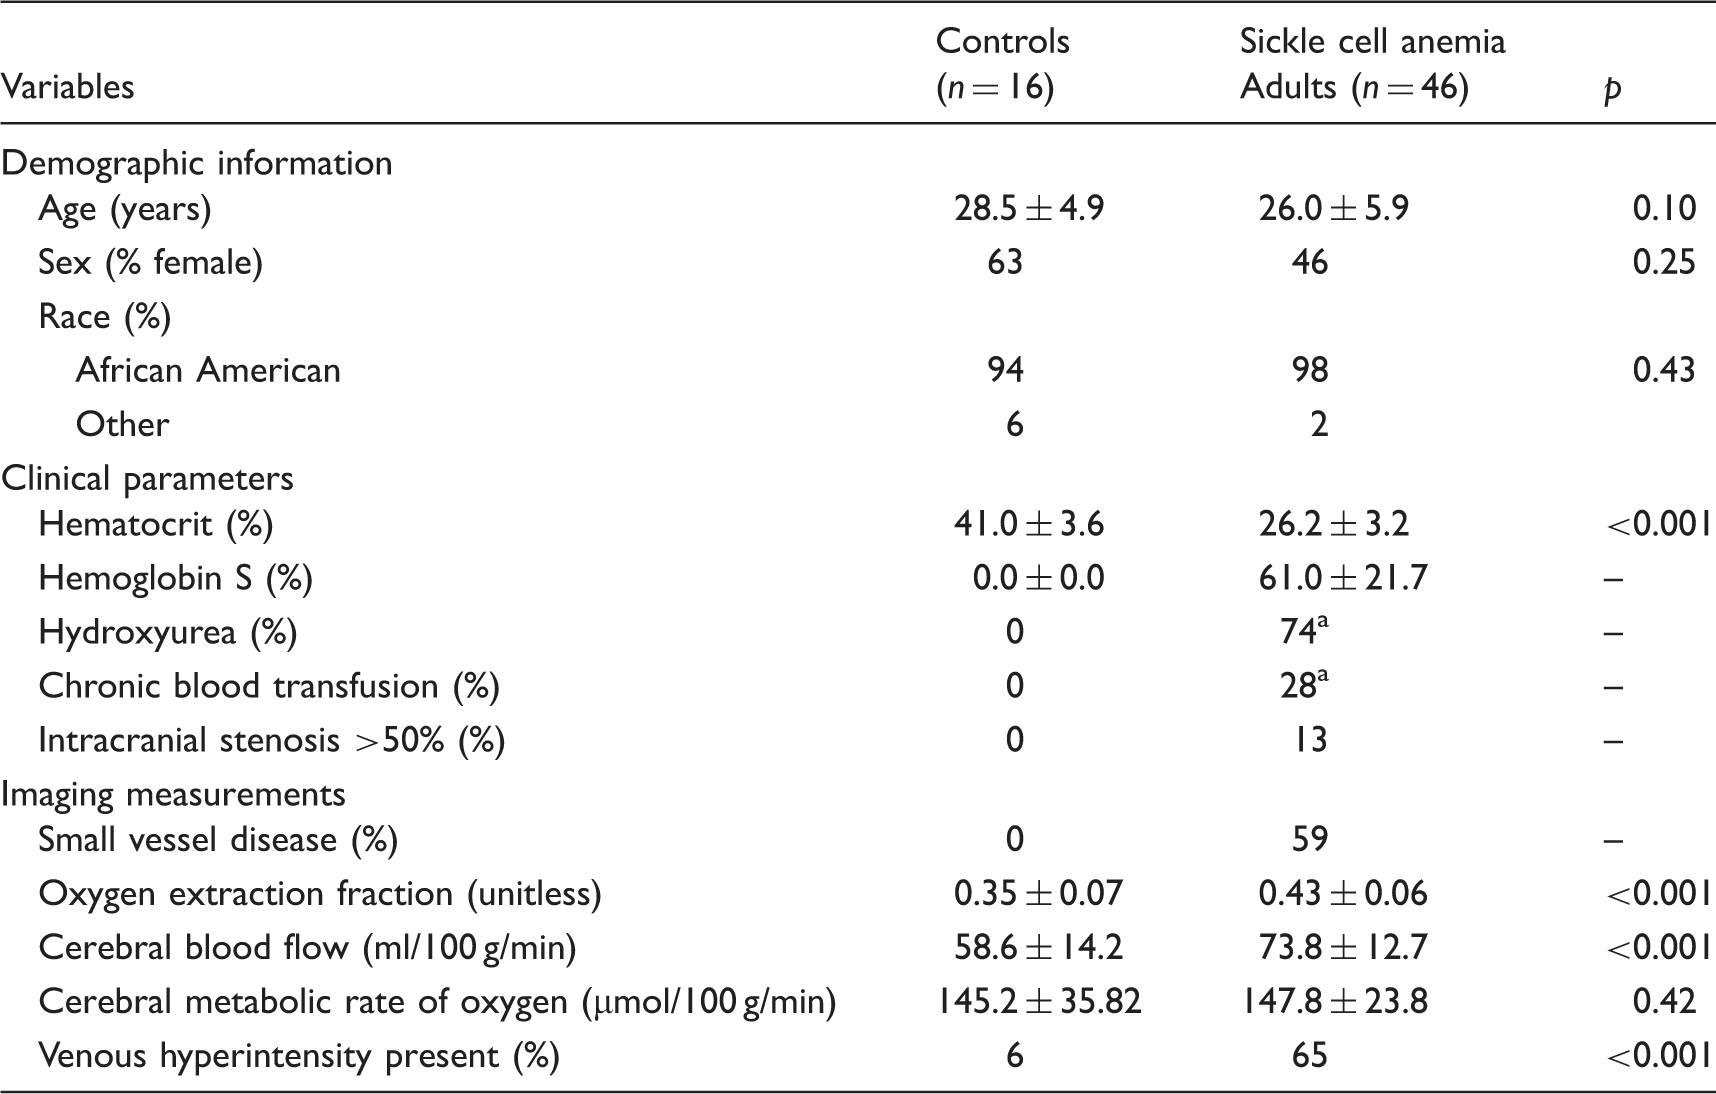
One participant was on both hydroxyurea and chronic transfusions at the time of study MRI.
Data acquisition
MR data were acquired using a 3.0T Philips Achieva whole-body scanner (Philips Healthcare, Best, The Netherlands). Non-sedated MR scanning of the head was performed using body coil radiofrequency transmission and 16-channel neurovascular coil reception. Hematocrit, hemoglobin, and percent hemoglobin-S values (in participants with SCA) were measured for each participant through venipuncture. Arterial oxygen saturation values were obtained from pulse oximetry.
Anatomical imaging
T1-weighted imaging for volumetric analysis was performed using a magnetization-prepared-rapid-gradient-echo sequence and with repetition time (TR)/echo time (TE) = 8.2/3.7 ms and spatial resolution = 1.0 × 1.0 × 1.0 mm3. Fluid-attenuated inversion recovery (FLAIR) MRI (TR/TI/TE = 11,000/2800/120 ms; spatial resolution = 1.0 × 1.1 × 4.0 mm3) was performed in two planes (axial and coronal) for infarct assessment. Time-of-flight (TOF) MR angiography (MRA) of the head (TR/TE = 23/3.5 ms; spatial resolution = 0.5 × 0.8 × 0.7 mm3) was performed to assess stenosis of major intracranial vessels. TOF-MRA of the neck (TR/TE = 18.6/3.2 ms; spatial resolution = 0.9 × 0.9 × 3.0 mm3) was performed to guide the placement of quantitative flow measurements.
Arterial spin labeling MRI
pCASL MRI for CBF quantitation and detection of dural venous sinus hyperintensities was performed with 20 blocks of alternating label and control images. For the label images, a train of Hanning-windowed pulses was utilized to invert the magnetization of flowing arterial blood water in a 13-mm thick plane, 90 mm inferior to the center of the corpus callosum. MR images of the brain were acquired following a PLD of 1900 ms using a multi-slice 2D single-shot echo planar imaging gradient-echo readout (TR/TE = 3675/13 ms; spatial resolution = 3.0 × 3.0 × 7.0 mm3). For the control images, an identical readout scheme was utilized with no labeling of arterial blood water. Equilibrium magnetization (M0) images were acquired following the pCASL scan with identical readout parameters but with no spin labeling and TR = 15,000 ms. As blood arrival time (BAT) is shorter (1.02 ± 0.09 s) in SCA adults relative to age-matched healthy adults, 9 a PLD = 1900 ms was chosen relative to recommended longer parameters in cerebrovascular disease patients with delayed BATs 17 ; appropriate pCASL parameter choices in SCA have been investigated previously. 9
Cervical flow velocity
Phase contrast MRA for cervical arterial flow velocity quantitation was performed in a subset of participants (n = 18 controls and n = 37 SCA adults) in the left and right internal carotid arteries (ICAs). 9 Single-slice phase contrast images were acquired with a velocity-encoding (venc) gradient = 40 cm/s (TR/TE = 20/7 ms; in-plane spatial resolution = 0.5 × 0.5 mm2). This venc allows for accurate quantification of slower flowing blood around the perimeter of the vessel, and faster flowing blood near the center of the vessel can be determined using phase unwrapping, as previously described. 9 The imaging slices were oriented perpendicular to each vessel at the level of the C2 vertebra using TOF neck MRA.
OEF
T2-relaxation-under-spin-tagging (TRUST)18,19 data were acquired for whole-brain OEF assessment in all participants, identically as previously described. 7 In brief, control and label single-slice TRUST images were acquired from a slice containing the superior sagittal sinus with effective echo times (eTEs) = 0, 40, 80, and 160 ms (three averages per eTE). The image slices were positioned parallel to the anterior commissure/posterior commissure line, approximately 20 mm superior to the confluence of the sinuses.
Data analysis
Anatomical imaging
T1-weighted MR images were brain-extracted 20 and automatically segmented 21 to identify regions of gray matter (GM) parenchyma, white matter (WM) parenchyma, and cerebrospinal fluid (CSF). FLAIR and intracranial TOF-MRA data were examined by a board-certified neuroradiologist (LTD) to identify presence of infarcts and stenosis of a major intracranial artery (intracranial ICA segments and/or first segment of MCA, PCA, or ACA), respectively.
Assessment of neuroimaging for infarcts
Infarcts were defined using standard SCA criteria as an area of abnormal hyperintensity on T2-FLAIR weighted MRI ≥3 mm in diameter and visible in at least two planes of T2-FLAIR weighted images (axial and coronal). 22 Infarcts were further classified as small or large vessel according to imaging characteristics and pattern. Our classification of small vessel infarcts, indicating SVD, included lacunes of presumed vascular origin, 23 but did not include WM hyperintensities smaller than 3 mm for consistency with SCA literature. 22 Participants with SCA were classified based on the presence or absence of SVD as determined by these criteria.
Identification of venous hyperintensity
CBF was quantified from the pCASL data utilizing the ISMRM perfusion study group model
24
with subject-specific arterial blood longitudinal relaxation times (T1) based on measured hematocrit as previously described.
25
pCASL inversion efficiencies were not measured individually, but group-based labeling efficiencies (0.91 for controls and 0.72 for SCA adults) as previously reported
9
in SCA adults and age- and race-matched controls were utilized for CBF computation. These CBF maps were transformed into a common anatomical image-space.
26
Three reviewers (one neuroradiologist: LTD, one stroke neurologist: LCJ, and one imaging physicist: MJD) independently assessed the CBF maps for venous hyperintensity, blinded to the clinical status of the participant, and assigned categorical venous hyperintensity scores of 0 = no venous hyperintensity, 1 = focal hyperintensity, or 2 = diffuse hyperintensity. The presence of hyperintensity was assessed primarily in the superior sagittal sinus. When extensive venous hyperintensity was present (i.e. hyperintensity score = 2), the hyperintensity could be tracked along the length of the superior sagittal sinus into the transverse sinuses (as shown in Figure 2). Inter-observer agreement was assessed using Fleiss’ κ, and then a consensus hyperintensity score was determined by discussion-consensus if there was disagreement; the consensus hyperintensity score was used in all subsequent analyses. Quantitative measures of hyperintensity were derived by taking the mean of the ASL signal inside a manually delineated region-of-interest in the frontoparietal section of the superior sagittal sinus at the same location in each participant.
Representative examples of subjects across the spectrum of hyperintensity scores are shown here. For the participant with hyperintensity score = 0 (a), no hyperintensity was observed along any portion of the superior sagittal sinus or straight sinus. For the participant with hyperintensity score = 1 (b), a region of focal hyperintensity was observed along the superior sagittal sinus (orange arrows). For the participant with hyperintensity score = 2 (c), hyperintensities were observed along a large portion of the superior sagittal sinus as well as in the straight sinus and transverse sinuses (orange arrows) and could be tracked on multiple axial or coronal slices.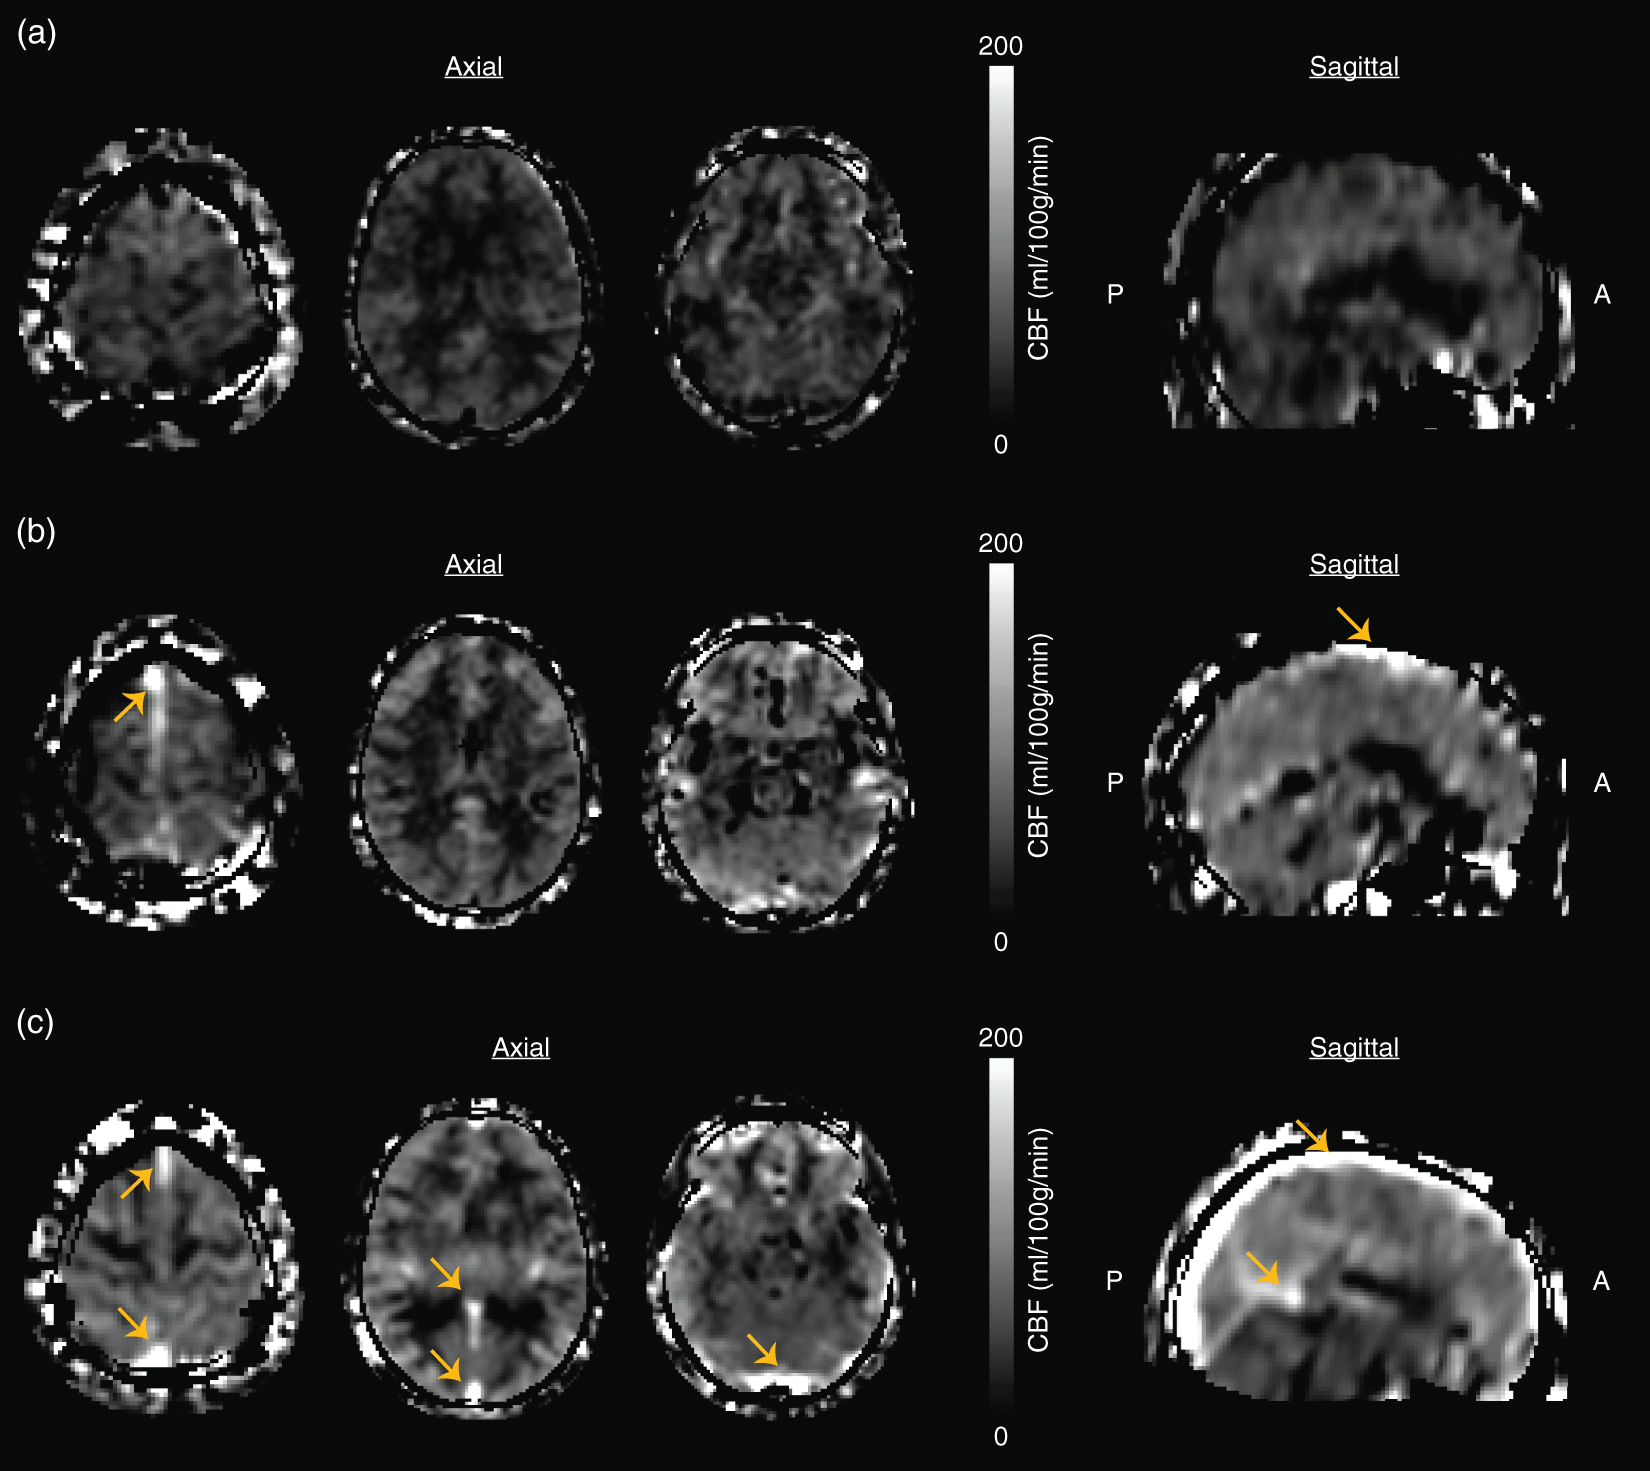
Physiological measures
For velocity assessment, the left and right ICAs were segmented from the phase contrast magnitude images in a previously described semi-automatic manner.
9
Mean flow velocities were then computed in each vessel and mean velocity across left and right ICAs recorded. For OEF, TRUST data were quantified to compute venous blood water T2
7
Venous T2 was then converted to venous oxygen saturation (Yv) using individually measured hematocrit values and, along with knowledge of arterial oxygenation saturation (Ya) from pulse oximetry, OEF was calculated according to equation (1) as

For CBF measurement, GM masks derived from segmentation of the T1-weighted MR images were used to compute mean GM CBF values for each participant. For CMRO2 assessment, whole-brain CMRO2 was quantified as previously described
27
using individually measured hemoglobin concentrations according to equation (2) as

Statistics
Statistical analyses were performed using non-parametric methods and R Statistical Software (R Foundation for Statistical Computing, Vienna, Austria). First, to evaluate whether venous hyperintensities were more prevalent in SCA participants versus controls, we performed a two-tailed Chi-squared test for equality of proportions. Next, to evaluate whether the presence and degree of hyperintensity were associated with elevated flow velocity, we utilized a two-tailed Wilcoxon-rank-sum test and a two-tailed Jonckheere–Terpstra trend test, respectively. Further analysis with identical statistical considerations was also performed to examine the association between the quantitative measure of venous hyperintensity and both the qualitative measure of venous hyperintensity and flow velocity. To understand the relationship between the presence and degree of venous hyperintensity and tissue-level physiology measures, OEF and CBF, we utilized two-tailed Wilcoxon-rank-sum tests and two-tailed Jonckheere–Terpstra trend tests, respectively. Finally, to determine whether the presence of venous hyperintensity together with tissue-level physiology measures were associated with the presence of SVD, we utilized two-tailed Wilcoxon-rank-sum tests to test whether OEF and CBF are different between patients with and without SVD when hyperintensity is present versus absent. All statistical analyses required a two-sided significance level of 0.05; continuous variables are presented as mean ± standard deviation.
Results
Demographics
Demographic, physiological, and clinical parameters are summarized for all participants in Table 1. Data from three participants with SCA were deemed uninterpretable due to the subject moving and the top of the brain being outside the acquired field-of-view, or the presence of severe motion artifact and thus were excluded from subsequent analysis. Furthermore, data from eight control volunteers were excluded due to the presence of sickle cell trait (n = 1), ventriculomegaly (n = 1), or structural MRI findings of presumed vascular origin (n = 2 chronic infarct and n = 4 white matter lesions). Therefore, data analysis was conducted in a total cohort of 62 participants, with 46 adults with SCA and 16 age- and race-matched healthy controls. Hematocrit values were measured within 0.85 ± 1.97 days of imaging and were 41.8% ± 4.3 for control participants and 26.2% ± 3.2 for SCA participants.
Prevalence of venous hyperintensity
Venous hyperintensity was observed in 6% of healthy controls (1/16) and 65% of SCA participants (30/46; p < 0.001), and inter-observer agreement in determining the participant hyperintensity scores was substantial (Fleiss’ κ = 0.63; p < 0.001). As a secondary analysis, venous hyperintensity was also found to be present in 50% of controls that were excluded from the remainder of the analysis due to abnormal structural MRI findings of presumed vascular origin (3/6). Representative examples of participants with hyperintensity scores of 0, 1, and 2 are shown in Figure 2. For participants with score = 2, the hyperintensities were localized primarily to the superior sagittal sinus, while for participants with score = 1, hyperintensities were sometimes observed in the vein of Galen and straight sinus as well (Figure 2).
There was a small but significant (p < 0.001) difference in mean ages for participants (n = 16 controls and n = 46 SCA adults) without (age = 29.3 ± 5.0 years) versus with (24.0 ± 5.3 years) venous hyperintensities. Mean hematocrit for participants with hyperintensity score = 0 was 0.34 ± 0.08 versus 0.26 ± 0.04 for participants with hyperintensity score > 0 (p < 0.001). Furthermore, hematocrit exhibited a decreasing trend (p < 0.001) when comparing controls (0.41 ± 0.04), SCA participants with hyperintensity score = 0 (0.27 ± 0.03), SCA participants with hyperintensity score = 1 (0.26 ± 0.03), and SCA participants with hyperintensity score = 2 (0.23 ± 0.03).
Association with cervical flow velocity
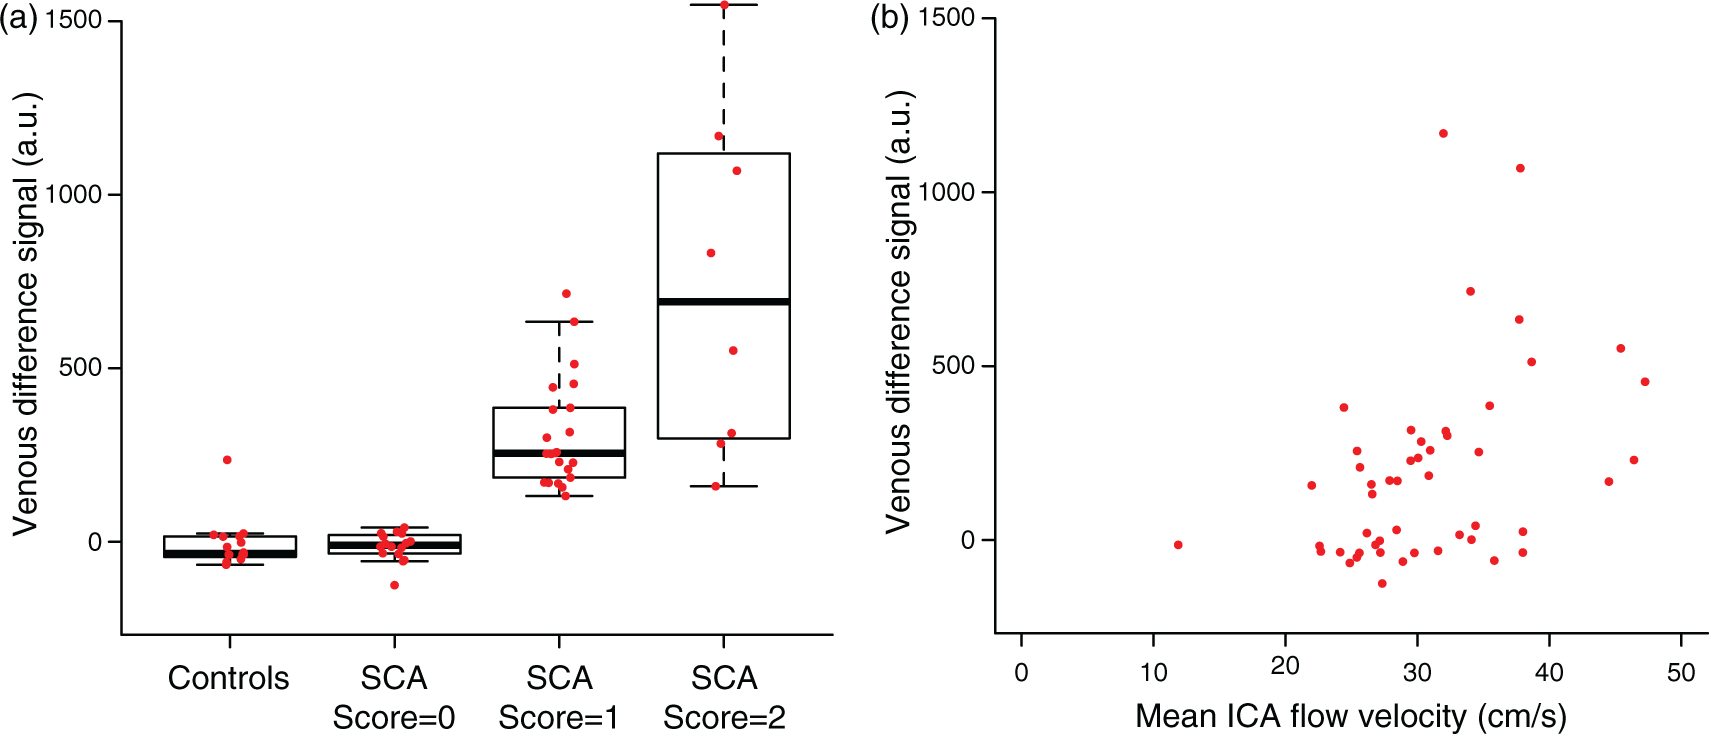
Mean cervical ICA flow velocity was 28.4 ± 5.9 cm/s for participants with hyperintensity score = 0 and 32.8 ± 6.9 cm/s for participants with hyperintensity score > 0 (p = 0.04), consistent with the presence of venous hyperintensity corresponding with higher ICA flow velocities (Figure 3(a)). ICA flow velocity exhibited an increasing trend (p = 0.06) when comparing controls, participants with SCA and hyperintensity score = 0, participants with SCA and hyperintensity score = 1, and participants with SCA and hyperintensity score = 2 (Figure 3(b)). Furthermore, quantitative measures of CBF venous signal intensity positively scaled (p < 0.001) with the qualitative assessment of venous hyperintensity (Figure 4(a)) and were significantly (p = 0.001) and positively (Spearman’s ρ = 0.46) associated with ICA flow velocity (Figure 4(b)). These quantitative data are consistent with the qualitative venous hyperintensities being associated with elevated flow velocities.
Box plots are shown for all participants comparing the internal carotid artery (ICA) flow velocity (cm/s) in the presence and absence of venous hyperintensity (a) and across four categories of participants: controls (n = 12), participants with sickle cell anemia (SCA) and hyperintensity score = 0 (n = 11), participants SCA and hyperintensity score = 1 (n = 20), and participants with SCA and hyperintensity score = 2 (n = 6) (b). ICA flow velocity is elevated in participants with hyperintensity (two-sided Wilcoxon rank-sum test; p = 0.04) and exhibits a trend for increasing flow velocities when comparing controls and SCA participants with increasing hyperintensity scores (two-sided Jonckheere–Terpstra trend test; p = 0.06). Box plots are shown for all participants comparing CBF venous signal intensity in the superior sagittal across four categories of participants: controls (n = 16), participants with sickle cell anemia (SCA) and hyperintensity score = 0 (n = 16), participants with SCA and hyperintensity score = 1 (n = 22), and participants with SCA and hyperintensity score = 2 (n = 8) (a). Signal intensity in the sagittal sinus exhibits a trend for increasing intensities when comparing controls and SCA participants with increasing hyperintensity scores (two-sided Jonckheere–Terpstra trend test; p < 0.001). Furthermore, sagittal sinus signal intensity exhibits a significant and positive correlation with ICA flow velocity (Spearman’s correlation test; p = 0.001; ρ = 0.46) (b).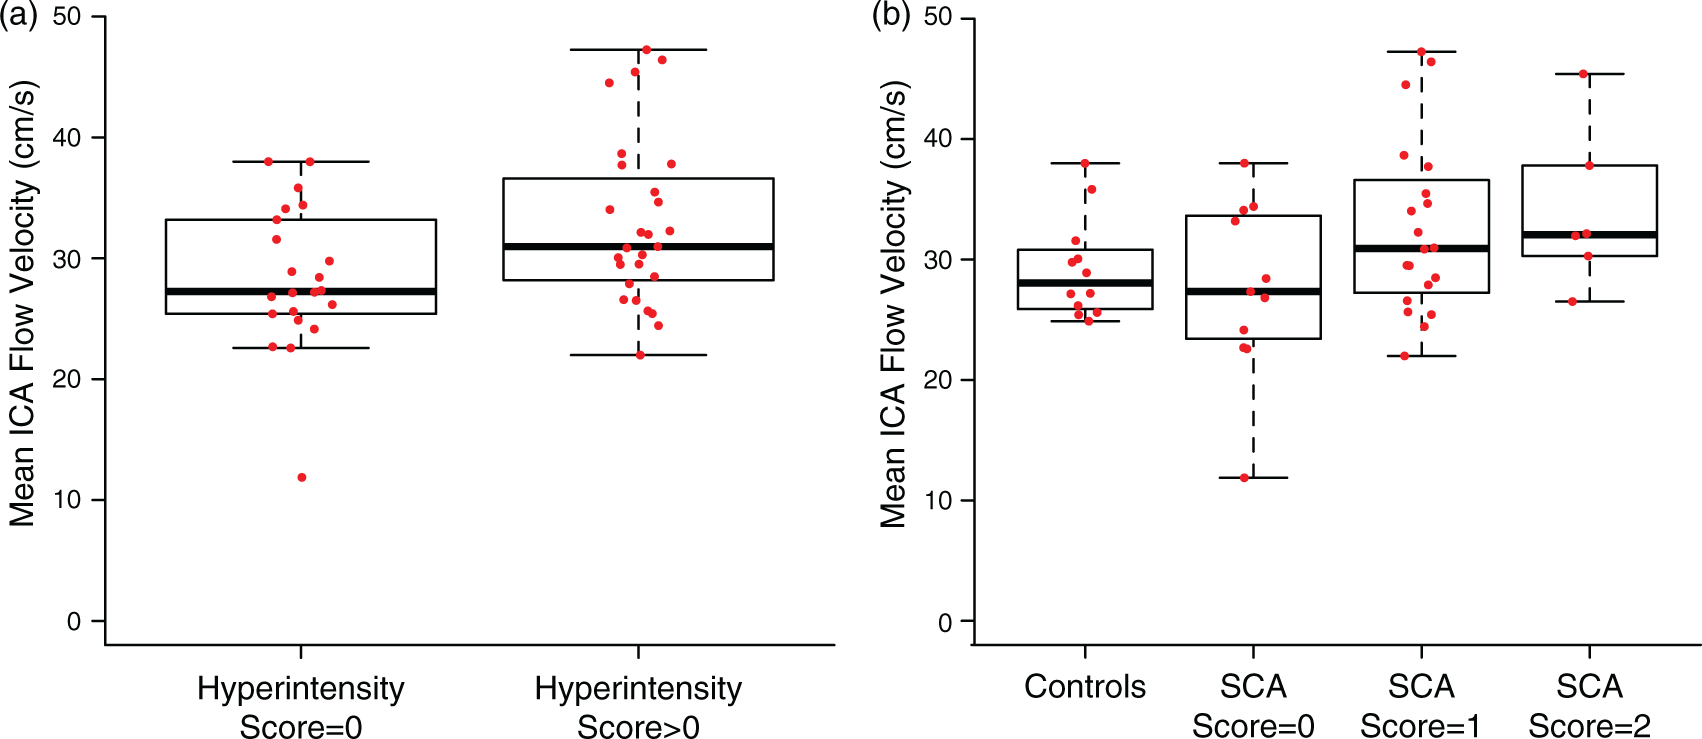
Association with tissue-level physiology
In a binary comparison, mean OEF in participants with hyperintensity score = 0 (OEF = 0.39 ± 0.07), was not significantly different than mean OEF in participants with hyperintensity score > 0 (OEF = 0.42 ± 0.06) (Figure 5(a)). While a significant association with OEF and venous hyperintensity was observed when comparing controls, participants with SCA and hyperintensity score = 0, participants with SCA and hyperintensity score = 1, and participants with SCA and hyperintensity score = 2 (p = 0.02) (Figure 5(b)), this difference is likely attributable to the significant (p < 0.001) overall difference in OEF between controls and all SCA participants.
Box plots are shown for all participants comparing whole-brain oxygen extraction fraction in the presence and absence of venous hyperintensity (a) and across four categories of participants: controls (n = 16), participants with sickle cell anemia (SCA) and hyperintensity score = 0 (n = 16), participants with SCA and hyperintensity score = 1 (n = 22 for OEF, n = 21 for CBF), and participants with SCA and hyperintensity score = 2 (n = 8) (b). OEF is not different between groups and does not exhibit a trend when comparing controls and participants with SCA and increasing hyperintensity scores. Box plots are also shown for all participants comparing gray matter cerebral blood flow in the presence and absence of venous hyperintensity (c) and across the same four categories of participants (d). Gray matter cerebral blood flow (CBF) is elevated in in the group with hyperintensity present (two-sided Wilcoxon rank-sum test; p = 0.02) and exhibits a trend for increasing CBF when comparing controls and participants with SCA and increasing hyperintensity scores (two-sided Jonckheere–Terpstra trend test; p < 0.001). Group-level mean cerebral blood flow (CBF) maps are shown for controls (n = 16) (a) and SCA adults with hyperintensity score = 0 (n = 16) (b), score = 1 (n = 21) (c), and score = 2 (n = 8) (d).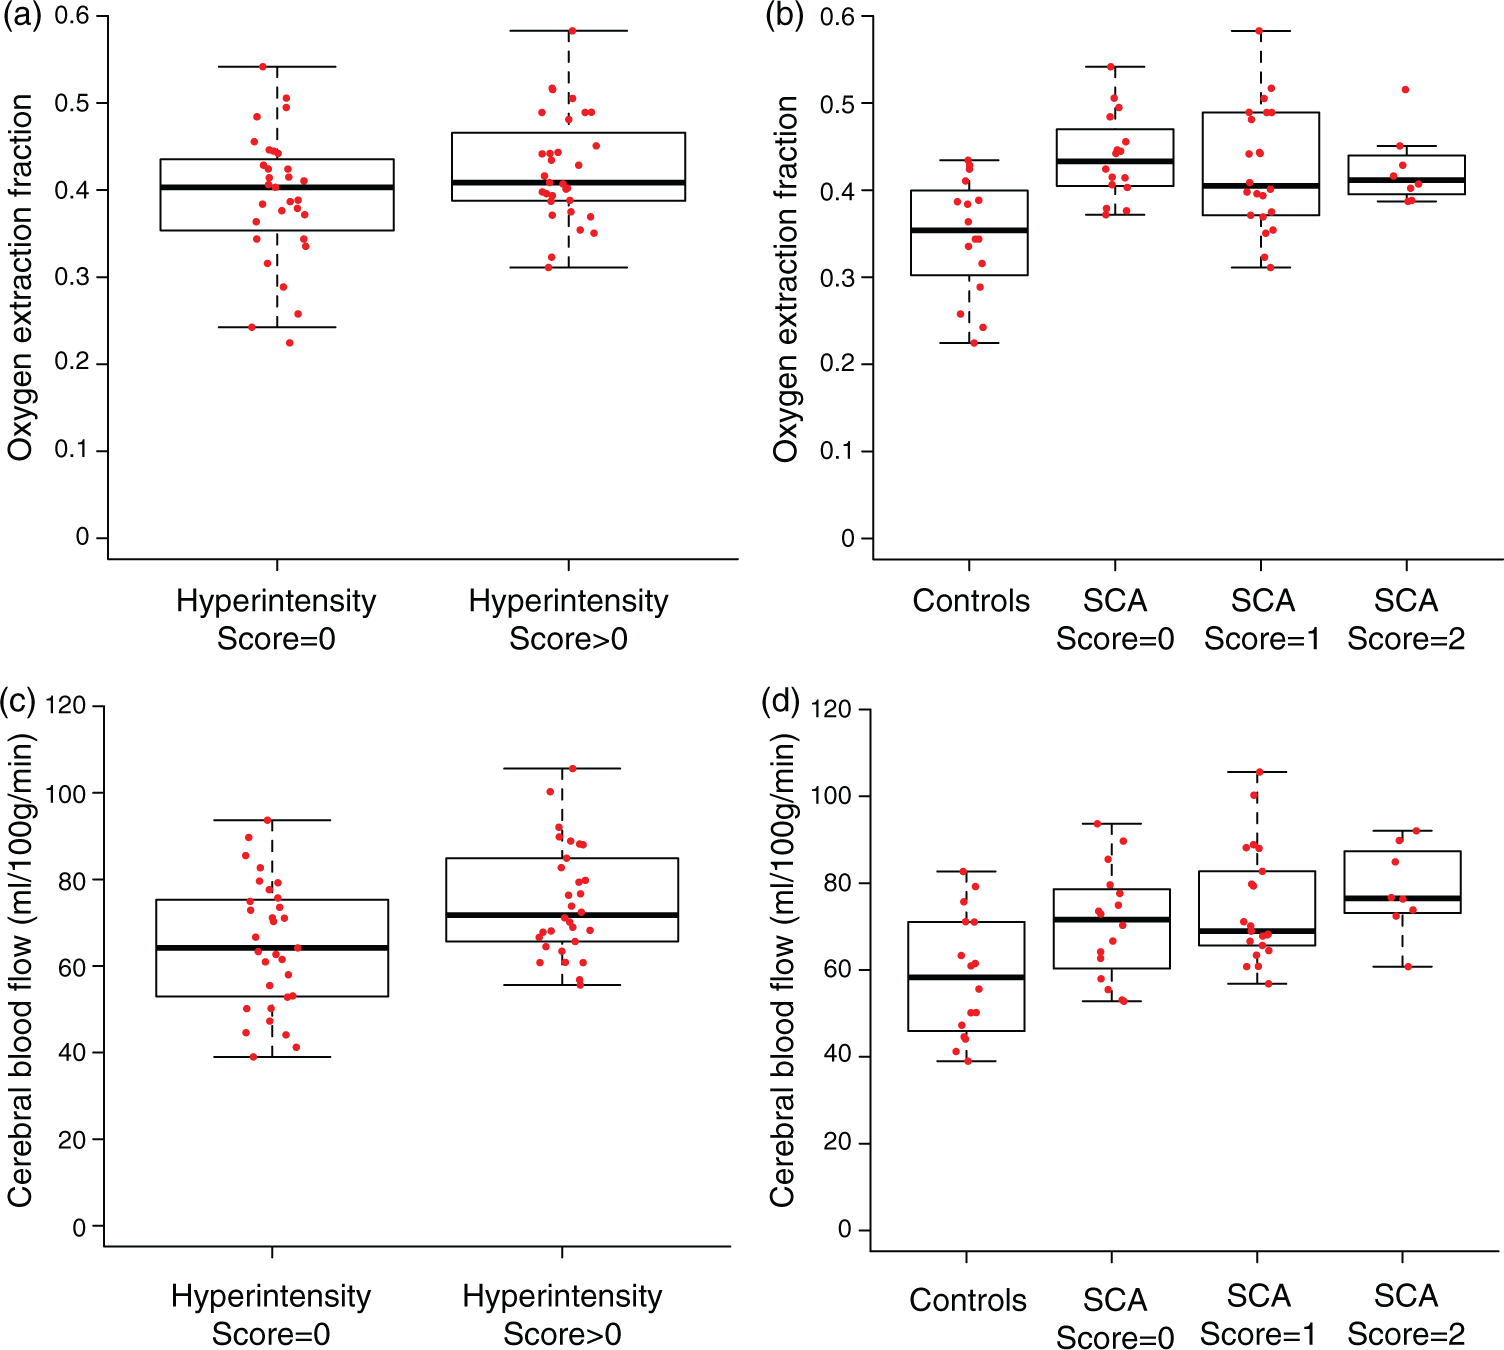
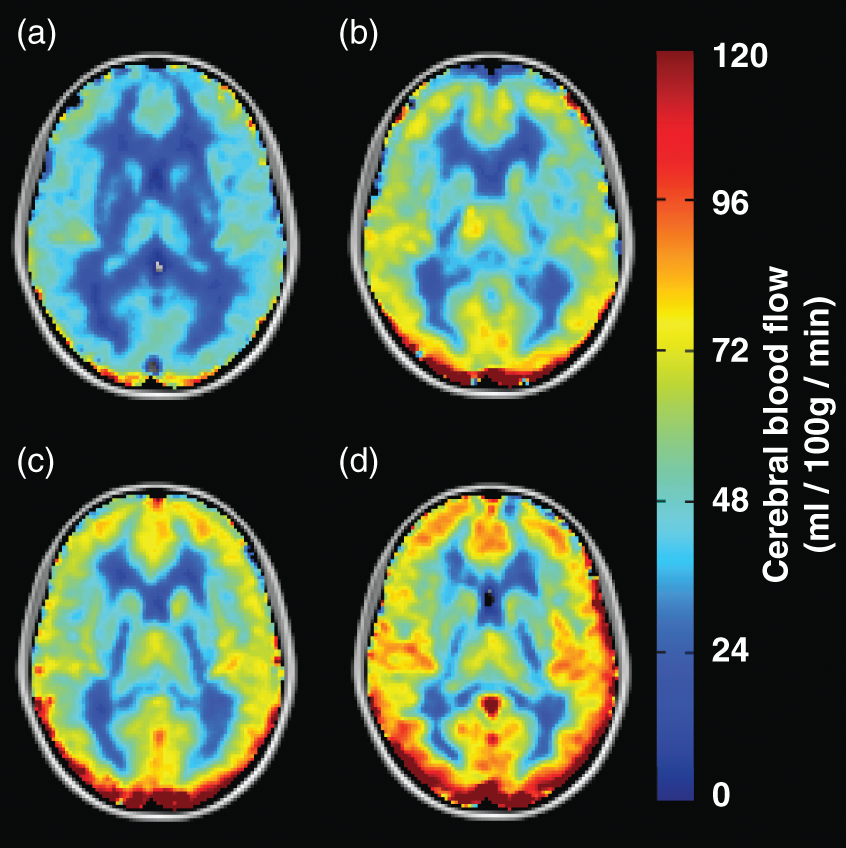
We also assessed the relationship between GM CBF and venous hyperintensity; one participant with SCA was excluded from this analysis due to participant time constraints necessitating omission of T1-weighted imaging (utilized for GM segmentation). In participants with hyperintensity score = 0, CBF = 64.9 ± 14.7 ml/100 g/min was lower than for participants with hyperintensity score > 0 (p = 0.02), in whom higher CBF = 74.9 ± 12.8 ml/100 g/min (Figure 5(c)) was observed. A significant relationship between increasing CBF and increasing hyperintensity score from the trend test was found when comparing controls to participants with SCA (p < 0.001) (Figure 5(d)). This relationship is also reflected in the group-level mean CBF maps (Figure 6).
Finally, we assessed the relationship between CMRO2 and venous hyperintensity. In participants with hyperintensity score = 0, CMRO2 = 147.8 ± 30.8 µmol/100 g/min was not significantly different than in participants with hyperintensity score > 0, in whom CMRO2 = 146.4 ± 22.3 µmol/100 g/min was observed. Furthermore, no significant relationship was observed between CMRO2 and hyperintensity score from the trend test when comparing controls (CMRO2 = 145.2 ± 35.2 µmol/100 g/min) to SCA participants with score = 0 (CMRO2 = 153.1 ± 27.4 µmol/100 g/min), score = 1 (CMRO2 = 146.8 ± 21.9 µmol/100 g/min), and score = 2 (CMRO2 = 139.6 ± 20.8 µmol/100 g/min).
SVD
No significant relationship was found in participants with SCA between hyperintensity score and evidence of prior SVD on anatomical imaging. In participants with SCA, hyperintensity score > 0, CBF was marginally lower in those with (CBF = 72.5 ± 12.2 ml/100 g/min) versus without (CBF = 79.4 ± 12.2 ml/100 g/min) SVD, but this did not meet significance criteria (p = 0.11). In participants with SCA and hyperintensity score = 0, CBF was not different in those with (CBF = 70.9 ± 13.4 ml/100 g/min) versus without (CBF = 70.2 ± 12.5 ml/100 g/min) SVD (p = 0.96).
In participants with SCA and hyperintensity score > 0, OEF was not different between those with (OEF = 0.43 ± 0.05) versus without (OEF = 0.42 ± 0.08) SVD (p = 0.63). In participants with SCA and hyperintensity score = 0, OEF was not different between those with (OEF = 0.44 ± 0.04) versus without (OEF = 0.43 ± 0.06) SVD (p = 0.56).
Discussion
Our study revealed that dural venous sinus hyperintensities are more prevalent in adults with SCA compared with age- and race-matched controls. The presence and degree of hyperintensity were associated with elevated cervical ICA blood flow velocities. Our results also showed that mean CBF is higher in participants with venous hyperintensity, while OEF is not different between participants with and without hyperintensity.
Pathophysiology of cerebral capillary shunting
In patients with SCA, blood oxygen carrying capacity (product of total hemoglobin, CBF, and arterial oxygen saturation) is frequently reduced due to the dominant effect of reduced total hemoglobin. This can result in arteriolar vasodilation and increases in arterial flow velocity to increase CBF. However, the impact of elevated arterial flow velocity on capillary shunting in SCA is generally not well-characterized. In such elevated flow velocity conditions, it is conceivable that erythrocyte flow through the capillaries is accelerated, leading to a shorter transit time with a corresponding reduction in the efficiency of oxygen offloading to tissue per volume of blood. This effect may also be exacerbated when large vessel cerebral vasculopathy is present. If blood water transit is accelerated, this should manifest as an increase in venous pCASL signal intensity and can be tracked noninvasively (Figure 1).
We found that this hyperintensity corresponds with higher cervical flow velocities. We also measured tissue-level hemo-metabolic parameters, such as CBF and OEF, and compared these values against the presence and degree of venous hyperintensity. Our results showed that GM CBF is significantly elevated in participants with venous hyperintensities compared to those without (Figure 5(c)), while OEF is not different between the groups (Figure 5(a)). The finding of elevated CBF in the group with venous hyperintensities is not unexpected given that arterial flow velocities are elevated in this group. An unexpected finding was the insignificant difference in OEF between the two groups, where no association with venous hyperintensity was observed (Figure 5(a)). This may indicate that oxygen off-loading in adults with SCA is largely preserved with respect to the elevated velocities at which the blood traverses the capillaries; in other words, a shunting artifact observed on ASL does not necessarily translate to impaired OEF because elevations in capillary flow velocities may not be high enough to impair oxygen delivery. However, in patients with very high flow velocities, oxygen delivery may begin to become impaired at a critical threshold of rapid capillary transit time.
Ostergaard et al. 10 have elaborated on capillary dysfunction as a potential cause for cerebral SVD. This model describes that in the normal brain, capillary flow patterns homogenize to optimize oxygen extraction. This homogenization is described at least in part as a passive property of normal microvascular networks: as CBF increases, the blood (and blood flow velocity) tends to distribute homogenously across the capillary bed. However, more heterogeneity may exist in cerebrovascular disease, potentially related to underlying cerebral vasculopathy in SCA, leading to regionally elevated flow velocities and less efficient offloading of oxygen to tissue. To examine the value of venous hyperintensity in understanding this effect in SCA, we compared CBF values of participants with SCA to participants without SVD taking into account the presence or absence of venous hyperintenstity. In SCA participants with venous hyperintensity, there was a trend toward reduced CBF when SVD was present, whereas no such difference was observed in SCA participants without venous hyperintensity. No such differences were observed when making analogous comparisons with OEF in SCA participants. A prospective, longitudinal follow-up of patients is necessary to better understand the potential role of capillary shunting on stroke risk.
Alternate explanations for venous hyperintensity
The observed venous hyperintensities could be caused by other factors. First, the lifetime of the magnetic labeling of arterial blood water is a function of the longitudinal relaxation time T1 of blood, which depends on hematocrit. 25 Thus, lower hematocrits typically observed in participants with SCA could result in longer blood water T1, allowing for the presence of labeled water spins to be detected in the venous sinuses of participants with SCA, but not controls. However, blood water T1 of SCA participants (∼1.9 s) differs from T1 of control participants (∼1.6 s) by only a few hundred milliseconds. 25 In addition, the blood T1 of participants with SCA and no venous hyperintensity compared to those with diffuse hyperintensity differs by an even smaller amount (less than 100 ms).
Second, participant motion during pCASL imaging can manifest as hyperintense signal around the edge of the brain in pCASL images. 28 It is possible that artifacts due to participant motion may be misinterpreted as venous hyperintensity if in proximity to the sagittal sinus. However, venous hyperintensities occur in a distinctly different pattern than motion artifacts and can be tracked contiguously through multiple slices. As through-slice continuity along the vein was required in grading, artifact due to motion is unlikely to be the primary source of the venous hyperintensity.
Third, the PLD = 1900 ms used was based on previous pCASL SCA studies and ranges of BATs. 9 It is possible that if we increased the PLD, venous hyperintensity would be observed in additional subjects. While we cannot rule out this possibility, we do not expect extending the PLD to change the study findings substantially given the high cervical flow velocities, reduced BATs, and lack of extensive collateralization (e.g. moyamoya syndrome) in SCA patients.
Limitations of study
First, phase contrast MRA data for flow velocity determination was only available in 49 of 62 participants. These scans were prioritized and prospectively collected for this study once venous hyperintensities were identified and became a source of interest. Second, the sample size of control (n = 16) and SCA participants (n = 46) utilized in this study is modest. Therefore, while we have provided evidence for the prevalence of venous hyperintensity in SCA and its association with elevated flow velocity, a larger longitudinal study may be required to fully understand the clinical relevance of this phenomenon to SVD in SCA. One challenge when defining clinical impairment in SCA is that silent cerebral infarctions accumulate across the lifespan 5 and may occur at times of anemic crisis or other systemic illness, while overt ischemic strokes have the highest incidence in early childhood and in adults older than 50 years. 29 Therefore, studying individuals with venous hyperintensity prospectively over time to see if new instances of small vessel infarcts occur may be beneficial; these limitations may also underlie why no relationship was found between prior SVD and the venous hyperintensity. Third, the number of control participants (n = 16) in this study differed from the total number of SCA participants (n = 46). This was in part due the exclusion of data from a high number (n = 8) of control volunteers with incidental abnormal findings on MRI. However, the number of controls included more closely matches the individual groups of SCA participants with hyperintensity score = 1 (n = 16), score = 2 (n = 22), and score = 3 (n = 8), allowing for a fair comparison between these four groups. Of note, of the six volunteers who were excluded for findings possibly indicative of vascular disease, 50% exhibited venous hyperintensity artifacts; this was an unexpected and interesting finding that warrants further study to assess whether this phenomenon is an indicator of microvascular disease in the general population. Fourth, TRUST MRI was utilized in this study for OEF, and subsequently CMRO2, estimation with previously reported calibration models derived from bovine blood. While bovine blood is reported to have similar MR properties with respect to human blood with HbA, the presence of HbS on relaxation properties has yet to be fully characterized. Therefore, the OEF values reported in this study assume that the previously reported calibration models are applicable in the SCA patient population. Preliminary results from ongoing work in our laboratory 7 and others 30 have shown that relaxation properties may not be significantly different between blood with HbA and HbS, but further study is required in order to fully understand these effects. Finally, pCASL inversion efficiency was not measured on an individual basis in this study. Instead, group-based labeling efficiencies as previously reported 9 in SCA adults and age- and race-matched controls were utilized for CBF computation. While not as accurate as utilizing subject-specific inversion efficiencies, utilizing these group means reduces the error in CBF computation in SCA patients compared to assuming an efficiency appropriate for controls.
Conclusion
We found evidence for increased prevalence of venous signal hyperintensities in pCASL CBF images in adults with SCA compared to controls. Furthermore, we observed the presence and degree of these venous hyperintensities are associated with elevated arterial flow velocities, consistent with capillary shunting, and that for individuals with very high flow velocities, CBF and CMRO2 may be reduced. This novel construct may be a useful tool for understanding SVD in adults with SCA and the relationship to overt and silent stroke risk.
Footnotes
Funding
The author(s) disclosed receipt of the following financial support for the research, authorship, and/or publication of this article: This work was supported by the National Institutes of Health (NIH/NINDS grant number 5R01NS078828; NIH/NCATS grant number UL1 TR000445 to Vanderbilt University) and the American Heart Association (grant number 14CSA20380466).
Declaration of conflicting interests
The author(s) declared no potential conflicts of interest with respect to the research, authorship, and/or publication of this article.
Authors’ contributions
Meher R Juttukonda: Involved in study conception and design, data acquisition, analysis and interpretation of data, and manuscript drafting. Manus J Donahue: Involved in study conception and design, data acquisition, analysis and interpretation of data, and manuscript revision. Larry T Davis: Involved in analysis and interpretation of data and manuscript revision. Melissa C Gindville, Chelsea A Lee, Niral Patel: Involved in data acquisition and manuscript revision. Adetola A Kassim, Sumit Pruthi, Jeroen Hendrikse: Involved in interpretation of data and manuscript revision. Lori C Jordan: Involved in study conception and design, analysis and interpretation of data, and manuscript revision.