
Abstract
Hemodialysis (HD) is the most regularly applied replacement therapy for end-stage renal disease, but it may result in brain injuries. The correlation between cerebral blood flow (CBF) alteration and iron deposition has not been investigated in patients undergoing HD. Ferritin level may be a dominant factor in CBF and iron deposition change. We hypothesize that ferritin level might be the key mediator between iron deposition and CBF alteration. The correlation in the putamen was estimated between the susceptibility values and CBF in patients undergoing HD. Compared with healthy controls, patients showed more altered global susceptibility values and CBF. The susceptibility value was negatively correlated with CBF in the putamen in patients. Moreover, the susceptibility value was negatively correlated with ferritin level and positively correlated with serum iron level in the putamen of patients. CBF was positively correlated with ferritin level and negatively correlated with serum iron level in the putamen of patients. These findings indicate that iron dyshomeostasis and vascular damage might exist in the putamen in patients. The results revealed that iron dyshomeostasis and vascular damage in the putamen may be potential neural mechanisms for neurodegenerative processes in patients undergoing HD.
Keywords
Introduction
Chronic kidney disease (CKD) results in end-stage renal disease (ESRD), which progresses to a glomerular filtration rate (GFR) <15 ml/min/1.73 m2. 1 Hemodialysis (HD) is the most regularly applied replacement therapy for patients with ESRD, 2 but it may result in brain injury. 3 HD therapy factors include the case itself, frequency, and dialysate and may cause brain damage through hemodynamic fluctuations, such as iron deposition, 4 restless legs syndrome (RLS), 5 progressive cognitive decline, 6 cerebral small vessel disease, 7 and cerebral blood flow (CBF) alteration,8–11 which seriously diminish the quality of life of patients and cause a significant economic burden to society. Under normal physiological conditions, CBF is determined by cerebral perfusion pressure and cerebrovascular resistance. CBF might be kept comparatively perpetual by cerebral autoregulation, a complex inter-reaction of metabolic, angiogenic, and neurogenic mechanisms. HD involves repetitive fluid removal, inducing changes in blood pressure and volume, which may result in circulatory stress. 12 An increase in blood viscosity, acid-balance shifts, and uremic toxin changes followed fluid removal during HD. 13 Whether HD affects these mechanisms owing to intrinsic hemodynamic stress and metabolic changes is currently unknown. All of these procedures can theoretically affect macrmacro microvascular CBF and brain metabolism. Therefore, it is imperative to explain the pathophysiology of CBF alterations in patients undergoing HD.
The abnormal iron deposition is implicated in age-related neurodegenerative disorders, including Alzheimer’s disease 14 and Parkinson’s disease, 15 and patients undergoing HD.5,16 Abnormal iron metabolism and tissue iron overload can be found in the brains of patients undergoing HD, 17 suggesting the role of iron metabolism dysfunction in cognitive impairment development. Iron plays an important role in the development of normal cerebral functions, such as oxyhemoglobin carrying oxygen transport, which contains iron ions. Although our previous study showed that CBF alterations due to vascular injury are involved in the pathological process of HD, 18 the correlation between CBF change and iron deposition has not been investigated. Further investigation in this field, along with the association between CBF and iron deposition, using quantitative imaging and high-resolution techniques, would be especially useful for perceiving their association.
Moreover, the mechanism by which these two changes are related at the pathophysiological level remains unclear. Recent theories have suggested that iron deposition may reflect impaired drainage of iron in the gray matter (GM), which may cause metabolic waste aggregation and subsequent ferroptosis, finally resulting in CBF alteration. 14 Interestingly, some studies using quantitative parametric techniques and new microstructural methods have found that ferritin level might be a dominating factor in CBF change.19–21 Taken together, we hypothesize that ferritin level might be the key mediator between iron deposition and CBF change.
In the current study, we aimed to (1) confirm iron deposition and CBF change in the local and whole brain at the voxel level using quantitative susceptibility mapping (QSM) and arterial spin labeling (ASL) in patients undergoing HD, (2) measure whether laboratory examination data are associated with iron deposition and CBF alterations, and (3) testify whether ferritin level mediates the association between iron deposition and CBF alterations.
Materials and methods
This study was approved by the Medical Ethics Committee of Beijing Friendship Hospital, Capital Medical University. All participants provided informed consent in bye Declaration of Helsinki. Eighty patients (42 men and 38 women; age, 53.2 ± 10.3 years) undergoing HD were recruited, and 80 normal age- and sex-matched participants (41 men and 39 women; age, 51.2 ± 10.2 years) were included as healthy control (HC) in this study (Figure 1). All the participants were right-handed. The demographics and laboratory examinations of all participants are shown in Table 1. The data of nine patients and three HC were excluded because of claustrophobia, head movement, and unqualified image quality. The underlying reason of patients undergoing HD was primary hypertensive nephropathy or glomerulonephritis. GFR was used to diagnose all participants undergoing HD. When the GFR is <15 mL/min/1.73 m2, the participant needs to be hospitalized for maintenance HD in which the dialysis duration is longer than 6 months. All participants undergoing HD underwent HD three times per week as a standard, and a single HD session lasted approximately 4 h. The exclusion criteria were as follows: (I) participants with a history of brain diseases, including stroke, cerebral trauma, cerebral infarct, and tumors; (II) participants receiving other dialysis therapies; (III) participants with diabetic nephropathy; (IV) participants with a history of drug or alcohol abuse; (V) participants with vertigo or intolerance of magnetic resonance (MR) scanning; and (VI) participants with a history of psychiatric disorders.
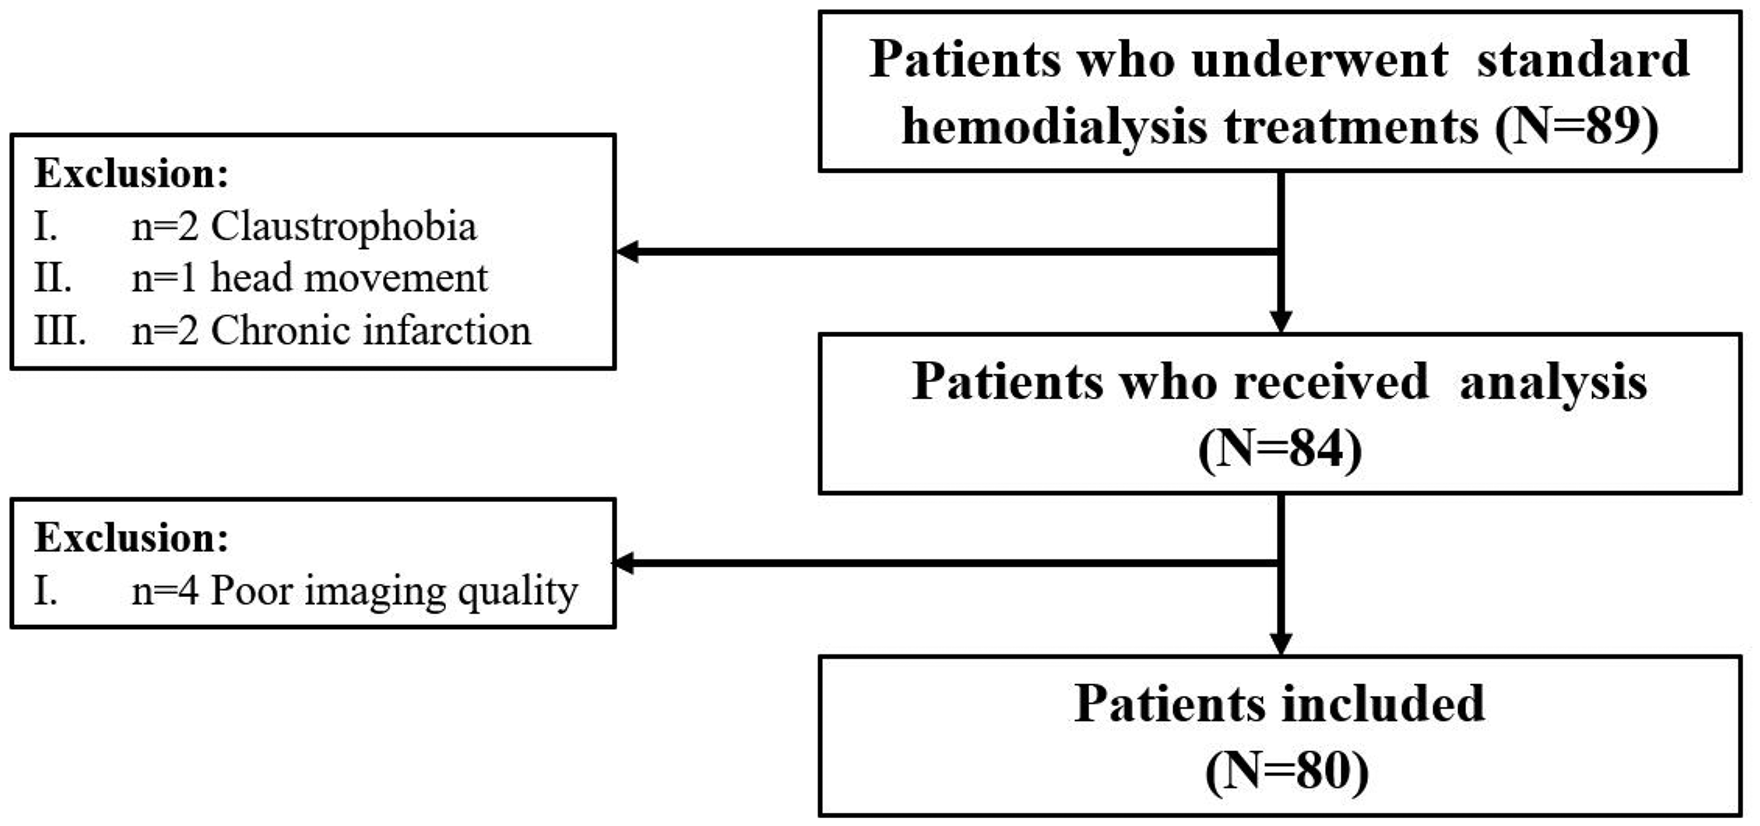
Summary of hemodialysis patient recruitment and exclusions.
Clinicodemographic characteristics of the HD and HC groups.
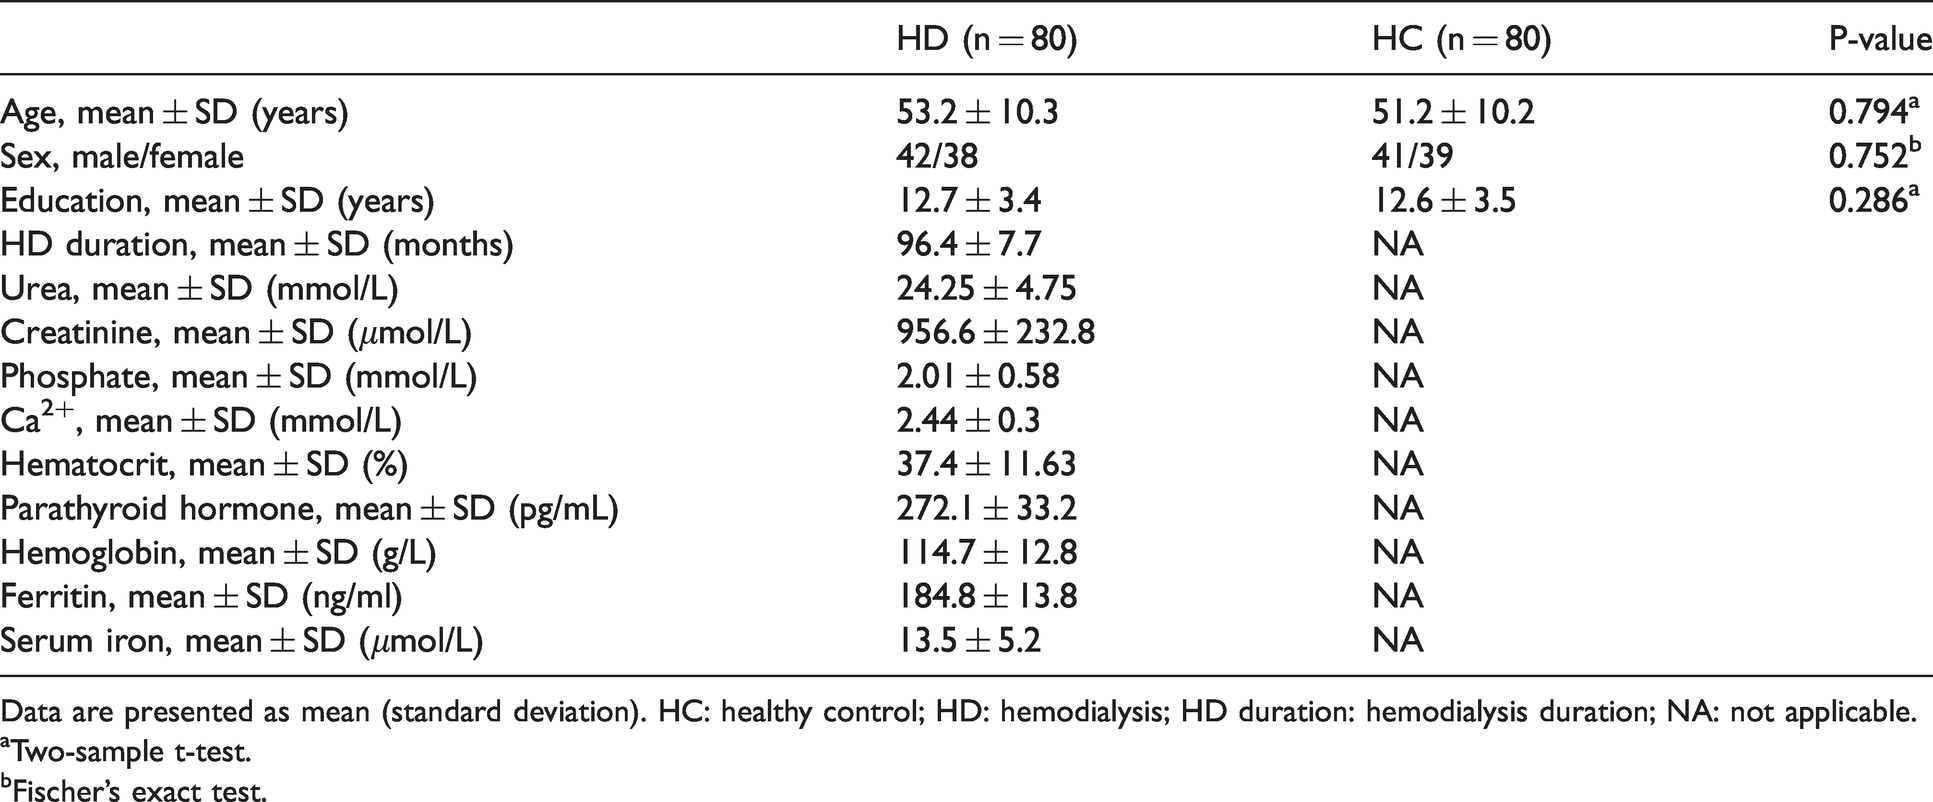
Data are presented as mean (standard deviation). HC: healthy control; HD: hemodialysis; HD duration: hemodialysis duration; NA: not applicable.
aTwo-sample t-test.
bFischer’s exact test.
Magnetic resonance imaging data acquisition
Images were acquired using a 3.0-Tesla MR system with an eight-channel phased array coil (Discovery MR750W, General Electric, Milwaukee, Wisconsin, USA). All participants were required to refrain from consuming caffeine-containing foods or drinks before MR imaging (MRI) scanning.
QSM imaging was acquired using a three-dimensional (3D) multi-echo gradient echo (GRE) sequence with the following parameters: repetition time (TR), 42.3 ms; number of echoes, eight; first echo time (TE), 3.5 ms; flip angle, 12°; field of view (FOV), 256 × 256 mm; reconstruction matrix, 256 × 256; slice thickness, 1.0 mm, with no gap; and axial slices, 140. The perfusion imaging used was pseudo-continuous ASL sequence with a 3D fast spin-echo acquisition and background suppression with the following parameters: TR, 4844 ms; TE, 10.5 ms; FOV, 240 × 240 mm; matrix, 128 × 128; axial slices, 36; slice thickness, 4 mm; labeling duration/post label delay, 2,025 ms/2025 ms; number of excitations, 3; and spiral-in readout, 512 sample points with eight arms. CBF images were obtained from the original ASL data using an MRI scanner. We also acquired separately a pre-saturated proton-density weighted (PD-w) reference scan with background suppression with regular sampling for coil sensitivity and fully-relaxed magnetization (M0) estimation. A structural image was acquired using the 3D brain volume imaging sequence with the following parameters: TR, 8.8 ms; TE, 3.5 ms; inversion time, 450 ms; axial slices, 196 with 1-mm thickness (no gap); matrix, 256 × 256; FOV, 240 × 240 mm; and flip angle, 15° (Supplementary Figure 1).
Before each scan, participants were instructed to relax with their eyes closed, not think of anything in particular, and avoid falling asleep. Soft foam padding and earplugs were used to minimize head motion, and earplugs were used to reduce head movement and scanner noise.
QSM image reconstruction and voxel-based analysis
The QSM images reconstructed from the phase image data were obtained using Prof. Liu’s STI Suite (http://people.eecs.berkeley.edu/∼chunlei.liu/software.html). The QSM reconstruction methods were presented in our previous study. 5 All QSM images were visually inspected to screen for artifacts or gross anatomical abnormalities. The post-processing procedures were as follows. First, a Laplacian-based phase unwrapping method was used to obtain the phase images. 22 Second, the variable spherical kernel size method was used to eliminate the background phase with the radius of the spherical kernel increasing from 0.6 mm at the boundary of the brain to 25 mm toward the center of the brain. 23 Finally, susceptibility maps were derived from the frequency map of the brain tissue using an improved LSQR method.22,24 In previous QSM studies, susceptibility values were estimated directly for comparison without reference to any selected structures,23,25 In the current study, the reference susceptibility value was set as the mean susceptibility of the whole brain. The mean susceptibility of the whole brain is least likely to be biased by variations in any single structure because it contains all composition sources. Thus, it is the most stable reference available 26 (Figure 2(a)).
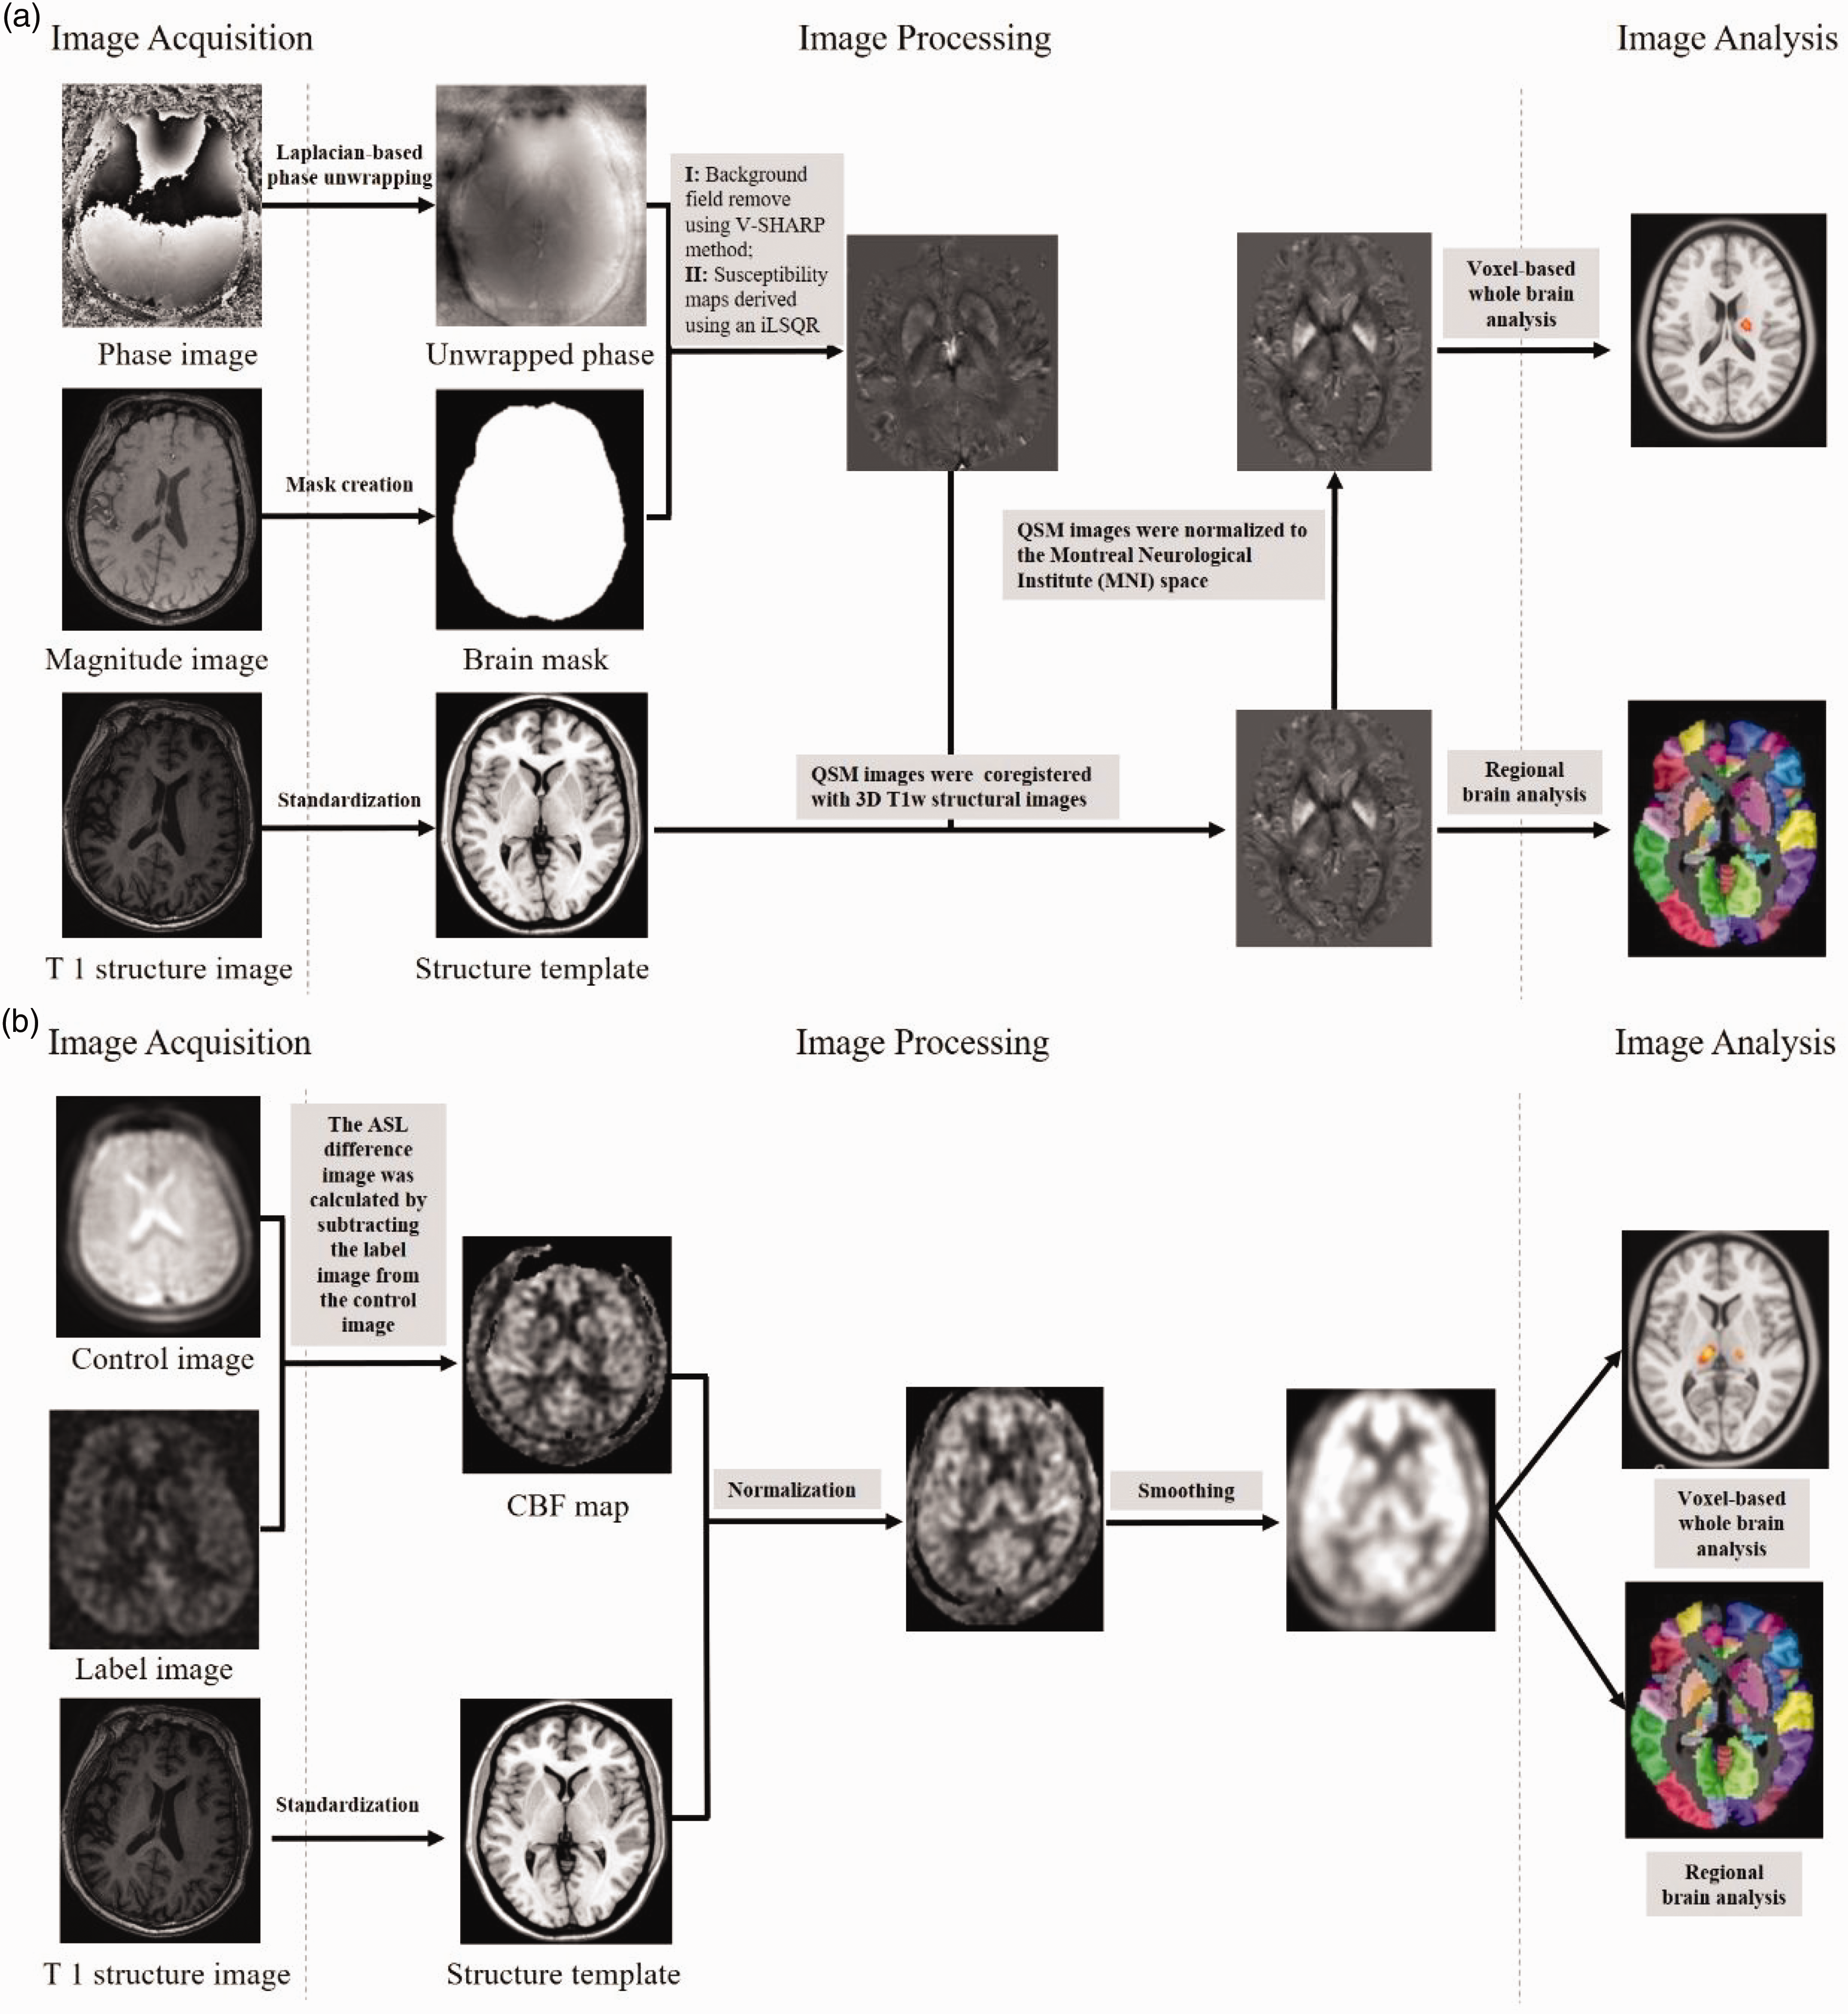
Summary steps of the processing pipeline for QSM and CBF reconstruction (phase pre-processing and map estimation) and whole brain/regional analysis. (a) QSM reconstruction and whole brain/regional analysis and (b) CBF standardization, normalization and whole brain/regional analysis.
QSM images were preprocessed using Statistical Parametric Mapping 12 (SPM12) software and code written in MATLAB 2018 b (MathWorks, Natick, MA, USA). First, to normalize the QSM maps to Montreal Neurological Institute (MNI) space, the T1 structural images of each participant were co-registered to the first echo amplitude image acquired using a multi-echo GRE sequence. Second, the co-registered T1 images were normalized to MNI space using FSL (www.fmrib.ox.ac.UK/FL, version 6.0), and all the QSM images were transformed into MNI space. Standardized QSM images were then smoothed with a 6-mm isotropic Gaussian kernel to reduce interindividual variability. Finally, the normalized QSM maps between the HD and HC groups were compared at the voxel-level in the GM mask of the whole brain using SPM12. 27 To eliminate the influence of cerebral atrophy, total intracranial volume (TIV) was considered a nuisance covariate.
After estimating the whole-brain susceptibility value changes associated with patients undergoing HD, brain regions with significant differences were derived using the Automated Anatomical Labeling (AAL) atlas. The susceptibility values of these regions were extracted, and the mean susceptibility values were compared between the two groups using a two-sample independent t-test, which can provide additional information on the degree of change.
Cerebral blood flow calculation and analysis
The methods of ASL calculation were presented in our previous studies.11,18 All ASL images were visually inspected to screen for artifacts or gross anatomical abnormalities. Quality controls were used to exclude unqualified results. The ASL difference image was calculated by subtracting the label image from the control image using the single compartment model. 28 The three ASL difference images were averaged to estimate the CBF maps in combination with proton density-weighted reference images. 29 Data preprocessing was performed using SPM12. Using a nonlinear transformation in SPM12, CBF images of 80 HC were co-registered to a positron emission tomography perfusion template in the MNI space. The mean co-registered CBF map of 80 HC was defined as the standard CBF template. The CBF maps of all participants (HC and patients) were co-registered to the standard CBF template of the MNI and resampled to a 2 × 2 × 2-mm voxel size. A 6-mm full-width at half-maximum (FWHM) Gaussian kernel was used to smooth each co-registered CBF image. The CBF of each voxel was normalized by dividing it by the mean CBF of the whole brain. To eliminate the influence of cerebral atrophy, TIV was considered a nuisance covariate (Figure 2(b)).
After estimating the whole-brain CBF changes associated with patients undergoing HD, brain regions with significant differences were derived using the AAL atlas. The normalized CBF of these grey matter regions was extracted and compared between the two groups using a two-sample independent t-test, which can provide additional information on the degree of change.
GMV image segmentation and analysis
Voxel-based morphometry analysis was performed using a computational anatomy toolbox (CAT12) implemented in SPM12 software. The CAT12 software (http://www.neuro.uni-jena.de/cat/) was used to calculate GMV in our previous study. 30 First, spatially co-registered T1-weighted images were normalized to the MNI space by applying the Diffeomorphic Anatomical Registration Through Exponentiated Lie Algebra algorithm. Second, bias field inhomogeneity was corrected. Third, by applying the standard unified segmentation model, structural images were segmented into white matter, GM, and cerebrospinal fluid. Owing to the spatial registration, the segmentations were normalized by scaling with numerous volume changes. The total amount of GM in the normalized image was the same as that in the original image. Finally, a 6-mm FWHM Gaussian kernel was used to smooth the GMV images to reduce interindividual variability. Total intracranial volume (TIV) was used as a covariate in the statistical analysis of QSM and CBF.
Correlations among CBF, susceptibility value, and ferritin and serum iron levels
To test whether the susceptibility value and CBF of brain regions with significant between-group differences correlated with the clinical data, region of interest (ROI)-based Pearson’s correlation analyses between imaging measures and clinical data were performed. Given the exploratory nature of these correlation analyses, a significance threshold was set at P < 0.05. Age, sex, and HD duration were considered nuisance covariates.
Statistical analysis
Statistical analysis was performed using SPSS v.22.0 (Chicago, IL) and GraphPad Prism 9. Kolmogorov-Smirnov testing estimated that the susceptibility value and CBF value were normally distributed. Group differences in age and education were examined by two-tailed t-tests. Chi-square test was used to find out whether sex was different among groups. Group differences in susceptibility value and CBF value were tested using voxel-wise t-tests with age and sex as covariates. For t-tests of susceptibility value and CBF value, we used an FDR method with a significance threshold of P < 0.05. Pearson correlation analyses were used to test the associations between the susceptibility values and CBF values in putamen and laboratory examination data (urea, creatinine, phosphate, parathyroid hormone, ferritin, serum iron, and hemoglobin) of the HD patients. Multiple comparisons were corrected using the Bonferroni method (P < 0.05/7 = 0.0071).
Results
Demographics and clinical characteristics
Eighty patients (42 men and 38 women) undergoing HD and 80 HC (41 men and 39 women) were recruited for this study. The demographic and clinical features of the participants are presented in Table 1. The two groups were well matched in terms of sex (χ2 = 2.237, P = 0.752), education (two-sample t-test, F = 0.669, P = 0.286), and age (two-sample t-test, F = 0.121, P = 0.794). Moreover, the levels of urea, creatinine, phosphate, Ca2+, hematocrit, parathyroid hormone, and hemoglobin are shown in Table 1.
Between-group differences in the susceptibility value
For voxel-based analysis, the susceptibility value differences between the HD and HC groups are shown in Figure 3 and Supplementary Table 1. Compared with the HC group, the HD group exhibited increased susceptibility in the right putamen (cluster size = 21 voxels, peak MNI coordinate x/y/z = 20/−12/20, peak t = 6.24), right thalamus (cluster size = 19 voxels, peak MNI coordinate x/y/z = 20/−12/20, peak t = 6.24), right superior frontal gyrus/precentral gyrus/postcentral gyrus/supplementary motor area (primary motor cortex, cluster size = 650 voxels, peak MNI coordinate x/y/z = 16/−16/72, peak t = 6.84), and left paracentral lobule/precentral gyrus (cluster size = 300 voxels, peak MNI coordinate x/y/z = −14/−22/78, peak t = 6.81) (P < 0.05, cluster-level false discovery rate [FDR] corrected). Compared with the HC group, the HD group exhibited lower susceptibility values in the left inferior frontal gyrus, triangular part/opercular part, left insula (cluster size = 342 voxels, peak MNI coordinate x/y/z = −38/16/10, peak t = −6.45), right inferior frontal gyrus, triangular part/opercular part (cluster size = 308 voxels, peak MNI coordinate x/y/z = 42/28/8, peak t = −6.89), left rolandic operculum (cluster size = 99 voxels, peak MNI coordinate x/y/z = −42/−14/20, peak t = −6.29), and right median cingulate and paracingulate gyri (cluster size = 73 voxels, peak MNI coordinate x/y/z = 2/−24/32, peak t = −6.55) (P < 0.05, cluster-level FDR corrected). Further ROI-based analyses showed that the voxel-based comparison results (Figure 5(a)) and the intergroup differences in susceptibility value of the putamen (t = 0.789, P < 0.05) were significant after adjusting for the age and sex effects.
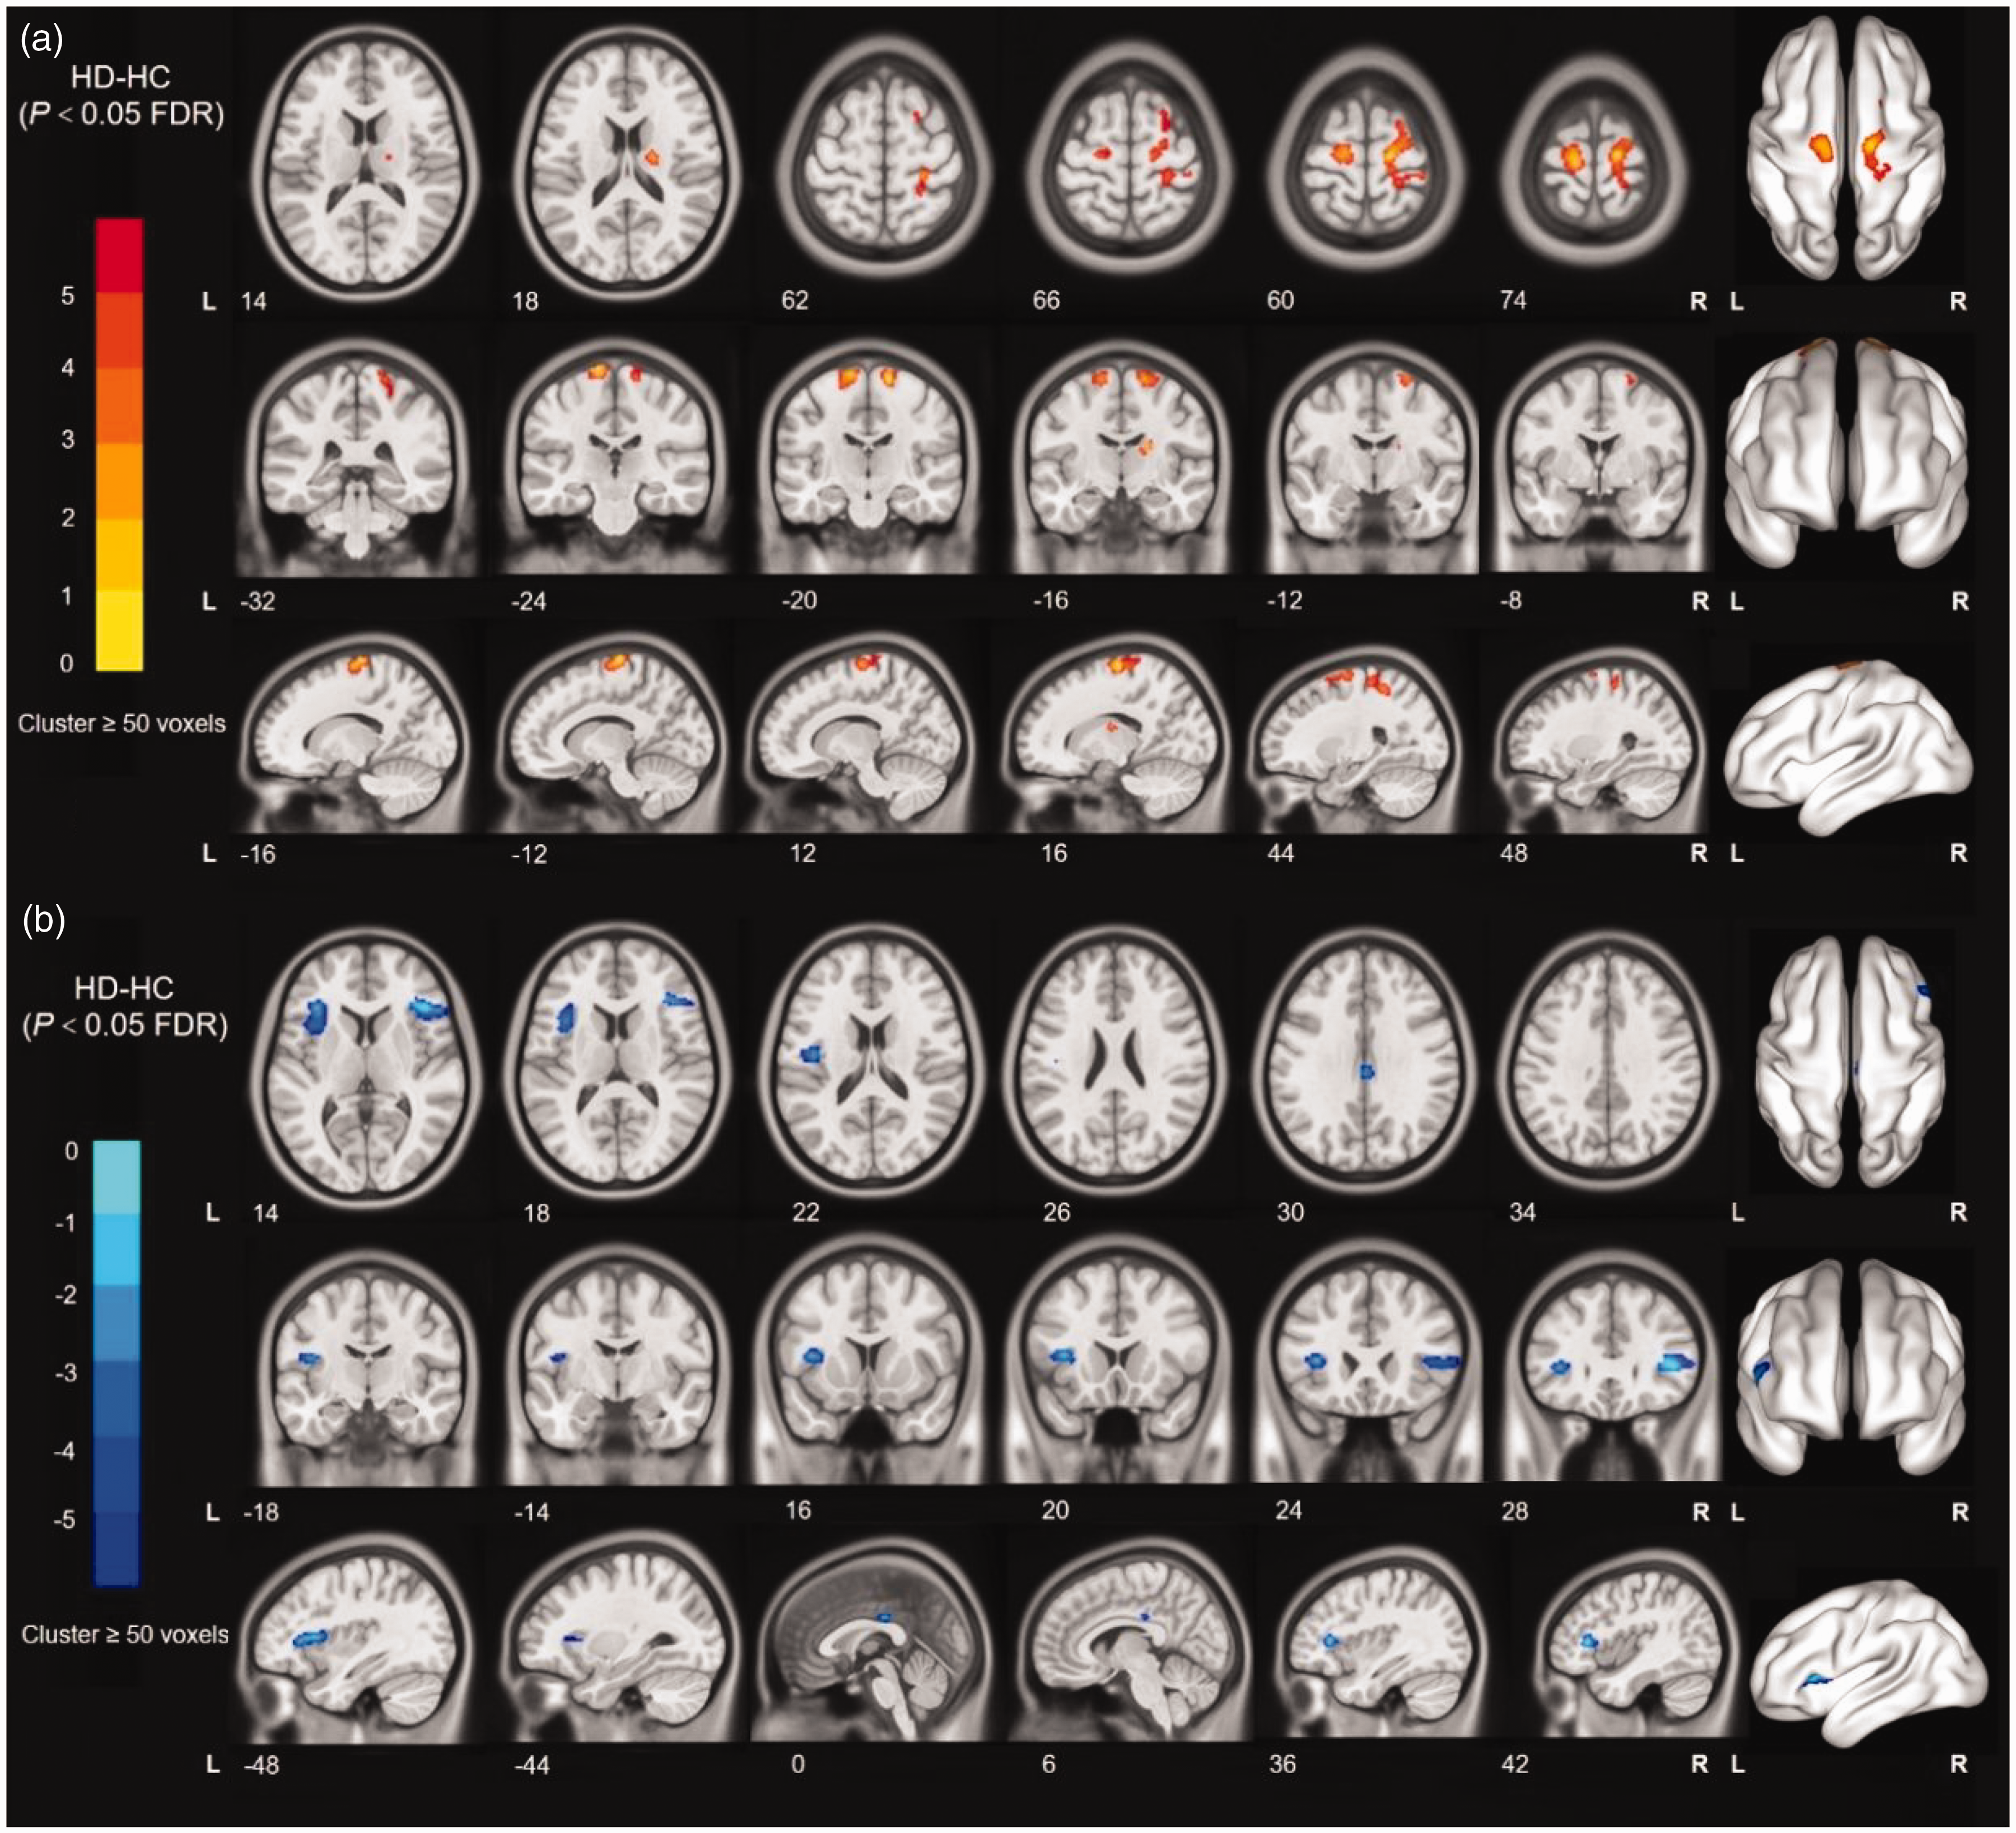
Voxel-based QSM analyses. The results were shown on the study-wise magnitude template in the MNI coordinate system. (a) Yellow/red clusters represent significantly higher susceptibility values in the HD group than in the HC group and (b) Blue/cyan clusters represent significantly lower susceptibility values in the HD group than in the HC group.
Between-group differences in CBF
For voxel-based analysis, the susceptibility value differences between the HD and HC groups are shown in Figure 4 and Supplementary Table 2. Compared with the HC group, the HD group exhibited higher CBF in the left thalamus (cluster size = 172 voxels, peak MNI coordinate x/y/z = −10/−20/6, peak t = 6.09) and right thalamus (cluster size = 43 voxels, peak MNI coordinate x/y/z = 16/−20/6, peak t = 5.62) (P < 0.05, cluster-level FDR corrected). Compared with the HC group, the HD group exhibited lower CBF in the right parahippocampal gyrus (cluster size = 126 voxels, peak MNI coordinate x/y/z = 18/8/−24, peak t = −6.08), left parahippocampal gyrus (cluster size = 28 voxels, peak MNI coordinate x/y/z = −18/4/22, peak t = −5.39), right insula (cluster size = 362 voxels, peak MNI coordinate x/y/z = 44/14/−10, peak t = −7.18), left inferior frontal gyrus, triangular part/opercular part (cluster size = 207 voxels, peak MNI coordinate x/y/z = −38/16/10, peak t = −7.18), left insula/left inferior frontal gyrus/triangular part/opercular part (cluster size = 250 voxels, peak MNI coordinate x/y/z = −40/16/−10, peak t = −6.90), right median cingulate and paracingulate gyri (cluster size = 293 voxels, and peak MNI coordinate x/y/z = 2/38/22, peak t = −7.03) (P < 0.05, cluster-level FDR corrected). Further ROI-based analyses showed voxel-based comparison results (Figure 5(b)); moreover, the intergroup differences in susceptibility values of the putamen and thalamus (t = 0.867, P < 0.05) were significant after adjusting for the age and sex effects.
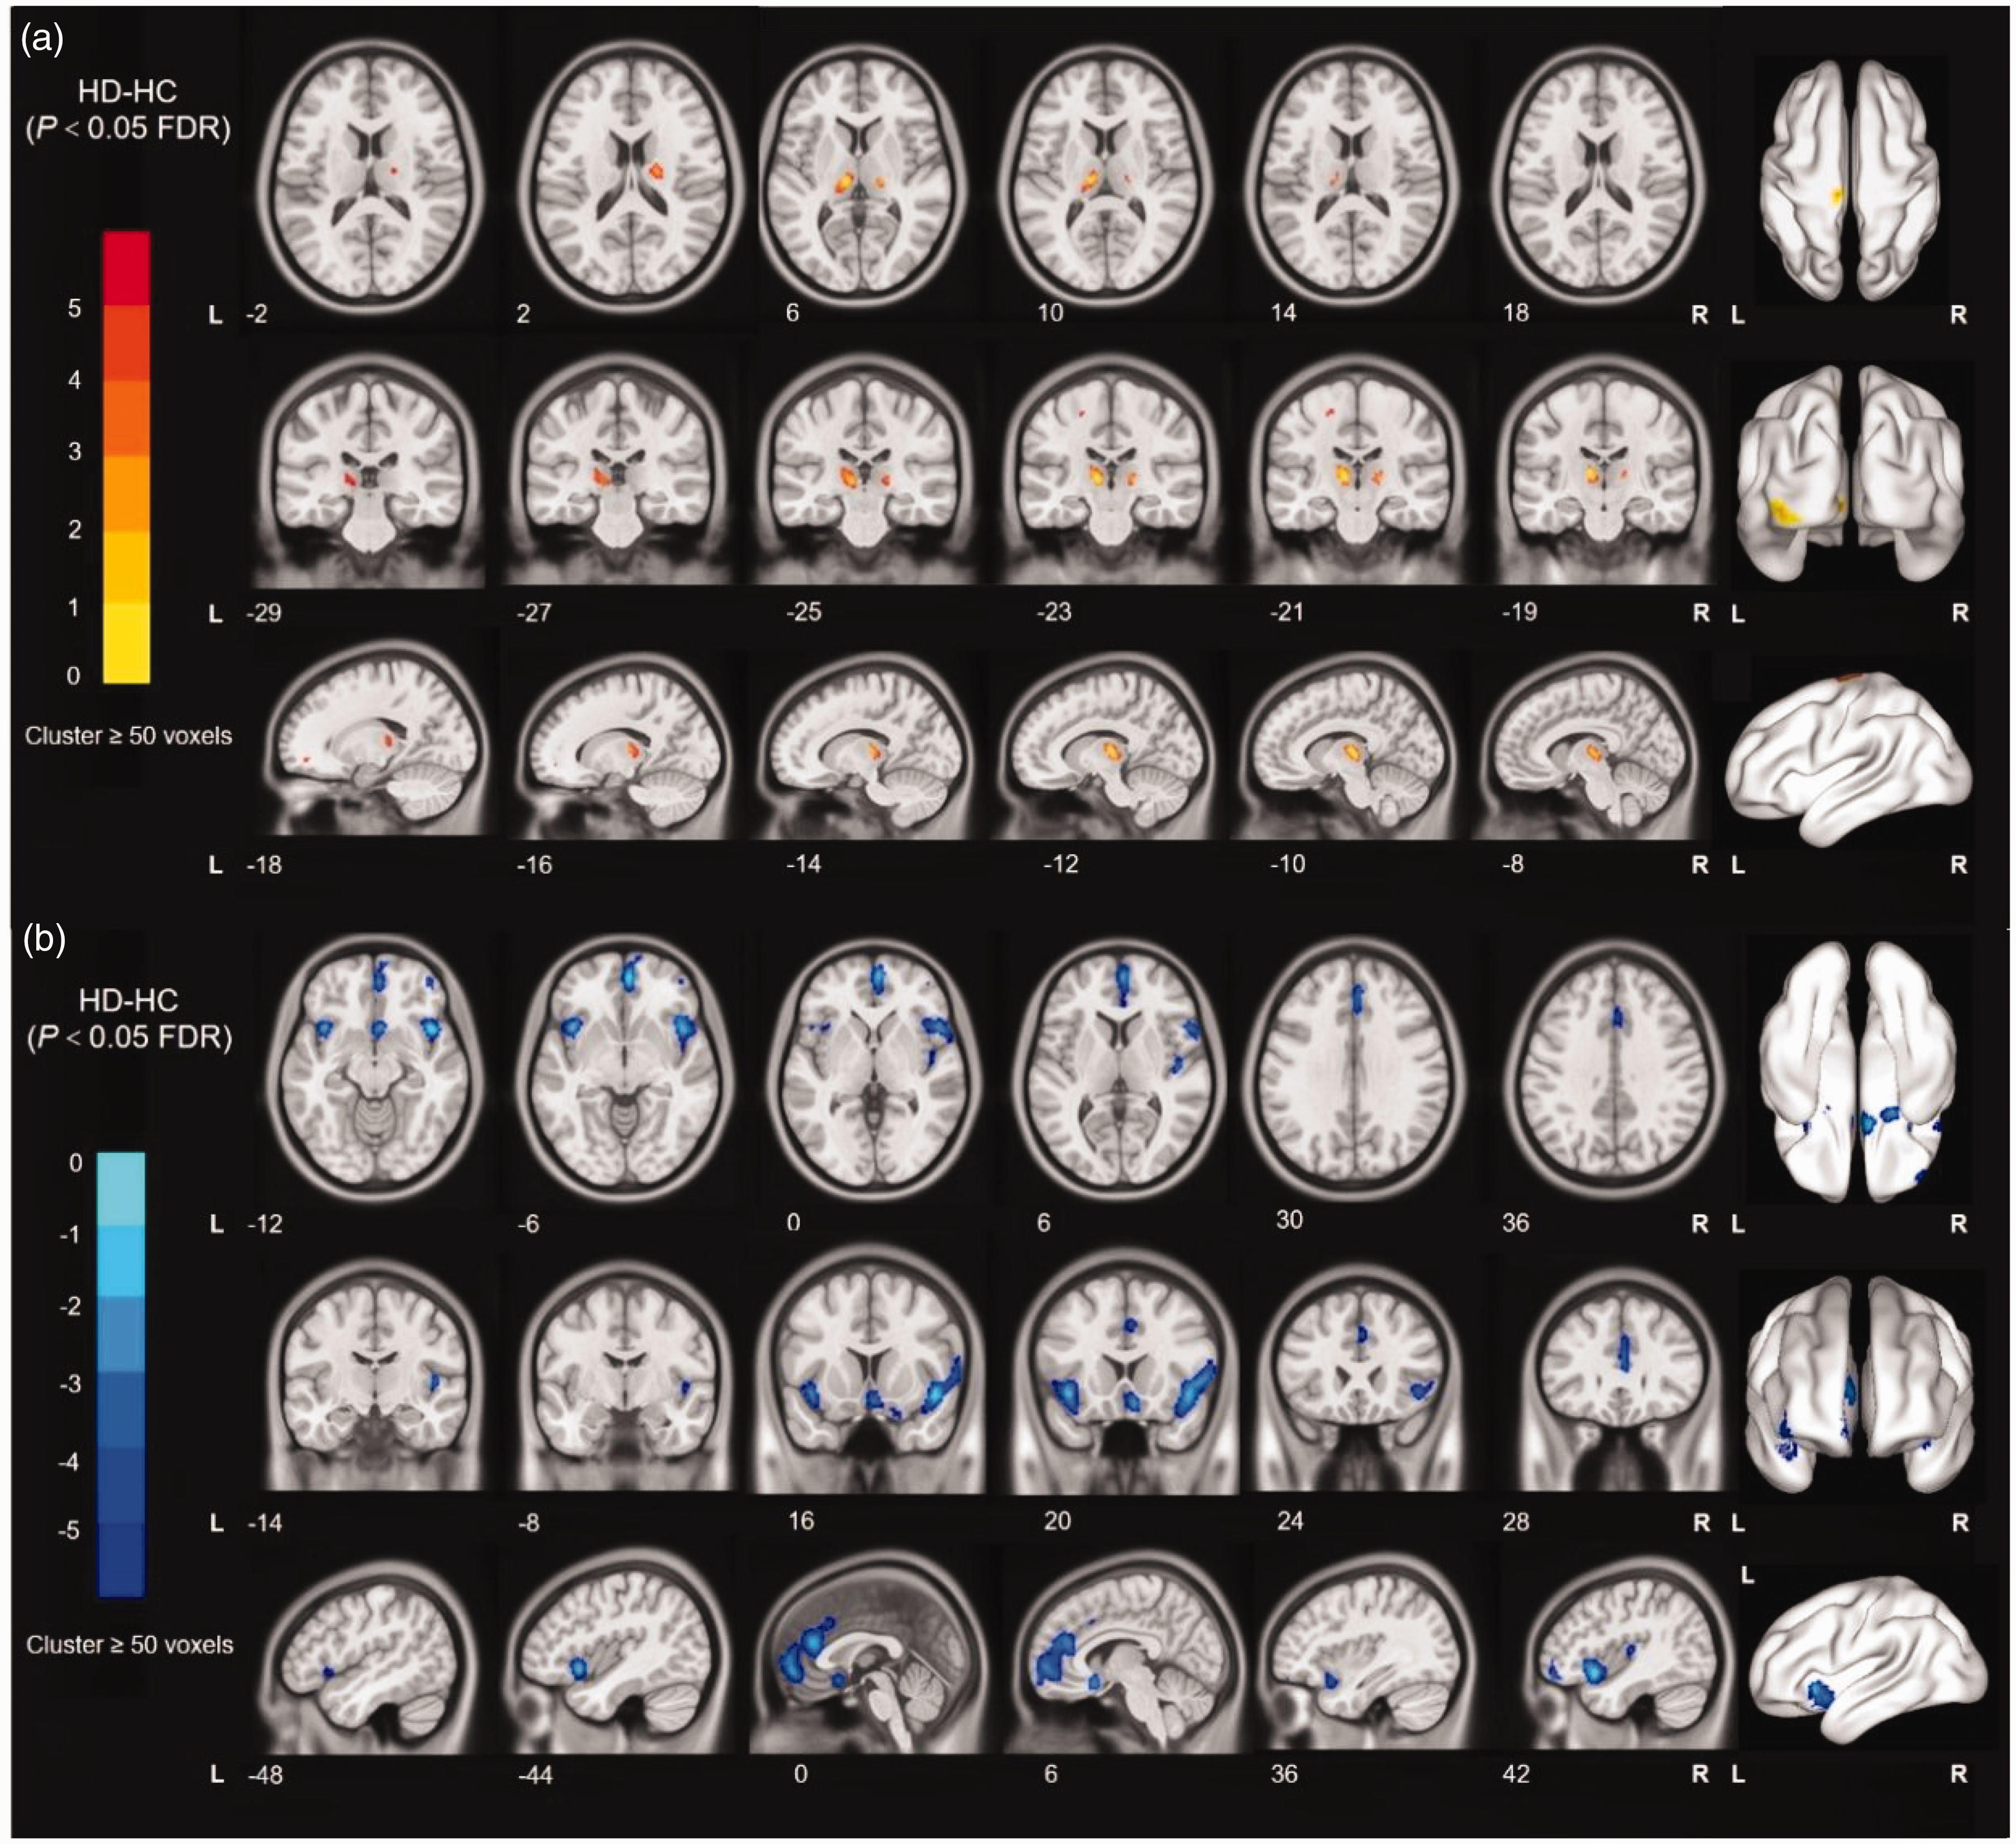
Voxel-based CBF analyses. The results were shown on the study-wise magnitude template in the MNI coordinate system. (a) Yellow/red clusters represent significantly higher CBF values in the HD group than in the HC group and (b) Blue/cyan clusters represent significantly lower CBF values in the HD group than in the HC group.
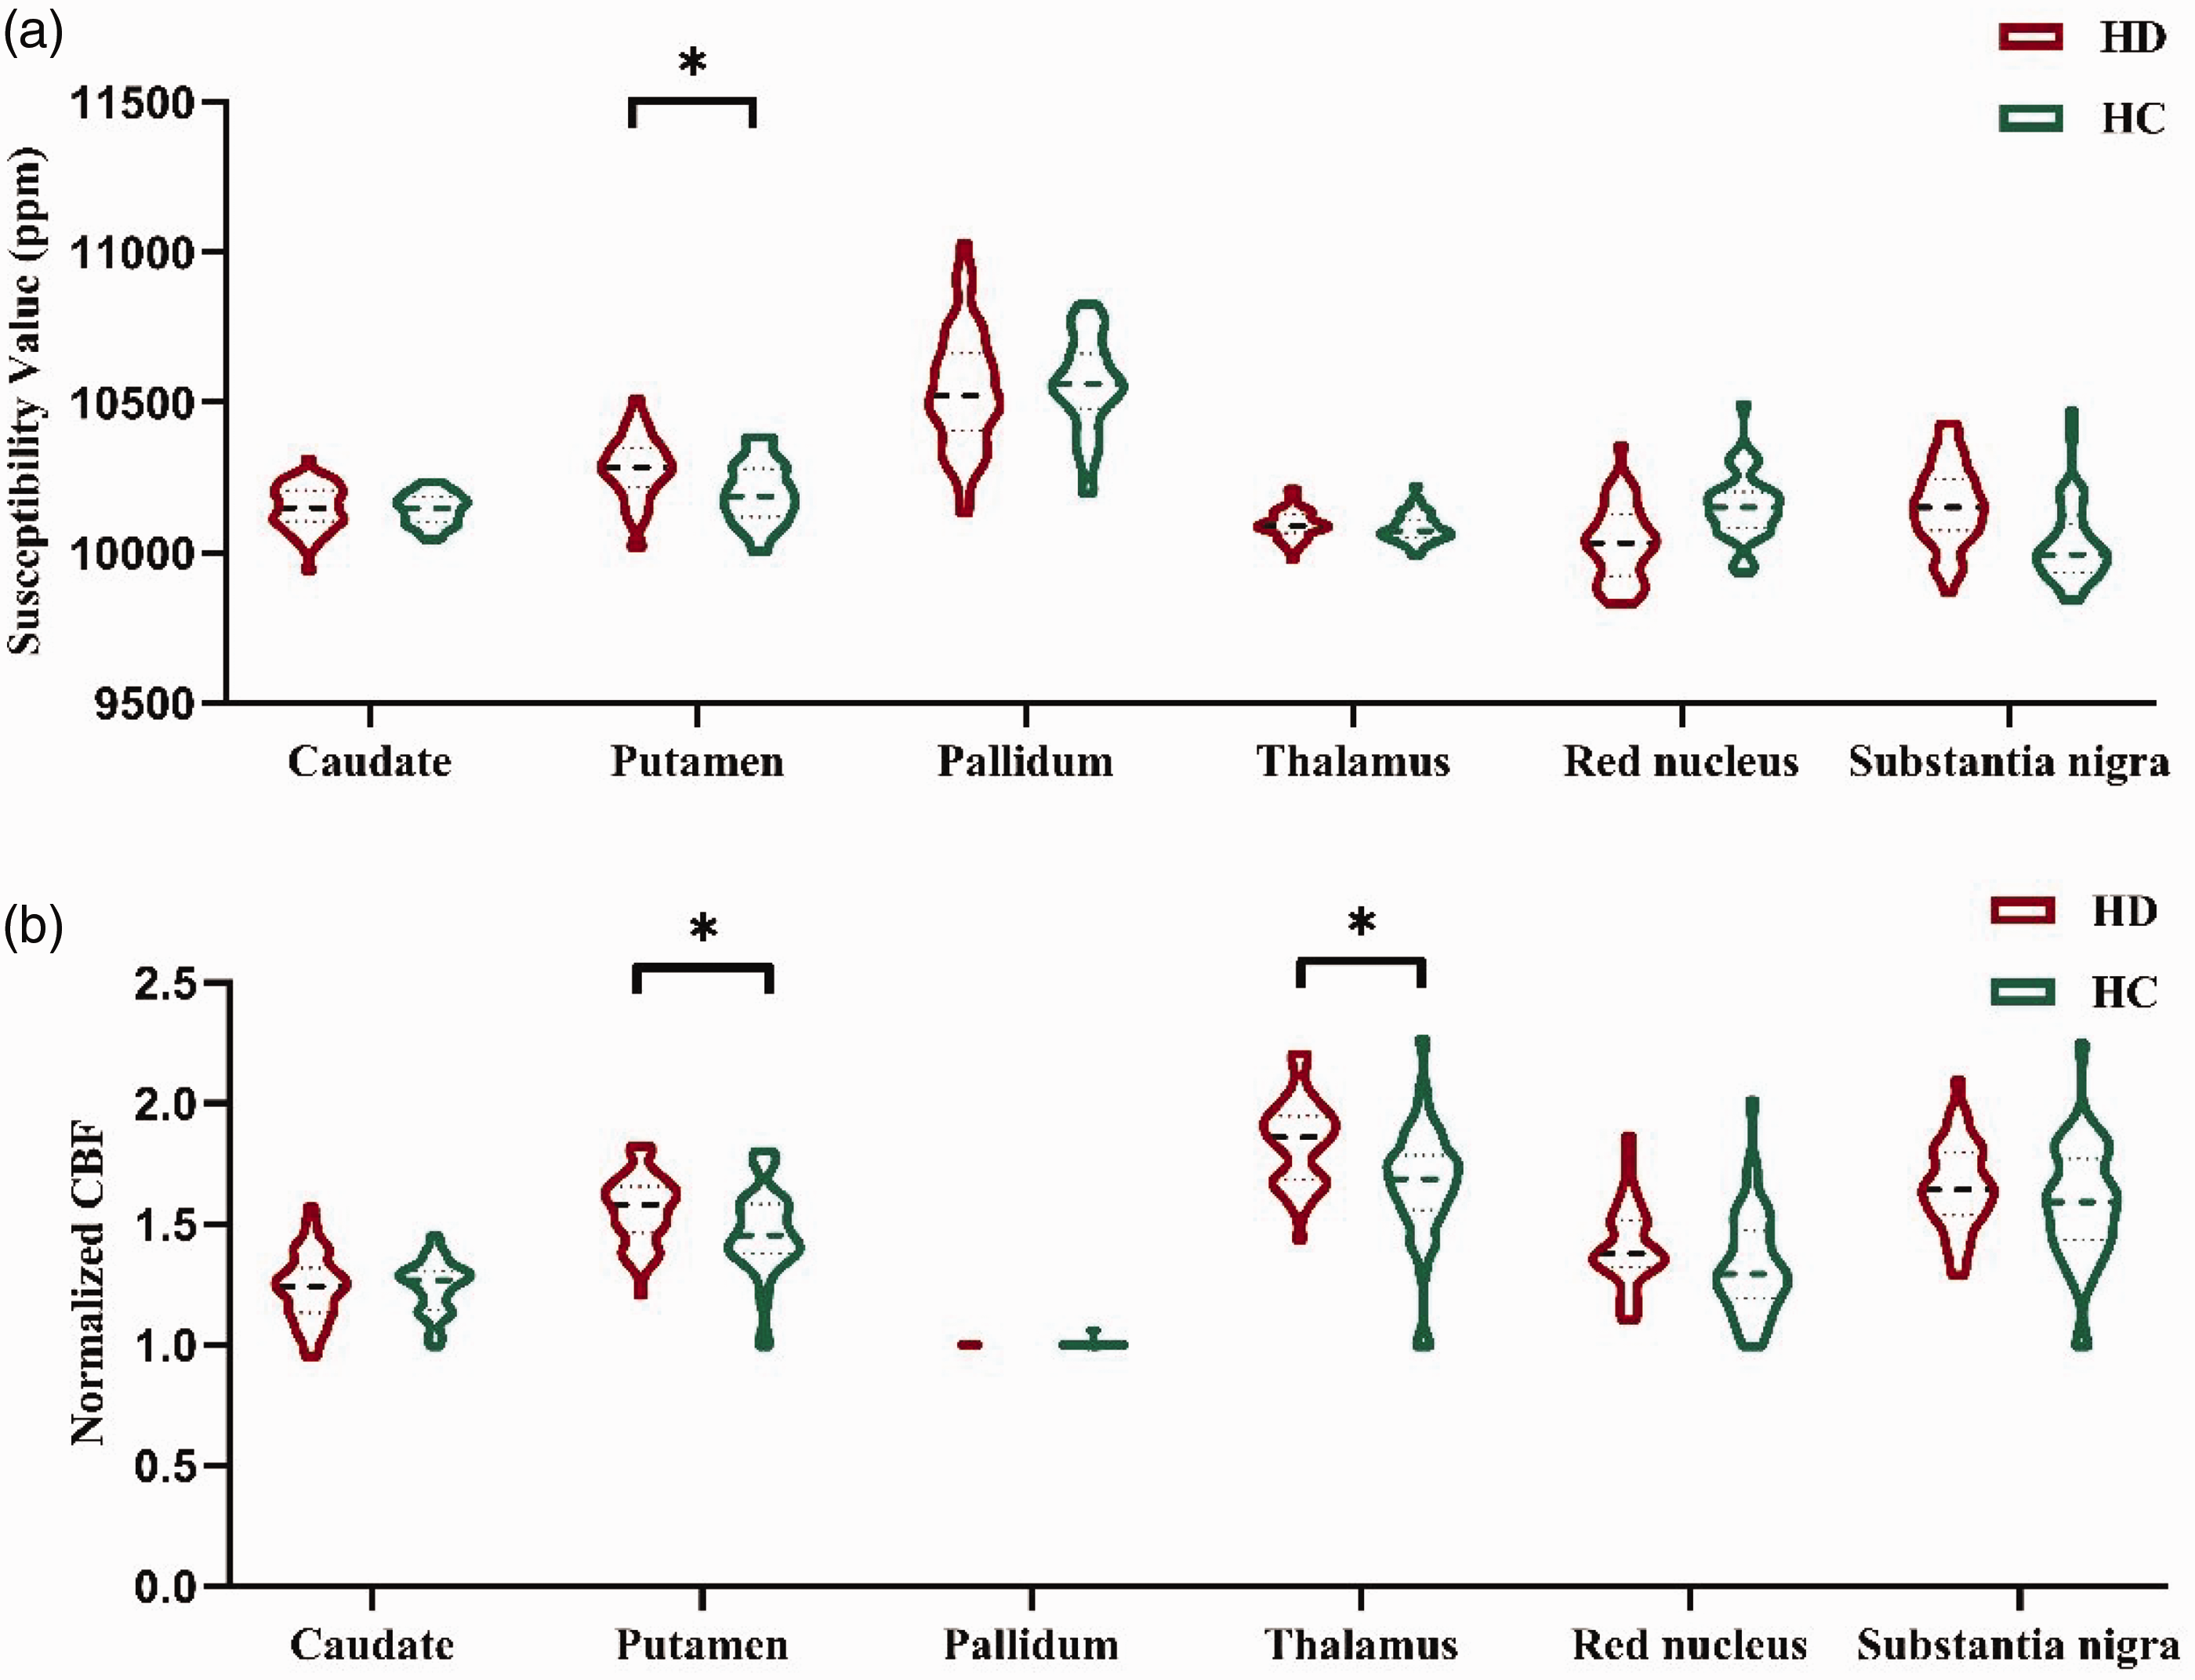
(a) and (b) showed susceptibility values and CBF statistical differences between the two groups for each ROI. Age and sex effects were adjusted for the covariates. The violin plot data were reported as means and quartiles, in which HD = 80 and HC = 80 cases. Asterisks show the strength of the group difference, that is, ∗ = P < 0.05.
Correlation among normalized CBF, susceptibility value, and ferritin and serum iron levels
The significant correlations among the susceptibility value, normalized CBF, and clinical measures are depicted graphically in Figure 6. The normalized CBF in the putamen was positively correlated with ferritin level (r = 0.4635, P = 0.0009) (Figure 6(a)) and negatively correlated with serum iron level (r = −0.5180, P = 0.0072) (Figure 6(c)). Meanwhile, the susceptibility value in the putamen was negatively correlated with ferritin level (r = −0.5063, P = 0.0004) (Figure 6(b)) and positively correlated with serum iron level (r = 0.3924, P = 0.0002) (Figure 6(d)). Interestingly, the normalized CBF was negatively correlated with the susceptibility value in the putamen (r = −0.2396, P = 0.0323) (Figure 6(e)).
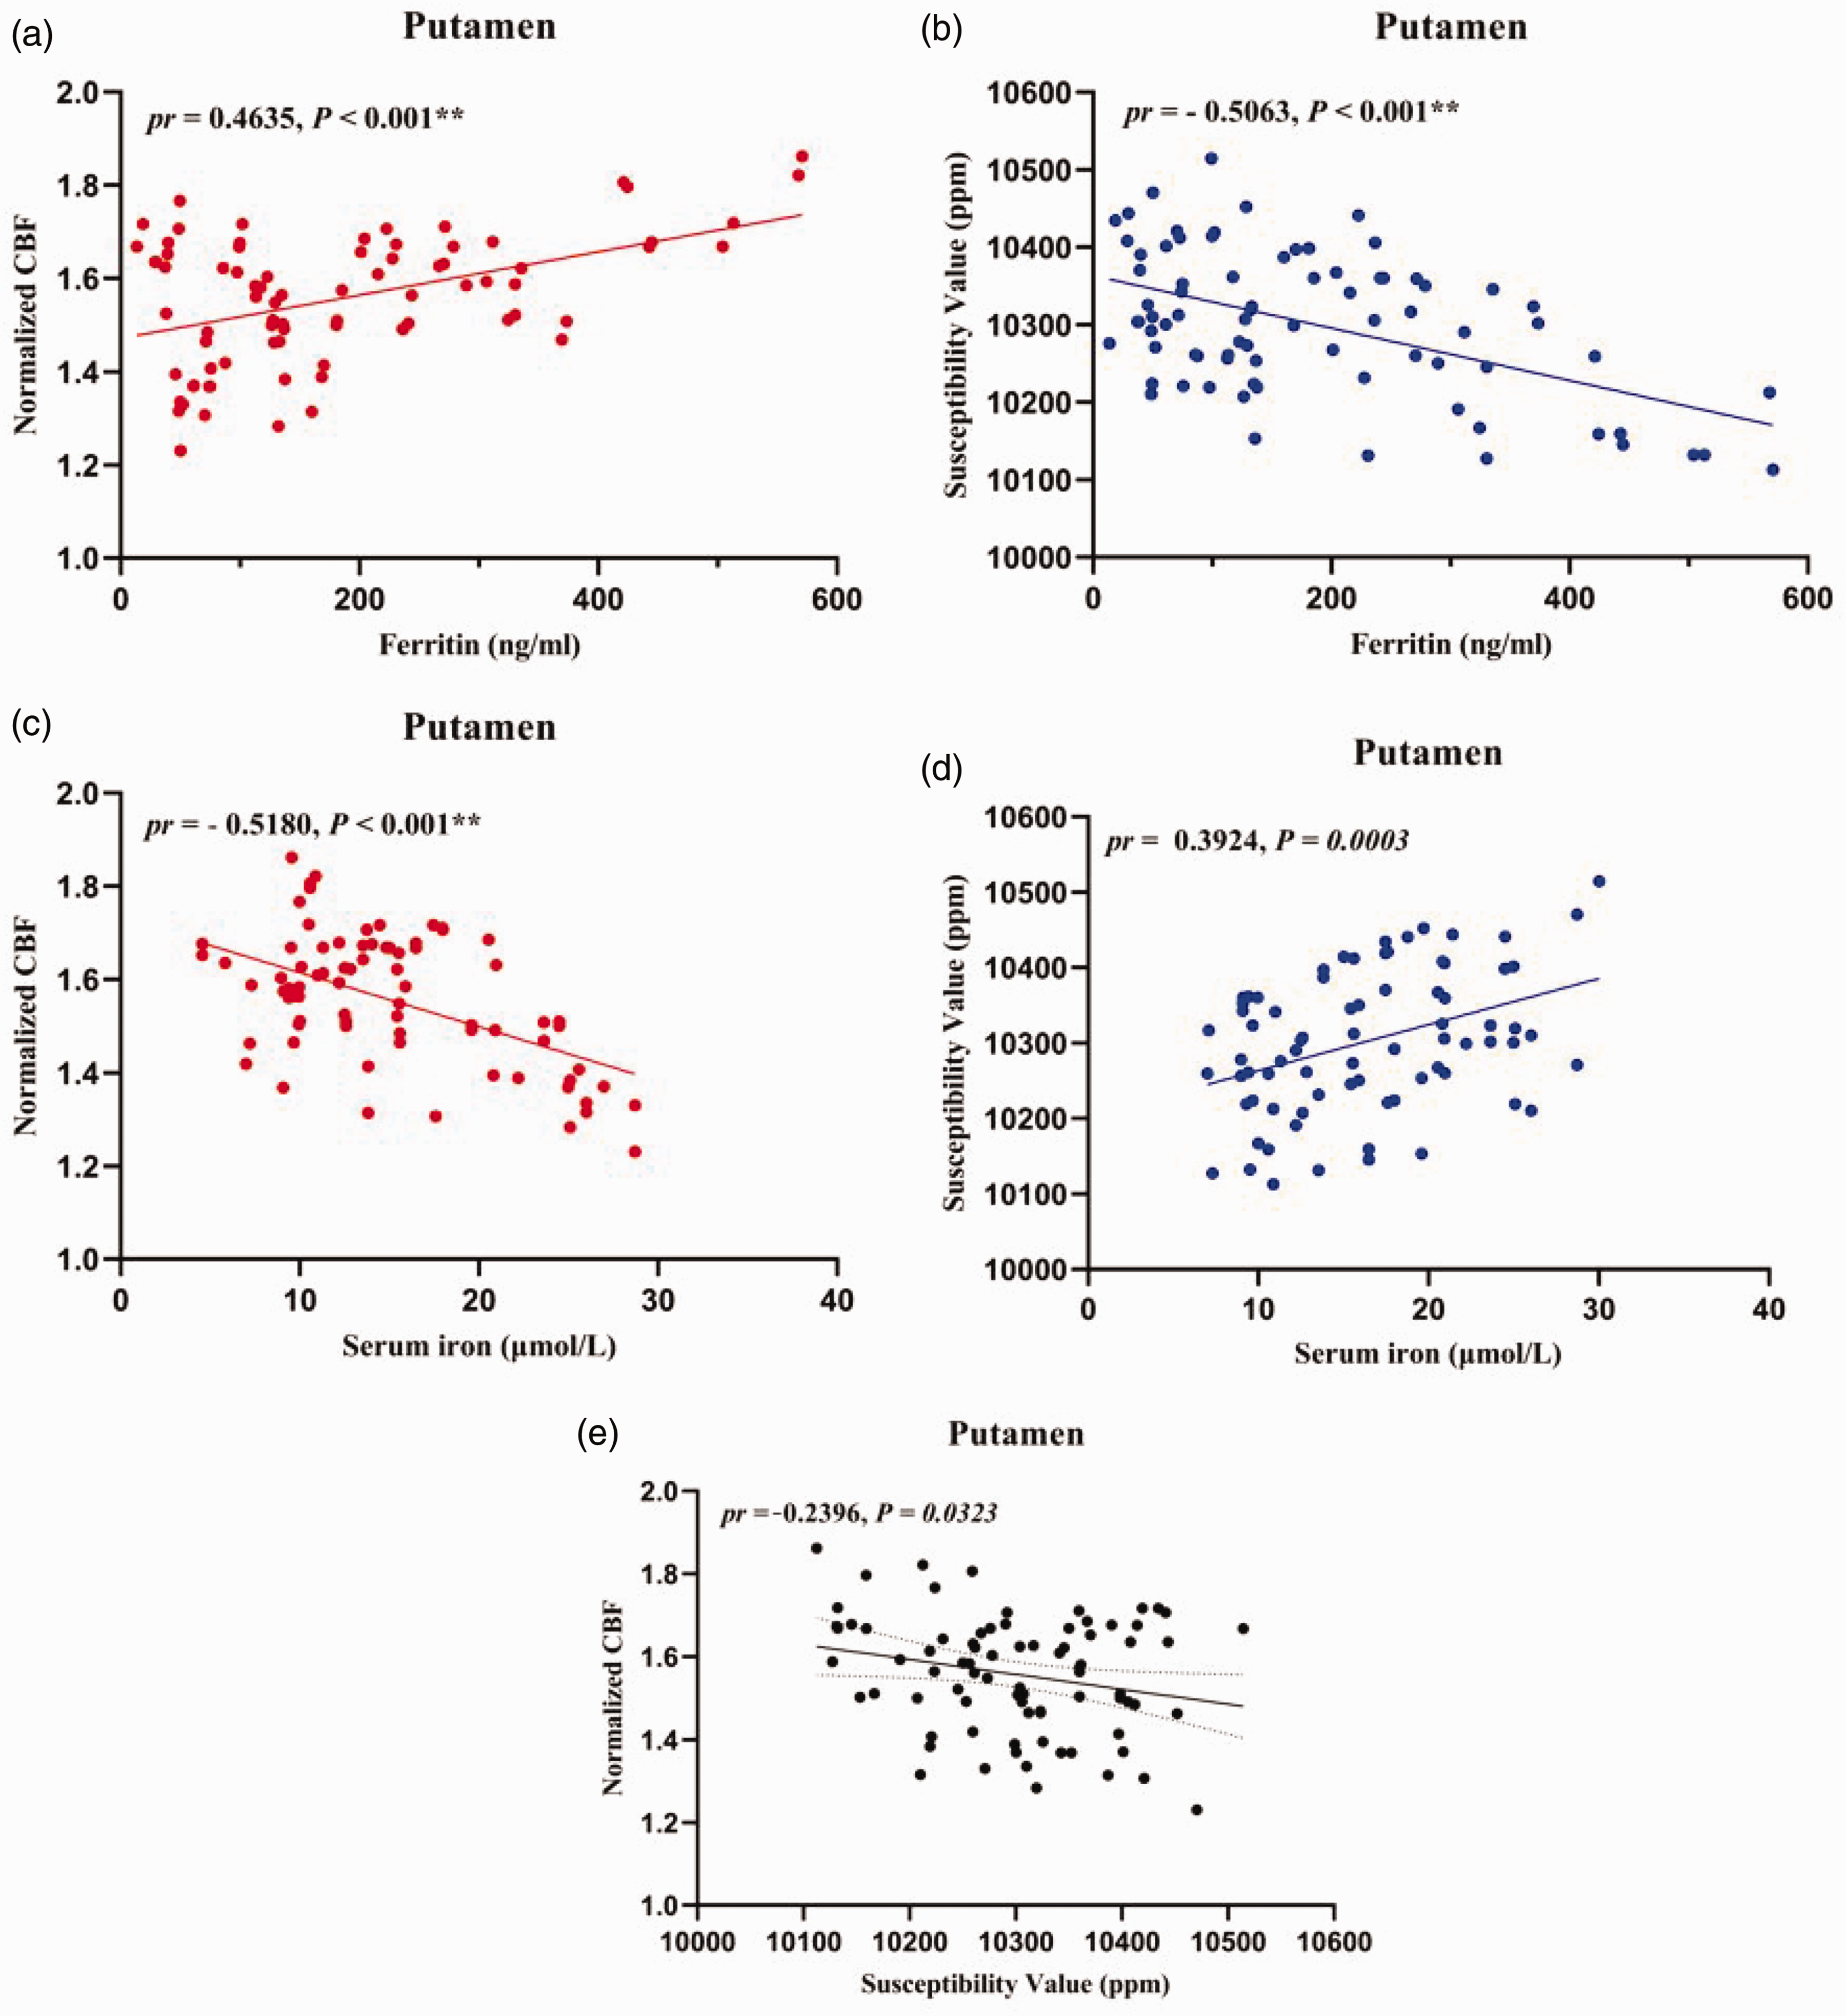
Scatter plots of correlations between normalized CBF, susceptibility value, ferritin level, and serum iron level in HD patients. (a) Positive correlations between ferritin level and normalized CBF in the significant putamen. (b) Negative correlations between ferritin level and susceptibility value in the significant putamen. (c) Negative correlations between serum iron and normalized CBF in the significant putamen. (d) Positive correlations between serum iron and susceptibility value in the significant putamen and (e) Negative correlations between normalized CBF and susceptibility value in the significant putamen. **P < 0.001.
Discussion
In the present study, we observed an interesting correlation between normalized CBF and susceptibility value in the putamen. The brain regions were components of increased susceptibility value in the right putamen, right thalamus, and right primary motor cortex and decreased susceptibility value in the left inferior frontal gyrus, triangular part/opercular part, left insula, right inferior frontal gyrus, triangular part/opercular part, right median cingulate, and paracingulate gyri in patients undergoing HD. The brain regions were components of higher CBF in the left thalamus and right thalamus and reduced CBF in the right parahippocampal gyrus, left parahippocampal gyrus, right insula, left inferior frontal gyrus, triangular part/opercular part, left insula/left inferior frontal gyrus/triangular part/opercular part, right median cingulate, and paracingulate gyri in patients undergoing HD. Lower ferritin level was associated with reduced CBF and increased susceptibility in the bilateral putamen in patients undergoing HD. Meanwhile, lower serum iron level was associated with higher CBF and reduced susceptibility in the bilateral putamen. Furthermore, the susceptibility value was a mediator of the association between ferritin and serum iron level and normalized CBF in the bilateral putamen.
The findings of our study correspond with those of previous studies that used ROI-based analysis with QSM techniques.4,5 However, the present study indicated that patients undergoing HD had higher brain iron levels in the right primary motor cortex and lower susceptibility value in the left inferior frontal gyrus, triangular part/opercular part, left insula, right inferior frontal gyrus, triangular part/opercular part, right median cingulate, and paracingulate gyri compared with HC. The primary motor cortex is associated with previously learned motor performance. 31 Abnormal spontaneous brain activity or structure in the primary motor cortex may lead to movement disorders 32 and result in the lack of control of leg movements displayed by patients undergoing HD. 33 Our previous study showed abnormal CBF and GMV alterations in the primary motor cortex in patients with RLS undergoing HD. More importantly, we also found a lower susceptibility value in the left insula and right median cingulate in patients undergoing HD compared to HC. This finding was reported for the first time in a similar study. The insular and median cingulate gyri are typically associated with salience networks (SALs). The insular, the key component of the SAL, accounts for attentional, cognitive, and behavioral functions 34 and pain perception. 35 The median cingulate gyrus participates in motor activity, memory, language processing, and visual and auditory attention and is considered an important area of the cerebral limbic system. 36 We found significant correlations among ferritin level, serum iron level, and susceptibility value in the bilateral putamen. These results indicate that an altered susceptibility value might be a useful biomarker for investigating disease progression and pathological changes in patients undergoing HD.
In this study, several brain regions that showed significant alterations in CBF were important for cognitive processing. The inferior frontal gyrus, medial frontal gyrus, and insula are the foundations of the SAL, which contributes to executive control and working memory function and may play an important role in neural reorganization.37,38 The parahippocampal gyrus is part of the limbic system, which is closely related to cognitive functions. 39 These CBF changes were similar to previous studies, suggesting neurodegenerative processing in patients undergoing HD, 11 which might be related to abnormalities in working memory 40 and cognitive impairment41–43 in patients with ESRD. The thalamus is considered a crucial relay station for multiple functional circuits that regulate cognitive processing, including memory, emotion, attention, and information processing. We also found significant correlations among ferritin level, serum iron level, and CBF in the bilateral putamen. Taken together, the SAL, parahippocampal gyrus, and thalamus were impaired in patients undergoing HD, which might explain their abnormal neurocognitive performance.
Iron is one of the most important minerals for organisms. Moreover, 48% of iron is involved in hemoglobin production and is bound to oxygen transport in the organism. 44 In addition, approximately 17% of iron plays an important role in many physiological and pathological processes of the organism, such as DNA synthesis, 44 nerve repair, myelination, neurotransmitter synthesis, antioxidant enzyme function, and iron homeostasis. 45 Iron homeostasis is crucial for maintaining normal brain function. Iron dyshomeostasis, which is disturbed by inflammation, 46 aging, 47 and oxidative stress 48 involved in iron metabolism, ultimately leads to cell damage and neurological diseases. Inflammation and oxidative stress have one of the most prominent roles among the singular features exhibited by patients with ESRD. 49 Chai et al. reported that the iron deposition of GM nuclei in patients undergoing HD was higher than that in HC and that the iron deposition of GM nuclei increased over approximately 2 years.4,16 Consistent with previous studies, brain iron deposition was detected in the present study. However, patients undergoing HD exhibited a negative correlation between CBF and susceptibility value in the putamen in the current study. It is possible that susceptibility values increased and CBF values decreased in the putamen, leading to a decrease in blood perfusion caused by vascular wall damage and an increase in free iron caused by oxidative stress. Vascular wall damage and increased free iron level may be the earliest pathological events in patients undergoing HD, and the two may not exist independently. We hypothesize that vascular injury results in the leakage of ferritin and accumulation of hemosiderin between tissues, whereas the increase in free iron results in further damage of the vascular wall through a peroxidation stress reaction. Vascular injury can weaken cognitive impairment and accelerate dementia. 50 Therefore, CBF measurements by ASL and susceptibility values by QSM may provide potential evidence for HD pathology.
Additionally, susceptibility values were negatively correlated with ferritin level and positively correlated with serum iron level in the bilateral putamen. CBF was positively correlated with ferritin level and negatively correlated with serum iron level in the bilateral putamen. Ferritin, which is influenced by several factors, is an intracellular iron storage protein and a marker of acute inflammation. 51 Nutritional status constantly affects serum ferritin levels, as has been observed in adult patients undergoing HD. 52 Given the significant baffling influence, the effect of ferritin as a marker of iron status in patients with CKD has been questioned for a long period. The putamen is the basal ganglia nucleus that plays a significant role in cognitive function, especially executive function. Sarnak et al. reported that poor cognitive performance is common in patients undergoing HD and primarily affects executive function. 53 Interestingly, a lower ferritin level was associated with an increased susceptibility value in the bilateral putamen in our study, implying that the susceptibility value might be a more precise biomarker for investigating brain iron status.
Our study has some limitations. First, the current study used a cross-sectional study design, and further follow-up studies are required to examine iron deposition and CBF in patients undergoing HD. Second, we did not assess effective and specific neuropsychiatric scales in patients undergoing HD; therefore, we were unable to establish a correlation between CBF and susceptibility values to clinical severity measures. Third, T2 fluid-attenuated inversion recovery was used to detect intracerebral ischemic lesions. Because vessel occlusions can influence uniform spin labeling and lead to changes in CBF, MR angiography may be useful for estimating the vessel status of the cerebral artery in the future. Finally, brain ventricle size and registration errors may also be the cause of changed iron deposition and CBF. A more accurate registration method should be performed in future studies.
In conclusion, we found iron deposition changes in some brain regions and extensively altered CBF in patients undergoing HD. Increased iron deposition in the putamen was accompanied by decreased blood perfusion. CBF and susceptibility value for specific brain regions are valuable in the predictive diagnosis of patients undergoing HD and in quantifying disease progression.
Supplemental Material
sj-pdf-1-jcb-10.1177_0271678X221134384 - Supplemental material for Association between susceptibility value and cerebral blood flow in the bilateral putamen in patients undergoing hemodialysis
Supplemental material, sj-pdf-1-jcb-10.1177_0271678X221134384 for Association between susceptibility value and cerebral blood flow in the bilateral putamen in patients undergoing hemodialysis by Hao Wang, Lijun Song, Mingan Li, Zhenghan Yang, Zhen-Chang Wang in Journal of Cerebral Blood Flow & Metabolism
Footnotes
Funding
The author(s) disclosed receipt of the following financial support for the research, authorship, and/or publication of this article: This work was supported by the Beijing Municipal Administration of Hospitals Clinical Medicine Development of Special Funding Support (contract grant numbers: ZYLX201824 and ZYLX202101), Beijing Municipal Administration of Hospital’s Mission Plan (contract grant number: SML20150101), Beijing Scholars Program (contract grant number: [2015] 160), Beijing Municipal Health Commission and Beijing Friendship Hospital, Capital Medical University (contract grant number: seed project YYZZ202129).
Declaration of conflicting interests
The author(s) declared no potential conflicts of interest with respect to the research, authorship, and/or publication of this article.
Authors’ contributions
All authors have contributed to the manuscript. Hao Wang designed and conducted the study, contributed to the data analysis, and drafted the manuscript. Lijun Song and Mingan Li collected the data. Zhenghan Yang and Zhenchang Wang contributed to the design of the study, provided advice on the data analysis, and performed the final drafting of the manuscript.
Supplemental material
Supplemental material for this article is available online.
References
Supplementary Material
Please find the following supplemental material available below.
For Open Access articles published under a Creative Commons License, all supplemental material carries the same license as the article it is associated with.
For non-Open Access articles published, all supplemental material carries a non-exclusive license, and permission requests for re-use of supplemental material or any part of supplemental material shall be sent directly to the copyright owner as specified in the copyright notice associated with the article.