
Abstract
Cerebrovascular dysfunction has been suggested as a physiomarker of Alzheimer's disease (AD)-associated neuronal degeneration, but the underlying mechanisms are still debated. Herein cerebral vasomotor reactivity (VMR, breath-hold index: BHI), metabolic activity (lobar SUVs, FDG PET MRI), amyloid load (Centiloid score, Flutemetamol PET MRI), hemispheric cortical thickness, white matter lesion load and cerebral blood flow (ASL) were studied in 43 consecutive subjects (mean age: 64 years, female 13), diagnosed with subjective cognitive impairment (SCI, n = 10), amnestic mild cognitive impairment (aMCI, n = 15), and probable Alzheimer's dementia (AD, n = 18). BHI was significantly reduced in AD and aMCI patients compared to SCI subjects. A highly significant inverse correlation was found between BHI and the centiloid score (r = −0.648, p < 0.001). There was moderate positive correlation between BHI and frontal, temporal and parietal FDG SUV and ASL values, and a borderline negative correlation with age and white matter lesion volume. The link between amyloid burden and VMR was independent and strong in linear regression models where all these parameters were included (β from –0.580 to –0.476, p < 0.001). In conclusion, our study confirms the negative association of cerebral amyloid accumulation and vasomotor reactivity in Alzheimer's disease with the most direct data to date in humans.
Introduction
The role of cerebral microcirculatory dysfunction in the pathophysiology of Alzheimer's disease has long been proposed. Although the impairment in cerebral hemodynamic responsiveness can be evaluated by a variety of techniques, most experience has been reported with vasomotor reactivity (VMR) studied with transcranial Doppler ultrasonography (TCD). 1 Cerebral VMR has been suggested as a physiomarker for diagnosis of Alzheimer's disease (AD) – especially in its early-stages-, prediction of disease progression, and a therapeutic target and/or surrogate. 2 We conducted this study to uncover metabolic or molecular positron emission tomography (PET) correlates of impaired cerebral vasomotor reactivity across the clinical continuum of subjective cognitive impairment (SCI), amnestic mild cognitive impairment (aMCI) and probable Alzheimer's dementia (AD). For this purpose, we performed TCD, [F18]-FDG PET/MRI and [F18]-Flutemetamol PET/MRI in each case within the same week.
Patients and methods
Ethical approval and consent to participate
The protocol of this prospective pilot study was approved by Hacettepe University clinical/interventional research ethics committee and Turkish Medicines and Medical Devices Agency (TİTCK, Ministry of Health). The study was conducted in accordance with the Declaration of Helsinki. All participants or their guardians gave written informed consent for participation to the study.
Patients
Seventy-four patients were referred to Hacettepe Neurosonology Laboratory for TCD VMR test as part of the study. Persons over the age of fifty and whose cognitive complaints were stated by themselves or their families were included in the study. Patients with a history of ischemic stroke or bleeding (including imaging documented), other neurological disease, or a contraindication for breath holding testing were excluded. The presence of vascular risk factors was not an exclusion criterion. The medicines used and their doses were noted. Participants were told not to take the medicines on the morning of the test and were given quickly after the test. Nine of these never completed the protocol defined PET studies. Thirteen patients whose operational diagnoses were not in the AD spectrum, including frontotemporal dementia (n = 5), non-Alzheimer MCI (n = 4), possible LATE (Limbic-predominant age-related TDP-43 encephalopathy, n = 2) and no-definitive diagnosis (n = 2) were further excluded. Breath-holding index (BHI) could not be obtained in seven patients (3 AD, 1 aMCI, 1 SCI) due to transtemporal sonic window insufficiency and two patients (1 AD, 1 aMCI) could not tolerate apnea for the required time by the test. Thereby a total of 43 (mean age, 64 ± 8 years, 13 females) subjects were included in the study.
Neuropsychological assessment
Details of neuropsychological tests used in patients can be found elsewhere.3,4 Briefly, a wide range of tests including standardized mini-mental state examination (MMSE), enhanced cued recall test (ERCT), Stroop test Trail A & B, Clock drawing test, digit span (WAIS-IV), Verbal and semantic fluency tests, Beck depression inventory and Geriatric depression scale were applied. The 2011 criteria established by the NINCDS-ADRDA (the National Institute of Neurological and Communicative Disorders and Stroke and the Alzheimer's Disease and Related Disorders Association) were used for Alzheimer's disease diagnosis. 5 The diagnosis of amnestic MCI and SCI were determined according to Petersen's 6 and the Subjective Cognitive Decline Initiative Working Group criteria, 7 respectively.
Brain PET/MRI and image processing
Axial 3 D T1 BRAVO and sagittal T2 FLAIR MR images of the brain were recorded simultaneously with PET images using a 3 T PET/MR (GE SIGNA) device and an 8-channel head coil. [F18]-FDG was used to determine brain metabolic activity and [F18]-Flutemetamol was used to evaluate amyloid deposition. 8 These two PET studies were obtained at most within a one-week interval. [F18]-FDG PET imaging was performed 60–80 minutes after radiopharmaceutical injection, while [F18]-Flutemetamol PET imaging was performed 80–110 minutes after the injection. Each list mode static PET data was acquired in 25 minutes and their reconstructions were performed with the VUE Point FX SharpIR Time of flight algorithm (using 4 iterations of 28 subsets).
The relative regional standard uptake values (SUVr) of both [F18]-FDG and [F18]-Flutemetamol were calculated using the SPM12 software (Statistical Parametric Mapping, version 12, Wellcome Trust Centre for Neuroimaging, http://www.fil.ion.ucl.ac.uk), the anatomic voxel-of-interests (VOIs) in WFU Pick Atlas toolbox9–13 and the cerebellum and pons as the reference sites for [F18]-FDG and [F18]-Flutemetamol studies, respectively. The centiloid values from [F18]-Flutemetamol PET images were calculated with the SPM8 software using the method developed by Klunk et al. 14 and Battle et al. 15 and the data they shared on the Global Alzheimer Association Interactive Network website (GAAIN; http://www.gaain.org). Regional brain volumes and cortical thickness values were measured using the volumetric analysis tools of the Freesurfer software (version 6.0, http://surfer.nmr.mgh.harvard.edu).16,17 Segmentation of the white matter lesions from FLAIR MR images was done in LST (version 3.0.0, www.statisticalmodelling.de/lst.html), 18 an SPM12 toolbox, with the lesion growth algorithm (LGA). The optimum initial cut-off value was determined as 0.3 by visual assessment.
The 3D arterial spin labelling (ASL) MR application was used to acquire a whole brain scan for cerebral blood flow (CBF) measurements non-invasively. It uses a 3D Spiral FSE pulse sequence with Extended Dynamic Range to acquire a set of images (PW and PD) which are post-processed into CBF image maps. CBF values (in ml/100 gm/min) were calculated in the scanner. Structural scan skull stripping, T1 coregistration, partial volume correction, Montreal Neurological Institute (MNI) reference space alignment and smoothing were done with the ASAP toolbox (version 2). 19 Regional mean CBF values were calculated with WFUPick Atlas.
Deep subcortical (SC) and periventricular (PV) white matter hyperintensities were scored with the Fazekas scale. 20 In addition, cerebral microbleeds (CMBs) were detected on susceptibility weighted imaging (SWI) sequences.
Ultrasound
After consenting, a full neurosonological examination (using standard techniques with GE Logiq P6) was performed. Patients with significant (any flow velocity increase) ultrasound-documented extra/intracranial steno-occlusive lesions, or inadequate temporal bone window preventing bilateral monitoring of MCA Doppler signals were excluded at this stage.
All TCD recordings were acquired with the MultiDop® Pro (DWL Compumedics, Singen, Germany) system, its 2 MHz monitoring transducers and a headset for probe fixation. Examination was performed in the supine position. Sonographic description of the middle cerebral artery (MCA) signal was performed as per the standard technique. 21 Of note, the MCA depth was fixed at 45–50 mm to avoid misidentification of other arteries. After both MCA signals of sufficient quality had been fixed, patients were allowed to rest for at least 10 minutes with normal inspiration and eyes closed. Resting peak systolic velocity (PSV), end-diastolic velocity (EDV), mean flow velocity (Vmean = EDV + [PSV–EDV]/3) and pulsatility index (PI = [PSV-EDV]/Vmean) were determined. Then, we performed the standard Breath Holding Test (BHT) with 30-seconds voluntary apnea. 22 Breath Holding Index (BHI) was calculated as the percentage increase of apnea Vmean relative to the baseline value divided by the duration of the breath hold in seconds [BHI = (Vmean apnea-Vmean baseline) × 100/Vmean baseline × 30-second]. Details of ultrasound measurement techniques can be found elsewhere.23,24 Of note, BHI was calculated only if the duration of apnea was longer than 24 seconds. 25 Two patients had apnea duration less than 30 seconds, aMCI and AD one each. Chest movements were continuously monitored visually to detect and prevent accidental breathing during apnea. Blood pressure was measured before and after BHT.
Statistical analyses
All numerical values were presented as “mean” with their standard deviation and 95% confidence intervals, and all categorical values as “numbers”, “percentages” or “median” with “interquartile range”. Distribution normality was examined by Kolmogorov-Smirnov and Shapiro-Wilk's W tests appropriately. Student's t and Mann-Whitney u were used to compare numerical variables, and Chi-square and Fisher’s exact tests for categorical tests. One-way analysis of variance (ANOVA) with post-hoc Wilcoxon’s tests and Fisher-Freeman-Halton tests were used for detection of trends across multiple groups. Spearman's rank, Kendall’s tau-b or Pearson's test was used for correlation analysis, as appropriate. Bonferroni's adjustments were performed for multiple comparisons. Multivariate linear regression models were constructed to adjust for age, gender, education, or vascular risk factors and other factors with p ≤ 0.2 after univariate comparisons to confirm the association between BHI (dependent variable) and PET-defined parameters (independent variables). Statistical significance was determined as p value <0.05. SPSS software (version 22.0; IBM Corp. SPSS Statistics for Windows, Armonk, NY, USA) was used for all analyses.
Results
The study population included 10 subjects with SCI, 15 with aMCI, and 18 with AD. Clinical features such as gender, educational status, vascular risk factors/diseases and acetylcholinesterase Inhibitor usage were similarly distributed across the groups, except for higher mean age in patients with aMCI and body weight in those with SCI (Table 1). Cognitive test scores decreased significantly, as expected, from SCI to aMCI and then to AD. Similar decreasing trend was noted for parietal and temporal FDG uptake along with increasing trend of amyloid burden, more significantly for global amyloid accumulation quantified with Centiloid score (Table 1).
Clinical, imaging and neurosonological features across Alzheimer disease’s continuum.
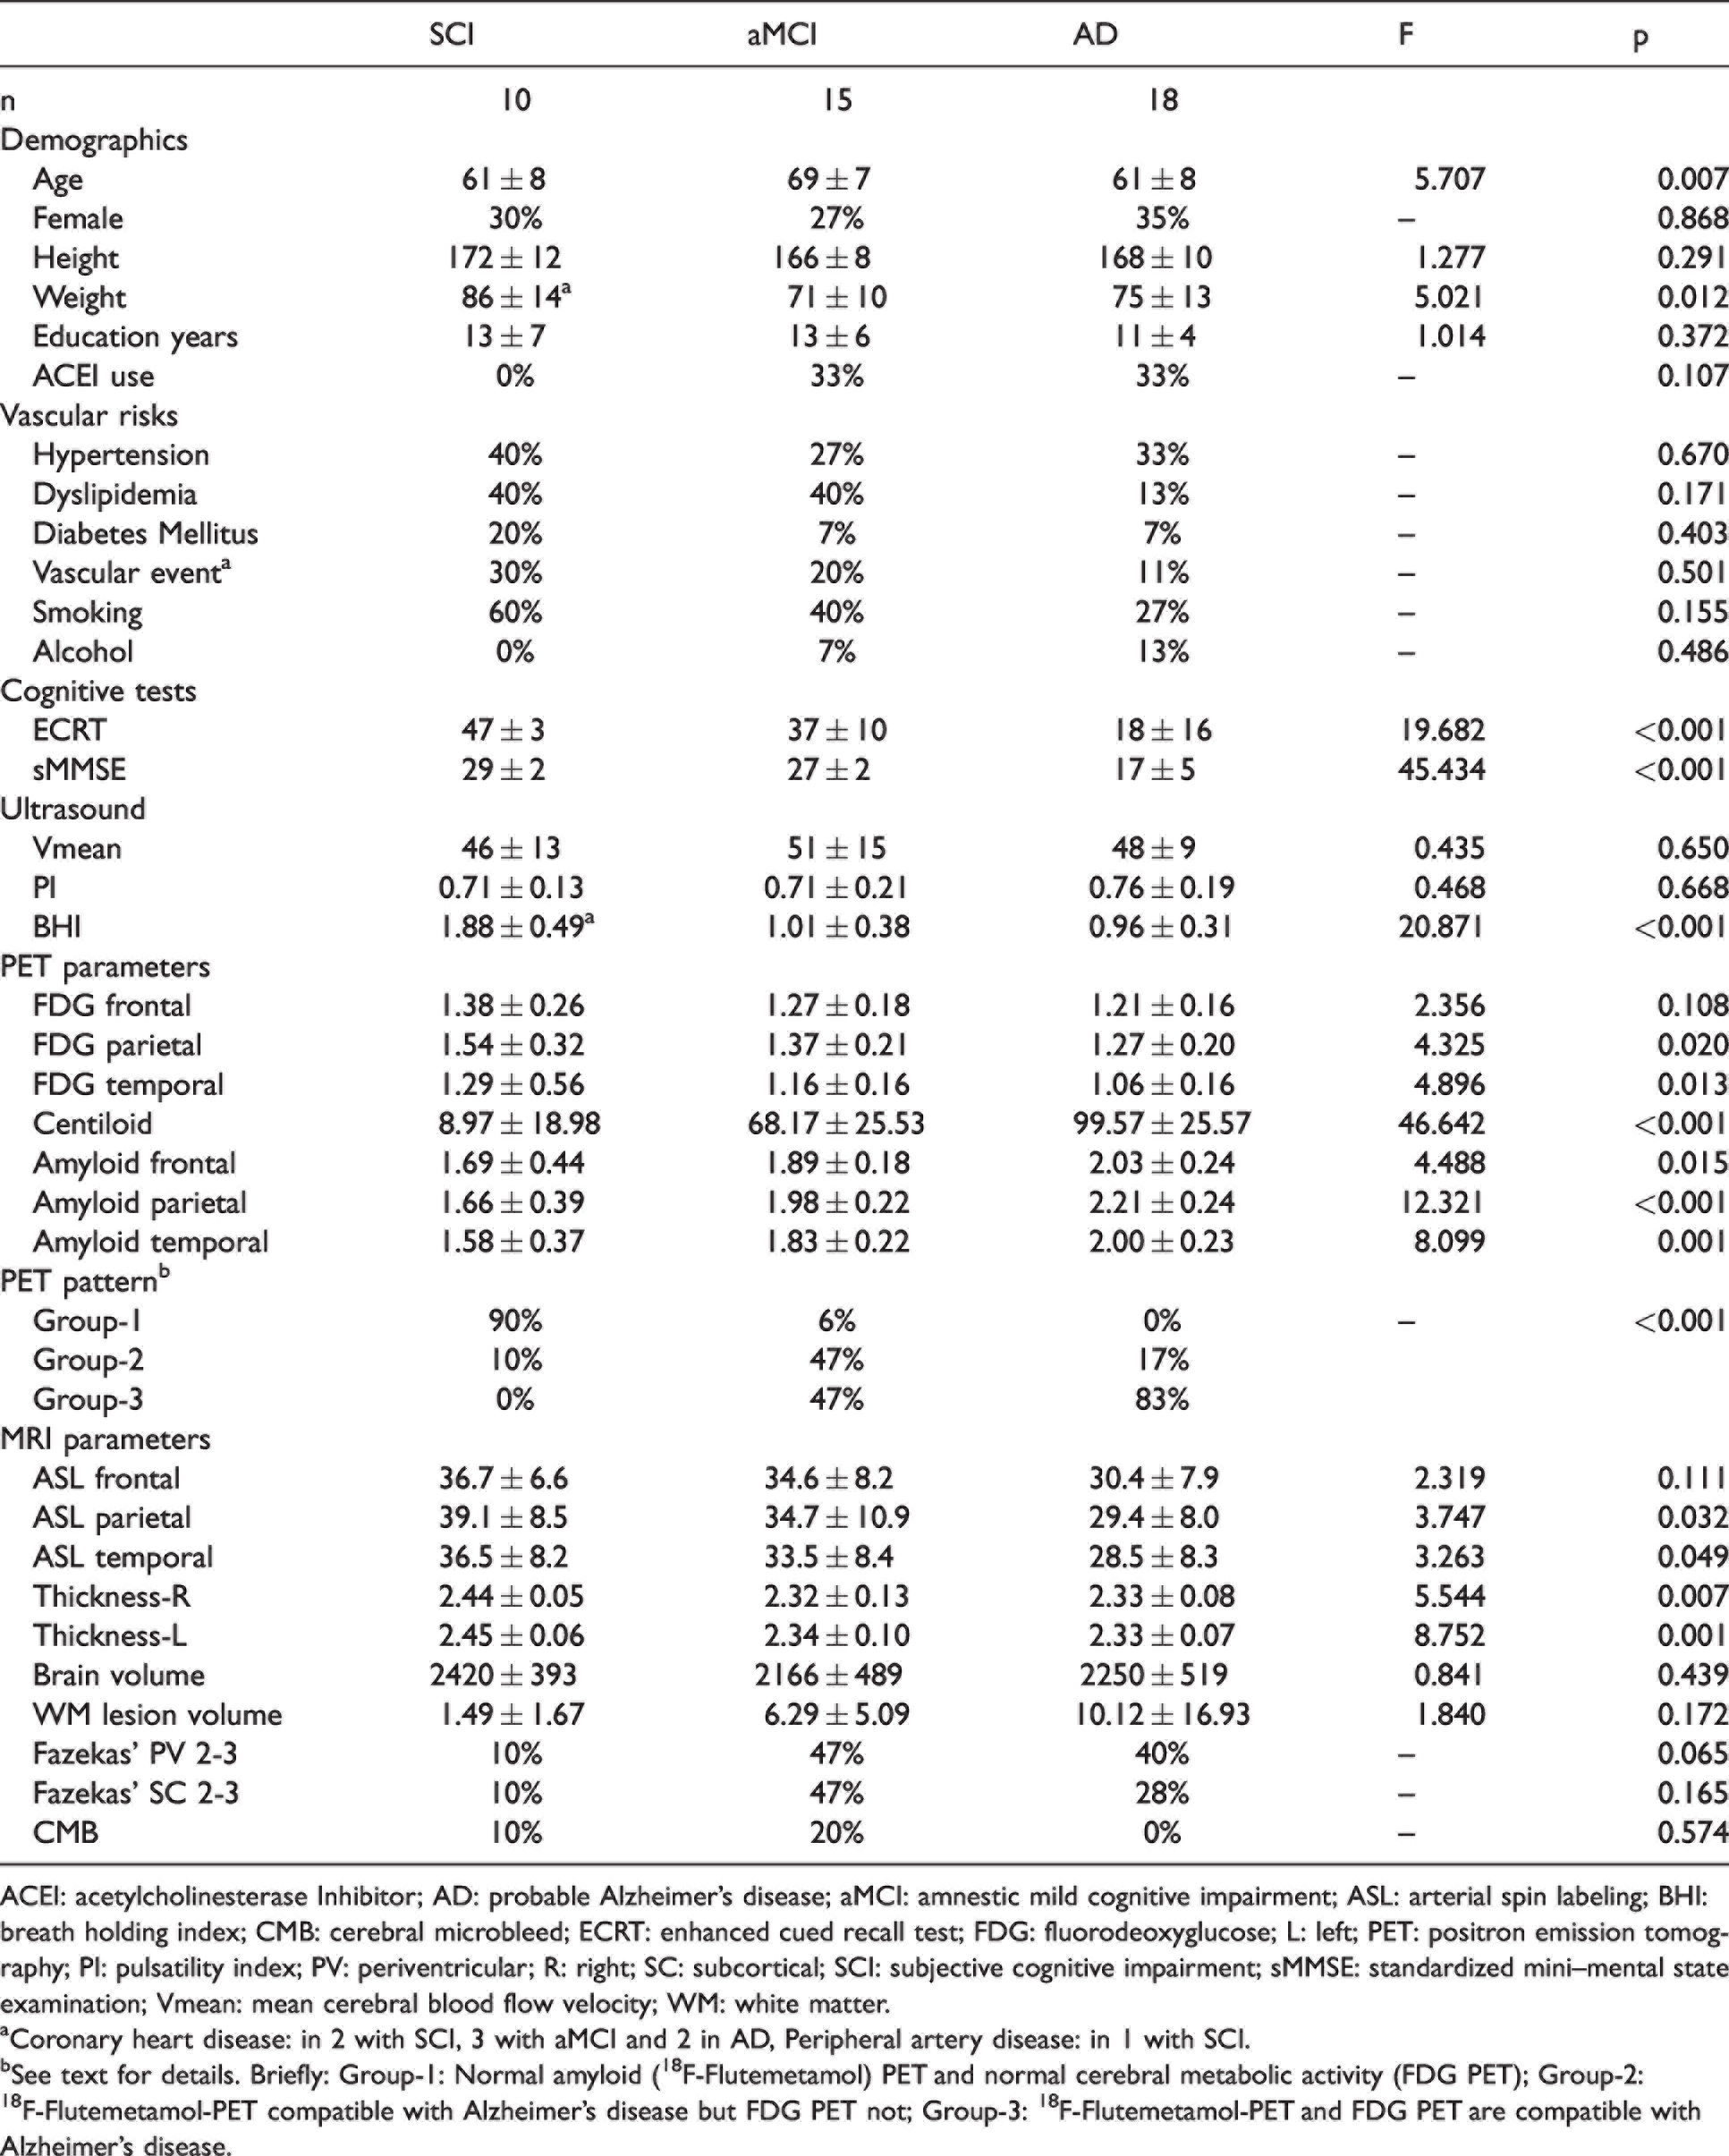
ACEI: acetylcholinesterase Inhibitor; AD: probable Alzheimer’s disease; aMCI: amnestic mild cognitive impairment; ASL: arterial spin labeling; BHI: breath holding index; CMB: cerebral microbleed; ECRT: enhanced cued recall test; FDG: fluorodeoxyglucose; L: left; PET: positron emission tomography; PI: pulsatility index; PV: periventricular; R: right; SC: subcortical; SCI: subjective cognitive impairment; sMMSE: standardized mini–mental state examination; Vmean: mean cerebral blood flow velocity; WM: white matter.
aCoronary heart disease: in 2 with SCI, 3 with aMCI and 2 in AD, Peripheral artery disease: in 1 with SCI.
bSee text for details. Briefly: Group-1: Normal amyloid (18F-Flutemetamol) PET and normal cerebral metabolic activity (FDG PET); Group-2: 18F-Flutemetamol-PET compatible with Alzheimer's disease but FDG PET not; Group-3: 18F-Flutemetamol-PET and FDG PET are compatible with Alzheimer's disease.
BHI was significantly reduced, almost to half, in AD and aMCI patients compared to SCI patients (F = 20.871, p = 6.189.10−7), while there was no difference between the groups in terms of cerebral blood flow velocity and pulsatility indexes (Table 1). Regardless of the clinical diagnosis when a visual classification algorithm was applied to classify patients as FDG normal/abnormal and Amyloid normal/abnormal (Figure 1(a)), 26 patients with normal findings in both PET modalities (Group-1: n = 10, female 40%, age 61 ± 8 years, SCI 9 and aMCI 1, BHI = 1.86 ± 0.51) had significantly higher BHI compared to both Flutemetamol and FDG PET abnormal subjects (Group-3: n = 22, female 38%, age 62 ± 8 years, aMCI 7 and AD 15, BHI = 0.95 ± 0.35) and Flutemetamol abnormal but FDG PET normal subjects (Group-2: n = 11, female 9%, age 70 ± 6 years, SCI 1, aMCI 7 and AD 3, BHI = 1.06 ± 0.37) (F = 18,903, p = 1.663.10−6, Figure 1(a) and (b)).
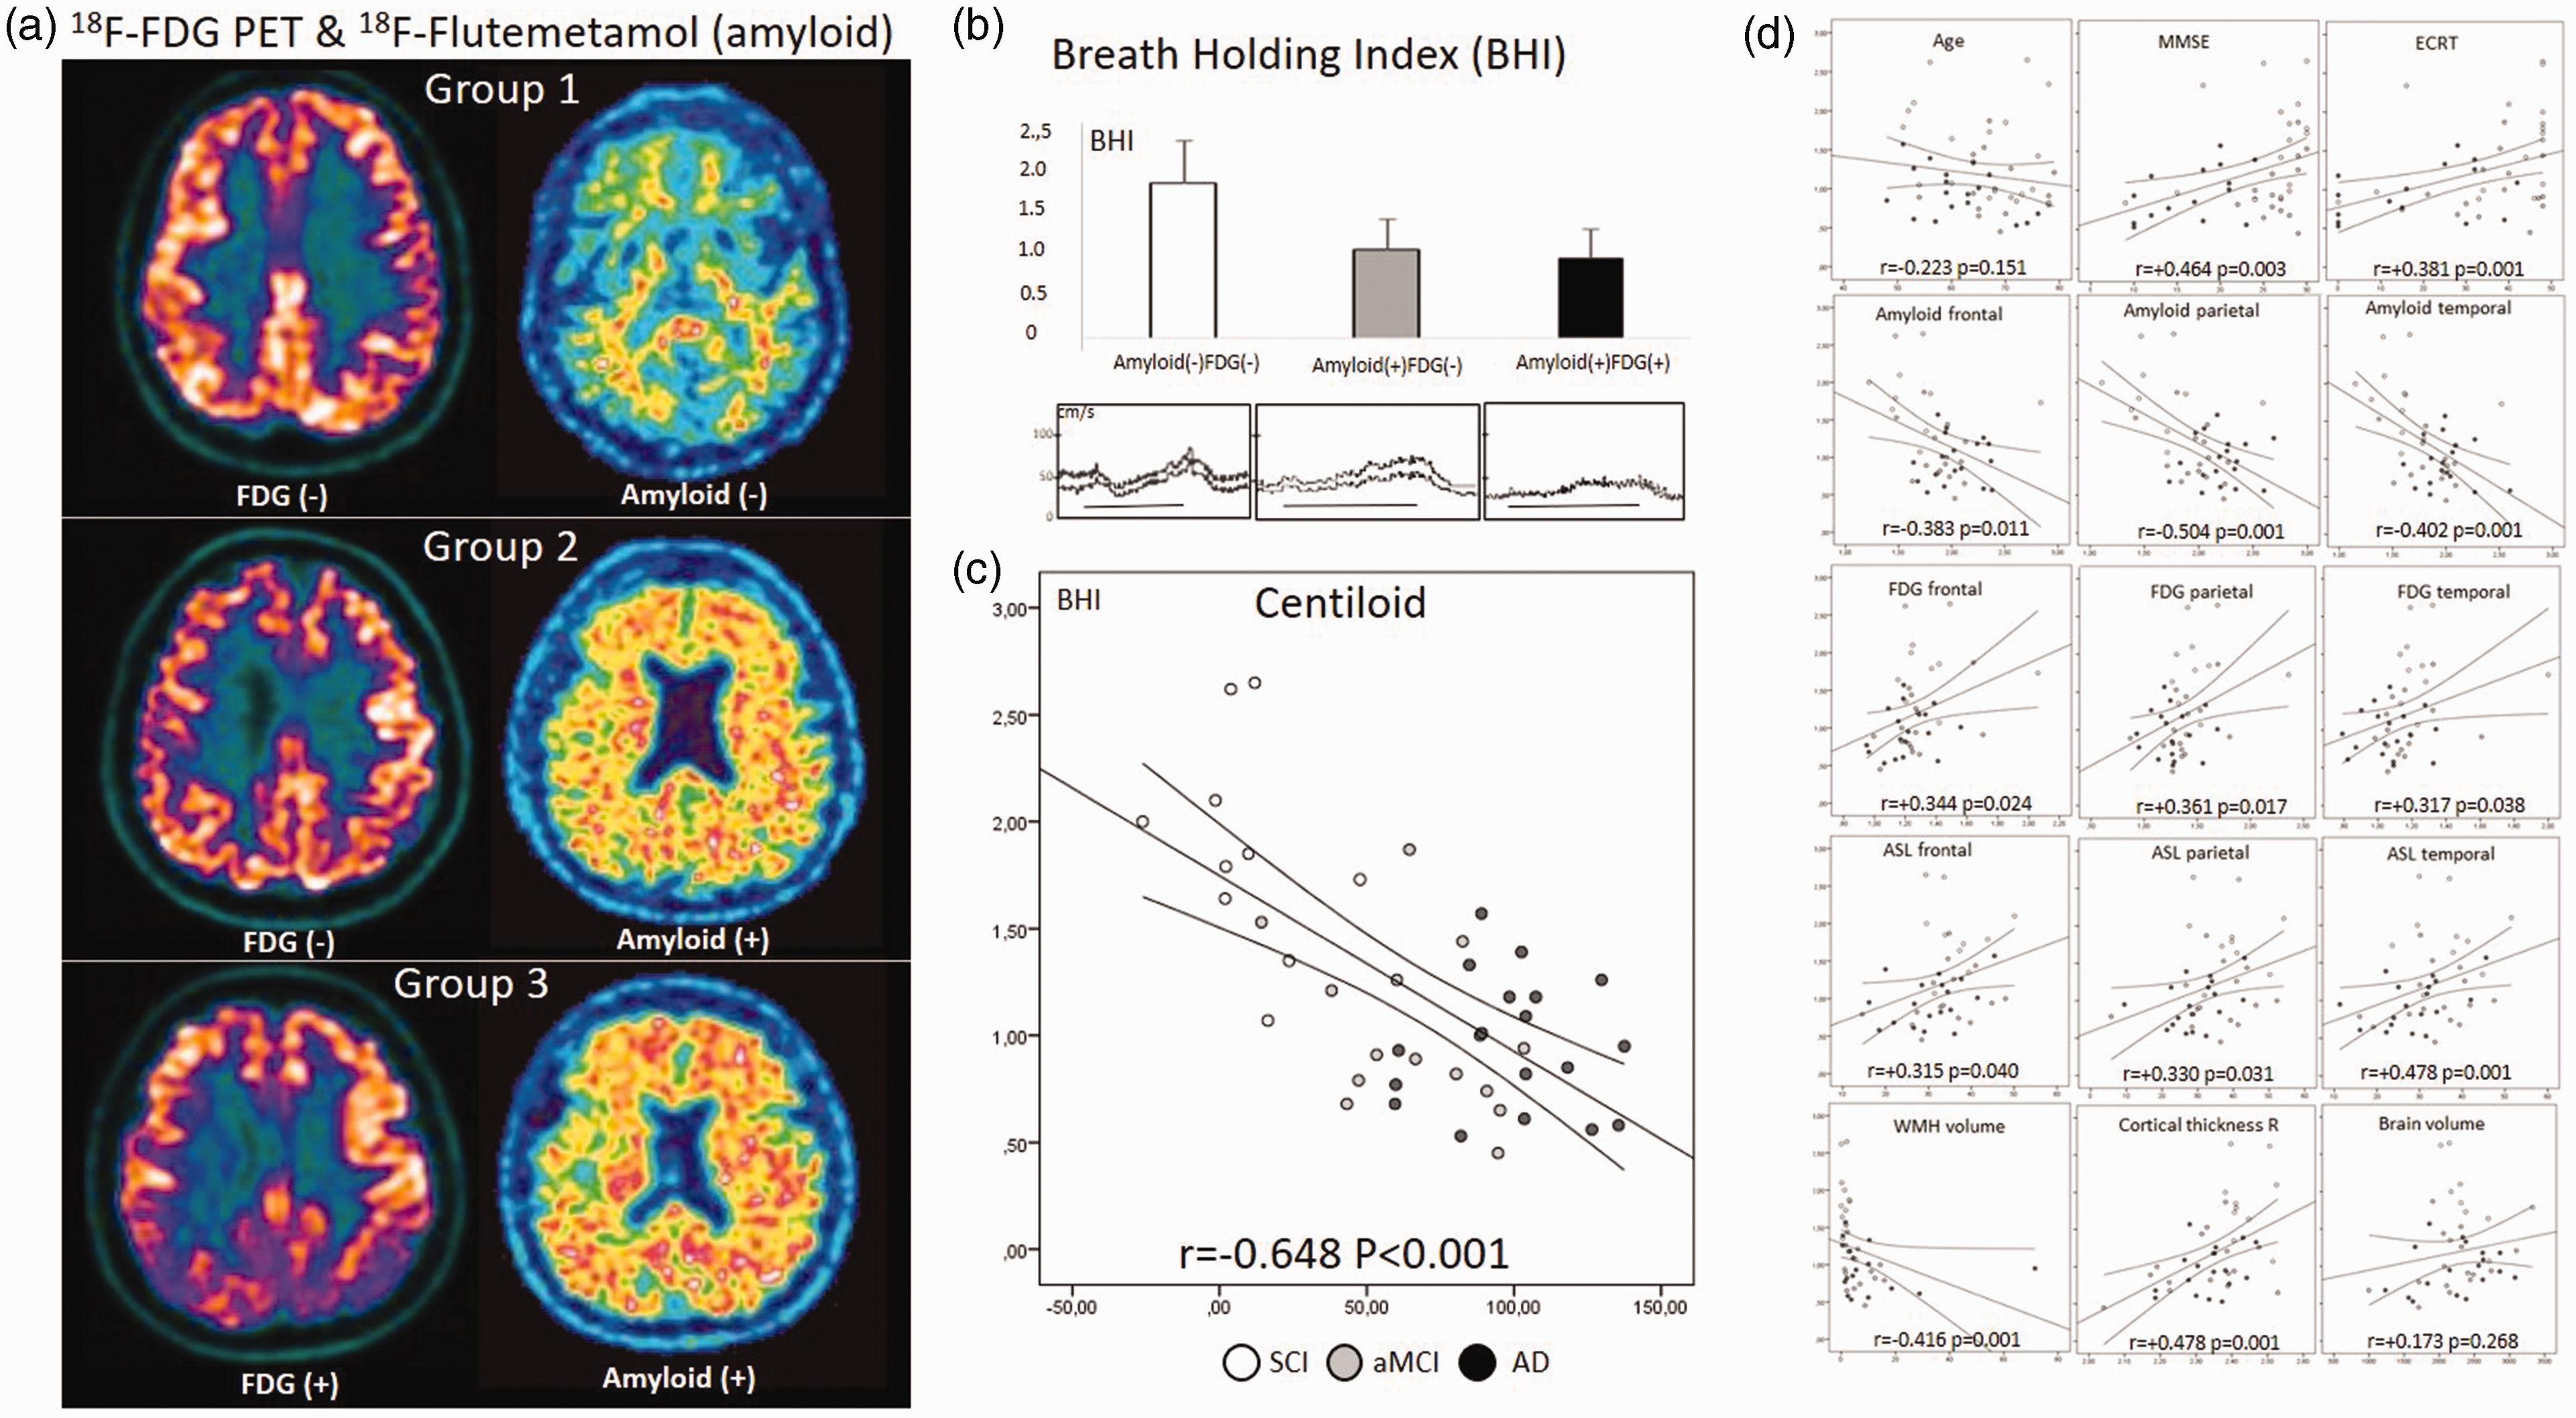
(a) Normal amyloid (18F-Flutemetamol) and cerebral metabolic activity (FDG PET) in a SCI patient (upper); abnormal (posivite) amyloid and normal FDG in an aMCI patient (middle); both abnormal amyloid and FDG imagings consistent with Alzheimer's disease (lower); (b) Breath Holding Index was significantly higher in patients with no amyloid and FDG abnormality compared to those with amyloid positivity but normal FDG PET MRI and those with amyloid positivity but abnormal (AD compatible) FDG PET MRI. (F = 18,903, p < 0.001) No difference was noted in patients with positive amyloid (the latter two). Examples of BHI tracings are provided for each in the lower row. Horizontal lines correspond to 30 seconds. (c) Scatter plot graphics of BHI against centiloid score with cases labels describing subjective cognitive impairment (SCI), amnestic mild cognitive impairment (aMCI) and probable Alzheimer's disease (AD). Linear trend line and its individual 95% confidence interval is shown and (d) Scatter plot graphics of BHI against 15 clinical and imaging parameters with linear trend line, its individual 95% confidence intervals, correlation coefficient and its p-value are provided. See text for abbreviations.
A significant correlation was found between BHI and many imaging parameters, the strongest being the Centiloid score. BHI and Centiloid score showed a high degree of inverse correlation (r = −0.648, p = 2.65.10−6, Figure 1(c)). Moderate positive correlation was found with frontal, temporal and parietal FDG SUV and ASL values; a borderline to moderate negative correlation was noted between BHI and age and white matter lesion volume; and lower cognitive test scores and cortex thickness were associated with lower BHI. After Bonferroni correction of the correlation statistics, the only significance survived was with the Centiloid score, while the significance level with cognitive scores remained borderline (Figure 1(d)).
The association of Centiloid with BHI was examined in various exploratory multiple linear regression models. In the first (clinical) model, after adjustment for age and MMSE, Centiloid score was found to be the main predictor (β = −0.482, p = 0.001) while age (β = −0.290, p = 0.024) and MMSE (β = 0.272, p = 0.037) were significant. The situation did not change when the model was repeated with ECRT: β = −0.476, p = 0.001 for Centiloid score; β = −0.261, p = 0.043 for age and β = 0.259, p = 0.050 for ECRT score. By including hyperlipidemia (β = −0.5626, p < 0.001 for centiloid) and smoking (β = −0.516, p = 0.001 for centiloid) one by one to these models, no significant change was observed in the centiloid-BHI relationship. In functional (FDG PET and ASL) model with adjustments according to ASL and FDG in the cerebral lobes except occipital, again Centiloid score was identified as a major modifier for BHI (β = −0.632, p < 0.001). Here, while parietal lobe ASL (β = 0.271, p = 0.030) and frontal FDG (β = 0.760, p = 0.025) values reached to significance, temporal and frontal lobar ASL, and temporal and parietal FDG did not (data not shown). In a structural (MRI) model, Centiloid score again emerged as the main determinant of BHI variabilities (β = −0.580, p < 0.001). Cortical thickness (significant only on right side, β = 2.069, p = 0.045) and age (marginal significance, β = −1.947, p = 0.059) were other significant predictors, while white matter lesion volume and category (Fazekas’ groups 2-3), and brain volume were not (data not shown).
Discussion
Our study provided a direct evidence that cerebral amyloid deposition is associated with impairment in cerebral vasomotor reactivity. A high degree of correlation was documented between the Centiloid score as a measure of cerebral amyloid burden, and the rigorously performed BHI. Many previous studies have shown that cerebral vasomotor reactivity with breath-holding, CO2 inhalation or acetazolamide injection is impaired in Alzheimer's dementia.27–34 The degree of this impairment has been correlated well with clinical disease severity as assessed by the MMSE.27,31 A recent study has shown an inverse relationship between cerebrospinal fluid amyloid β42 level and BHI. 35 We took these observations one step further by showing a tight inverse correlation between BHI and the amyloid accumulation extent, that is the Centiloid score.
Our observations also support the decrease in cognitive test scores along with the degree of deterioration in BHI. However, there was no statistical difference in vasomotor reactivity between aMCI and AD, although it was numerically lower in the latter. VMR impairment, less than or equal to AD, has been documented in aMCI stage in several previous studies.1,36 Additionally, impaired VMR in aMCI has been noted to be a phenomenon that enhances or accelerates or merely reflects the conversion to overt AD. 37 One reason for our observations may be the fact that our AD cohort was consisted of patients in the early stages of the disease, and BHI was not be significantly different in the early phases of AD spectrum. Alternatively, this may also indicate that deterioration in BHI is a relatively early finding. That is, VMR is impaired at, or perhaps before, the aMCI stage and remained as impaired afterwards.
VMR impairment, reflecting amyloid deposition, precedes the development of metabolic failure and/or cerebral atrophy, which is an established feature of AD-related neuropathology. However, the mechanism of the link between VMR and amyloid deposition has not yet been fully elucidated. Furthermore, causality of impaired VMR-induced CBF alterations, that is either a cause or a consequence of amyloid accumulation, is not completely clarified.29,38 On the other hand, we must add that substantial evidence has accumulated regarding the vasoactive properties of amyloid-β. First, amyloid-β exerts an arteriolar vasoconstrictive effect. 39 This reduces the gain of neurovascular coupling.40,41 Cholinergic deficiency also contributes to this maladaptation. 42 This may be related to the occurrence of functional dysfunction before, or more than, extensive pathological damage occurs. Neurovascular and parenchymal amyloid deposition likely has an additive effect. 43 It has been reported that amyloid-β induces vascular dysfunction via increase of endothelial oxidative-nitrosative stress leading to calcium influx through TRPM2 (transient receptor potential melastatin-2) channels. 44
Some previous studies have shown that middle cerebral artery flow velocity is lower and pulsatility index is greater in patients with AD compared to controls.27,30,32,37 Our data do not support these findings. Reasons may include high prevalence of vascular risk factors in the SCI group. Decrease in MCA flow velocity, indicating lowered tissue perfusion, and PI increase, indicating microvascular rarefaction, may be late phenomena in the AD course, but occur earlier in vascular dementia. Actually, case selection and criteria may also be important. Our series represents a population of Alzheimer's disease with a relatively lower vascular risk profile. Indeed, MCA flow velocity decrease and PI increase are not expected in the early stages of AD. However, although TCD flow velocities remained similar, we observed a significant trend of cerebral blood flow decrease on ASL imaging, particularly in the temporoparietal regions, across the SCI, aMCI, and AD continuum. This obviously relates to the fact that ASL-MRI is a more sensitive technique than the TCD flow velocity measurement in terms of CBF estimation. 45 We also documented a moderate (correlation coefficient from 0.315 to 0.478) but significant (p < 0.05) positive correlation between CBF and BHI (Figure 1(d), line 4). A similar positive correlation was also shown between metabolic activity (frontoparietotemporal SUV value) determined by FDG PET and BHI (correlation coefficient from 0.317 to 0.361, p < 0.05, Figure 1(d) line 3).
We found that WM lesion volume tended to be higher in the aMCI and AD groups compared with SCI. However, WM lesion load did not show a robust correlation with BHI. This is probably due to their low prevalence and uneven distribution. The relationship between the presence/burden of WM changes and cerebral hemodynamic alterations in AD patients is controversial. 32 As we confirmed herein that BHI impairment in AD is largely independent of VM disease. However, since WM disease itself impairs cerebral vasomotor reactivity,46,47 when its burden exceeding a certain threshold, it will have an additive disruptive effect in AD patients.
In our study, both the right and left side cortical thickness was significantly thinner by approximately 0.1 mm in the aMCI and AD groups compared to those in SCI. There is also a positive correlation between cortical thickness and BHI, reaching a level of significant independence level on the right side (Figure 1(d), last line, middle box). That means that the thicker the cortex, the higher the reactivity. However, such a relationship with global cerebral volume could not be determined. The relationship between cortical atrophy and VMR is very likely reciprocal. It is not clear which is the cause and which is the effect, but it is logical that they reflect each other's degree.
There are some limitations of our study. The most important one is the small sample size. Not only the high prevalence of transtemporal bone window impermeability, but also the low breath-holding capacity of the elderly contributes to this in addition to economics of PET MRI studies. Of note, the differences in BHI were already apparent despite this small volume. Another one is absence of a concrete control group. Since the two ethics committees that evaluated the study did not allow PET in individuals without complaints, it was planned to include only the cases with memory complaints (SCI group). In addition, parameters such as ApoE genotyping, which might have at least theoretical impact on vasomotor reactivity, could not be studied. Also, some potentially important parameters such as the use of acetylcholinesterase inhibitor, the presence of cerebral microhemorrhage and advanced white matter disease (Fazekas’s group 3) were too few to allow further analysis.
The solid and innovative features of our study merit also to be noted: All subjects had a PET MRI with both metabolic (FDG) and amyloid (Flutemetamol) modalities. BHI studies were performed by experienced sonographers blinded to the clinical diagnosis and PET/MRI results. Extra and intracranial parent artery lesions were adequately excluded. The negative effect of amyloid load on vasomotor reactivity has been so directly demonstrated in humans for the first time. In addition, the association of TCD VMR with cerebral metabolic activity (FDG), cerebral blood flow (ASL) and atrophy (cortical thickness) was also documented for the first time. The relatively peculiar study population with lower prevalence of coexisting vascular risk factors and diseases, including white matter lesions, allowed better observation of the effects of amyloid deposition on vascular reactivity. Now it is time to study the effect of anti-amyloid AD treatments on TCD VMR and examine the possibility of it being a more readily available surrogate marker.
Footnotes
Consent to participate
All participants or their guardians gave written informed consent for participation to the study.
Funding
The author(s) disclosed receipt of the following financial support for the research, authorship, and/or publication of this article: We acknowledge GE Health Care's support for the supply of F18-Flutemetamol doses. The study also received project support from the Hacettepe University Scientific Rapid Support fund (Project ID: 18510).
Declaration of conflicting interests
The author(s) declared the following potential conflicts of interest with respect to the research, authorship, and/or publication of this article: ES received speaker honoraria from Bilgen, Abdi İbrahim, Nobel and Santa Farma; LÖT has received speaker honorarium from GE Health Care; OA has nothing to declare; EY has nothing to declare; EB has nothing to declare; Ethem Murat Arsava, received honoraria from Fresenius Kabi, Bayer AG, Daiichi-Sankyo, Pfizer, Sanofi, Abbott and Nutricia. EMA served on the advisory boards of Abbott, Daiichi-Sankyo, Bayer AG, Pfizer, Fresenius Kabi, and Nutricia; and MAT received honoraria from Fresenius Kabi, Daiichi-Sankyo, Sanofi and Abbott. He served on the advisory boards for Abbott, Fresenius Kabi, Daiichi-Sankyo and Pfizer.
Authors’ contributions
Ethical approval
Hacettepe University clinical/interventional research ethics committee and Turkish Medicines and Medical Devices Agency (TİTCK, Ministry of Health) approved the study before trial initiation. The study was conducted in accordance with the Declaration of Helsinki.