
Abstract
Systemic inflammation affects cognitive functions and increases the risk of dementia. This phenomenon is thought to be mediated in part by cytokines that promote neuronal survival, but the continuous exposure to which may lead to neurodegeneration. The effects of systemic inflammation on cerebral blood vessels, and their provision of adequate oxygen to support critical brain parenchymal cell functions, remains unclear. Here, we demonstrate that neurovascular coupling is profoundly disturbed in lipopolysaccharide (LPS) induced systemic inflammation in awake mice. In the 24 hours following LPS injection, the hyperaemic response of pial vessels to functional activation was attenuated and delayed. Concurrently, under steady-state conditions, the capillary network displayed a significant increase in the number of capillaries with blocked blood flow, as well as increased duration of ‘capillary stalls’—a phenomenon previously reported in animal models of stroke and Alzheimer’s disease pathology. We speculate that vascular changes and impaired oxygen availability may affect brain functions following acute systemic inflammation and contribute to the long-term risk of neurodegenerative changes associated with chronic, systemic inflammation.
Keywords
Introduction
Neurological and vascular diseases have historically been considered independent illnesses. With the introduction of the concept of a ‘neurovascular unit’, and thus the acknowledgment of the intricate interaction between cerebral tissue and vasculature, this presumption is currently being reconsidered.1,2 In line with this, recent research suggests that neurodegenerative diseases may develop from disturbances in the vascular system.3–6
Systemic inflammation is a common pathological state that stresses the vascular system.3,7,8 The immediate upregulation of circulating cytokines that follows systemic inflammation triggers an increase in neutrophil, lymphocyte and monocyte populations in the blood.4,9 The elevated number of large-bodied white blood cells is a challenge for the microcirculation. Under normal conditions, the lumen of cerebral capillaries (5–10 µm) is only half the size of neutrophils (∼12 µm), and the passing of white blood cells requires a conformational change of both the cell and the vessel. However, vessels become more rigid in a state of inflammation. Furthermore, the glycocalyx layer on the luminal vessel wall, which facilitates the passage of large cells, is broken down during inflammation.10–12 Endothelial adhesion molecules are thus exposed and bind the white blood cells, slowing their passage through the capillary lumen and even cause momentary blockage of blood flow.13,14 The implications of microcirculatory loss of function could be severe on vital parameters such as the oxygen availability of cerebral tissue.15,16 We hypothesised that a severe systemic inflammation can cause alterations in the overall cerebral blood flow regulation. We quantified the occurrence of stalled flow events in the microcirculation of healthy, awake wild-type mice during the acute stage of an experimentally induced state of systemic inflammation.
We applied in vivo optical imaging techniques to investigate changes in cerebral vascular blood flow dynamics in a model of lipopolysaccharide (LPS)- induced systemic inflammation (Figure 1).17,18 We collected optical intrinsic signal imaging (OISI) 19 and optical coherence tomography (OCT) data.20,21 These techniques allowed us to monitor the hyperaemic response to functional activation and subsequently monitor resting-state capillary perfusion in the somatosensory barrel cortex of unanaesthetised mice. We found that the functional hyperaemic response amplitude was reduced and its peak was delayed during systemic inflammation compared to the healthy state. Furthermore, we found that inflammation significantly increased the occurrence and duration of stalled flow events in capillary branches.
Materials and methods
Mice and surgical procedure
C57BL/6 male mice (Taconic, Ry, Denmark) were housed in groups of five in a temperature- and humidity-controlled environment (22–24°C, 55 ± 10% humidity) with free access to food and water. Seven-week-old mice underwent surgery to implant a chronic cranial window and mount a head-bar, a technique inspired by Kilic et al. 22 For the procedure, the mice were initially anesthetized with 3% isoflurane (in 25/75% oxygen/air) and maintained on ∼1.5% for the duration of the surgery (∼1 hour), while lying on a feedback-controlled heating pad to maintain a core temperature of 37°C. Before incision, the mice received 20 mg/kg lidocaine (AstraZeneca, Ballerup, Denmark) to provide local analgesia at the site of surgery. Furthermore, the mice were given subcutaneous injections of 4.8 mg/kg dexamethasone (Vital Pharma Nordic, Hellerup, Denmark) to reduce systemic inflammation, 10 mg/kg carprofen (Huvepharma, Sofia, Bulgaria) as anti-inflammatory and analgesic treatment, and 200 mg/kg ampicillin (Stada, Bad Vibel, Germany) to prevent post-surgical infection. Administration of ampicillin was continued daily for 3 days post-surgery. Post-surgical analgesia coverage was provided via buprenorphine-containing drinking water (3 µg/ml, Indivior Europe Limited) for 3 days.
For the window implantation, a craniectomy of 3 mm in diameter was performed over the left somatosensory cortex (coordinates: A/P, –1.5 mm; M/L, –3 mm) using a microdrill. While keeping the dura intact, a thin layer of silicone (Kwik-Sil, World Precision Instruments, Sarasota, USA) was applied and covered with a plexiglass plug (one layer with a 3 mm diameter and one layer with a 4 mm diameter glued together) (Glaswarenfabrik Karl Hecht GmbH & Co, Sondheim vor der Rhön, Germany). The edges were sealed to the skull with cyanoacrylate adhesive (Loctite super-glue gel; Henkel AG, Düsseldorf, Germany) and a custom-designed stainless-steel bar was fixed to the anterior part of the skull. Dental cement (Meliodent; Kulzer GmbH, Hanau, Germany) was used to secure both window and head-bar to the skull. Following surgery, mice were returned to their cage and left to recover for one week.
All animal procedures were approved by the Danish Animals Experiments Inspectorate (Permit 2017-15-0201-01384) and carried out in accordance with the regulations set by the Danish Ministry of Justice and Animals Protection Committees and to the ARRIVE guidelines. The main experimental group consisted of 10 mice. In addition, two separate control groups were included: one for validating the effectiveness and tolerability of the LPS dose (N = 10), and another for evaluating the expression of inflammatory cytokines in ex vivo brain tissue and serum samples (N = 15).
Acclimatisation to awake imaging
In preparation for the head fixation during awake imaging sessions, the mice were handled and acclimated to the immobilisation. Daily handling of mice (10–20 min per cage) started before surgery and continued throughout the study to familiarise the mice with the experimenter. Following one week of post-surgery recovery, the mice began their training for head fixation in a custom-made frame. Initially, the mice were lightly sedated with isoflurane to minimise the discomfort of being fixated in the frame. However, isoflurane became redundant within a few days as the mice became more familiar with the frame. Starting with 15 min, the duration of head fixation increased 15 min each day until a maximum of 2 h, during which time the mice were rewarded with condensed milk every 15 min. The end goal was for the mice to be comfortable enough to remain still during a 5 min imaging session in which they experienced air-puff whisker stimulation, immediately followed by two 15 min imaging sessions without air-puff stimulation. The results of an initial unpublished study for validating the paradigm are discussed in Supplementary materials and shown in Supplementary figure 1.
LPS administration and validation of dose
To induce a systemic inflammatory response, LPS purified from E. coli strain O111:B4 (Sigma-Aldrich, St. Louis, USA) was administered intraperitoneally as a single dose (5 mg/kg in 0.25 ml saline). The procedure was similar to that described by Sorrenti et al. 18 For initial validation of the dose and for determining the imaging timepoints of the longitudinal study, ten mice received either an LPS-injection or equal saline injection and were subsequently evaluated 12, 24 and 48 hours post-injection. At each time point, the body weight was measured and a sickness score was determined based on four physical characteristics: ptosis, lethargy, piloerection, and mortality. The data from the pilot study verify that the chosen dose of LPS leads to physical signs of illness but not death (Supplementary figure 2). We found that the body weight of all LPS-injected mice progressively decreased throughout the two days. In contrast, the saline-injected mice showed no such trend. Likewise, we found that all LPS-injected mice showed multiple signs of sickness and were thus easily identified amongst their non-affected saline-injected housing mates (the experimenter was not blinded to the intervention). All affected animals made a full recovery within a week (data not shown). None of the mice used in the study died as a result of LPS administration, including both control groups and the main experimental group (N = 35 in total).
Serum and tissue processing
For blood sampling and brain tissue isolation, the mice were deeply anesthetised with isoflurane (∼5% in 25/75% oxygen/air) and a blood sample of 0.5–1 mL was collected from the heart. The blood was left to coagulate for 2 hours at room temperature before centrifugation for 20 min (1200 rpm at 4°C) to isolate the serum. After collection of blood, the mice were immediately perfused with 10–20 ml saline, and the brain was dissected. The hemispheres were separated, and the hemisphere without the cranial window was collected as a whole. The hemisphere under the window was further dissected, and only a slice of cortex corresponding to the imaged area was collected. Samples were snap-frozen in liquid nitrogen and stored at –80°C.
Molecular biological measurements
Tissue homogenisation
For protein determination, brain tissue was sonicated in cold phosphate-buffered saline (PBS) (Sigma life science, St. Louis, USA) containing a mix of phosphatase inhibitors (Sigma-Aldrich, Søborg, Denmark) and the cOmplete mini, EDTA-free proteinase inhibitor cocktail (Roche, Basel, Switzerland). The total protein content was measured using the bicinchoninic acid (BCA) assay according to the manufacturer’s protocol (Thermo Fisher Scientific, Waltham, USA).
Electrochemiluminescence analysis
Electrochemiluminescence analysis was performed on brain tissue and serum using the MSD Mouse Proinflammatory V-Plex Plus Kit (interferon-gamma (IFNγ), interleukin (IL)-1β, IL-2, IL-4, IL-5, IL-6, IL-10, IL-12p70, –X-C Motif Chemokine Ligand 1 (CXCL1), tumor necrosis factor (TNF); Mesoscale Discovery, Rockville, USA). Samples were diluted in Diluent-41 and analyzed in accordance with the manufacturer’s instructions. Analysis was performed on a SECTOR Imager 6000 plate reader, and MSD Discovery Workbench software was used for analysis (Mesoscale Discovery). 23 The lower limit of detection (LLOD) was a calculated concentration based on a signal of 2.5 standard deviations (SD) above the blank (zero) calibrator. For protein levels below LLOD, a value of 0.5 LLOD was used for statistical analysis. LLOD values: TNF =0.0824 pg/mL, CXCL1 = 0.0856 pg/mL, IL-6 =0.82 pg/mL, IL-5 = 0.0888 pg/mL, IL-4 = 0.0578 pg/mL, IL-2 = 0.117 pg/mL, IL-1β = 0.188 pg/mL, IL-12p70 = 2.71 pg/mL, IL-10 = 0.24 pg/mL, and IFNγ = 0.0361 pg/mL. The measured protein levels in the brain were normalized to the total protein content measured using the BCA assay. 24
Enzyme-linked immunosorbent assay (ELISA)
Tissue samples were minced on a surface cooled to <0°C and homogenized, first by grinding with extraction and second by ultrasonication. Next, 20 μL/mg tissue of an extraction buffer with 2% SDS, 100 mM sodium HEPES and 1 cOmplete™ Protease Inhibitor Tablet (Roche) pr. 10 mL (1× PI) was used. The protein content of each sample was measured in triplicates with the Pierce™ BCA Protein Assay Kit (Thermo Scientific) on a BSA standard curve according to manufacturer’s protocol. Samples were diluted in extraction buffer to 2 μg protein/μL.
To replace SDS with the ELISA compatible detergent Tween-20, SDS was precipitated by addition of an equal volume of a Tween/K buffer with 0.1% Tween-20, 100 mM K2HPO4, 1× PI buffer followed by centrifugation for 15 minutes at 15.000 × G at 2 °C, to pellet the potassium-SDS precipitate. Total protein was remeasured as described above and the supernatant was aliquoted for the ELISAs. For use in the ELISA standard curves, a sample buffer was prepared similarly by precipitating SDS from the extraction buffer with the Tween/K buffer.
For measurement of Cyclophilin-A (Cyp-A), we used an Abbexa CypA ELISA kit (Cat. #: abx585050; Abbexa, Ltd., Cambridge, UK). Samples were diluted in the kit ‘Standard Diluent Buffer’ (80 μL sample + 25 μL kit buffer). The CypA standard was reconstituted and diluted in a 3.8:1.2 mix of sample buffer and kit ‘Standard Diluent Buffer’. Color development was allowed to proceed for 60 min. For measurement of Intracellular adhesion molecule-1 (ICAM-1), we used an Abcam ICAM-1 ELISA kit (Cat. #: ab100688; Abcam plc, Cambridge, UK). Samples were diluted in the kit ‘1x Assay Diluent B’ (28.5 μL sample + 103.5 μL kit buffer). The ICAM1 standard was reconstituted and diluted in a 30:11.4 mix of sample buffer and kit ‘Standard Diluent Buffer’. ICAM-1 and Cyp-A assays were otherwise run according to manufacturer’s protocol.
All samples and standards were measured in duplicate. Absorbance was measured at 450 nm. The observed absorbance in the 0-standard was subtracted from all measurements and a 4-parameter algorithm was used to produce a standard curve. The observed specific protein content of each sample replicate was averaged, multiplied by the dilution factor, and normalized to the total protein concentration of the sample after SDS-removal. The results are normalized to the total protein content of each sample (units: pg/mg).
Optical intrinsic signal imaging (OISI)
The imaging setup was inspired by the one described by Kura et al. 19 It consisted of a light source in which three LEDs (peak wavelengths: 530 nm, 470 nm, and 625 nm; part. no.: M530L3-C1, M470L3-C1, M625L3-C1; Thorlabs, Newton, USA) were installed to illuminate the cranial window. A CCD camera (ORCA-Flash4.0 V3, Hamamatsu, Shizuoka, Japan) collected the light reflected from the window. The LEDs were controlled by the camera through an in-house manufactured gating system that synchronised the LEDs with each acquired frame (∼33 ms per wavelength). The CCD camera was controlled by the HCImageLive software (Hamamatsu, Shizuoka, Japan) and set to capture images of 256 × 256 pixels (3.5 mm × 3.5 mm) at a frame rate of 30 Hz, which resulted in a frame rate for each LED wavelength of 10 frames per second. Functional activation was induced with air-puffs delivered to the right-side vibrissae (whiskers) at a frequency of 3 Hz. Each stimulation trial (baseline: 8 s; stimulation: 2 s; recovery: 20 s) was repeated 10 times in an imaging session lasting 5 min.
Once acquired, images were separated into the three colour channels, and the blue channel (470 nm) was omitted from analysis. The green (530 nm) and red (625 nm) channel reflected light intensities were quantified into relative concentrations of oxy- (HbO) and deoxyhaemoglobin (HbR) using the method described in. 19 The image intensity values were first converted to optical absorption coefficients by assuming a modified Beer-Lambert law and using wavelength-dependent mean tissue path lengths. 25 The 8 s time window prior to stimulation onset was used to normalize the image intensities to relative values. The calculated absorption coefficients at the two wavelengths were then used to estimate relative HbO and HbR concentrations by inverting a 2 × 2 system of equations in the least-squares sense. The necessary values of the molar extinction coefficients of HbO and HbR in water were obtained from. 26 Image reconstruction, visualisation and extraction of values for statistical analyses were performed using custom scripts (Matlab, The Mathworks Inc.) that can be requested from the corresponding author.
Optical coherence tomography (OCT)
The imaging setup is similar to the one described by Erdener et al. 21 It consisted of a spectral-domain OCT system (Telesto-II, ThorLabs, Newton, USA) with a superluminescent diode with a central wavelength of 1310 nm and a bandwidth of 170 nm. The objective used was a 10× objective (Mitutoyo, Kanagawa, Japan), the focus of which was adjusted to image capillaries 150–250 µm below the brain surface. The system was controlled by a custom-built software written in the C++ platform Qt Creator and set to capture two 3D scans (a 2 B-scan) the size of 400 × 400 × 1024 pixels (0.6 mm × 0.6 mm × 3.2 mm) from which an angiogram was created via decorrelation and phase correction, as described in.20,21 A timeseries of 60 OCT-angiograms were acquired in 15 min, and the procedure was repeated for an end result of two regions of interest (ROIs) per animal per imaging session.
The quantification of stall events in capillary segments traditionally is a labour-intensive and error-prone manual process. We developed a novel pipeline for semi-automatic detection of capillary stalls, which is fully documented in preprint form. 27 Links to code and validation datasets can be found on the project’s OSF homepage at https://osf.io/me6hf/. Briefly, we first extracted a thin slab (400 × 400 × 20 voxels) from the angiogram, corresponding to the volume of tissue that is maximally in focus. We then created en face maximum intensity projections (MIPs) of each slab, leading to 60 images of 400 × 400 pixels (one per frame), in which the capillaries have been flattened into two dimensions. The analysis pipeline proceeded to apply standard image filtering and noise reduction techniques to enhance the contrast between capillaries and background. Capillary segments were subsequently automatically identified and extracted, which in our dataset led to approximately 120–180 segments per region of interest. Stall events correspond to image intensity dropouts at the locations of blood flow blockage. To distinguish true stalls from artefactual signal fluctuations (such as due to vibrations of the imaging apparatus), a threshold value was set manually for each capillary. The pipeline included a graphical tool to assist robust assignment of the threshold. In the present study, we chose to set a lower limit of 2 frames for the duration of stalls, as it can be difficult to distinguish a “true” stall from noise on a frame-by-frame basis.
Statistical analysis
Statistical analyses were performed using Prism 9 (GraphPad Software, San Diego, CA). One- or two-way repeated-measures analysis of variance (ANOVA) was applied, as relevant, to test the equality of means and for the presence of interactions. The alpha-level was held at 0.05. Sphericity was not assumed and whenever the data did not support it, Greenhouse-Geiser correction was performed by adjusting the numerator and denominator degrees-of-freedom by a constant multiplier (epsilon). Post hoc comparisons are reported after correction for multiple comparisons using Tukey’s method. For the comparison of number of stall events (integer values only), we also applied the non-parametric repeated-measures Friedman test. Only the values of the one-way ANOVA are reported, as the significant effects were identical. The Kruskal-Wallis one-way analysis of variance with Dunn’s correction for multiple comparisons was applied to testing cytokine expression levels, as there the low number of data points (N = 5) rendered ANOVA inappropriate.
An ANOVA model cannot accommodate the random effects associated with data from two ROIs per animal, as shown in Figure 4. To validate our significant ANOVA results, we applied linear mixed-effects modelling using the R package lme4, 28 in which a within-subject factor (ROI) was included. As none of the significant findings of the study were affected, we report results without inclusion of random effects, and provide the mixed-effects procedure in Supplementary materials.
Results
We designed a longitudinal study in which we collected repeated optical data for three consecutive days from the same mice (N = 10): 18 hours prior to (baseline), 6 hours and 24 hours after LPS administration (Figure 1(a)). With surgically implanted cranial windows, this design allowed us to follow within-animal differential effects of LPS-injections on cerebral blood flow (Figure 1(b)–(e)). In an initial method-validating experiment, we investigated the cytokine response to LPS at the three imaging timepoints in control mice (N = 15) subjected to the same procedures including handling and pre-imaging surgery. Hence, the cytokine expression data presented below were obtained in mice that also had a chronic cranial window implanted, went through post-surgery recovery, and underwent behavioural training before and after surgery.
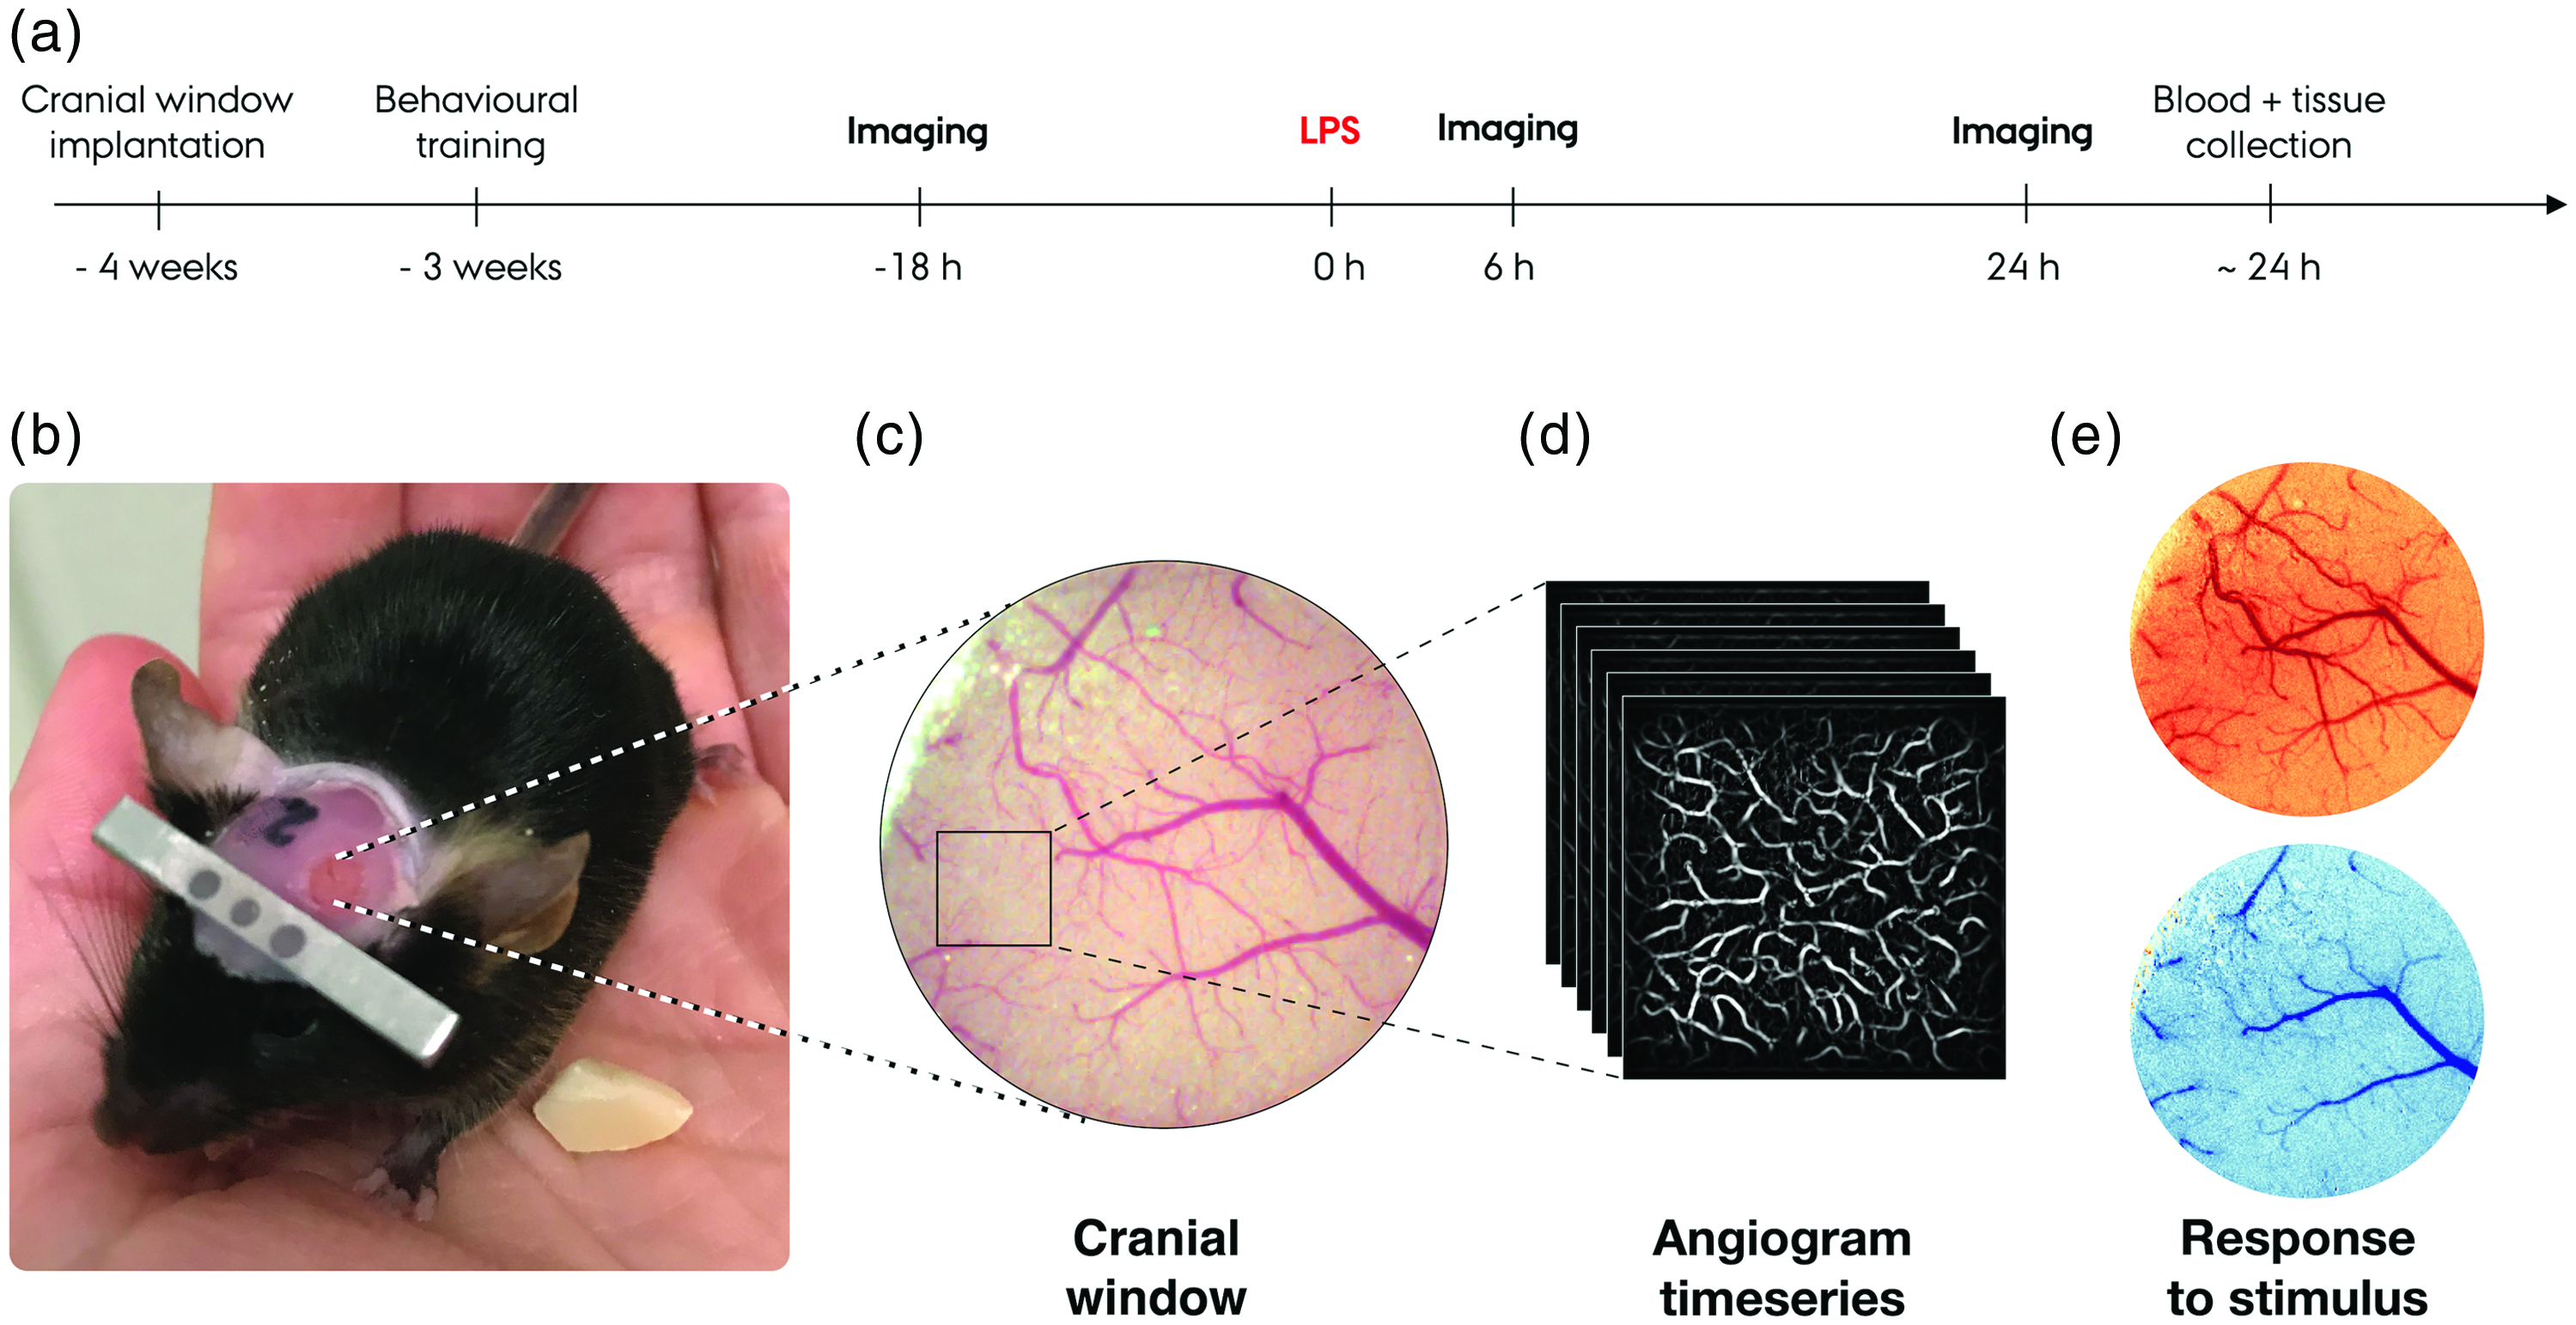
(a) Timeline of the experimental procedure. (b) Image of an example mouse with the cranial window implanted going through behavioural training. (c) Image of the somatosensory cortex through the cranial window acquired in combination with imaging sessions. The square marks one of two regions of interest (ROIs), from which a timeseries of capillary angiograms are collected. (d) Example of an angiogram series collected with the OCT system and (e) Example of haemodynamic response to whisker stimulation collected with the OISI system. Increases, relative to a pre-stimulus baseline, in oxyhaemoglobin (top, red colour scale) and deoxyhaemoglobin (bottom, blue colour scale) are visualised and quantified separately.
LPS administration leads to cytokine upregulation akin to systemic inflammation
Intraperitoneal high dose LPS administration is reflected in measures of cytokine expression, indicating that LPS induces a severe systemic inflammatory response (Figure 2). Using the Mesoscale multiplex chemiluminescence technology, we quantified key inflammatory cytokines known to be upregulated in the acute phase of the innate immune response. 29 In both blood serum and brain tissue samples of the control group (N = 15), significant differences between timepoints were observed in the concentrations of TNF (Kruskal-Wallis statistic: KW(serum) = 12.02, p < 0.0001; KW(brain) = 8.78, p < 0.01), IL-1β (KW(serum) = 11.58, p < 0.0001; KW(brain) = 11.18, p < 0.001) and IL-6 (KW(serum) = 11.58, p < 0.0001; KW(brain) = 12.02, p < 0.0001). The effects were driven by significant upregulations of all three markers within the first 6 h after LPS injection, followed by a drop towards baseline values within 24 h after LPS injection (Figure 2). We confirmed that CXCL1, a chemotactic agent that recruits fibroblasts, neutrophils and macrophages and facilitates vascular permeability, 30 was also significantly upregulated in the early stage of inflammation (KW(serum) = 12.50, p < 0.0001; KW(brain) = 11.58, p < 0.0001). Finally, our data show significant upregulation of IL-10, an anti-inflammatory cytokine that is upregulated in response to the presence of pro-inflammatory cytokines, in both serum (KW = 9.50, p < 0.01) and brain (KW = 9.74, p < 0.01). Post hoc analysis indicates that in serum, but not brain, IL-10 remains elevated at the 24 h measurement timepoint. No changes in serum or brain levels of IFNγ, IL-2, IL-4, IL-5, or IL-12p70 were observed at any timepoint following LPS administration (data not shown). Furthermore, the serum and brain samples collected at the 24 h timepoint from mice included in the longitudinal imaging study showed a similar cytokine profile as the 24 h control group (data not shown).
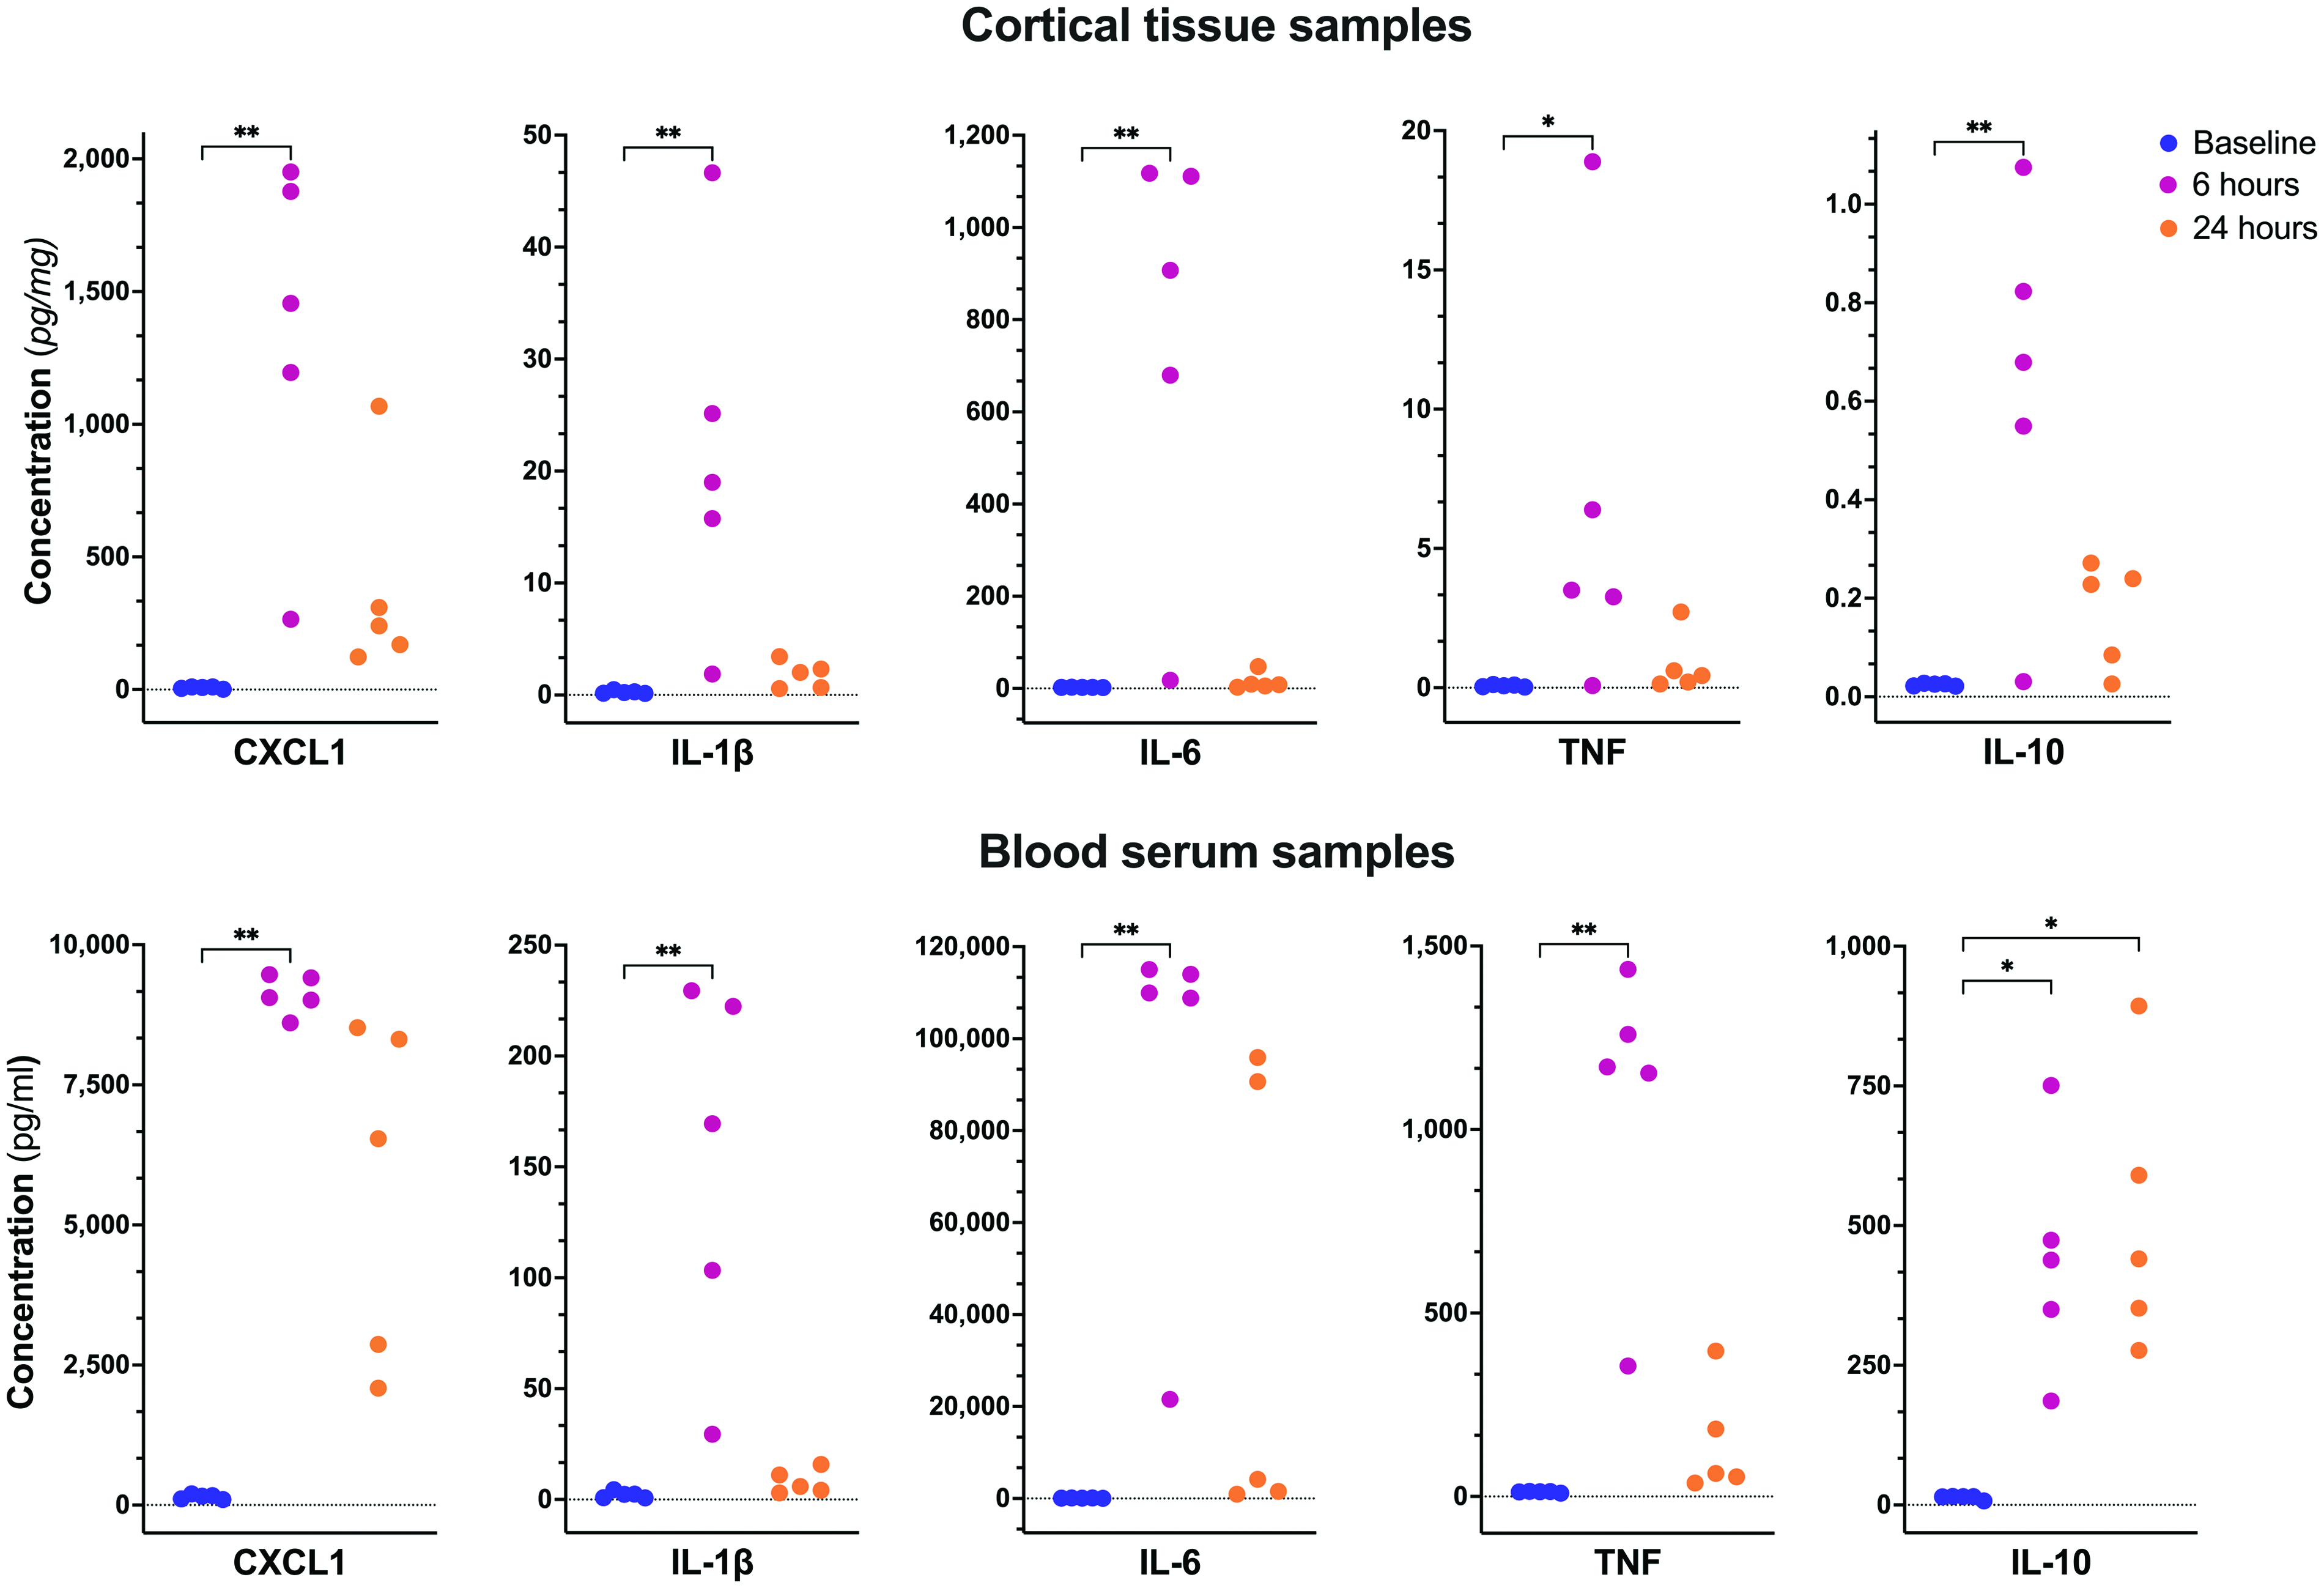
Cytokine expression in cortical tissue and blood serum samples were collected from groups of control mice at baseline (n = 5), 6 hours (n = 5), and 24 hours (n = 5) after LPS injection. Statistical comparisons are based on Dunn’s post hoc correction for multiple corrections; *p<.05, **p<.01.
Inflammation alters the functional hyperaemic response magnitude and dynamics
The longitudinal effects of a single systemic dose of LPS on tissue HbO and HbR concentration in response to whisker stimulation were measured using the OISI technique in ten awake mice (Figure 3). The functional hyperaemic response was observed before and after LPS administration as an increase in HbO (Figure 3(a)) and a decrease in HbR (Figure 3(b)) concentrations in the somatosensory cortex following stimulation. The individual response time series for HbO, HbR, and total haemoglobin (HbT) of ten mice (Figure 3(c)) revealed reduced concentration changes after LPS administration and delayed responses to stimulus onset, relative to the pre-administration (baseline) state. These results are re-plotted with an emphasis on the within-measure (‘HbX’) differences between measurement timepoints (Figure 3(d)).
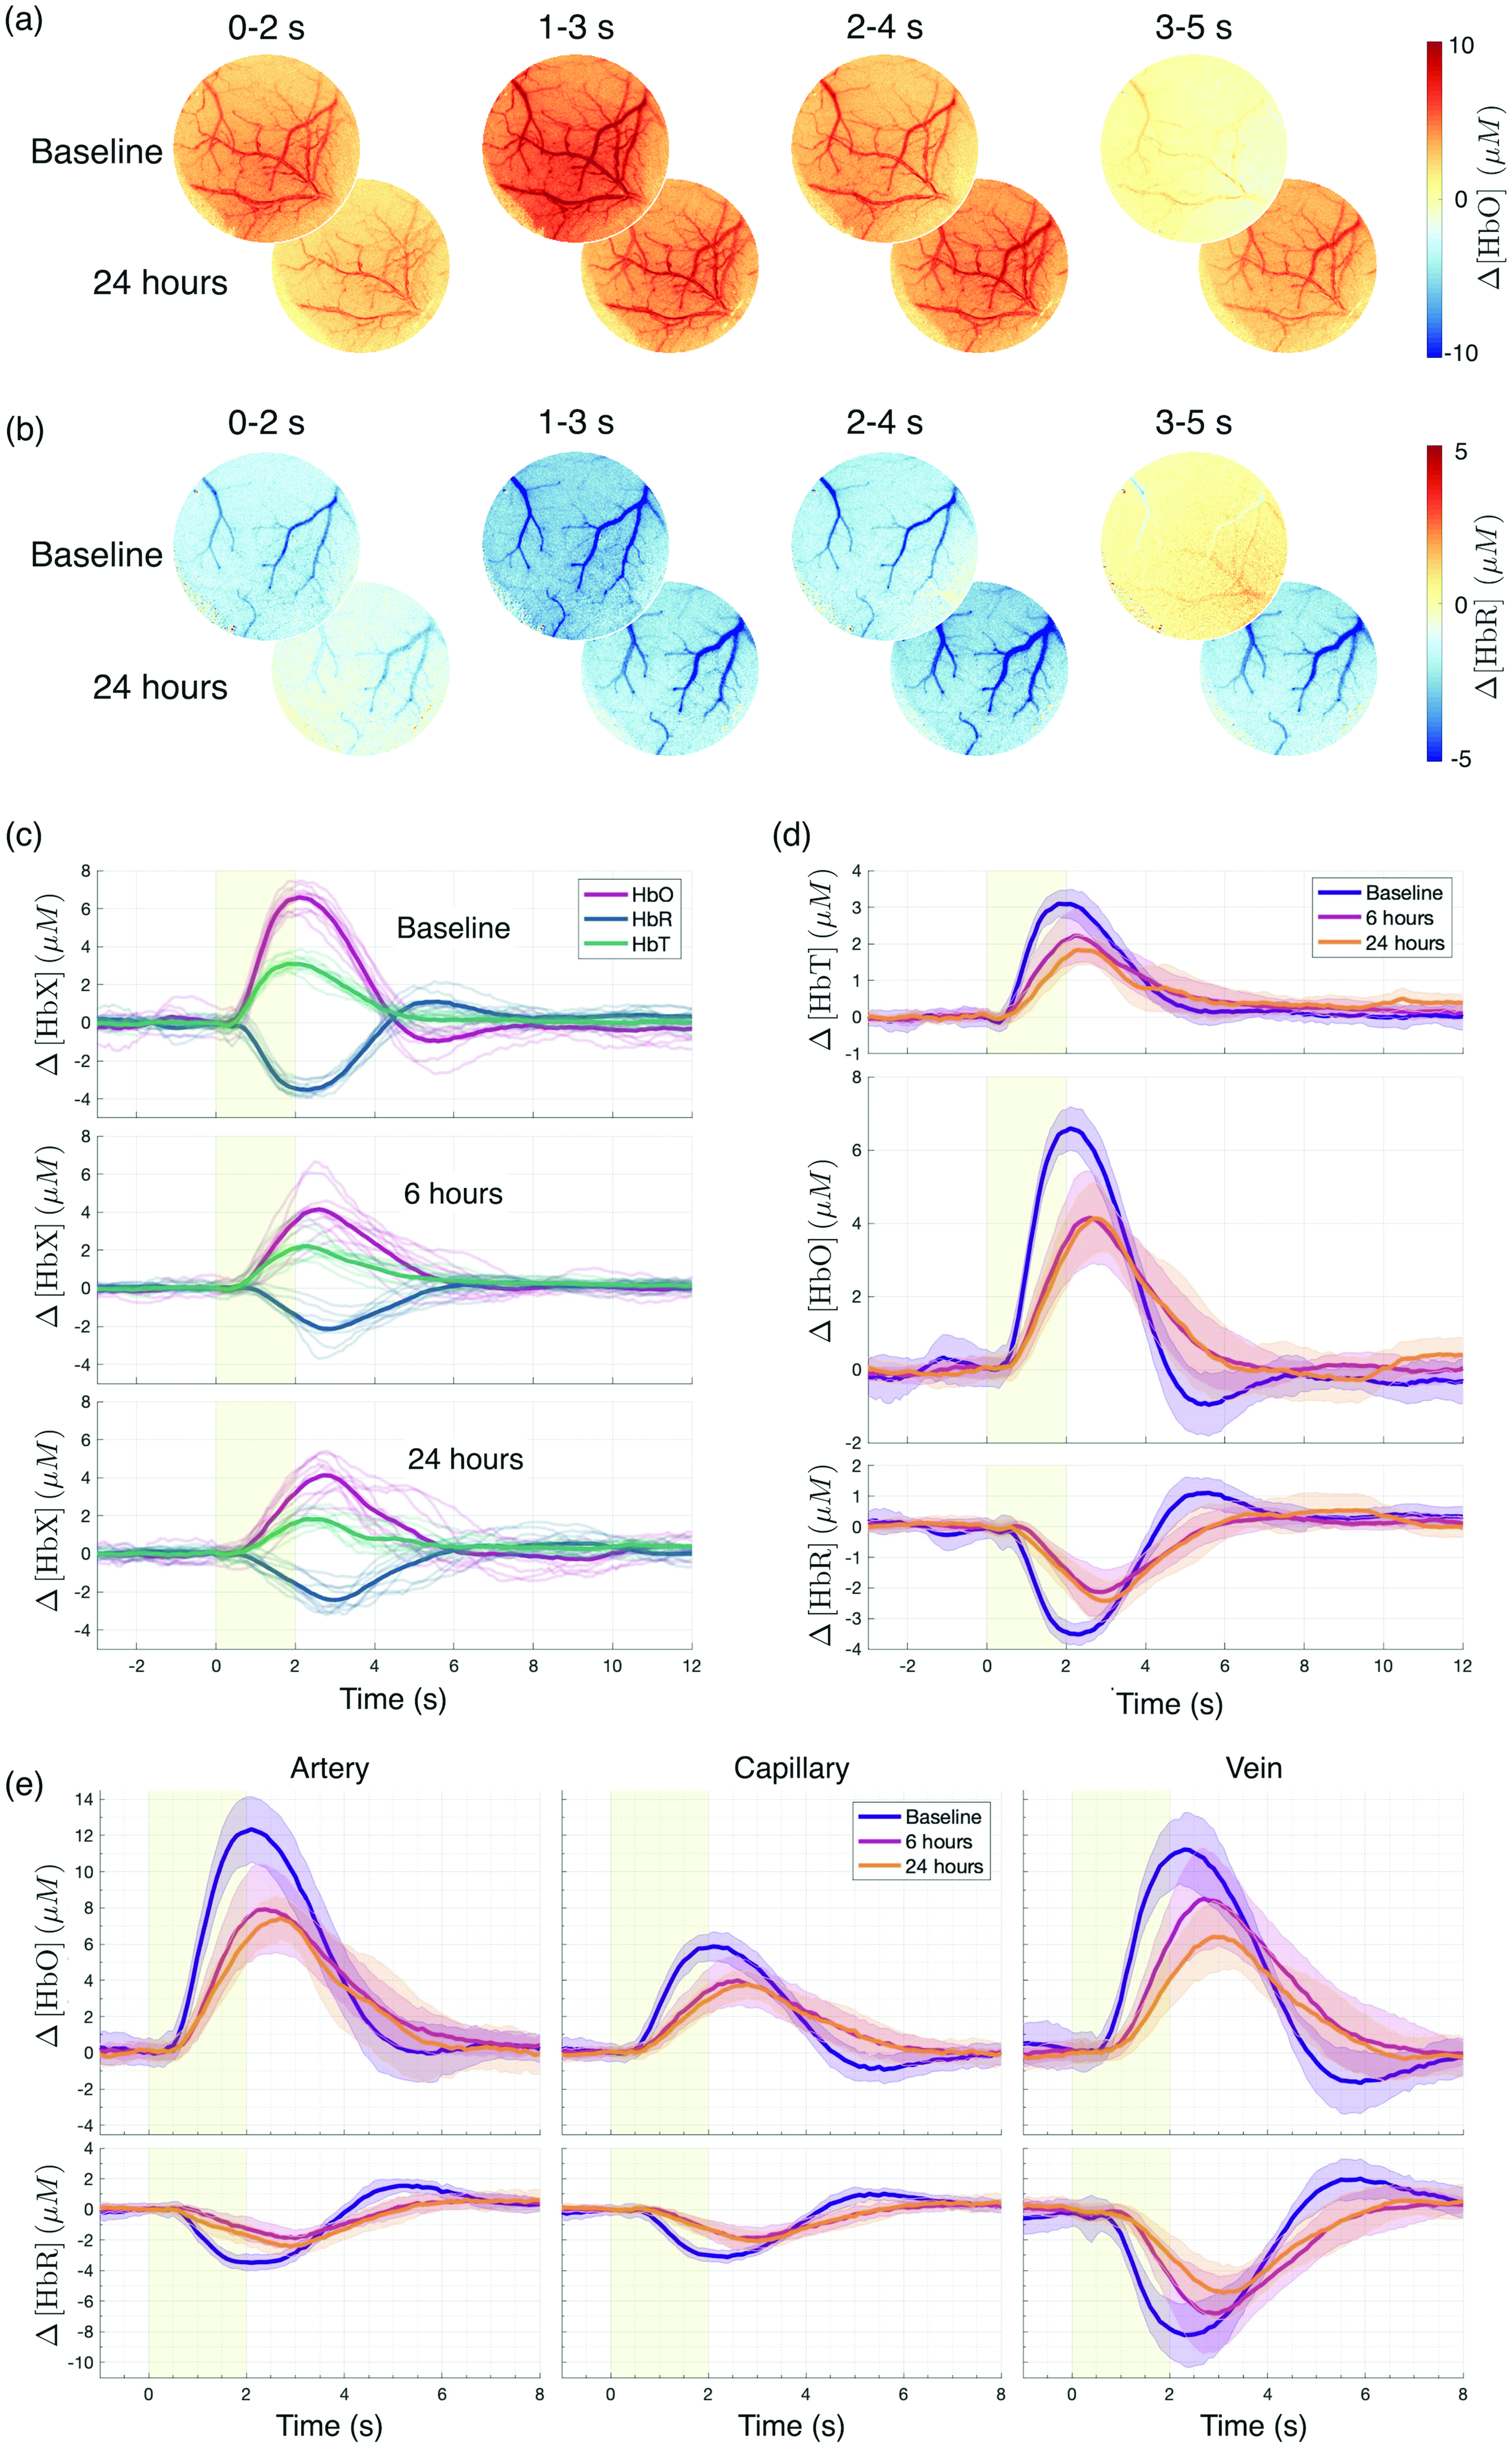
Oxy- (HbO) and deoxyhaemoglobin (HbR) responses to 2 s of 3 Hz air-puff stimulation of the whisker pad. (a) HbO and (b) HbR maps are shown for a single representative animal at baseline (top row) and 24 h after LPS injection (bottom row) for four successive time windows relative to stimulation onset (window average shown). (c) Full window HbO (red), HbR (blue), and total haemoglobin (HbT; green) responses at baseline, 6 h, and 24 h after LPS injection (thin curves). The mean responses of 10 mice are overlaid (thick curves). (d) Same as (c), rearranged to show differences between timepoints. Mean responses at baseline (purple), 6 h (pink), and 24 h (orange) are shown as solid lines, and the standard deviation across animals is indicated as surrounding shades and (e) Arterial, capillary, and venous HbO and HbR responses extracted by a manual overlay of masks on the full window in (a) and (b). Note that for illustrative purposes, the time range in (e) differs from that in (c) and (d).
The HbO undershoot and HbR overshoot after stimulation in the baseline measurements were absent both 6 and 24 hours after LPS administration (Figure 3(c)–(e)). To discern whether the LPS-induced differences had distinct vascular compartment origins, we manually defined small ROIs on the images, from which we extracted vascular segment-specific time courses (Supplementary figure 3). The HbX responses are illustrated individually for an artery, a vein, and a parenchymal region without visible large blood vessels, which we here denote as “capillaries” (Figure 3(e)). For each animal, the following metrics were extracted for HbO and HbR at the three measurement timepoints and in the four vascular compartment ROIs (including the full window): response peak value (Vmax), time to peak (Tpeak), and the area under the curve (AUC). The summary statistics for each metric are shown in Table 1 (visualisation in Supplementary figure 4). For each metric, we performed a two-way repeated-measures analysis of variance (RM-ANOVA) with factors timepoint and vascular compartment. For Vmax(HbO), we found a main effect of compartment (F(3, 36) = 58.40; p < 0001) and timepoint (F(1.46, 52.71) = 51.06; epsilon = 0.732; p < .0001), as well as a significant interaction between the two (F(6, 72) = 2.72; p < .05). Likewise, for Vmax(HbR), we found a main effect of compartment (F(3, 36) = 46.49; p < .0001) and timepoint (F(1.82, 65.47) = 22.26; epsilon = 0.909; p < .0001), but no interaction. For Tpeak(HbO), we found a main effect of timepoint (F(1.55, 55.62) = 55.01; epsilon = 0.772; p < .0001). For Tpeak(HbR), the main effect of timepoint (F(1.97, 70.98) = 113.5; epsilon = 0.986; p < .0001) and the time-by-compartment interaction (F(6, 72) = 2.23; p < .05) were significant. For AUC, the main effect of timepoint was significant for HbO (F(1.35, 48.73) = 28.56; epsilon = 0.677; p < .0001), but not for HbR. A main effect of compartment and the time-by-compartment interaction were significant for both HbO (main: F(6, 72) = 3.162; p < 0.01; interaction: F(3, 36) = 29.15; p < 0.0001) and HbR (main: F(6, 72) = 2.516; p < 0.05; interaction: F(3, 36) = 59.93; p < 0.0001).
Haemoglobin response parameters across imaging timepoints for imaged group of 10 mice.
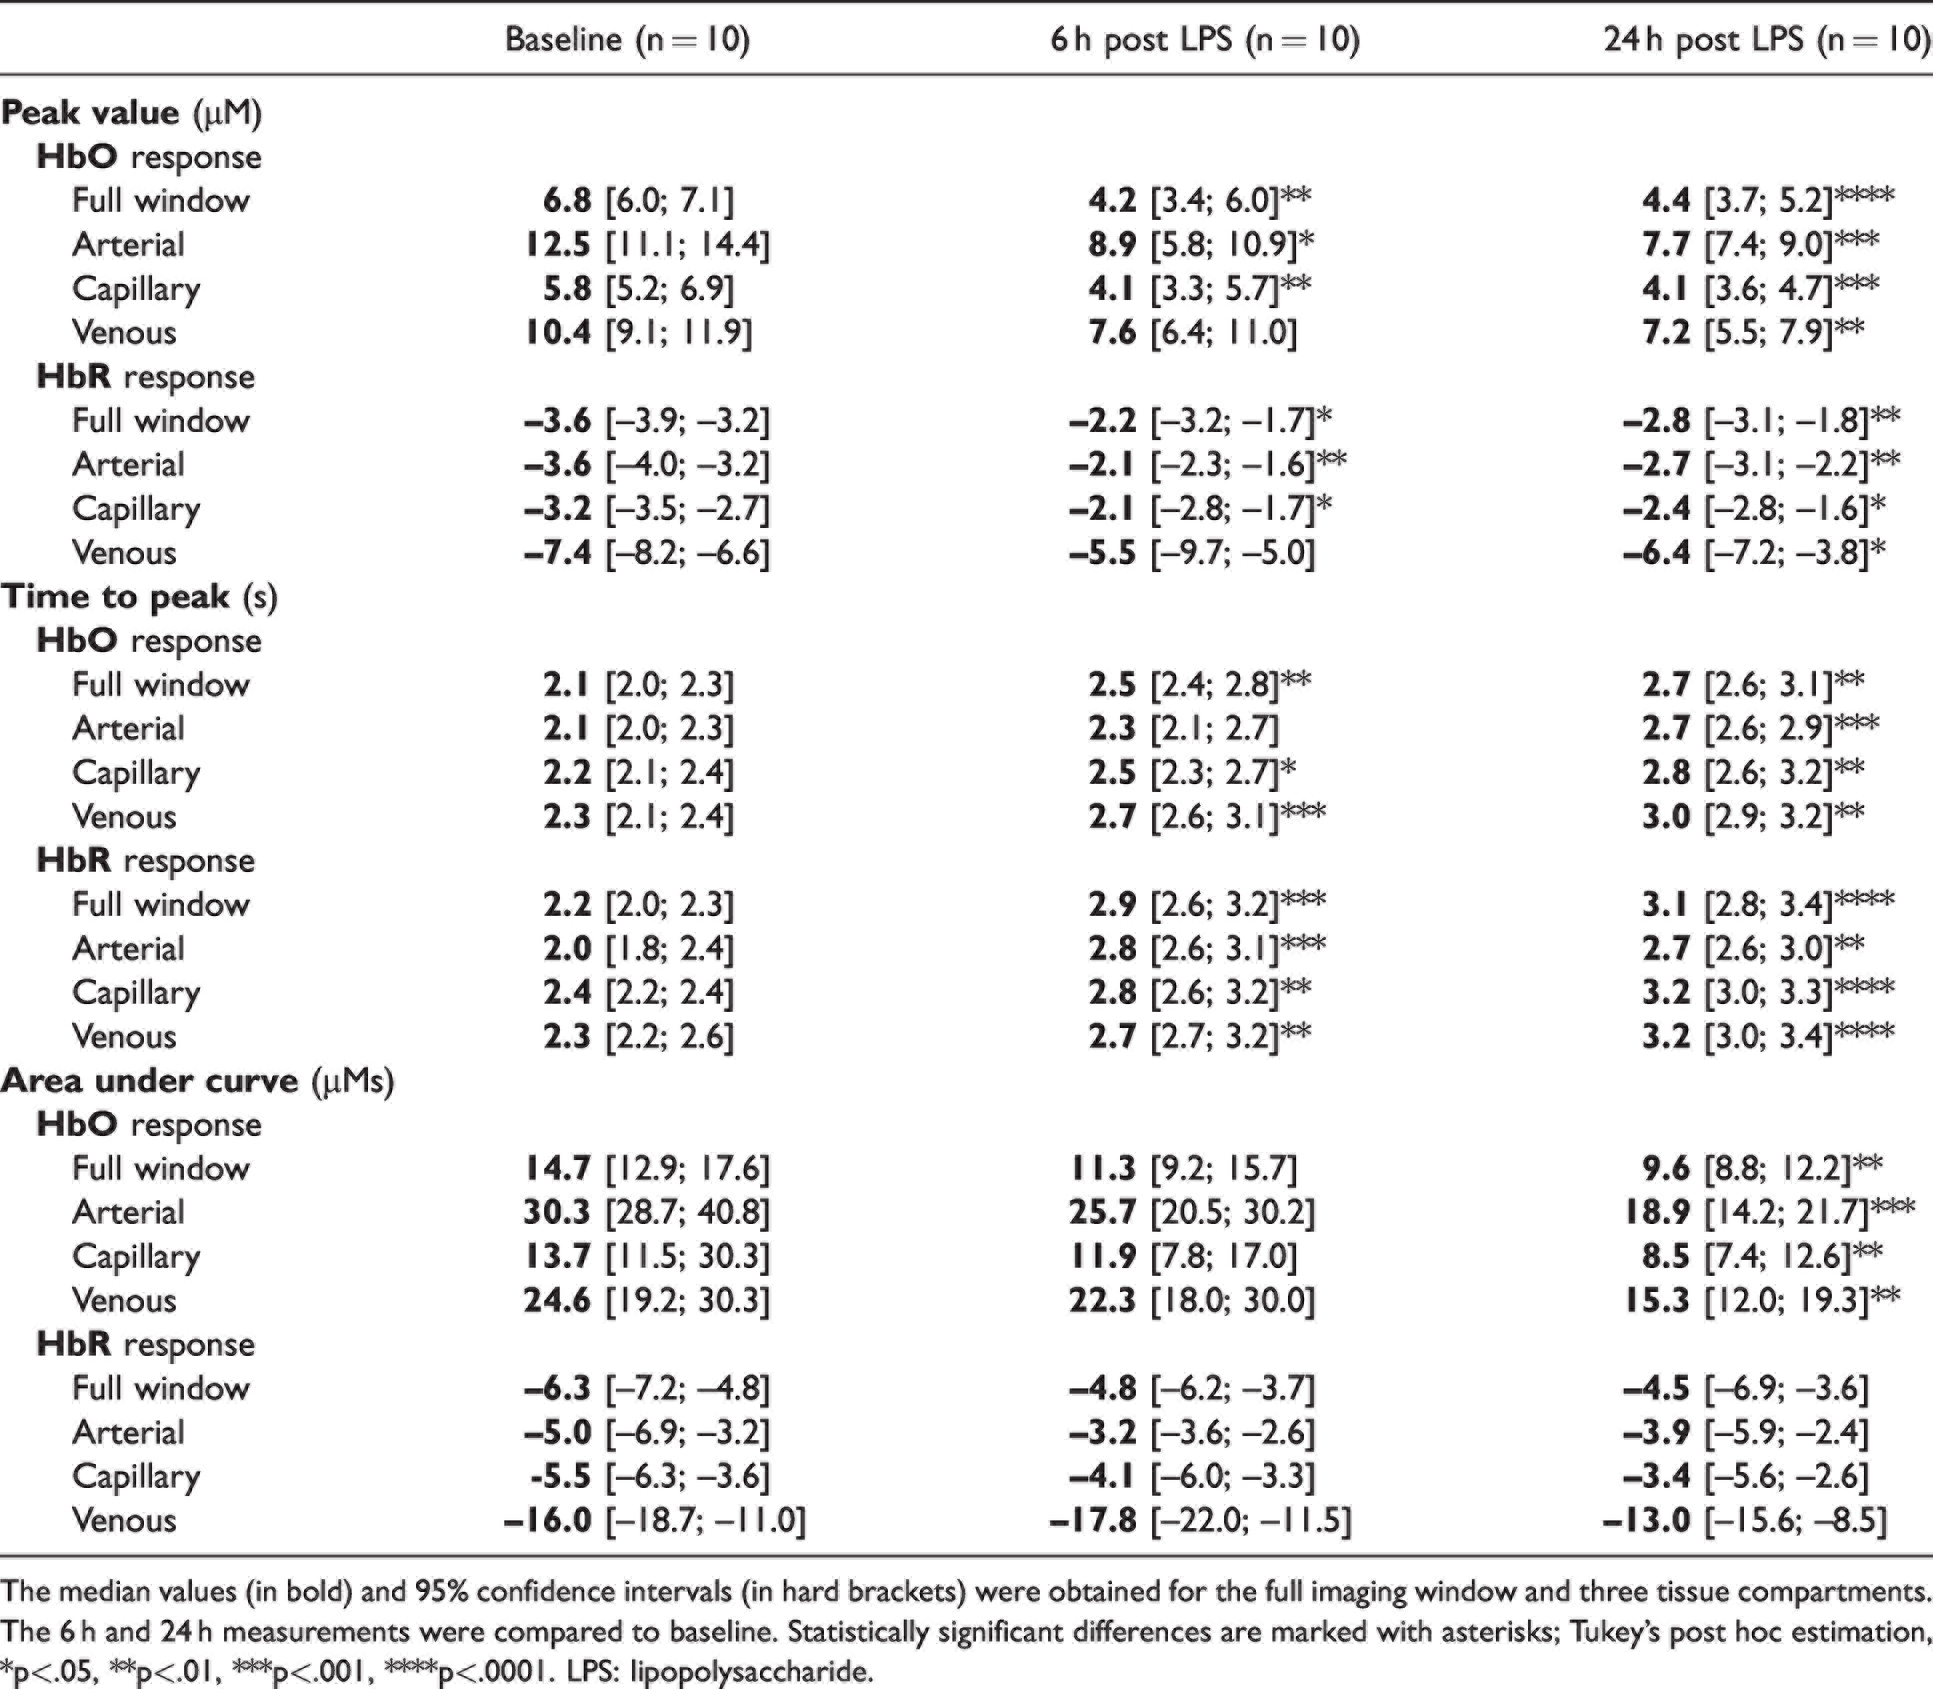
The median values (in bold) and 95% confidence intervals (in hard brackets) were obtained for the full imaging window and three tissue compartments. The 6 h and 24 h measurements were compared to baseline. Statistically significant differences are marked with asterisks; Tukey’s post hoc estimation, *p<.05, **p<.01, ***p<.001, ****p<.0001. LPS: lipopolysaccharide.
The most salient findings with respect to the hyperaemic response were thus a statistically significant reduction in the peak amplitude and AUC, and an increase in the time to peak, when comparing the post-injection timepoints with the baseline (Table 1 and Supplementary figure 4). The largest amplitudes and AUCs were observed in the arteries and veins, where the differences between timepoints were correspondingly largest, driving the observed significant interactions in the ANOVAs.
Inflammation causes an increase in capillary stalled flow events
To evaluate the effects of LPS-induced inflammation on capillary flow, we acquired OCT angiograms to examine the temporal dynamics of capillary “stalls”, i.e., the frequency and duration of blockages leading to the complete halting of blood flow through a capillary segment. By using visual landmarks, OCT images were captured from within the same volume of the somatosensory cortex for all timepoints. Stalls occur spontaneously and, under normal circumstances, self-rectify in a matter of seconds.13,14 In the present study, we defined stalls as the cessation of blood flow in at least two consecutive imaging frames (∼30 s). We quantified the stalls by their total number, the proportion of capillary segments that exhibited at least one stall, and the mean duration of individual stall events (Figure 4, Table 2). We performed one-way ANOVA on each index separately to test the equality of means, and found a significant increase in all stall indices following LPS administration: number of stalls (F(1.987, 37.76) = 52.46; epsilon = 0.994; p < 0.0001), proportion of capillaries stalling (F(1.896, 36.03) = 74.26; epsilon = 0.948; p < .0001) and the mean stall duration (F(1.636, 31.09) = 53.05; epsilon = 0.818; p < .0001). Results of post hoc comparisons show a robust propensity for increases in the stalling indices at the 6 h and 24 h measurements timepoints, compared with baseline (Figure 4(b)–(d)). In the analysis above, the two ROIs per animal were included as independent measurements, an approach supported by our observation that the variation within and between mice in our data was comparable. However, to rigorously model the random effect of subject (mouse), we re-evaluated our statistical observations using a linear mixed-effects model (see Methods and Supplementary materials). None of the conclusions cited above are affected by the inclusion of the random effect, which can thus be omitted when discussing the results.
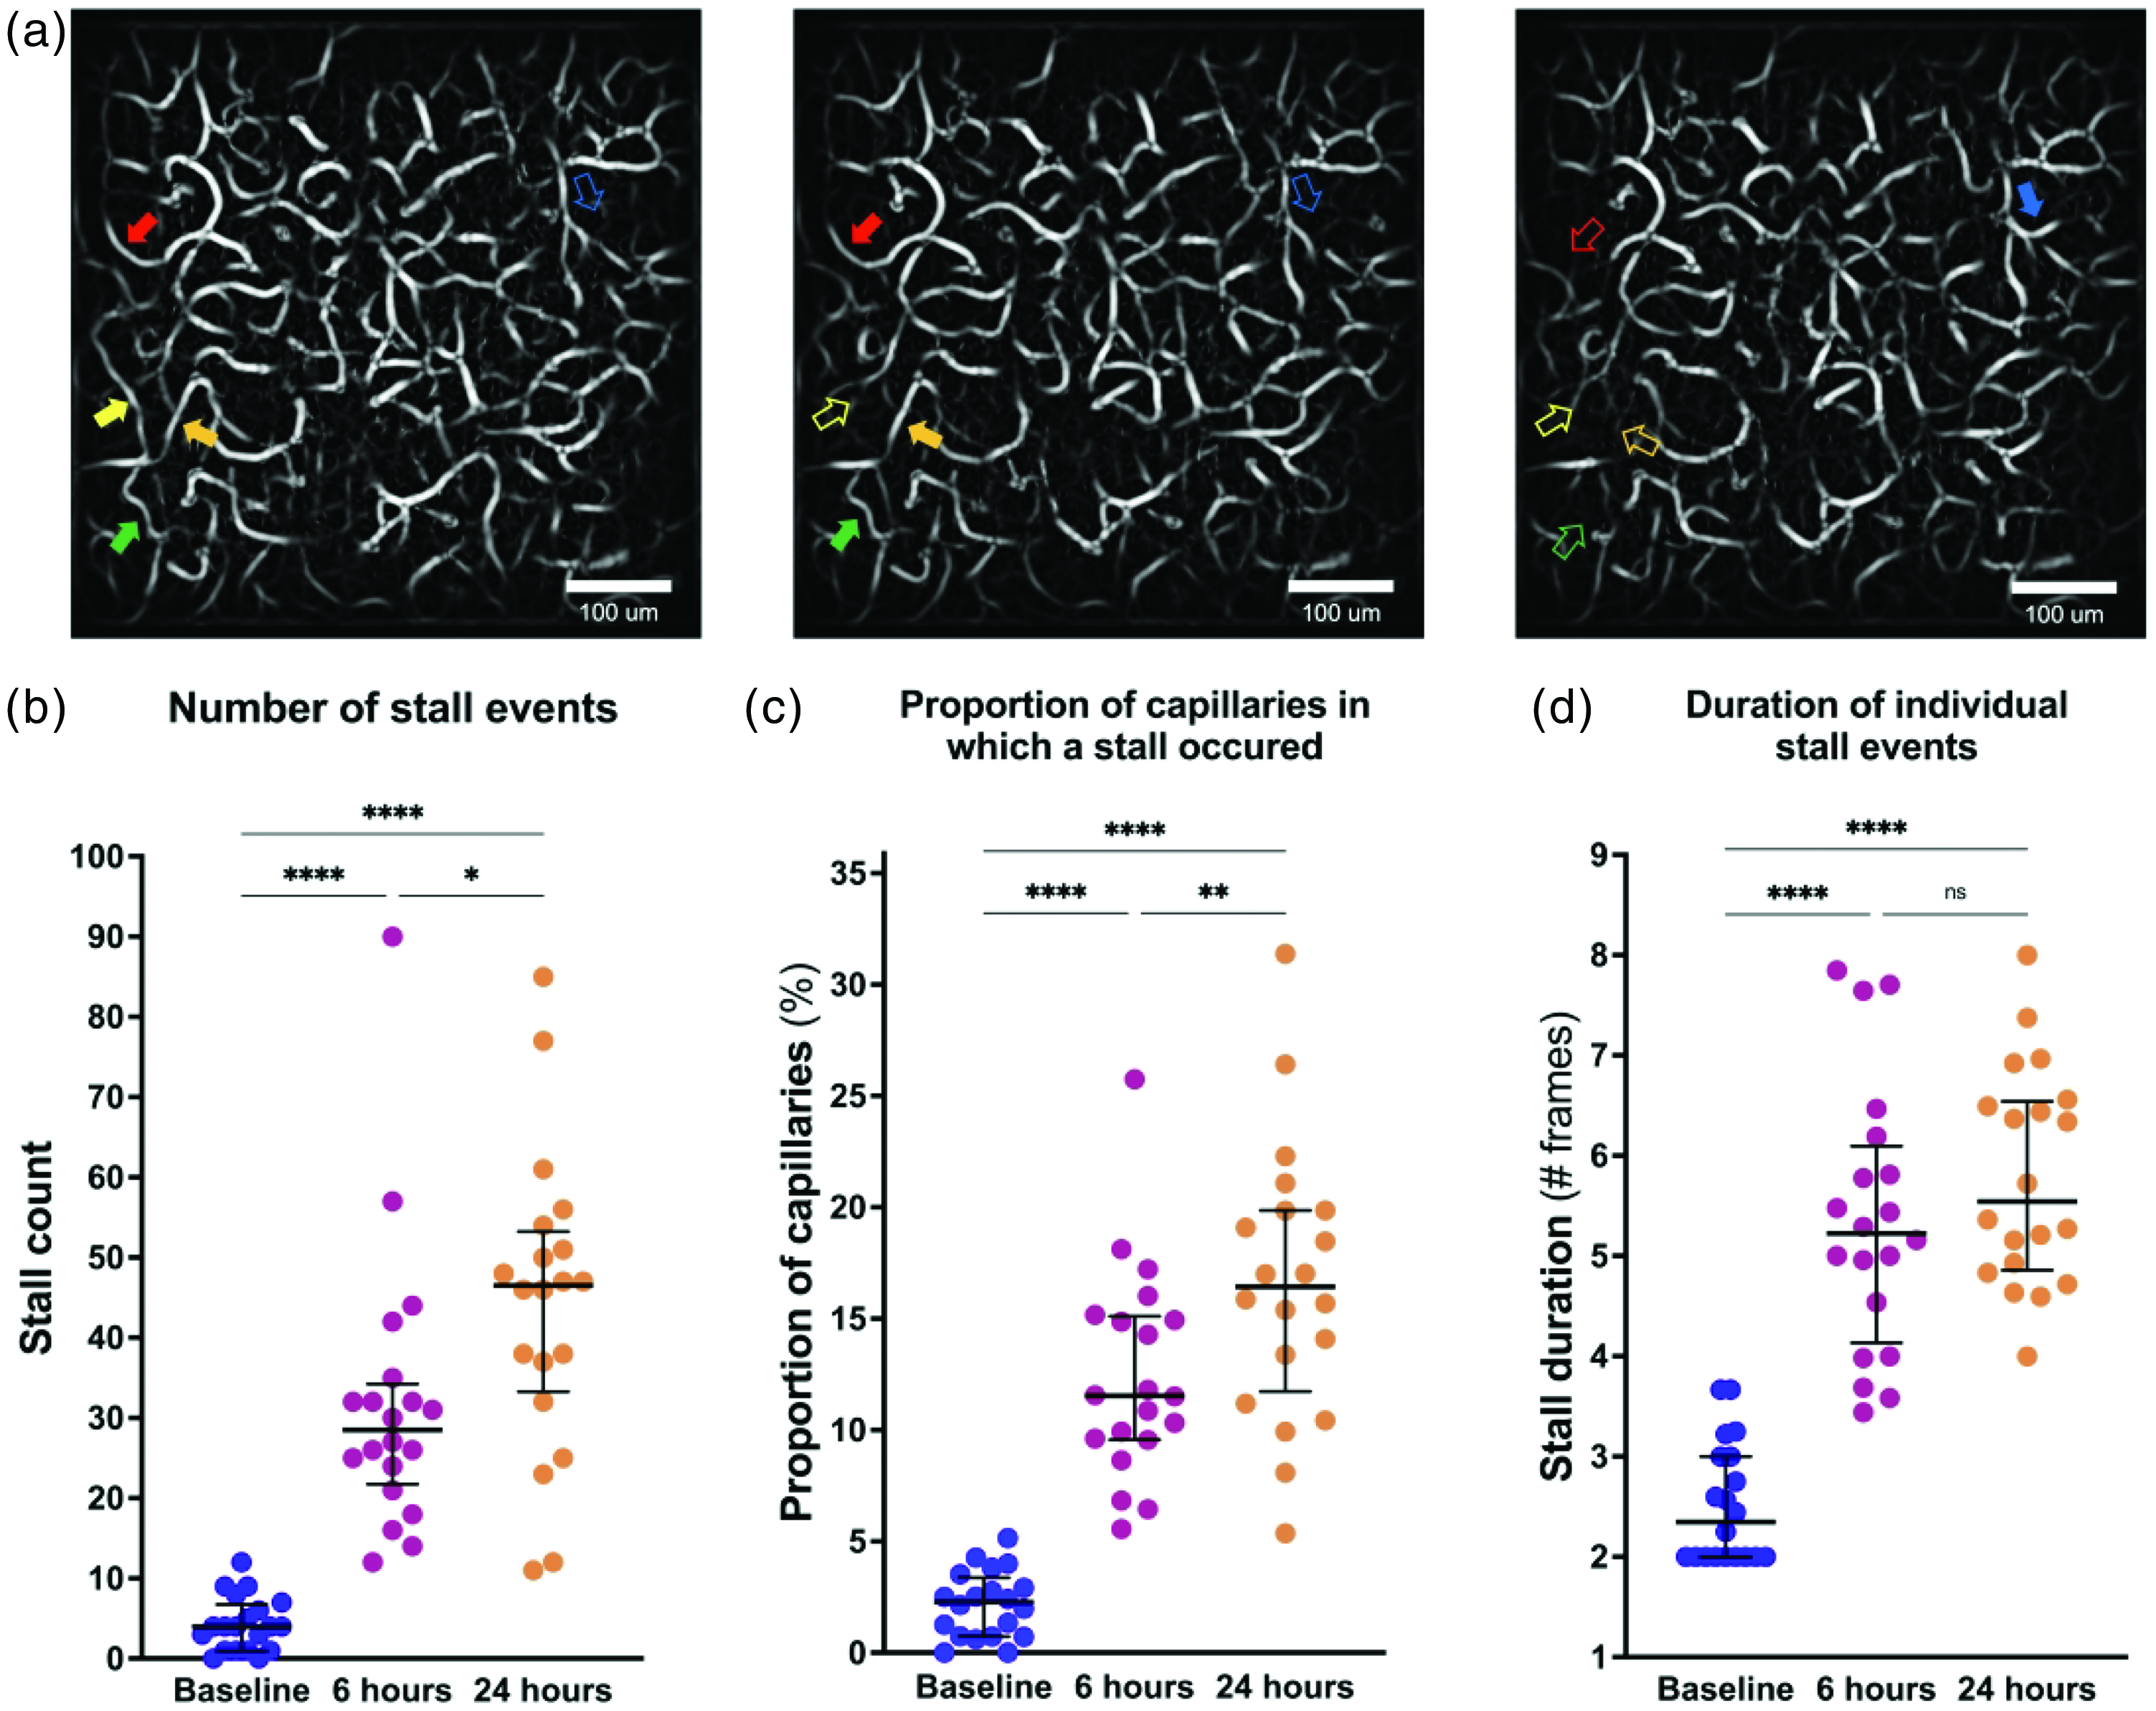
Capillary stalled flow events at rest. (a) Three consecutive OCT angiograms showing examples of stalling capillary segments in a single region-of-interest (ROI). Each full arrow points to a segment with flow, and the corresponding hollow arrow points to the same capillary segment that is missing due to stalled flow. (b) Number of stall events observed during a 15 min imaging session at baseline, 6 h and 24 h after LPS injection. True stall events were considered throughout to have a minimum duration of 2 frames. (c) Proportion of capillaries in which at least one stall event was registered and (d) Duration of individual stall events measured in # frames (∼15 sec/frame). The parameters are compiled across the 10 mice, with two independently acquired ROIs per animal. The median and inter-quartile ranges are marked with horizontal hatch marks in (b) to (d). Statistical comparisons are based on Tukey’s post hoc correction for multiple corrections; *p<.05, **p<.01, ***p<.001, ****p<.0001, ns = not significant.
Capillary stall parameters across imaging timepoints for imaged group of 10 mice.
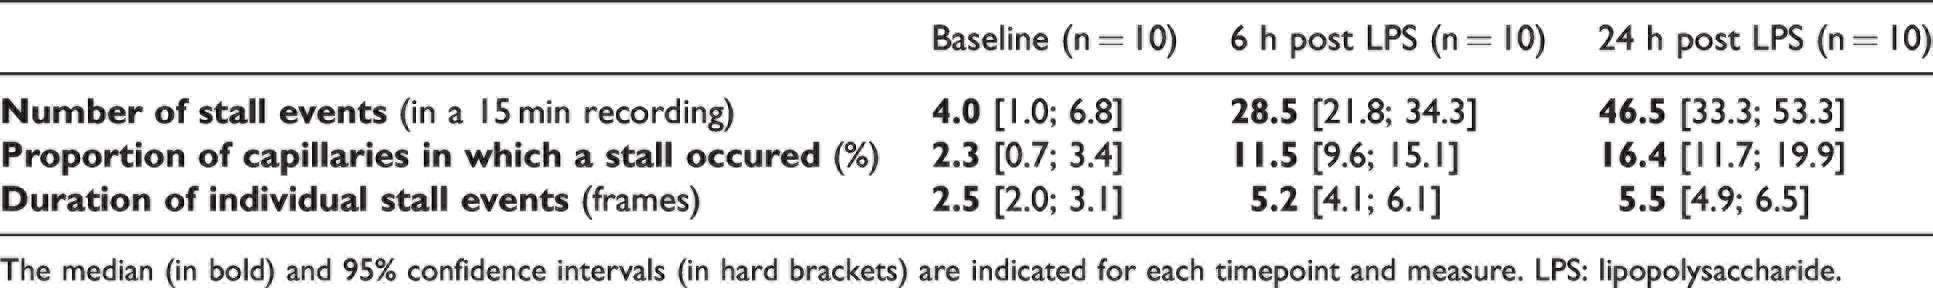
The median (in bold) and 95% confidence intervals (in hard brackets) are indicated for each timepoint and measure. LPS: lipopolysaccharide.
Capillary stalled flow events may be caused by leukocyte plugging
To provide evidence for the leukocyte plugging hypothesis, we performed ELISA to quantify the levels of ICAM-1 and Cyp-A in cortical brain tissue of the control mice before and after LPS administration (Figure 5(a)). The expression of ICAM-1 on the luminal membrane can be upregulated by cytokines, enabling endothelial cells to bind recruited leukocytes, thereby blocking the flow in a capillary segment.10,11,31,32 Cyp-A regulates cytokine secretion 33 and has been indicated in blood-brain barrier damage. 34 Comparing the 24 h timepoint to baseline, LPS injection induced a significant increase in ICAM-1 (unpaired two-tailed t test: t = 5.262, df = 8, p < 0.001) and a significant reduction in Cyp-A (unpaired two-tailed t test: t = 3.051, df = 8, p < 0.05).
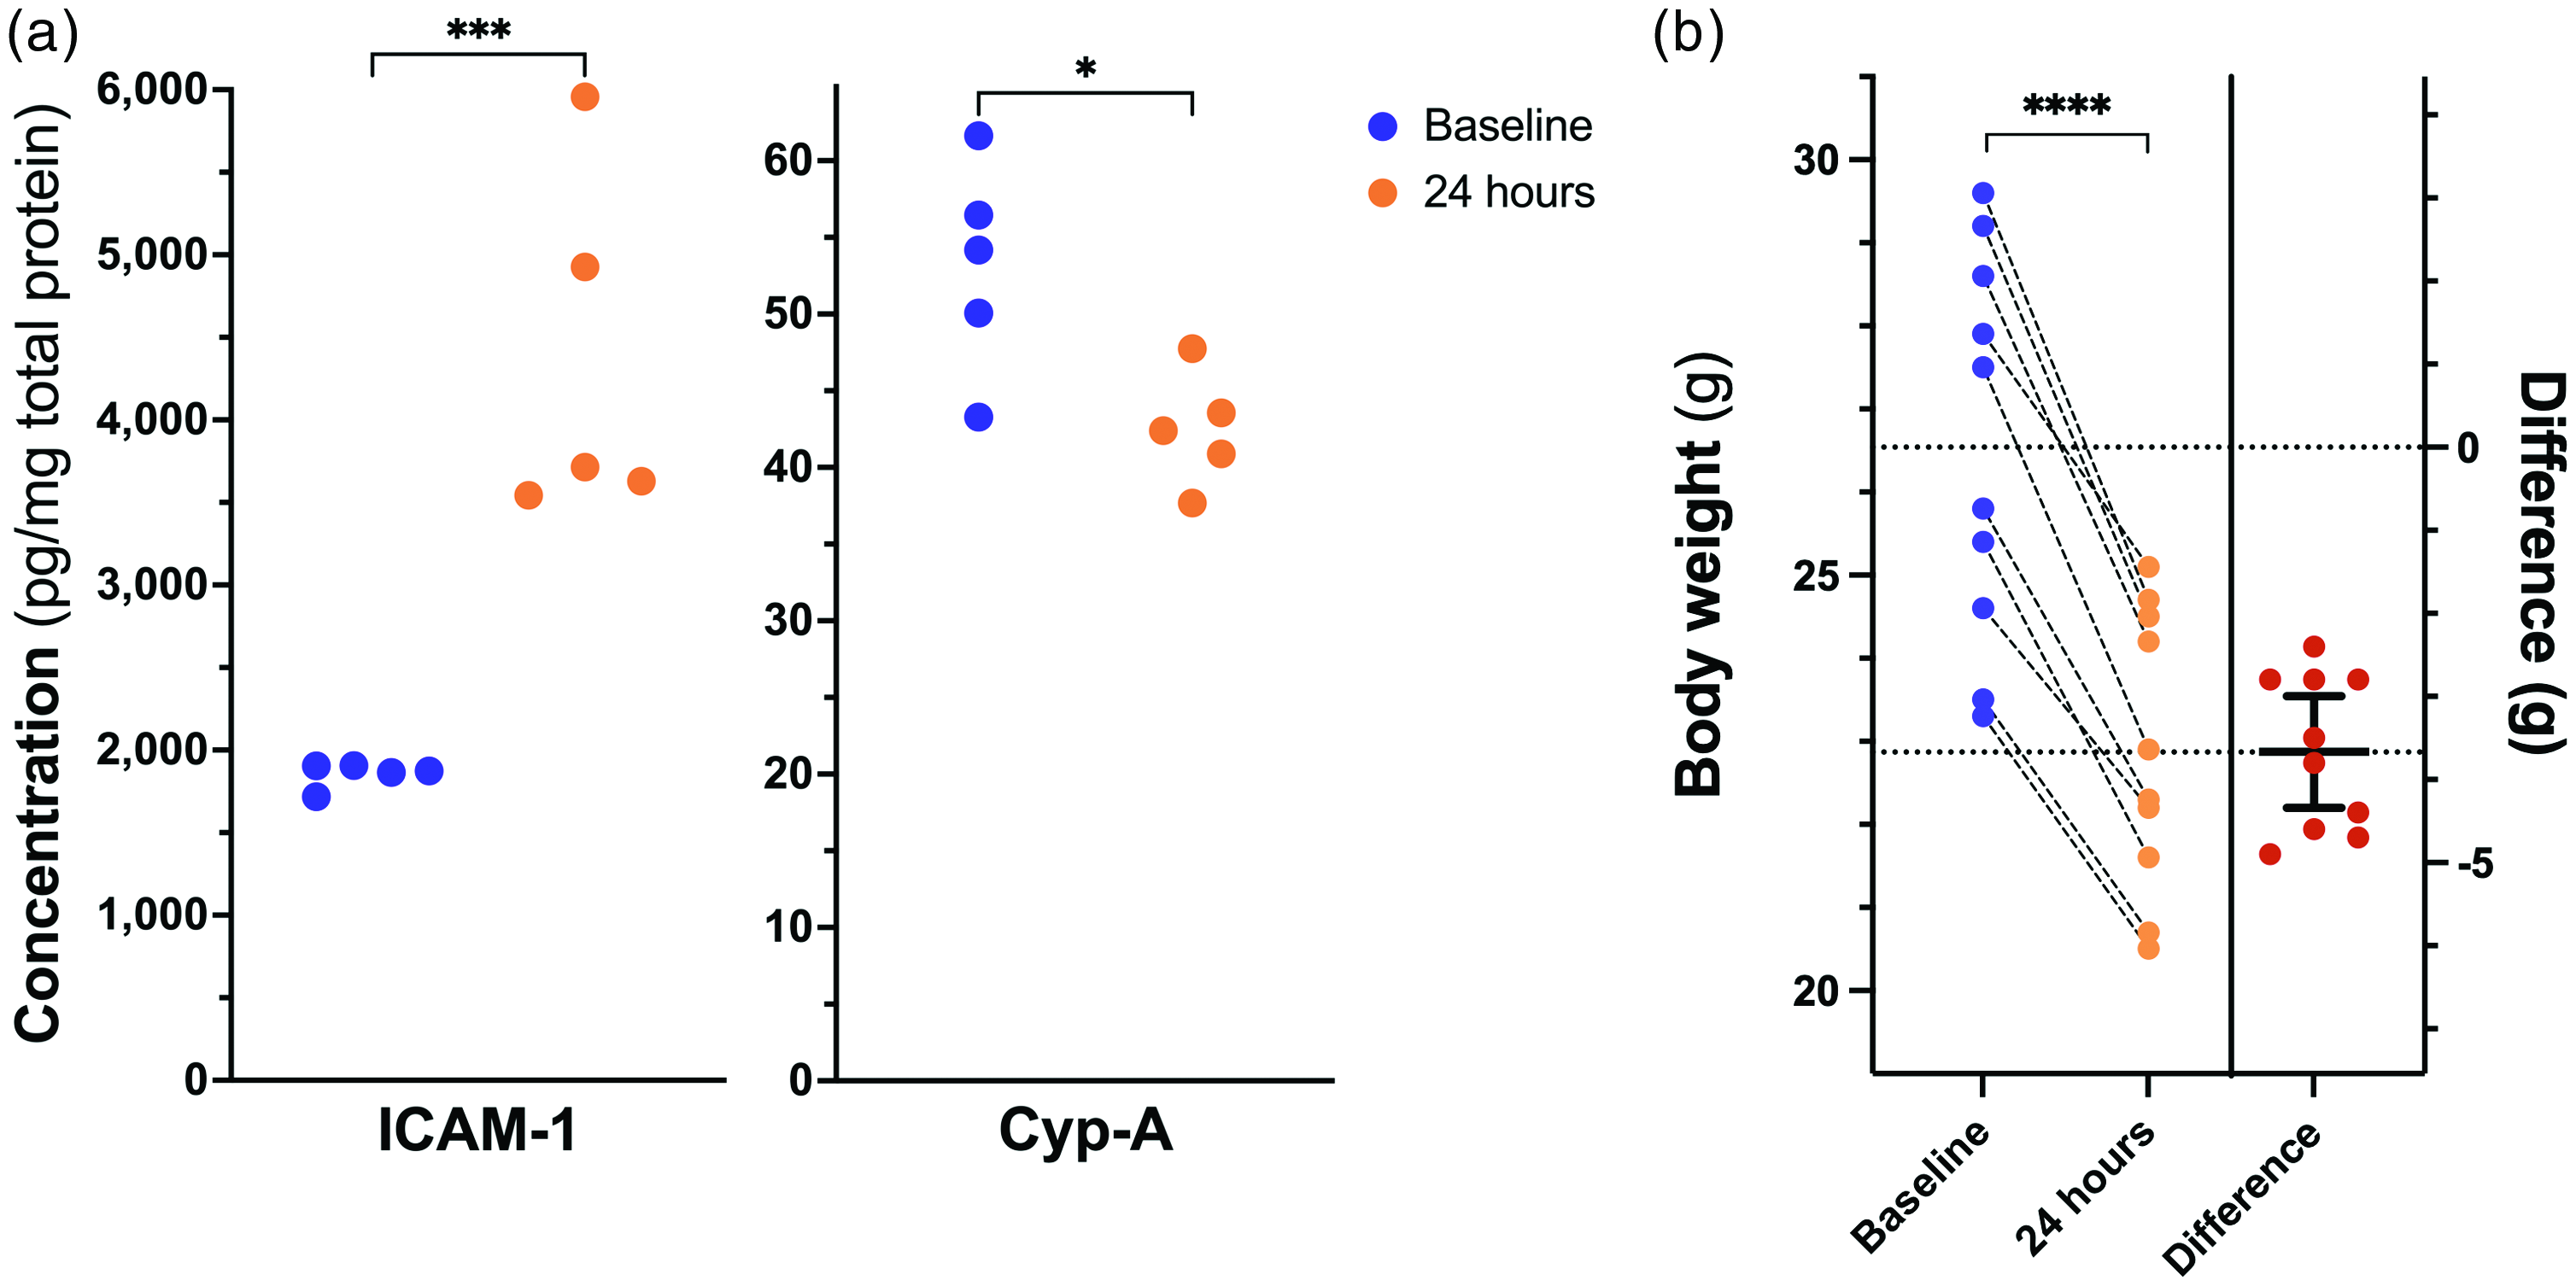
(a) Expression of Intracellular adhesion molecule-1 (ICAM-1) and Cyclophilin-A (Cyp-A) in cortical tissue samples from the control mice at baseline (n = 5) and 24 hours (n = 5) after LPS administration and (b) Body weight measured in all imaged mice (n = 10) at baseline and 24 hours after LPS injection. The paired differences are shown in red. The lower dotted line is the mean difference (24 h minus baseline), and horizontal hatch marks indicate the 95% confidence interval. Statistical comparisons are based on unpaired (a) and paired (b), two-tailed t tests; *p<.05, ***p<.001, ****p<.0001.
Body weight loss
Figure 5(b) shows the development of body weight from baseline to the 24 h timepoint for all imaged mice. All imaged mice lost weight following the LPS injection (paired two-tailed t test: t = 14.44, df = 13, p < 0.0001), in a manner similar to that observed in the initial control experiment (Supplementary figure 2).
Discussion
In the present study, we examined the effect of a severe LPS-induced systemic inflammation on the mouse cerebral vasculature. We monitored sickness and weight changes and measured inflammatory markers following an intraperitoneal injection of LPS. In a separate group of animals, we used OISI and OCT-angiography to examine longitudinal changes in functional hyperaemia and capillary stalls induced by inflammation. We found that the severe LPS-induced inflammation caused an acute increase in the expression of pro- and anti-inflammatory cytokines and a significant alteration of the functional hyperaemic response to whisker stimulation. Concurrently, the number and duration of capillary stalled flow events increased, supporting the conclusion that severe systemic inflammation has profound ramifications on cerebral blood circulation and tissue health.
LPS administration increased the expression of cytokines
LPS injection caused an acute increase in cytokine levels in both cortical brain tissue and blood serum 6 hours after injection. This increase was followed by a subsequent decline, resulting in cytokine levels close to baseline levels after 24 hours. These findings are consistent with previously published observations from both in vivo4,35–37 and ex vivo 38 studies. They are also consistent with the known endothelial activation process during the acute-phase response to inflammation. In particular, our results fit with the description of type II endothelial activation mediated by TNF and IL-1β. 39 These two molecules bind to receptors on the endothelial cells and trigger intracellular mechanisms that induce the expression of adhesion molecules, 40 and the production of the potent vasodilators nitric oxide 41 and prostaglandins. 42 In summary, we find compelling evidence to support the claim that LPS administration induces a severe systemic inflammatory response, specifically including endothelial activation. The results thus support our claim that LPS-injection mimics a severe, but not fatal, systemic inflammation that is observable in the cerebral cortex. In addition, saline-injected mice in a pilot study exhibited neither weight loss nor signs of sickness, in stark contrast to the LPS group.
Systemic inflammation decreased and delayed the functional hyperaemic response
Our measurements of the hyperaemic response to whisker stimulation showed a decreased and delayed response of both HbO and HbR after inflammation onset. Consistent with the known vasodilating effect of nitric oxide, synthesised by the vascular endothelial cells in response to upregulated cytokine levels in the blood,43,44 we saw anecdotal indications of vasodilation on the cortical surface in all mice at the 6 and 24 hour timepoints after LPS injection (Supplementary figure 9). It should be noted that even quantitative OISI measurements, as performed here, are relative to a baseline value. Therefore, they cannot inform on absolute volumes of oxygenated and deoxygenated blood. We propose that the observed effects on haemodynamics could at least partly be explained by a resting-state elevation in pial blood volume. LPS-induced vasodilation would limit the dynamic range of the vessels and thus could lead to the observed stunted vascular response to neuronal activation.
Previous studies using fully quantitative methods have been somewhat contradictory when it comes to the effects of LPS on perfusion. While some found that resting CBF increased and functional haemodynamic responses decreased as a result of LPS,37,45,46 others found no changes to the resting CBF and an increased haemodynamic response as a result of LPS. 47 It should be noted that these studies were carried out in animals anesthetised with different compounds, confounding comparisons between them, and with the present study. Future studies using fully quantitative methods in awake animals along with quantitative measures of vascular dilation must be designed to address this proposal.
Systemic inflammation disturbed capillary flow
Our data exhibited significant increases in capillary stall numbers and durations, with a continued progression throughout the experiment. Inspired by previous studies,13,21,48–50 we suspect leukocyte plugging to be the primary cause of these observations. The LPS-induced cytokine release may include the synthesis of the chemoattractant CXCL1 by activated endothelial cells.30,37,51 Next, the upregulation of IL-1β and TNF, as well as the adhesion molecule ICAM-1, may enable the endothelial cells to bind recruited leukocytes, and to thereby block the flow in the capillary segment.10,11,31,32 Thus, the finding of increased ICAM-1 expression lends further support to the leukocyte adhesion hypothesis. Our decision to measure Cyp-A expression was motivated by evidence pointing to its role in blood-brain barrier damage caused by activation of pro-inflammatory pathways. 34 However, Cyp-A also induces cytokine expression, and its inhibition reduces pro-inflammatory cytokines. 52 The observed decrease in Cyp-A expression could thus be correlated with the observed reduction of the pro-inflammatory cytokines. 33 Cytokine measurements showed that the early spike in CXCL1 levels had dropped to near-baseline levels 24 h after the LPS injection. We hypothesise that this is a demonstration of the delayed effects of the acute cytokine response. We suspect that, had the study continued, the observed number of blocked capillaries would have returned to baseline conditions within a few days.
It would be interesting to extend the present study by prolonging the experiment to investigate the healing process after a severe systemic inflammation. We believe that the observed acute inflammatory effects on cerebral perfusion would subside within a matter of weeks in otherwise healthy subjects. In a state of chronic systemic inflammation, however, the vasculature would not get a chance to recover. Although the sensitivity of the parenchyma to intermittent stalled blood flow events in cerebral microcirculation remains unknown, we hypothesise that the compounded effects of capillary stalling would limit the oxygen availability to brain tissue. Capillary stalling may have a local and transient impact on the parenchyma supplied by the blocked capillary by inducing changes in the resistance of the microvasculature and affecting the flow in nearby capillaries. 53 Oxygen availability is highly dependent on the capillary flow distribution and transit times, above and beyond the bulk blood flow rate per se. 54 Therefore, we believe that the rise in number of capillary stalling events will disturb capillary flow patterns, hindering oxygen availability to the brain tissue in a potentially pathological manner.15,16 Techniques for examining capillary transit times are possible with other optical methods,55,56 which could be applied to address our hypothesis.
Phenotypical considerations of the LPS model
When working with awake mice, minimising stress is imperative for successful experiments. We thus opted not to perform core temperature measurements or to attempt to quantify behavioural measures of sickness on the imaged mice. We did, however, observe a severe, progressive weight loss throughout the duration of the experiment in all mice. We believe that the rapid change in weight is primarily due to a stop in water intake,29,57,58 which is consistent with the fact that a similar weight loss is observed in studies in which mice have a restricted access to water in order to motivate behavioural training. 59 Dehydration may have influenced the water content of the blood and, therefore, been a contributor to the changes in the flow dynamics of the cerebral vasculature observed here during acute inflammation. Future studies of vascular flow dynamics should either include a measure of blood water content, or a control group that is given continuous saline injections to account for the stop in water intake. Eliminating the potential confound introduced by blood viscosity variation will further elucidate the specific mechanisms by which upregulated cytokine levels affect vascular dynamics during LPS-induced inflammation.
Lack of a saline-injected control group
In accordance with the ARRIVE guidelines and the principles of the 3Rs, 60 we refined the experimental design to minimize the number of mice that were subjected to extensive surgical and behavioural interventions. Since the objective of the present study was to investigate the differential effects of LPS in a longitudinal setting, and since saline-injected mice in a pilot study exhibited neither weight loss nor signs of sickness, we deemed a parallel saline-injected experimental group redundant. The potential effects of cranial window implantation cannot be entirely neglected. However, such effects would be present in all our measurement time points, and do not affect the differential results presented.
There remains a concern regarding a control for the repeated whisker activation over the course of the three experimental time points examined in the haemodynamic experiment. We did, in fact, consider the matter carefully before commencing the present multi-modal intervention study. The results of a preliminary method-validating experiment, in which we investigated the longitudinal effects of training and acclimatisation on the functional hyperaemic response, are presented as supplementary information. The data support the notion that the haemodynamic responses in mice trained according to our regime remain stable and reproducible even several weeks after end of training. We thus tentatively ascribe the variation presented here mainly to the physiological effects of LPS administration, rather than to stimulus familiarity. It is worth noting that even with a control group, passive stimulation paradigms in awake subjects, human or non-human, cannot conclusively rule out variations in, e.g., arousal. Collecting behavioural responses or surrogate signals such as gaze positions in active paradigms could be ways to address this issue, which further underlines the importance of investing time and energy on excellent animal husbandry.
Concluding remarks
We found that a severe systemic inflammation induced by LPS caused disruptions to the dynamics of cerebral blood flow in young male mice. The hyperaemic response to functional activation was diminished and delayed, and the incidence of capillary stalls was increased. These changes suggest that severe systemic inflammation induces disturbances in the capillary flow patterns that might hinder oxygen availability to the brain tissue. The methodologies presented here are suitable for investigating the integrity of cerebral microvascular flow dynamics in, e.g., genetically modified animal models. The role of inflammation-induced microcirculatory dysfunction in the progression of various neurodegenerative diseases may thus be investigated.
Supplemental Material
sj-pdf-1-jcb-10.1177_0271678X221112278 - Supplemental material for Disturbed microcirculation and hyperaemic response in a murine model of systemic inflammation
Supplemental material, sj-pdf-1-jcb-10.1177_0271678X221112278 for Disturbed microcirculation and hyperaemic response in a murine model of systemic inflammation by Signe Kirk Fruekilde, Christopher J Bailey, Kate Lykke Lambertsen, Bettina Hjelm Clausen, Jasper Carlsen, Ning-long Xu, Kim Ryun Drasbek and Eugenio Gutiérrez-Jiménez in Journal of Cerebral Blood Flow & Metabolism
Footnotes
Funding
The author(s) disclosed receipt of the following financial support for the research, authorship, and/or publication of this article: This work was partly supported by a grant from the Alzheimer’s Association (AARF-18-564411) and the VELUX Foundation (ARCADIA II Grant 0026167). The authors received no other financial support for the research, authorship, and/or publication of this article.
Declaration of conflicting interests
The author(s) declared no potential conflicts of interest with respect to the research, authorship, and/or publication of this article.
Authors’ contributions
SKF, EGJ and KRD contributed to the experimental concept and design; SKF performed all animal experiments; KLL and BHC performed electrochemiluminescence measurements; JC performed ELISA measurements; SKF, EGJ, CJB and NLX took part in the data analysis and prepared the figures; all authors were involved in the interpretation of results; all authors edited and approved the final version of the manuscript.
Acknowledgements
The authors thank Birgitte Hviid Mumm for preparing the frozen serum and tissue samples for protein analysis, and David Boas and Smithri Sunil for their support in setting up the OISI system used in the experiments.
Supplemental material
Supplemental material for this article is available online. All data can be provided by the corresponding authors upon reasonable request.
References
Supplementary Material
Please find the following supplemental material available below.
For Open Access articles published under a Creative Commons License, all supplemental material carries the same license as the article it is associated with.
For non-Open Access articles published, all supplemental material carries a non-exclusive license, and permission requests for re-use of supplemental material or any part of supplemental material shall be sent directly to the copyright owner as specified in the copyright notice associated with the article.