
Abstract
Chemical-exchange spin-lock (CESL) MRI can map regional uptake and utilisation of glucose in the brain at high spatial resolution (i.e sub 0.2 mm3 voxels). We propose two quantitative kinetic models to describe glucose-induced changes in tissue R1ρ and apply them to glucoCESL MRI data acquired in tumour-bearing and healthy rats. When assuming glucose transport is saturable, the maximal transport capacity (Tmax) measured in normal tissue was 3.2 ± 0.6 µmol/min/mL, the half saturation constant (Kt) was 8.8 ± 2.2 mM, the metabolic rate of glucose consumption (MRglc) was 0.21 ± 0.13 µmol/min/mL, and the cerebral blood volume (vb) was 0.006 ± 0.005 mL/mL. Values in tumour were: Tmax = 7.1 ± 2.7 µmol/min/mL, Kt = 14 ± 1.7 mM, MRglc = 0.22 ± 0.09 µmol/min/mL, vb = 0.030 ± 0.035 mL/mL. Tmax and Kt were significantly higher in tumour tissue than normal tissue (p = 0.006 and p = 0.011, respectively). When assuming glucose uptake also occurs via free diffusion, the free diffusion rate (kd) was 0.061 ± 0.017 mL/min/mL in normal tissue and 0.12 ± 0.042 mL/min/mL in tumour. These parameter estimates agree well with literature values obtained using other approaches (e.g. NMR spectroscopy).
Cerebral glucose metabolism is altered in a range of neurological diseases including brain tumours, 1 Alzheimer's disease, 2 Parkinson's disease,3,4 and multiple sclerosis.5,6 The metabolic rate of glucose consumption (MRglc) is dependent on the rate of glucose transport across the blood-brain barrier (BBB) and downstream utilisation by neurons and astrocytes. When the BBB is intact, glucose enters the brain via the GLUT1 glucose transporter located on endothelial cell membranes, and moves into cells primarily via GLUT1 on astrocyte cell membranes and GLUT3 on neuronal cell membranes. 7 Movement of glucose through glucose transporters can be approximated by Michaelis-Menten kinetics, with the rate being saturable and dependent on the half saturation constant (also called the binding constant), Kt, and the maximum transport capacity, Tmax. 8 Different glucose transporters have different Kt values, and thus in-vivo measurement of Kt may provide insight into their relative distribution on cellular membranes and alterations to this distribution caused by disease. The maximum transport capacity depends on the availability of transporters (i.e. their density), and similarly in-vivo measurements of Tmax could provide important information regarding the effects of ageing or pathology on glucose delivery to the brain.
In some solid tumours, glucose transporter expression is increased, 9 which has been shown to correlate with tumour hypoxia, a property associated with treatment resistance and tumour agressiveness.10,11 Due to aberrant vessel formation during neo-angiogenesis, BBB integrity may also be compromised, leading to increased free diffusion of glucose across the blood-tumour interface. In neurodegenerative diseases such as Alzheimer's disease, glucose transporter expression is reduced7,12 which may starve the brain of glucose, 13 and contribute towards neurodegeneration. 14 In many diseases, alterations to glucose transport and/or metabolism are regionally specific, and thus being able to detect glucose transport and utilisation at high spatial resolution across multiple brain regions, would greatly progress our ability to study deficiencies in glucose transport and metabolic dysfunction.
2-deoxy-2-[18F]fluoro-D-glucose positron emission tomography (FDG-PET) is the gold-standard technique for imaging glucose transport and metabolism in-vivo, and has led to improved understanding of metabolic dysfunction across a range of brain diseases.15,16 Typically, trace amounts of FDG are injected and late static tissue PET measurements made. For full kinetic modelling, and in order to derive rates of cerebral glucose transport and utilisation, FDG kinetics in arterial blood and tissue are needed from arterial blood sampling and dynamic PET scanner measurements.17,18 FDG differs in its transport and phosphorylation properties relative to glucose and the estimated rate constants derived using FDG must be converted to glucose rate constants using an experimentally derived lumped constant.19,20 Several attempts have been made to measure the lumped constant for FDG, with values ranging from 0.71–0.8921,22 in rat and 0.68–0.8920,23–25 in human, presenting a significant potential source of bias. Quantification of glucose metabolic rates in brain tumours using FDG is further complicated by the unknown redistribution of glucose transporters.
Detection of glucose in-vivo in the brain is possible using magnetic resonance spectroscopy (MRS), as first reported by Frahm et al. in 1991.3,26 1H MRS has been used to measure uptake and utilisation of glucose following hyperglycaemic challenge, measuring changes in the glucose signals at 3.44 and 5.23 ppm.27–29 However, quantification is difficult due to spectral overlap with more concentrated metabolites such as myo-inositol, creatine/phosphocreatine and amino acids. Significant effort has been invested in developing methods to improve the specificity to glucose, and downstream metabolites using 13 C-labelling,27,30–36 and more recently, 2H-labelled glucose.37–39 In both cases, the label passes down the glycolytic pathway, and can be detected in glucose itself and downstream metabolites such as lactate and glutamate. A key advantage of these approaches is reduced spectral overlap, because unlabelled endogenous molecules do not contribute to the spectra. However, these methods are still limited by low sensitivity, meaning large voxel volumes are required to provide adequate signal to noise for precise quantification. Usually, specialised coils 36 are required for 13 C and 2 H approaches, limiting translation, though there are approaches to detect the presence of 13 C-labelled metabolites in 2 HMRS that do not require either a 13 C-channel or 13 C –tuned RF coil. 40 Nevertheless, this latter approach lacks the sensitivity to detect glucose itself, being limited to detection of the higher concentration downstream metabolite, glutamate.
More recently, chemical exchange saturation transfer (CEST) and chemical-exchange spin lock (CESL) MRI have been used to indirectly detect glucose via chemical exchange of protons in the hydroxyl groups (−OH) of glucose with protons in water. These approaches are derived from techniques that image exchangeable protons in macromolecules41,42 and more recently have been used to spatially map glucose uptake in living tissues, and appear to overcome the low detection sensitivity limitations of spectroscopic approaches. CEST was first applied to map uptake of intravenously administered glucose in tumours by Chan et al. 43 then Walker-Samuel et al.. 44 Since then, CEST and CESL have been applied to detect glucose uptake in rodent and human brain by a number of groups.45–53 Jin et al. 46 and others50,54–56 have performed key studies in normal brain, tumour, and stroke showing that glucoCESL and glucoCEST uptake curves are sensitive to both uptake and metabolism of glucose.50,54 In these studies, the uptake curves of D-glucose and/or glucose-analog 3-O-methyl-D-glucose (3OMG) were monitored using CESL or CEST MRI. D-glucose and 3OMG are taken up by tissues at similar rates, but 3OMG, which is not metabolised, was found to remain at high levels, while the curves for D-glucose decreased to pre-injection levels. Despite these studies showing the clear sensitivity of CESL and CEST to the transport and metabolism of glucose, and the potential for mapping these processes at high spatial resolution, kinetic modelling to determine physiological rate constants has not been applied to this type of data.
In this study, we introduce the theoretical background for quantitative kinetic modelling of glucoCESL MRI data. We evaluate the sensitivity of R1ρ to all kinetic model parameters, evaluate bias introduced due to inaccurate glucose input functions, and apply the models to data acquired in tumour-bearing (9 L glioma) and healthy rats. We evaluate two kinetic models describing purely saturable transport (model 1) and mixed transport with saturable and free diffusion components (model 2). The fit quality of each model is compared using the Akaike information criterion on a voxel wise level. Finally, we evaluate differences in the central tendency and distribution (standard deviation) of estimated transport and metabolic parameters between tumour and normal tissue.
Relaxation model
In the presence of an on-resonant spin-lock pulse, the spin-lock relaxation rate

Following administration of glucose into the bloodstream, the amount of labile proton exchange between hydroxyl groups (−OH) in glucose and water will theoretically increase in proportion with the concentration of glucose, leading to an increase in voxel
Changes in
Assuming the population of labile proton i is much smaller than the population of water protons, the relaxivities ri [(s mM)−1] are theoretically dependent on the spin-lock frequency ω1 (set during the experiment), the resonance frequency gap between molecule i and water, δi [s−1] (fixed), the number of labile protons per molecule n, and the exchange rate between these labile protons and water, k
i
[s−1] (fixed, but known to vary with tissue pH
46
)
The factor 1.11 × 10⁵ is the concentration of protons in pure water in units of mM (assuming a pure water concentration of 55 M) and ensures the relaxivity has units of [(s mM)−1]. For accurate modelling of the relaxivity, the concentration of water protons in the relevant brain structures should be used if known.
In healthy brain tissue, the majority of glucose undergoes glycolysis. In neurons and astrocytes, glucose is phosphorylated by hexokinase into glucose-6-phosphate (G6P), which at rest inhibits hexokinase activity to maintain a constant metabolic rate of glucose consumption, regardless of tissue glucose concentrations.
57
There may therefore be relatively large fluctuations in G6P following intravenous injection of glucose (in percentage terms), but the basal concentration will remain very low relative to glucose
58
(<2–3%), and therefore these changes will have only a minor effect on measured
Taken together, we assume that changes in
Kinetic models
Two kinetic models are proposed to describe changes in tissue glucose concentration (Figure 1). Both models assume the metabolic rate of glucose consumption, MRglc = C1 · k3, is constant, as would be expected at rest. In the brain, glucose is phosphorylated into glucose-6-phosphate primarily by hexokinase I, and then stored intracellularly before being utilised in the glycolytic or pentose-phosphate pathways. 57 Hexokinase exhibits unique regulatory properties, in that its rate of activity is potently inhibited by its product.57,61 Thus, when glucose-6-phosphate is required by the cell, local glucose-6-phosphate levels become depleted, and the rate of glucose phosphorylation increases to restore glucose-6-phosphate levels (increased k3). When glucose-6-phosphate levels are high, hexokinase inhibition increases and glucose s.p phosphorylation is reduced (reduced k3). Thus, when intracellular glucose concentrations are increased (as would occur during an i.v. bolus injection of glucose), the amount of glucose-6-phosphate being produced will momentarily increase, then immediately self-regulate via increased inhibition of hexokinase (reduced k3). 61 This mechanism ensures that, at rest and at equilibrium, the metabolic rate of glucose consumption MRglc remains constant, even in the presence of increased intracellular glucose levels.
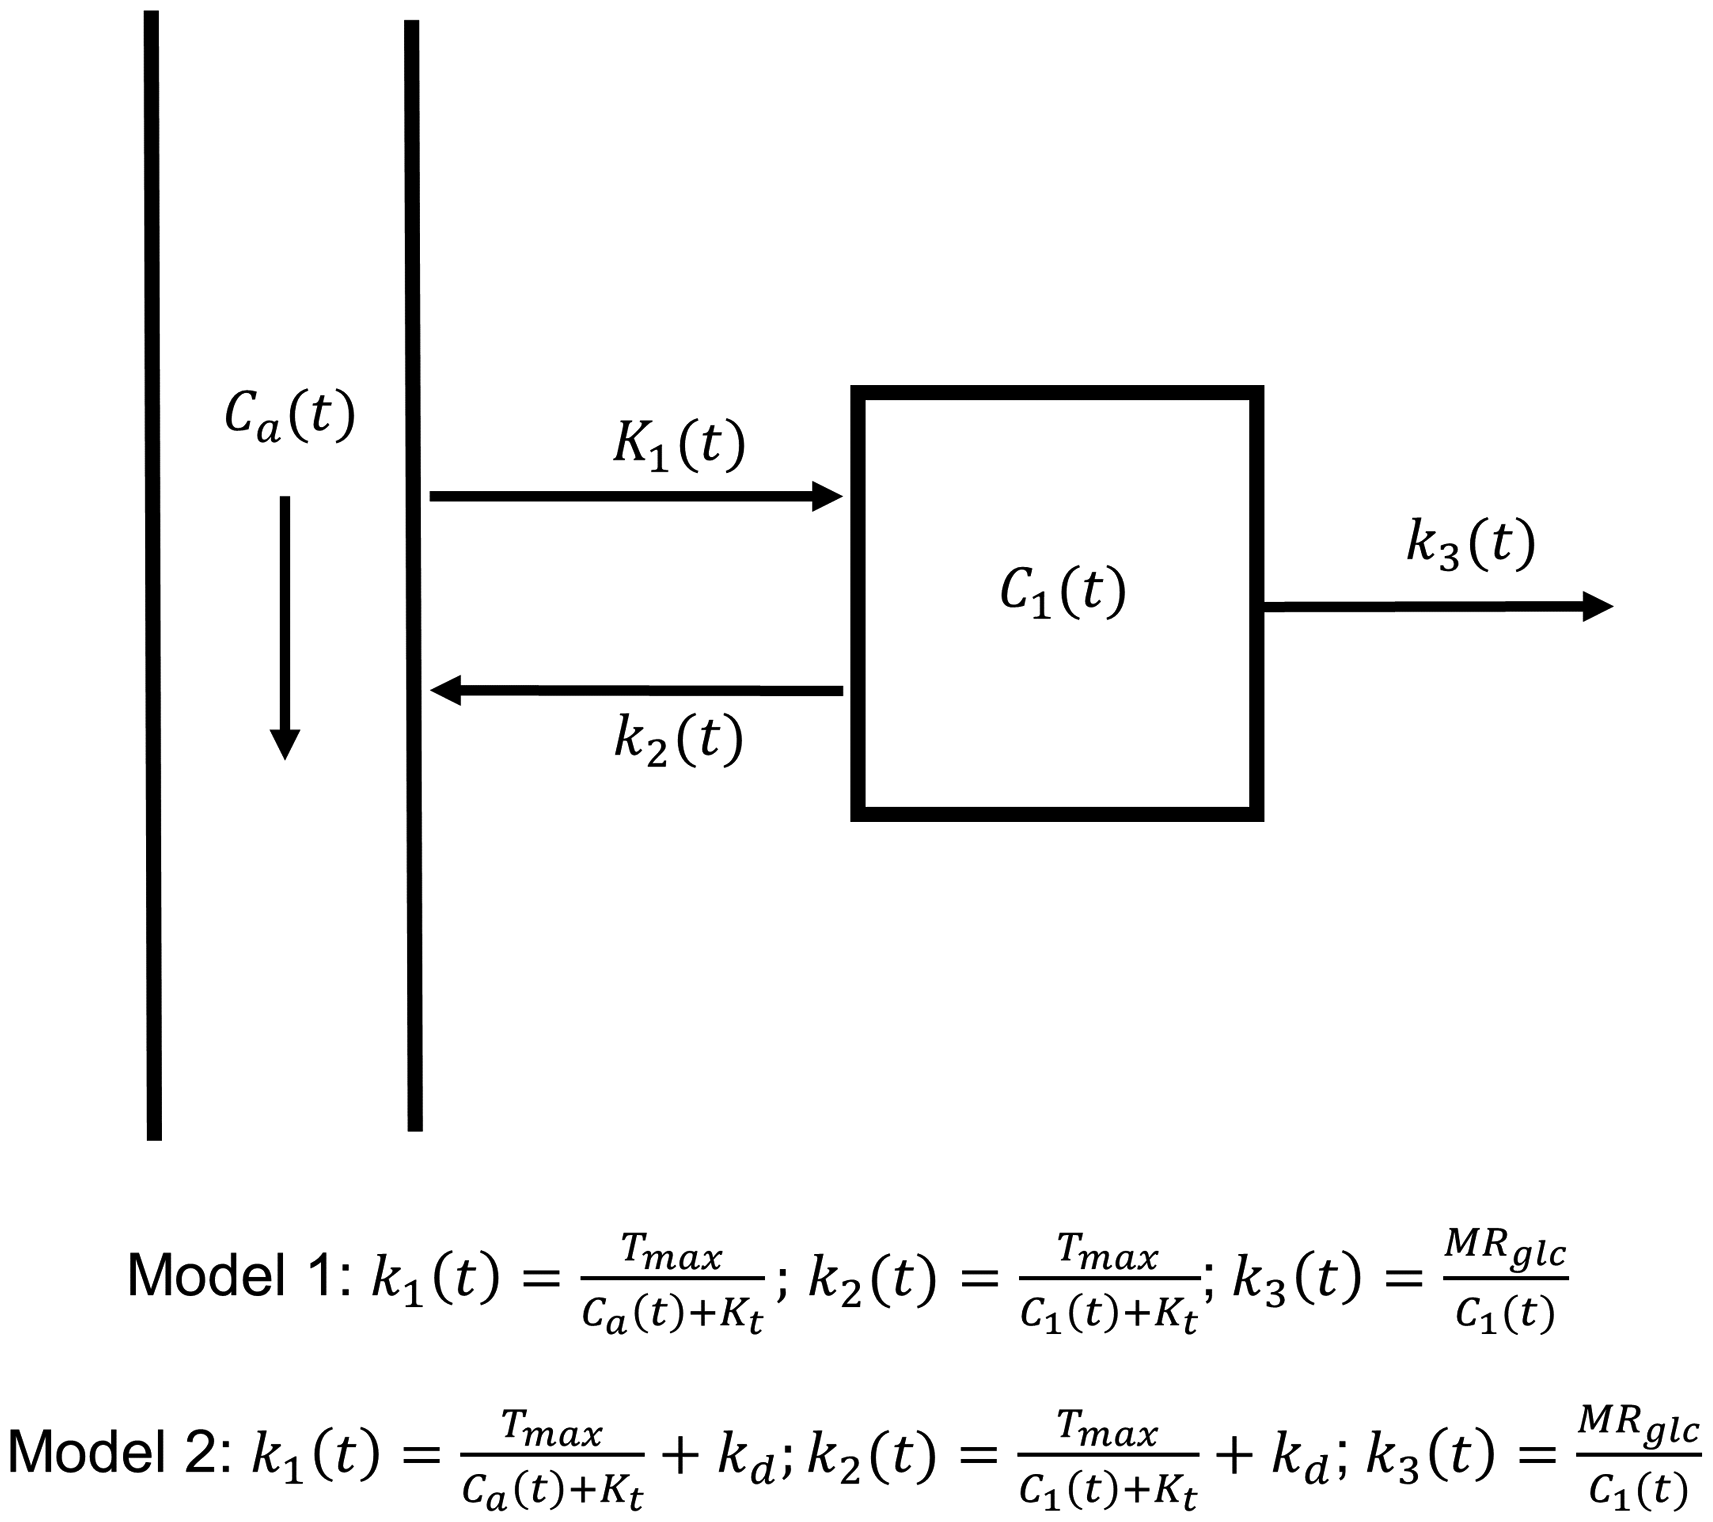
Diagram of the kinetic models. Arterial and tissue glucose have concentrations Ca(t) and C1(t) respectively. The rate of glucose uptake across an intact blood-brain barrier is modelled with Michaelis-Menten kinetics (model 1), where k1 is parameterised by the maximal transport capacity Tmax, half saturation constant Kt, and is dependent on the arterial glucose concentration Ca(t). In addition to transporter mediated uptake, glucose may also freely diffuse across the BBB into tissue with rate constant kd (model 2). We assume that k3(t) decreases in response to an increase in C1(t) to maintain a constant metabolic rate of glucose consumption, MRglc (i.e., MRglc = k3(t)C1(t)).
Model 1 assumes the influx and efflux rates of glucose across the blood-brain barrier (BBB), K1 and k2, are time-dependent and governed by Michaelis-Menten kinetics.
8

Both models are defined diagrammatically in Figure 1. The total glucose concentration in a given brain voxel is modelled as a volume weighted average of blood (capillary) and tissue glucose concentrations:

To calculate the change in voxel glucose concentration following intravenous administration of glucose solution, we subtract the modelled baseline glucose concentration:

Sensitivity analysis
Model sensitivity analysis was performed to determine the relative contribution of each model parameter and the rate of glucose clearance from the blood on
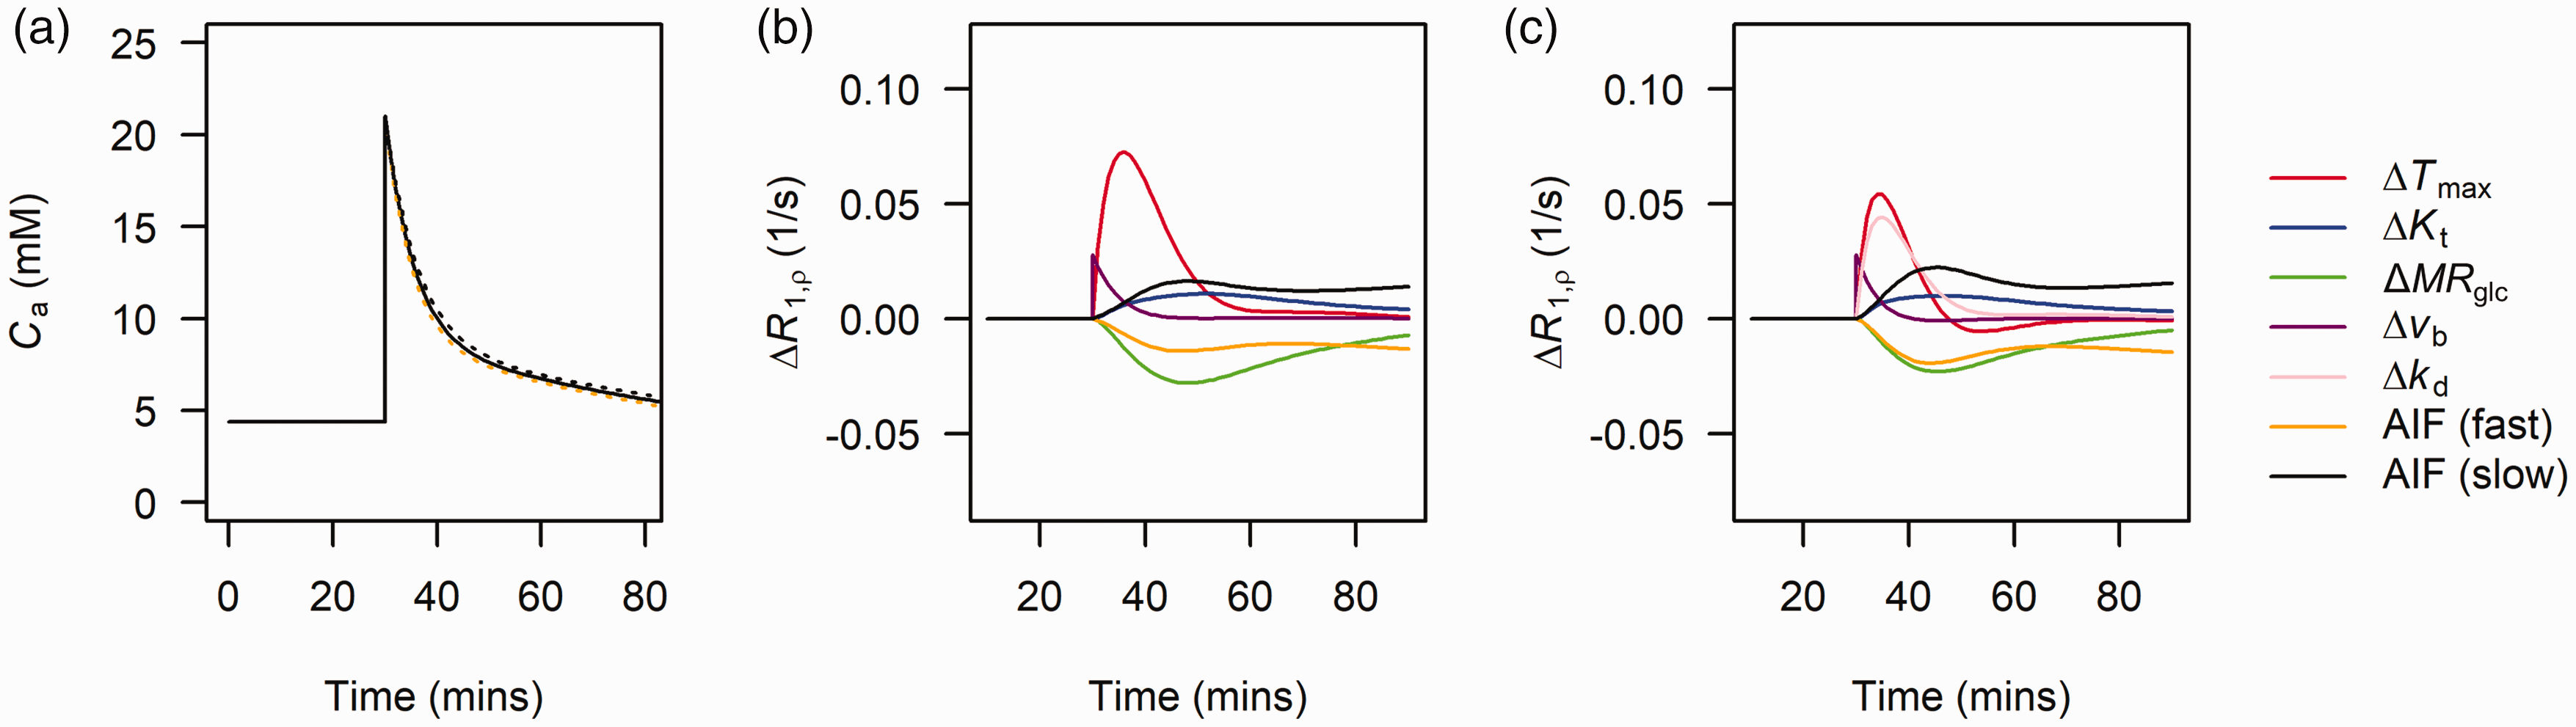
(a) Bi-exponential fit (solid black line) to arterial glucose input functions measured in Sprague-Dawley rats. Dashed yellow and black lines show the effect of simulating a 10% increase and decrease in both λ1 and λ2 of the Sprague-Dawley population-level curve reflecting faster and slower clearance of glucose from blood respectively. (b) sensitivity plots showing the effects of a 50% increase in each model parameter and increased or decreased blood glucose clearance on ΔR1ρ for model 1 and (c) for model 2. While not being varied, parameters were fixed to: Tmax = 3.3 µmol/min/mL, Kt = 8.1 mM, MRglc = 0.3 µmol/min/mL, kd = 0.05 mL/min/mL, vb = 0.05 ml/mL.
Animals
All animal studies were approved by the Institutional Animal Care and Use Committee at the University of Pittsburgh in accordance with the National Institutes of Health guide for the care and use of laboratory animals. All procedures were conducted in accordance ARRIVE (Animals in Research: Reporting In Vivo Experiments) guidelines (www.nc3rs.org.uk/arrive- guidelines). Animal preparation and MRI experiments have been described previously.46,50 Adult male Fischer-344 rats (n = 4, Charles River, Wilmington, MA) weighing between 200-250 g (approx. 12 weeks of age) were anesthetized with 2% isoflurane. A burr hole was drilled into the right hemisphere at stereotaxic coordinates of 0 to 0.5 mm from bregma, and 3 to 3.5 mm from the midline. Inoculation of 100,000 to 300,000 9 L cells (ATCC CRL- 2200, Manassas, VA) in a total volume of 5 µL was performed 4 mm below the surface of the dura. After the induction of tumour cells, rats were imaged 3 to 5 weeks after (approx. age 15–17 weeks), when the tumour reached appropriate volume. Healthy adult male Sprague-Dawley (n = 3, Charles River, Wilmington, MA) rats weighing 335–388 g (approx. 12 weeks of age) were also imaged. An additional n = 3 Fischer-344 rat (254–270 g) were purchased specifically for estimation of a Fischer-344 specific population glucose input function. These animals were not scanned using MRI.
For MRI scans, rats were anesthetized with 2% isoflurane in a mixture of O2 and air gases and the right femoral vein catheterised for delivery of glucose. After catheterisation, isoflurane levels were reduced to 1.5%. The dynamic blood pressure, end-tidal CO2, and rectal temperature were monitored throughout the duration of the scan. The end- tidal CO2 level was kept within 3–4% and the rectal temperature was maintained at 37.5 ± 0.1°C using a feedback-controlled heating pad. MRI data was acquired on a 9.4 T small animal MRI system (Agilent Technologies, Santa Clara, CA, USA) . Radiofrequency transmission was provided by a volume coil (6.4 cm diameter) and received by a surface coil (2.2 cm diameter; coil combination from Nova Medical, MA, USA). Spin-echo EPI CESL images with and without R1ρ-weighting (i.e., spin-lock pulse duration TSL = 0 and 50 ms) were acquired in an interleaved manner using a spin-lock frequency ω1 ∼ 500 Hz. Each set of TSL = 0 ms and TSL = 50 ms images constituted a block, and were used to calculate a single R1ρ image as described below.
MRI data for tumour-bearing and healthy rats were acquired in two separate experiments, and some aspects have been previously reported.46,65 The time difference between these studies meant there were some differences in the scanning and injection protocols. Table 1 shows the MRI acquisition parameters used for acquisition of tumour-bearing and healthy rat data. All experiments were performed in the non-fasted state. For tumour-bearing rats, glucose was dissolved in distilled water to 30% weight by volume concentration. For healthy rats, glucose was dissolved in distilled water to 20% weight by volume concentration. A glucose bolus (1 g/kg) was injected after 20 minutes (tumour bearing) or 30 minutes (healthy) of baseline data over approximately 30–60 seconds, after which R1ρ was measured for 50 minutes. R1ρ time-courses were estimated using the following equation:
Acquisition parameters for glucoCESL experiments in tumour-bearing and healthy rats.
Arterial glucose input functions
Image-based measurement of arterial glucose concentration, Ca(t) (via measurement of ΔR1ρ(t)), was attempted in each rat by choosing a voxel containing only arterial blood, but results were not reliable. Instead, population level arterial input functions were derived via benchtop arterial blood sampling. For the Sprague-Dawley strain, arterial input functions were obtained the day after MRI scanning under identical experimental conditions. This data has been previously reported in Jin et al. 46 For the Fischer-344 rats, glucose input functions were not measured at the time of imaging. Three additional Fischer-344 rats were purchased specifically to measure the arterial glucose concentration timecourse, Ca(t).
For each animal, the right femoral artery was catheterized and blood samples acquired every 10 minutes (Sprague-Dawley) or 5 minutes (Fischer-344) following injection of D-glucose. As with MRI experiments, all blood sampling was performed under non-fasting conditions. The same volume, concentration, and injection rate as used during the imaging studies was used to ensure matched experimental conditions. Three blood glucose readings were acquired prior to the glucose injection and averaged to determine the baseline. Before kinetic model fitting, population input functions were smoothed by fitting a bi-exponential model with amplitude and rate parameters A1, A2, λ1, λ2.
Error analysis
Systematic error introduced into kinetic model parameters due to use of inaccurate arterial glucose input functions was determined by simulating tissue concentration curves with arterial glucose clearance rates of [A1, A2, 0.9λ1 0.9λ2] and [A1, A2, 1.1λ1 1.1λ2] as described above, then fitting back to the simulated curve assuming the original arterial glucose input function (i.e. using [A1, A2, λ1 λ2]). Zero mean gaussian noise with standard deviation, σ, was added to the synthetic curves to give a contrast to noise ratio (ΔCmax/σ) of 30.
Kinetic model fitting
Voxelwise estimates of ΔR1ρ(t) were computed by subtracting the mean pre-injection R1ρ and converting to estimates of ΔC(t) using equation (4) and rg = 0.066 (s mM)−1 derived from Figure 1D of Jin et al. 46 Kinetic models were then fit to ΔC(t) time-courses using the ordinary differential equation solver ode45 and lsqcurvefit function in Matlab (Mathworks, version 5 2017a). A delay parameter was included in the fitting routine to adjust for differences in bolus arrival between the population arterial input function and uptake at tissue. Starting parameters and lower and upper limits for fitted parameters were: Tmax = 2 [0, 30] µmol/min/mL, Kt = 5 [0, 50] mM, MRglc = 0.5 [0, 5] µmol/min/mL, kd = 0.05 [0, 10] mL/min/mL, vb = 0.05 [0, 1].
In tumour-bearing rats, tumour regions of interest (ROIs) and normal tissue ROIs were outlined manually on the TSL = 0 ms image (i.e. the T2-weighted image) in MRIcron (version 1.0.2). Normal tissue ROIs were drawn on the contralateral side, as to best match the shape and extent of the tumour ROI, but avoiding bright CSF signal. In general these ROIs covered cortical and subcortical gray matter. In healthy rats, normal tissue ROIs were drawn on both sides of the brain and summed together into a single region. These ROIs were drawn to best cover the same regions as the contralateral ROIs drawn for tumour-bearing animals. Prior to comparing tumour and normal tissue parameter values, tests for normality were performed using the Shapiro-Wilks test. The null hypothesis of normality was rejected in less than 5% of data groupings, and thus parametric tests were used throughout.
ROI-level analyses
The median value of each kinetic parameter was calculated for normal tissue and tumour ROIs. Normal tissue values in healthy rats were combined with contralateral normal tissue values from tumour-bearing rats, and the difference between tumour (n = 4) and normal tissue (n = 7) evaluated using t-tests for partially overlapping samples. To assess heterogeneity in glucose uptake and metabolism within each ROI, the standard deviation of each parameter within tumour and normal tissue ROIs was calculated 66 and the null hypothesis of no difference tested using t-tests for partially overlapping samples.
The Akaike information criterion (AIC) adjusted for small sample sizes and ΔAIC (ΔAIC = AIC1 – AIC2) were computed on a voxelwise level to compare the fit quality between models, accounting for differences in the number of fit parameters. To test which model was preferred in tumour and normal tissue, t-tests were performed on ΔAIC to test the null hypothesis that ΔAIC = 0. A t-test for partially overlapping samples was also performed to determine if there was a difference in ΔAIC between tumour and normal tissue. Statistical analysis was done in R (version 4.0.2). Data and analysis scripts used in this paper can be obtained by request to the corresponding author.
Measurement of the R1ρ relaxivity of lactate
To assess the potential contribution of lactate to ΔR1ρ we measured the R1ρ relaxivity of lactate in phantom at 9.4T. Lactate phantoms were created with 5 mM, 10 mM, 20 mM and 40 mM of lactate added to 1× phosphate-buffered saline and titrated to pH = 7.0. Phantoms were bundled together and heated to 37°C degree for CESL measurement. The R1ρ of each phantom was measured using the following spin-lock pulse parameters: ω1 = 500 Hz, varied spin-locking durations (TSL) of 0 to 1 s in 100 ms step. Images were acquired with a spin-echo EPI sequence with the following parameters: one 5-cm slice with FOV = 5 cm × 5 cm, matrix size 64 × 64, TR = 15 s, and TE = 20 ms. The relaxivity of lactate was estimated by plotting R1ρ vs lactate concentration and performing linear regression to find the gradient.
Results
Figure 2(a) shows how the Sprague-Dawley arterial glucose concentration varies with λ1 and λ2 set to 0.90 (black dashed) and 1.1 (yellow dashed), simulating slower and faster glucose clearance (for example due to slower and faster insulin responses).
Figure 2(b) and (c) show the results of the ΔR1ρ sensitivity analysis for model 1 (saturable transport) and model 2 (mixed saturable transport and free diffusion) respectively. For both models, increases in Tmax, Kt, vb produced positive ΔR1ρ, whereas MRglc produced negative ΔR1ρ. A slower glucose clearance from blood produced positive ΔR1ρ, and faster glucose clearance from blood produced negative ΔR1ρ. For both models Tmax produced the largest change in ΔR1ρ and Kt the smallest. For model 2, kd produced an effect similar in magnitude to Tmax but with a longer tail. For both models, vb produced a sharp effect during the first 10 minutes post injection, which rapidly decreased with the concentration of glucose in blood. Changes in the rate of glucose clearance from blood were greater than those due to changes in Kt (both models) and MRglc (model 2 only).
Figure 3 shows biases in kinetic model parameters due to use of an inaccurate arterial glucose input function. For model 1 (Figure 3(a)), biases were generally less than 40% for all parameters; biases were smallest for Tmax (median less than ±2.6%), and largest for Kt (−2.8 to +22%), MRglc (−13 to +29%), and vb (−36% to +6%). For model 2 (Figure 3(b)), Tmax (−17 to −9%), Kt (−12 to 11%) and vb (−2.8 to +2.9%) were least affected, and MRglc (−21 to +45%) and kd (+12 to +27%) most affected. Errors in Tmax and kd were approximately equal but in opposite directions, possibly reflecting degeneracy in these parameters for describing changes in ΔR1ρ.
Bias in kinetic parameter estimates due to use of an inaccurate arterial glucose input function for (a) model 1, and (b) model 2 as displayed in Figure 2(a). Data were simulated using Sprague-Dawley input function, then kinetic models refit back to the simulated curves assuming glucose input functions with decreased (0.9λ1) and increased (1.1λ1) glucose clearance rates.
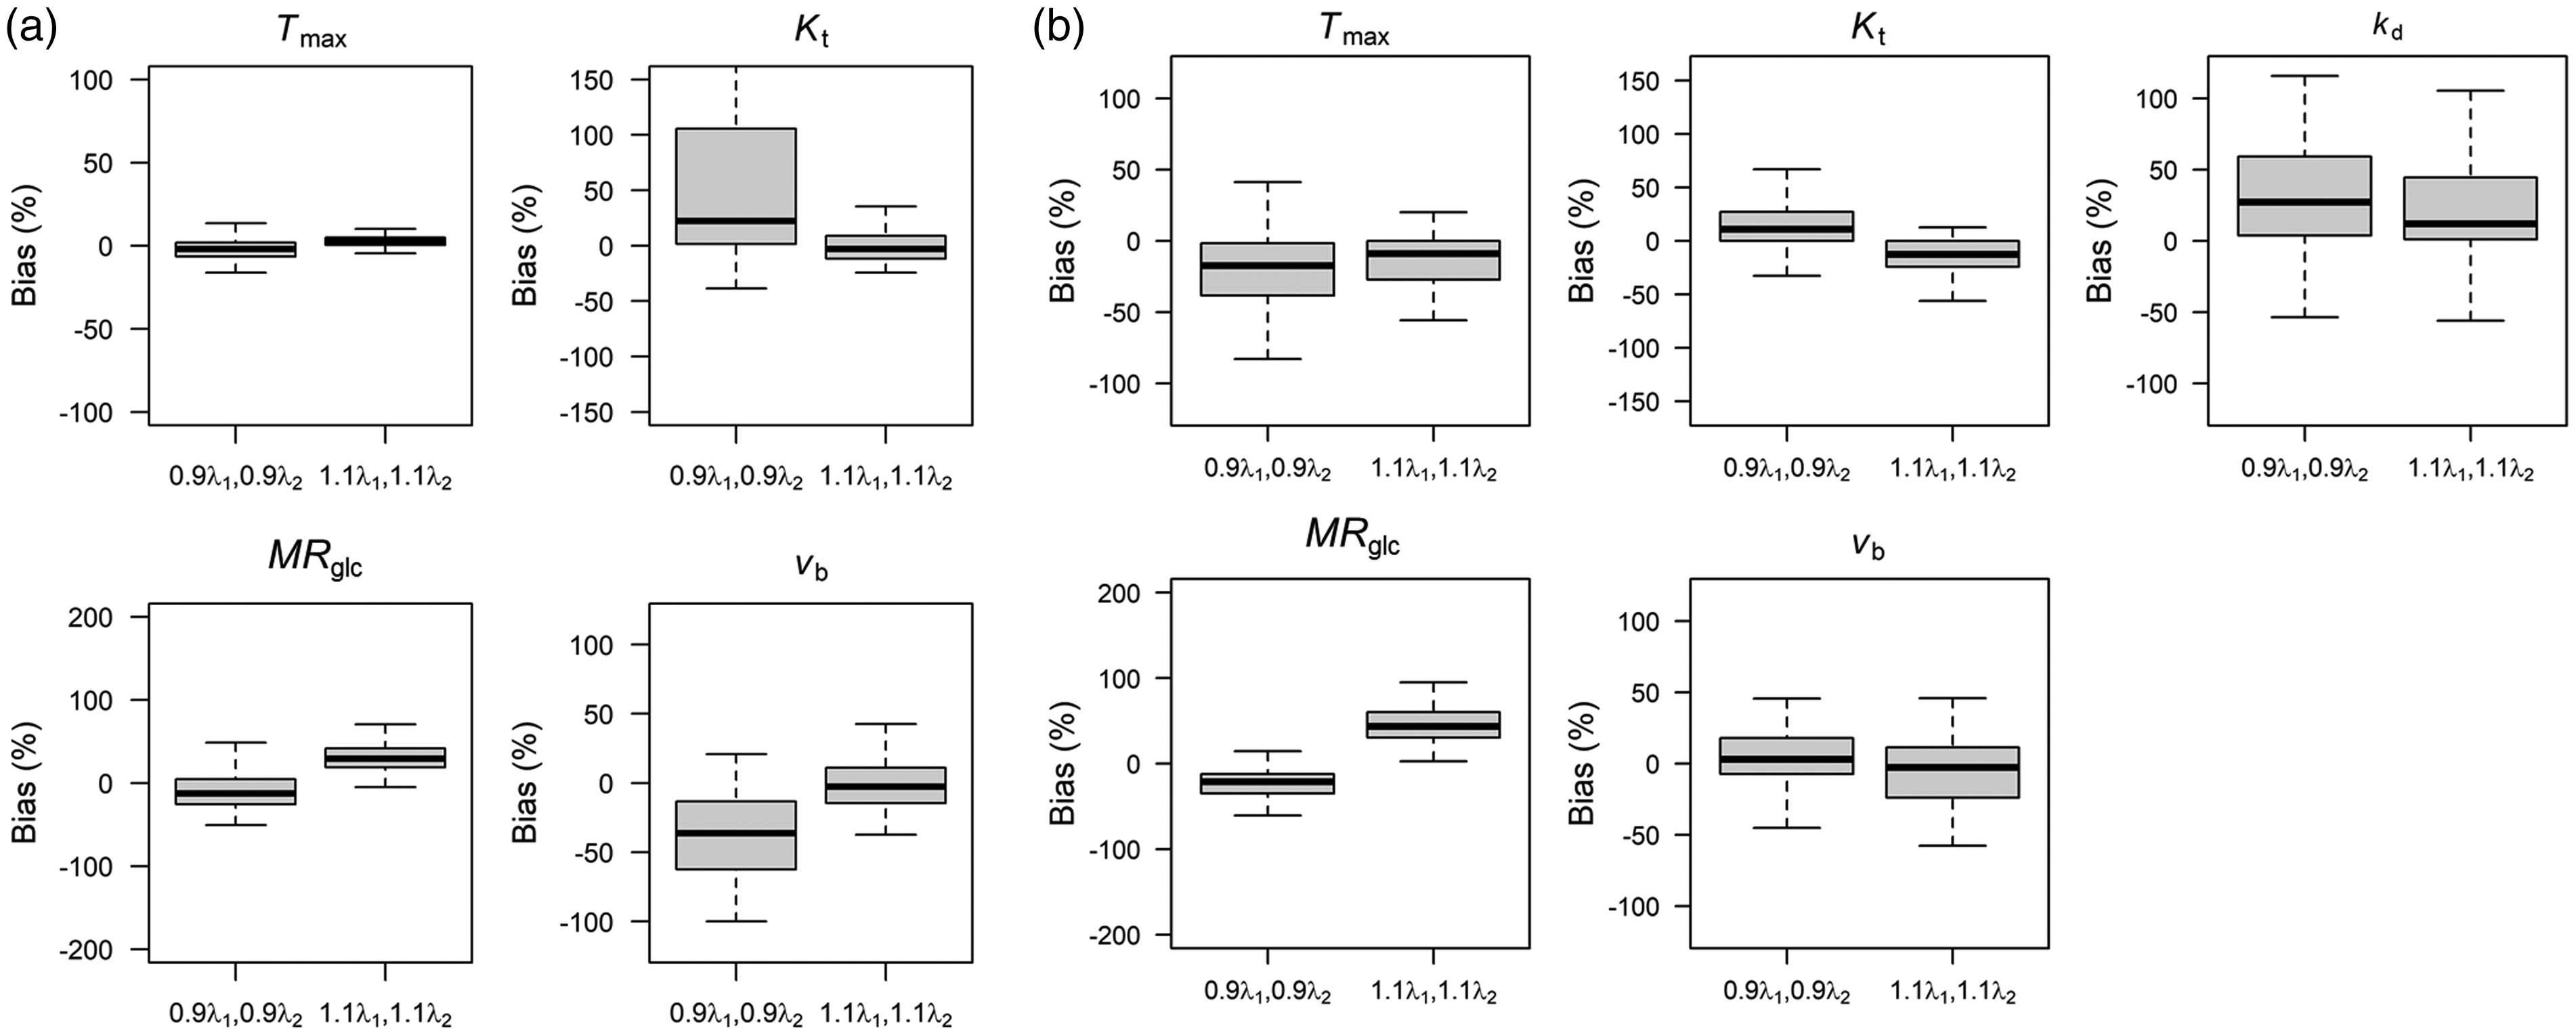
Figure 4 shows an example of tumour and normal tissue region of interests (ROIs), the population-level input functions and corresponding bi-exponential fit for Sprague Dawley and Fischer-344 rats, and example voxelwise and ROI time-courses and model fits. The estimated parameters from the bi-exponential fits were A1 = 12.4 mM, A2 = 8.6 mM, λ1 = 0.18 min−1, λ2 = 0.0086 min−1 for Sprague-Dawley, and A1 =12.5 mM, A2 = 10.4 mM, λ1 = 0.16 min−1, λ2 =0.0094 min−1 for Fischer-344, where A1 and A2 are the exponential amplitudes, and λ1 and λ2 are the decay constants. As expected, ROI-level curves (Figures 4(d) and (f)) had higher signal to noise ratio than voxel-level curves (Figures 4(c) and (e)). In both normal and tumour tissue, model 1 and model 2 provided adequate fit at all timepoints in both voxel and ROI level data. In tumour tissue, model 2 was able to occasionally provide a more accurate description of the peak of the curve (Figure 4E).
(a) An example CESL image acquired with TSL = 0. These images are T2-weighted and provide excellent contrast for definition of tumour (yellow) and contralateral normal tissue (green) ROIs which were drawn manually in MRIcron. (b) Population glucose input functions for the Sprague-Daley and Fisher-344 rats. The curve shapes are similar, but the Fischer-344 curve is ∼1 mM higher. Example voxelwise data and kinetic model fits in normal tissue (c) and tumour (e). Example ROI averaged data and fits in the normal tissue (d) and tumour (f). Both models provide a good fit to normal tissue and tumour data. Model 2 appears to provide a better fit to tumour data at a ROI level.
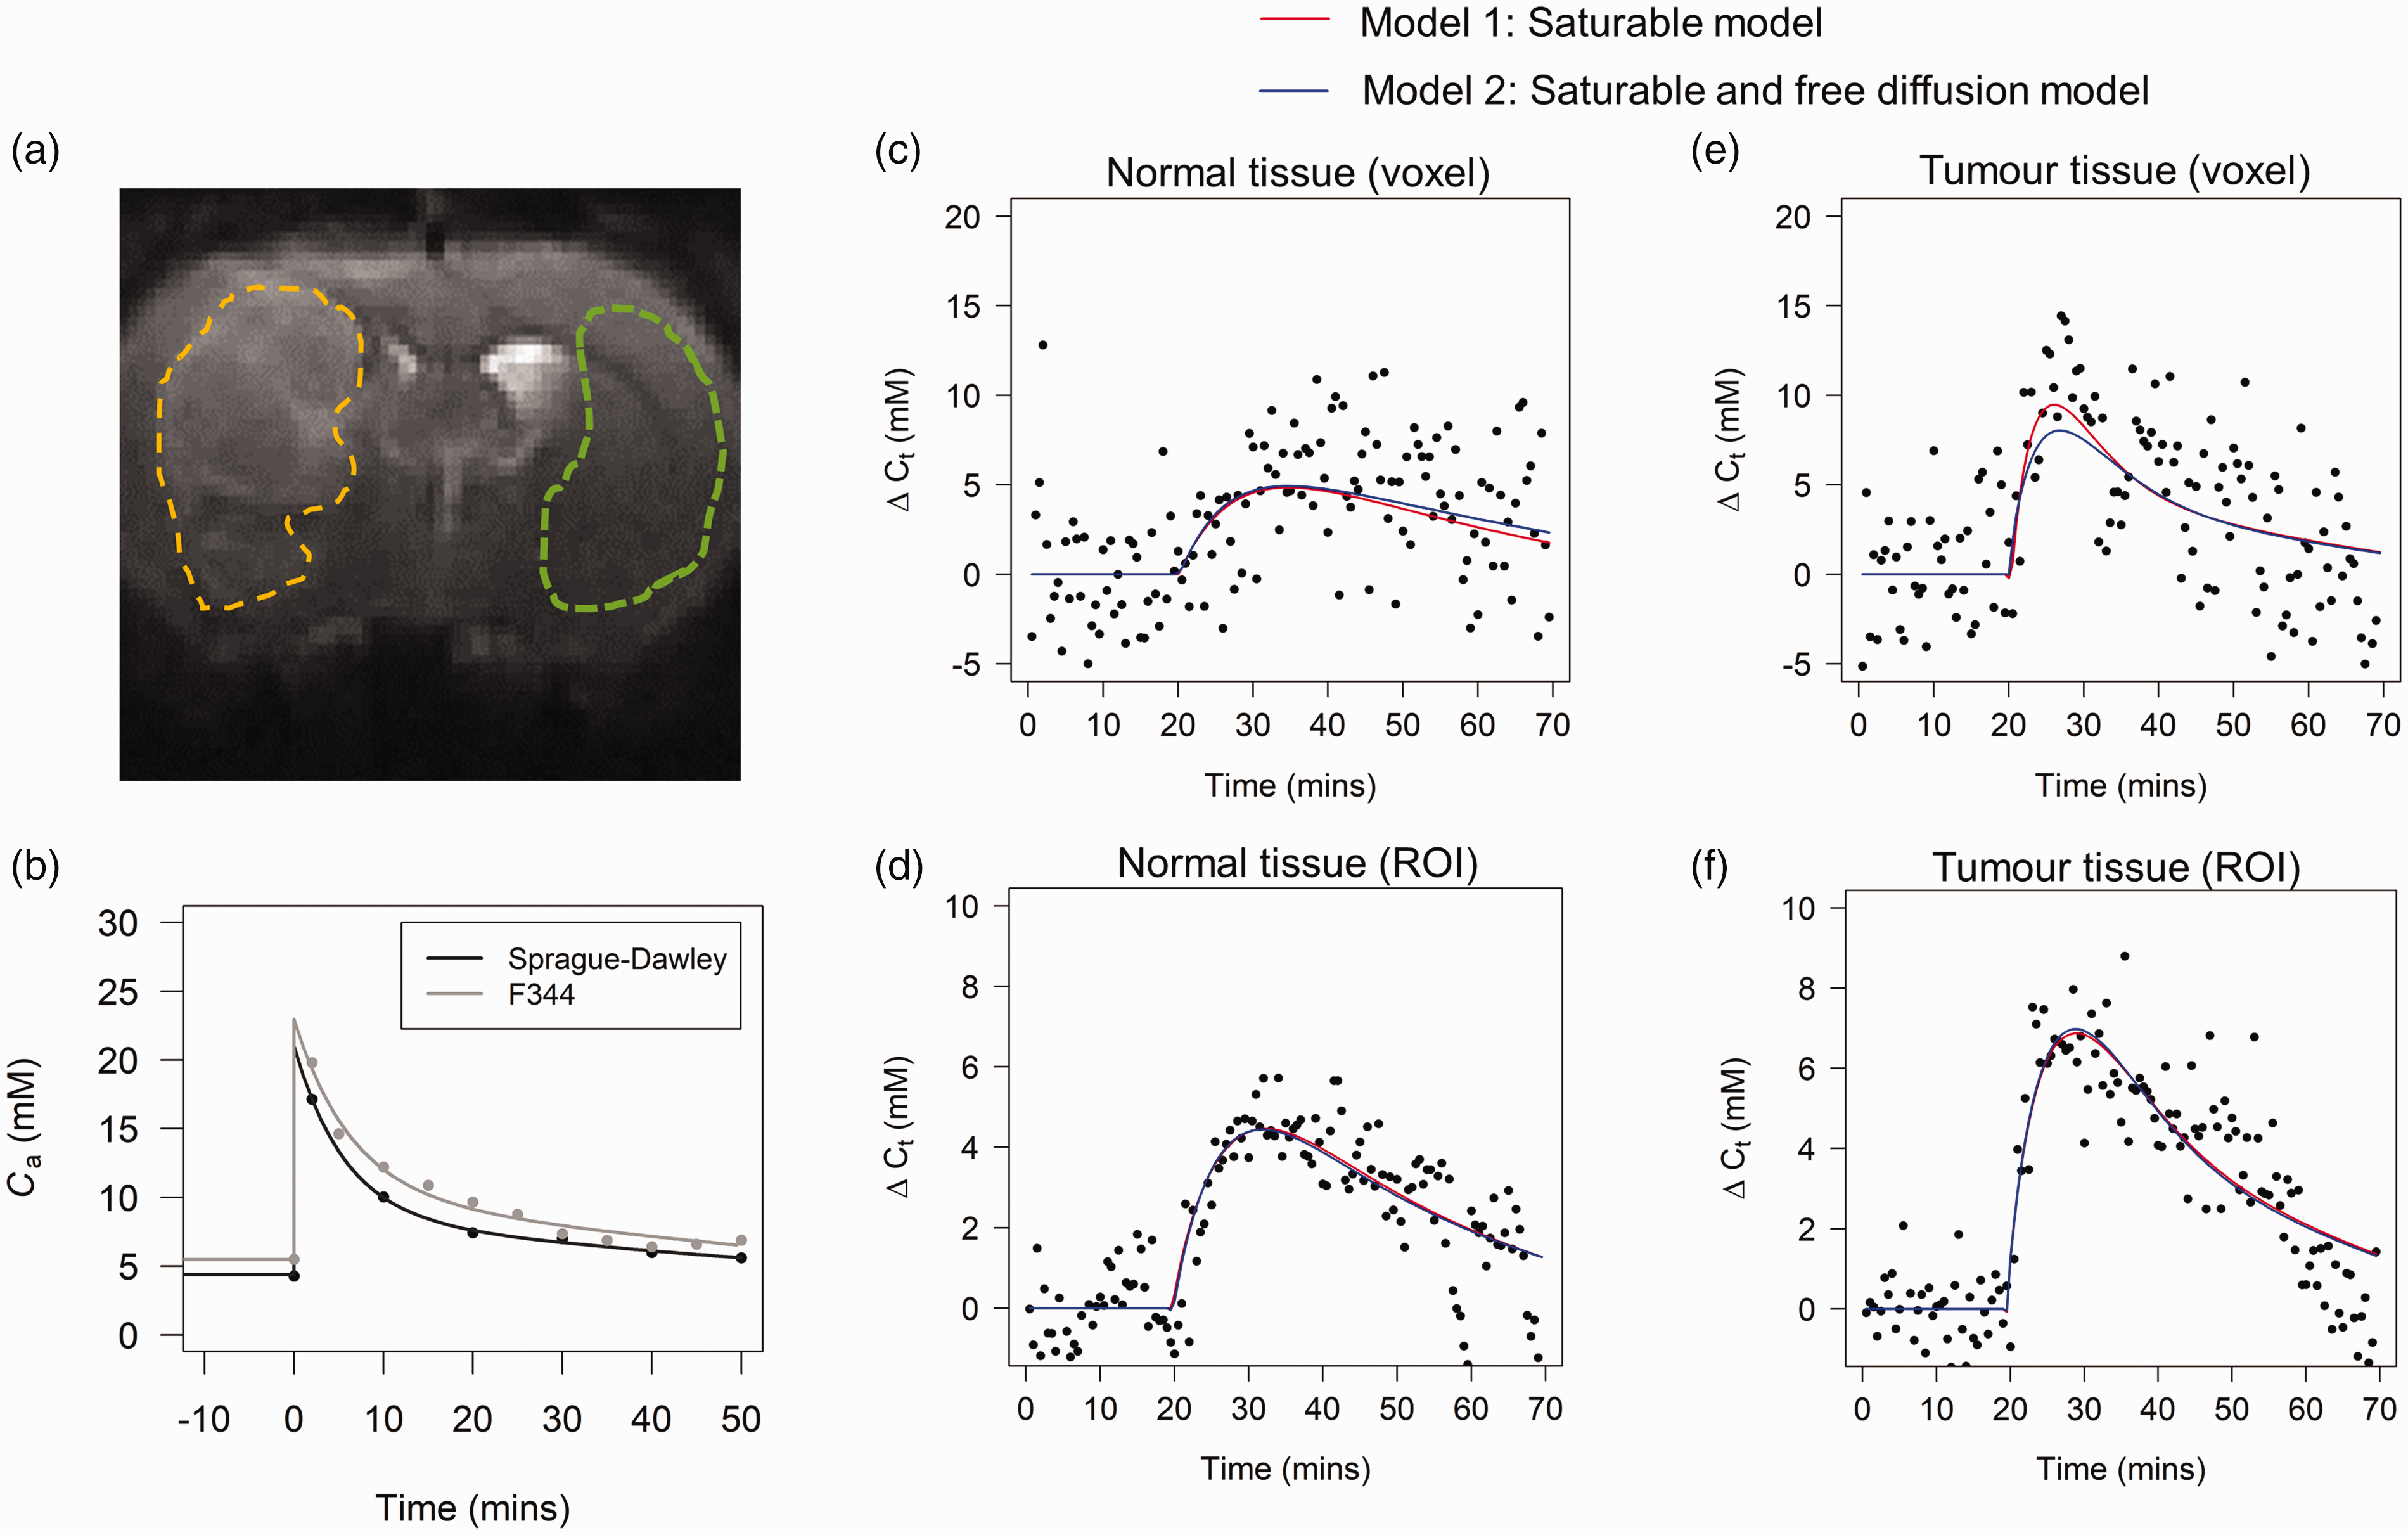
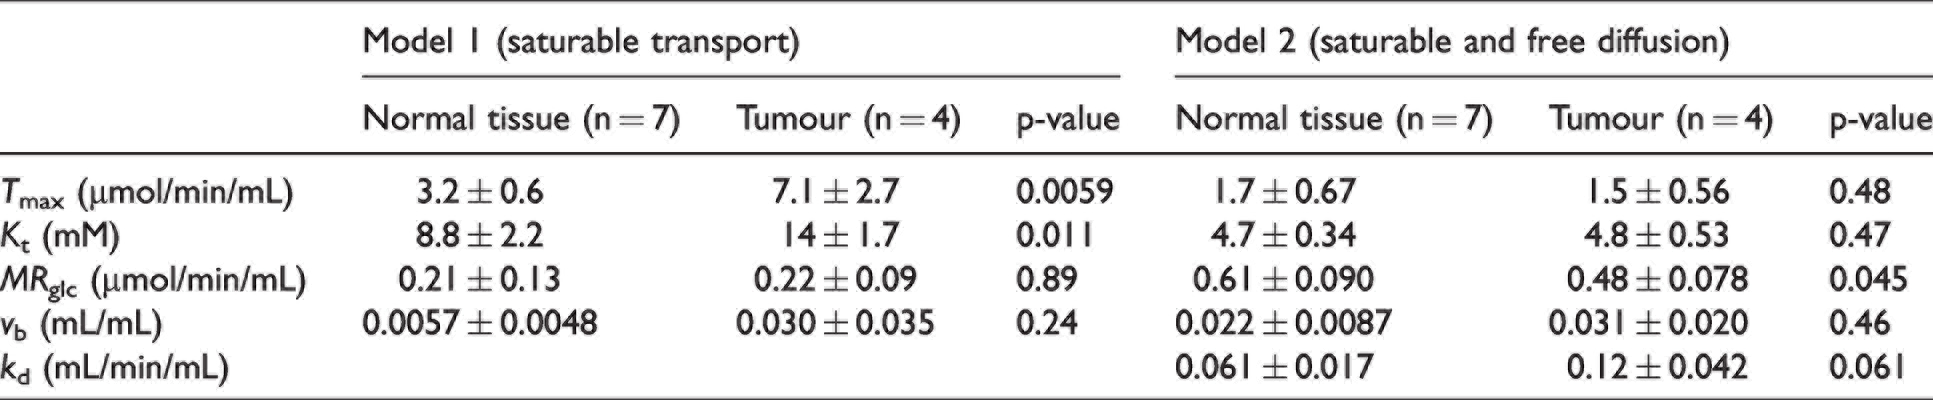
Figure 5 shows spatial maps of each kinetic parameter for a tumour bearing rat, and mean values (±sd) of each kinetic parameter averaged across all rats in normal (n = 7) and tumour tissue (n = 4). P-values show the results of t-tests comparing mean parameters in normal tissue and tumour. Mean values ± sd and p-values are also given for each parameter in Table 2. The difference in AIC between model 1 and model 2 in normal tissue and tumour is also shown as a parameter map (Figure 5(s)), and summarised across all rats as a barplot (Figure 5(t)). Visually, both models produce high fidelity maps of transport and metabolic parameters. For model 1, normal tissue/tumour contrast can be observed in images of Tmax and Kt, whereas little or no contrast is observed for MRglc and vb. This is reflected in the group comparisons. There were significant differences between tumour and normal tissue for Tmax (54% increase; p = 0.0059) and Kt (40% increase; p = 0.011). On the contrary, there was no significant difference in MRglc. When evaluating model 2 parameters, there was a borderline significant reduction in MRglc in tumour tissue (21% reduction; p = 0.045), and a borderline significant increase in kd (49% increase; p = 0.061). Model 2 estimates of Tmax, Kt, and vb were unchanged between tumour and normal tissue. Averaged across all animals, the difference in AIC between models (AIC model 1–AIC model 2) was significantly less than zero for both normal tissue and tumour tissue (ΔAIC < 0; p = 4.1 × 10⁻⁵ and p = 0.0076 for normal and tumour tissue respectively).
GlucoCESL parameter maps from a tumour bearing rat using model 1 (a–d) and model 2 (i–m), and mean parameter values in normal tissue (healthy – triangle; tumour bearing – circle; n = 7) and tumour (n = 4) for model 1 (e–h) and model 2 (n–r). Far right is the corresponding ΔAIC map (s) and mean ΔAIC in normal tissue and tumour (t). T-tests for partially overlapping samples were used to test the null hypothesis of no difference in parameter values between normal tissue and tumour. Error bars show group standard deviation.
Estimates of mean ± sd for kinetic parameters from model 1 and model 2, and results from Partover t-tests between estimates in normal tissue and tumour.
Supplementary Figure 1 shows the standard deviation of glucose uptake and metabolic parameters in tumour and normal tissue ROIs. There was no differences in the standard deviation of parameters between normal and tumour tissue except for vb from model 1 (p = 0.016; greater sd in tumour tissue), and kd from model 2 (p = 0.014; greater sd in tumour tissue).
Supplementary Figure 2 shows how R1ρ varies with lactate concentration in phantom. The R1ρ relaxivity of lactate was found to be 0.0018 (s mM)−1.
Discussion
We have presented the theory for quantitative kinetic modelling of glucoCESL MRI data, and applied two kinetic models to data from tumour-bearing and healthy rats. Parameter estimates from both models agree well with previously published values. 31 Mason et al. summarised NMR spectroscopy estimates of Tmax, Kt, and kd in rat brain from 19 prior studies. In studies that used model 1 (n = 14), estimates of Tmax and Kt were 3.9 ± 0.5 μmol/min/mL (assuming 0.83 mL water/g tissue) and 8.1 ± 0.6 mM which agree well with our normal tissue estimates of 3.2 ± 0.62 μmol/min/mL and 8.8 ± 2.2 mM. In studies that used model 2 (n = 5), estimates of Tmax, Kt, and kd were 1.56 ± 0.61 μmol/min/mL, 6.8 ± 0.6 mM, and kd = 0.025 ± 0.0074 mL/min/mL, which also agree well with our normal tissue estimates from model 2 of Tmax = 1.7 ± 0.67 μmol/min/mL, Kt = 4.7 ± 0.34 mM and kd = 0.061 ± 0.017 mL/min/mL. While there is greater discrepancy between model 2 parameters and available literature data than for model 1, the direction of change in Tmax and Kt when using model 2 versus model 1 is consistent (i.e. both are reduced), indicating that our data is also consistent with prior studies.
Model 1 estimates of MRglc in normal tissue (0.21 ± 0.13 µmol/min/mL) were also within the range of previously published values. In laboratory rats, the effects of anesthesia on MRglc are profound, and must be considered when comparing MRglc between studies. 67 In fasted rats anesthetised with 2% isoflurane, Du et al. measured MRglc in a large region covering the cortex and subcortical brain and found values of 0.53 ± 0.20 µmol/min/mL. 28 Lu et al. used similar anaesthesia and deuterium spectroscopic imaging of deuterated glucose in unfasted rat, and found MRglc values in whole rat brain of 0.28 ± 0.13 µmol/min/g. 38 Shimoji et al. used FDG-PET scanning and halothane anesthesia (1–1.5%) in fasted rat to estimate MRglc in the cortex and found values of 0.24 ± 4.8 µmol/min/g. 68 Suzuki et al. investigated the effects of different anesthesia on MRglc using FDG-PET, including scanning of conscious rat. In conscious rat, much higher values of 0.93 ± 0.18 µmol/min/g were reported, which reduced to 0.54 ± 16 µmol/min/g with isoflurane anethesia. 67 Similarly, conscious rat values for MRglc obtained by Hawkin’s et al. using the autoradiographic technique were of the order of 1.1–1.2 µmol/min/g. 64 Thus, our values for MRglc certainly lie within the range of previously published values for MRglc in anesthetised rats.
Model 2 estimates of MRglc (0.61 ± 0.009 µmol/min/mL) were approximately 3 times higher than MRglc estimates made using model 1 (0.21 ± 0.13 µmol/min/mL). It is possible that the introduction of the additional kd parameter could lead to more accurate modelling of glucose influx/efflux, leading to more accurate estimation of MRglc. We assessed other studies using model 2 to determine if MRglc was affected. Pardridge et al. used pentabarbitol anesthetisia and found MRglc values in cortex of 0.28 µmol/min/mL. 69 Crane et al. also used pentabarbitol anesthesia but also studied conscious rat and found values of MRglc of 0.27 μmol/min/g 21 and 1.02 μmol/min/g respectively. Cremer studied conscious rat only and found values of 1.24 μmol/min/mL. 70 While data is not available on isoflurane-anesthetised rats, all these values are not substantially different from literature values using model 1 indicating that model 2 estimates of MRglc should not be affected substantially by modelling of free diffusion, particularly in tissues with intact BBB. It is therefore important that further work is done to validate model 2 estimates of MRglc obtained using glucoCESL MRI.
The maximal transport capacity (Tmax) and the half saturation constant (Kt) from model 1 were significantly higher in tumour than normal tissue, indicating increased uptake of glucose. Higher Tmax may reflect an increased density of glucose transporters on the vasculature and tumour cell membranes. However, in the context of increased Kt, the interpretation must be carefully considered. Kt will trade-off saturable and non-saturable kinetics, and as Kt increases, K1 becomes less dependent on Ca, and begins to mimic the behaviour of the free diffusion constant kd. Thus, increased Tmax and Kt together may reflect the presence of free diffusion and blood-brain barrier breakdown. This interpretation is supported by model 2 parameters, where differences in Tmax and Kt between tumour and normal tissue do not exist or are much smaller, and variability in uptake of glucose is described mainly by kd (Figure 5(a), (b), (i), (j) and (m)). We did not find any difference in metabolic rate of glucose consumption between tumours and normal tissue for model 1, which is consistent with the clinical observation that uptake of FDG in many brain tumours is often no higher than surrounding normal tissue. 16 On the contrary, a small but significant reduction in model 2 MRglc was observed in tumour tissue. However, given the uncertainty associated with model 2 estimates of MRglc as described previously, this result should be treated with caution until verified by further studies. Model 1 and model 2 predicted no difference in blood volume between normal tissue and tumour. Model 1 estimates of blood volume were much lower than known values (vb < 0.005 mL/mL and vb < 0.01 mL/mL for normal tissue and tumour respectively). Estimates for model 2 were more reasonable but still low ∼ 0.02–0.03 mL/mL. The underestimation could be a result of the shorter T2 of the blood compartment relative to tissue at 9.4 T 71 which might cause glucose in the blood compartment to be less visible than glucose in tissue.
Estimates of the Akaike information criterion (AIC) in normal and tumour tissue showed that model 1 had significantly lower AIC than model 2 (ΔAIC < 0; p = 4.1 x10⁻⁵ and p = 0.0076 for normal and tumour tissue respectively), indicating that the additional free diffusion parameter of model 2 did not describe any additional variability above that described by model 1. This does not mean that model 2 is less accurate or did not fit the data as well as model 1, but that within the conditions of our experiment (i.e. temporal resolution, SNR), the additional parameter did not provide additional predictive power over parameters already present in model 1. It is clear from our results that the normal tissue values of transport and metabolic parameters from model 1 are more consistent with literature values. It was also shown in previous work that the same tumour-bearing rats as scanned in this study exhibit leakage of DCE-MRI contrast agents (see Figure 3C of Jin et al. 65 ) indicative of BBB breakdown. This suggests model 2 may more appropriately ascribe changes in glucose uptake in tumour tissue to free diffusion rather than changes to saturable transport mechanisms. Further validation work is needed to confirm these points.
We have assumed that contributions from metabolic products of glucose to ΔR1ρ were negligible compared to the effects of glucose itself. It is shown in previous work that changes in concentrations of glucose-6-phosphate 58 and neurotransmitters such as glutamate 59 are very small, and should not affect ΔR1ρ. Since tumours can produce high levels of lactate, we performed an additional phantom study to demonstrate that rising lactate levels will also not appreciably affect ΔR1ρ. The R1ρ relaxivity of lactate was found to be 0.0018 (s mM)−1, 37 times smaller than glucose. Using the reported values of the chemical shift and exchange of lactate from recent literature, 60 predicted R1ρ relaxivity is even smaller than our measured value (∼0.0005 (s mM)−1, 134 times smaller than glucose). It is not yet clear what effects lactate will have on CEST detection, which is more sensitive to slower exchange rates than CESL. Changes to ΔR1ρ from osmolality effects and differences in tissue pH were also ignored, which may have a larger effect on ΔR1ρ. 50 These factors, and the impact of a wider range of metabolites, should be investigated in future work to further refine the modelling approach.
The study has the following limitations. We have used a population-based arterial glucose input function instead of using individually sampled, or image-derived arterial input functions. We attempted to obtain image-derived AIFs from the carotid artery, but it was not possible to obtain reliable results. This is presumably due to inflow of fresh unsaturated blood into the imaging slice (i.e. blood that has not undergone spin-locking) during the time between spin-locking and the SE-EPI readout. It is possible the shape of the population level curves may have deviated from the true (individual) input function of the rats investigated in this study. Our simulations showed that deviations between assumed and true arterial glucose concentrations can have appreciable effects on ΔR1ρ, particularly at later time points (the peak effect was observed ∼20 minutes post glucose injection), which then propagate through to biases in estimates of all kinetic parameters, but predominantly affected Kt, MRglc, and vb for model 1 and MRglc and kd for model 2. These results highlight the importance of accurate input function characterisation when using such models, particularly for inter-subject or group-level comparisons. Accurate knowledge of input functions may not be so important for intra-subject comparisons (e.g. tumour vs normal tissue) as it could be expected the glucose input to different brain regions will be similar. Despite the potential for large biases, the excellent correspondence between our kinetic parameter estimates (particularly for model 1) and literature values suggest that the input functions used in this work are an accurate representation of the true arterial glucose time-courses. Future work should investigate the use of CESL and CEST approaches for measuring an image-derived input functions, and/or further validate the accuracy of the population based input function approach for group level comparisons. It is possible that adjustment (e.g. scaling) of population level input functions using pre- and post-scan venous blood glucose measurements (e.g. using a simple blood glucose monitor) may be adequate to account for inter-individual or group variability in blood glucose concentration time-courses. There were some small differences in the acquisition parameters and injection protocols between tumour bearing and healthy rats. For example, the weight by volume concentration, and hence the administered volumes of glucose solution were different. It is possible these effects led to small differences in osmolality of blood. However, given the estimated kinetic parameter values for normal tissue in healthy and tumour bearing rats were not appreciably different, we are confident these effects were small. For future glucose-enhanced MRI studies, including translational work in humans, a standardised set of optimal acquisition parameters are needed.
To conclude, we have for the first time demonstrated the feasibility of applying kinetic models to glucoCESL MRI data and show the potential of the approach to probe glucose transport and metabolism in-vivo at high spatial resolution.
Supplemental Material
sj-pdf-1-jcb-10.1177_0271678X221108841 - Supplemental material for Quantitative kinetic modelling and mapping of cerebral glucose transport and metabolism using glucoCESL MRI
Supplemental material, sj-pdf-1-jcb-10.1177_0271678X221108841 for Quantitative kinetic modelling and mapping of cerebral glucose transport and metabolism using glucoCESL MRI by Ben R Dickie, Tao Jin, Ping Wang, Rainer Hinz, William Harris, Hervé Boutin, Geoff JM Parker, Laura M Parkes and Julian C Matthews in Journal of Cerebral Blood Flow & Metabolism
Footnotes
Funding
The work was funded by the Engineering and Physical Research Council grants EP/M005909/1 and EP/S031510/1, Medical Research Council Confidence in Concept Funding [Round 6, MC_PC_17172] (Manchester) and NIH grant NS100703.
Declaration of conflicting interests
The author(s) declared the following potential conflicts of interest with respect to the research, authorship, and/or publication of this article: GJMP is a shareholder and director of Bioxydyn Limited, a company with an interest in quantitative imaging biomarkers. He is also a shareholder and Director of Queen Square Analytics, a company with an interest in MRI applied to neuroscience.
Authors’ contributions
BD conducted the research and drafted the manuscript. RH, GP, LP, and JM supervised the research. TJ shared the data and provided technical input into data analysis. HB, WH, and PW acquired benchtop glucose input functions. All authors edited and approved the submitted version.
Acknowledgements
We would like to thank Professor Stephen Williams for invaluable discussions regarding the work and early manuscript drafts.
Supplemental material
Supplemental material for this article is available online.
References
Supplementary Material
Please find the following supplemental material available below.
For Open Access articles published under a Creative Commons License, all supplemental material carries the same license as the article it is associated with.
For non-Open Access articles published, all supplemental material carries a non-exclusive license, and permission requests for re-use of supplemental material or any part of supplemental material shall be sent directly to the copyright owner as specified in the copyright notice associated with the article.