
Abstract
Brain perivascular macrophages (PVMs) are border-associated macrophages situated along blood vessels in the Virchow-Robin space and are thus found at a unique anatomical position between the endothelium and the parenchyma. Owing to their location and phagocytic capabilities, PVMs are regarded as important components that regulate various aspects of brain physiology in health and pathophysiological states. Here, we used LYVE-1 to identify PVMs in the mouse brain using brain-tissue sections and cleared whole-brains to learn about how they are distributed within the brain and across different developmental postnatal stages. We find that LYVE-1+ PVMs associate with the vasculature in different patterns and proportions depending on vessel diameter or arterio-venous differentiation. LYVE-1+ PVMs relate to blood vessels in a brain-region-dependent manner. We show that their postnatal distribution is developmentally dynamic and peaks at P10-P20 depending on the brain region. We further demonstrate that their density is reduced in the APP/PS1 mouse model of Alzheimer’s Disease proportionally to beta-amyloid deposits. In conclusion, our results reveal unexpected heterogeneity and dynamics of LYVE-1+ PVMs, with selective coverage of brain vasculature, compatible with potential unexplored roles for this population of PVMs in postnatal development, and in regulating brain functions in steady-state and disease conditions.
Introduction
Continuous brain activity is crucial in order to support body demands and needs. Such extensive activity requires constant and considerable supply of oxygen and nutrients, a task which is carried out by the brain’s vascular network. However, it also generates an extensive amount of metabolites and by-products that must be cleared away from the brain tissue in order to ensure a stable physiological environment. 1 Exchange of molecules across the vascular membrane between the vessel lumen and the parenchyma is tightly regulated because of the blood brain barrier, 2 thus a critical limitation in terms of waste-clearance is imposed. Currently, several mechanisms account for waste-clearance from the brain. The first are the meningeal lymphatic vessels (mLVs), which are part of the endothelial lymphatic system.3,4 Waste in the brain itself is cleared by a different system, the glymphatic system, which is a paravascular system responsible for the exchange of cerebrospinal fluid (CSF) into and out of the brain around the vessels, in the Virchow-Robin space. 5 An additional clearance route along arterial perivascular spaces has also been demonstrated. 6 Nonetheless, it remains largely unknown how physiological homeostasis is maintained both globally and locally in the brain.1,7
Brain perivascular macrophages (PVMs) are a subset of border-associated-macrophages (BAMs, also known as CNS-associated-macrophages, CAMs) which also comprise the meningeal macrophages (MMs) and choroid-plexus macrophages (CPMs).8,9 PVMs are found in the Virchow-Robin space around the vessel wall, at a strategical anatomical position between the endothelium and the parenchyma, and are thus regarded as critical in linking peripheral blood-borne signals and the CNS, notably in regulating immune-surveillance and fluid homeostasis.6,9–11
PVMs have been shown to derive from early erythro-myeloid progenitors in the yolk-sac,8,12–15 but surprisingly little is known on how PVMs are distributed in the brain in postnatal steady-state conditions 9 and whether their distribution undergoes spatio-temporal changes until adulthood and under pathophysiological conditions. At the molecular level, PVMs express a set of well-defined markers, notably CX3CR1, CD206 (also known as MRC1) and lymphatic vessel endothelial hyaluronan receptor 1 (LYVE-1). 16 The specificity of LYVE-1 as a PVM marker was recently demonstrated 17 and the lyve-1 locus was used to distinguish between a subset of PVMs and CX3CR1+ microglia 18 . Although their exact role remains to be elucidated, LYVE-1+ PVMs display phagocytic capabilities and have been shown to be involved in hypertension,16,19 neuroinflammation17,18 and stroke 20 .
Currently, characterization of BAMs in general, and PVMs in particular, relies on enrichment by dissociation, followed by detailed molecular analyses. Although this approach can reach single-cell sensitivity and is highly informative, it lacks the spatial dimension since the location of the cells in their native tissues is not preserved. Moreover, the tissue and organs often need to be pooled in order to increase the quality and quantity of molecules in the sample. Molecular analyses of smaller regions within the organ or the tissue are even more challenging for the same reason.
Here we study for the first time different aspects of the distribution of LYVE-1+ PVMs at brain-region and brain-wide scales by using a combination of immunostaining of brain slices and by visualizing them in unprocessed tissue with iDisco tissue clearing 21 of entire mouse brains. Using different developmental postnatal periods we studied how these PVMs associate with different parts of the vasculature, and compared the density of these PVMs in different brain regions. We used the APP/PS1 mouse model of Alzheimer’s Disease (AD) to examine how their distribution is modified in brain pathophysiology. Our results demonstrate a heterogeneous and dynamic distribution of LYVE-1+ PVMs in the brain, and suggest that these PVMs may be differentially regulated in the brain.
Materials and methods
Animals
Male and female C57Bl/6Nj mice and APP/PS1 mice (B6;C3-Tg(APPswe,PSEN1dE9)85Dbo/Mmjax) were purchased from Jackson Laboratories. CX40-GFP 22 mice were previously described and genotyped with epifluorescence microscope. No selection criteria were used for selecting the animals. The mice were housed in temperature and humidity controlled rooms, maintained on a 12 h/12h light/dark. All strains were kept in identical housing conditions in pathogen-free facility and were handled in compliance with regulations of the ethical rules of the French agency for animal experimentation. Experiments were approved by the French Ministry for Research and Higher Education’s institutional review board (Apafis number: 21814) and were conducted in accordance with the European Directive 2010/63/EU. The data reporting of the current study has followed the ARRIVE 2.0 guidelines (PMID: 32663096). Mice were euthanized at various ages ranging from 0–100 weeks of age. Sample size was chosen in accordance with similar, previously published experiments.
Perfusion and tissue processing
Mice were euthanized with an intraperitoneal (i.p.) injection of 400 mg/kg of ketamine (Imalgene) and 20 mg/kg of Xylazine (Rompun) and then intracardiaclly perfused with 0.1 M of PBS for 5 min until exsanguination followed by 4% paraformaldehyde (PFA) for fixation, and the brains were immediately extracted. After extraction, the brains were immersed in a 4% PFA solution, overnight at 4°C. The brains were then embedded in agarose and 100–150 µm brain sections were made using a vibration microtome (HM 650 V).
Brain immunolabeling
Brain sections were incubated with PBS containing 1% Triton-X-100 for 1 h at room temperature (RT), followed by 3 washes (15 min each) with PBS containing 10% tris-HCL PH 7.4, 3% NaCl 5 M and 1% Triton-X-100 (TNT). The sections were then blocked with a blocking solution (TNBT) containing 10% Tris-HCL PH 7.4, 3% NaCl 5 M, 1% Triton-X-100, 0.5% Perking blocking reagent all diluted in H2O milliQ QSP. This was then followed by an overnight incubation at 4°C with appropriately diluted primary antibodies: anti-CD31 (R&D Systems, clone AF3628, 1:250); anti-LYVE-1 (ReliaTech GmbH, clone 103-PA50, 1:300), anti-LYVE-1 (eBioscience, ALY7, 1:100), anti-CD206 (Biorad MCA2235T, clone MR5D3, 1:300), anti-aquaporin 4 (Sigma, A5971, 1:500), anti-EPHB4 (R&D Systems, AF446-SP, 1:100), anti-SMA (Sigma, C6198-2ML, 1: 250). Whole mounts and sections were then washed 3 times for 15 min at RT with TNT, followed by incubation with Alexa-fluor 488/555/647 donkey/anti rabbit/goat/rat IgG antibodies (Invitrogen, 1:250) for 4 h at RT in TNBT. After 5 min in 1:2000 DAPI reagent, sections were washed 3 times with TNT and mounted with a fluorescence mounting medium (Dako, S3023) under coverslips.
WT and APP/PS1 brain slices immunolabeling
WT and APP/PS1 brain slices were incubated in 1% Thio-S diluted in 50% ETOH for 30 min at RT. The slices were then washed in 50% ETOH for 5 minutes. This was then followed by 3 antigen retrieval steps:
Incubation in citrate buffer at 50°C for 20 min. Incubation in 1 µM glycine for 20 min. Incubation in 1% SDS.
This was then followed by the immunolabeling protocol described earlier.
Samples staining and iDISCO+ clearing
Entire mice brains were cleared using the iDisco clearing protocol. 21 For the immunolabeling step, the brains were incubated for 5–7 days at 37°C with rotation, with diluted primary antibodies: anti-CD31 (R&D Systems, clone AF3628, 1:400), anti-LYVE-1 (ReliaTech GmbH, clone 103-PA50, 1:330), anti-EPHB4 (R&D Systems, AF446-SP, 1:100) in a final volume of 5 ml PTwH/5%DMSO/3% donkey serum. The brains were then washed 4–5 times at RT and left in the washing solution overnight, followed by 4 days incubation at 37°C with rotation, with diluted secondary antibodies: Alexa-fluor 555/647 Donkey anti Rabbit/Goat IgG antibodies (Invitrogen, 1:400) in a final volume of 5 ml PTwH/5%DMSO/3% donkey serum.
Brain slices imaging
Images of brain sections were taken using Zeiss Axiozoom apotome, and Zeiss LSM 980 confocal microscope.
Light sheet imaging
Cleared brains were imaged either on the Ultramicroscope II (LaVision Bio Tec) or Ultramicroscope Blaze (Miltenyi Biotec) light-sheet microscope with a 1.0X objective, and on a light-sheet microscope with a 0.63X objective.
Image processing and quantification method
For Figures 1(h) and 2(a), CD1 mice were stained for CX40, EPHB-4 and LYVE-1 and Z-stacks were acquired using Axiozoom (Zeiss) at X80 magnificationusing. Using ImageJ software 1.53f51, a thresholding step was made for the LYVE-1 channel in order to extract its area surrounding each artery and vein separately. The area, diameter, type and coverage pattern for each vessel were extracted manually.
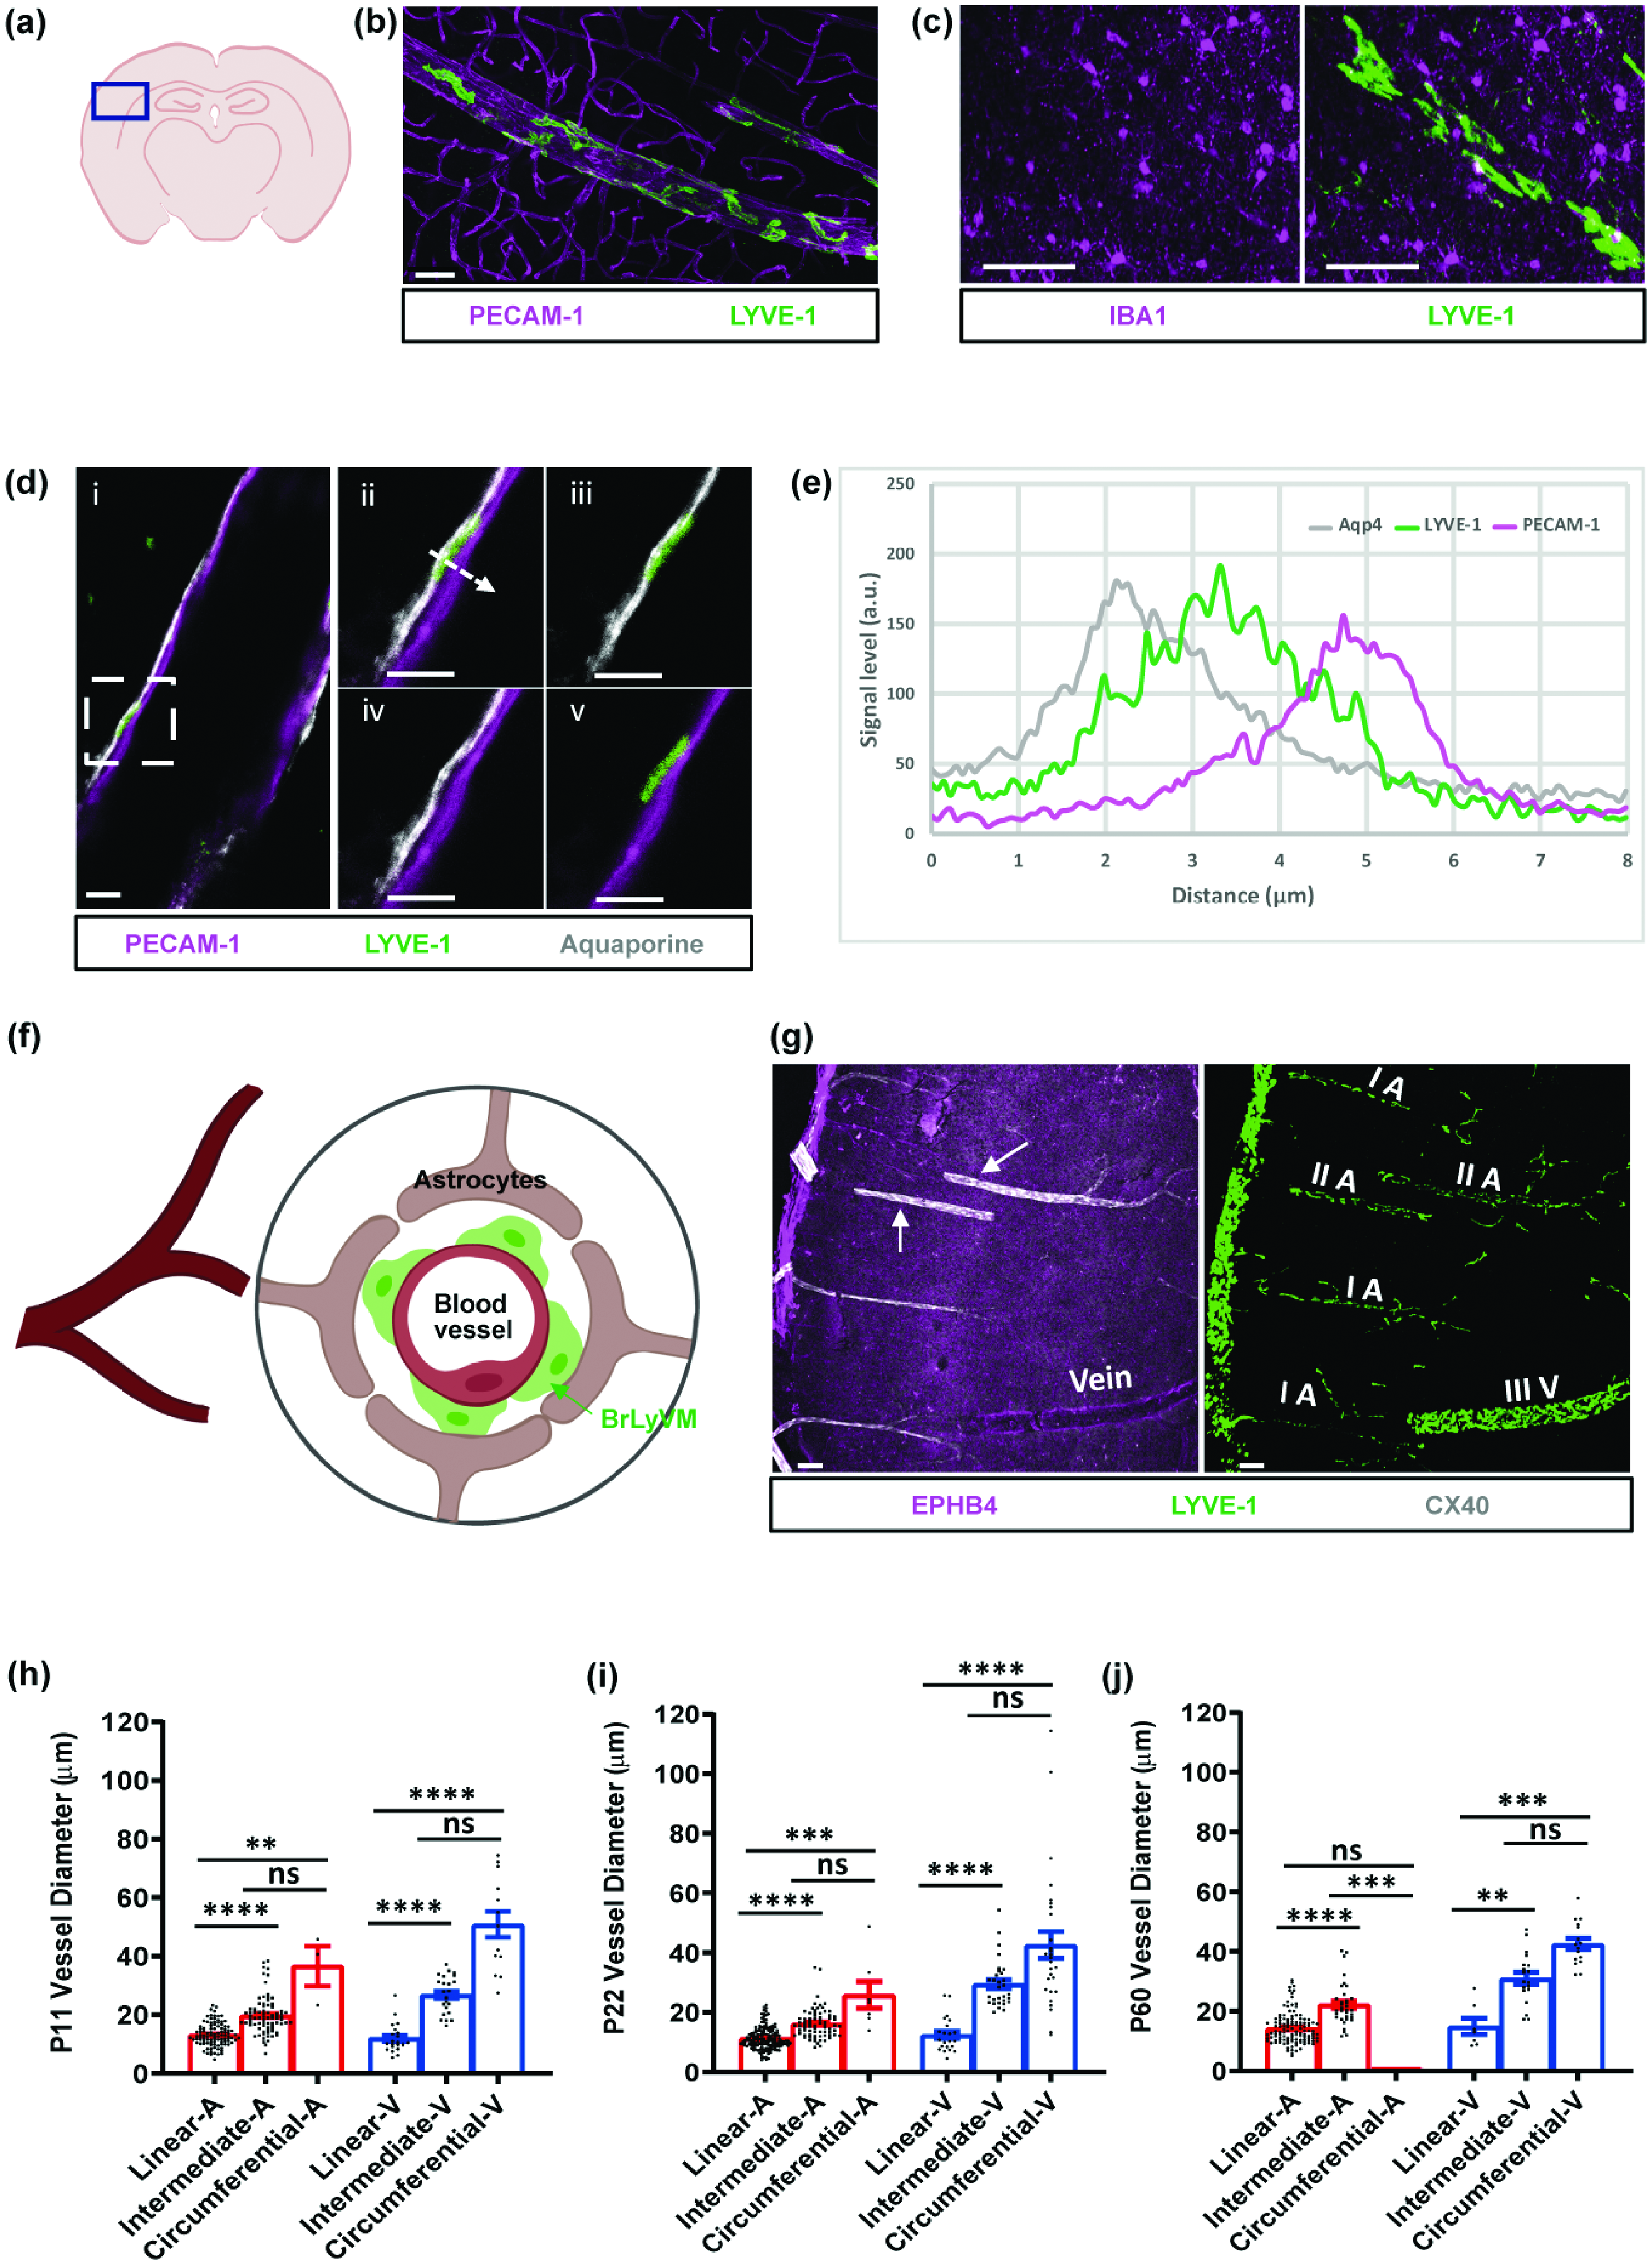
Characterization of the vascular environment and patterns of BrLyVMs. (a) Schematic representation of a brain slice showing the region used for generating the images in b, c, d and g. (b) Immuno-labeling of LYVE-1 (green) and PECAM-1 (magenta) reveals that BrLyVMs are not part of the endothelium. (c) Immuno-labeling of LYVE-1 (green) and microglia (IBA1, magenta) demonstrates that BrLyVMs and microglia are morphologically distinct. (d) Relative positions of BrLyVMs (LYVE-1, green), the endothelium (PECAM-1, magenta) and the glia limitans (Aquaporin 4, white). dii-dv: higher magnification of the box highlighted in the di. (e) Graphical representation of the three different markers (LYVE-1, PECAM-1 and Aquaporin 4) along the dashed line shown in dii. (f) Schematic representation of the localization of BrLyVMs in the Virchow-Robin space. Astrocytes, BrLyVMs and a blood vessel are annotated. (g) BrLyVM distribution around arteries and veins, and the different distribution patterns. A CX40 cortical brain slice at P22 immunostained for EPHB4 and for LYVE-1. Left panel: Exclusive labeling of CX40-arteries (white) and of EPHB4-veins (magenta) is observed. White arrows point to arteries. Right panel: Corresponding image of BrLyVMs (LYVE-1, green) showing different coverage patterns (denoted as I – linear, II – intermediate, III – circumferential). V and A denote vein and artery, respectively and (h–j) Quantification of coverage patterns around arteries and veins, according to vessel diameter, at different developmental stages (P11-left; P22-middle; P60-right). Each point represents an individual vessel. Kruskal-Wallis tests followed by a Dunn’s multiple comparisons test were used to compare the diameters of vessels exhibiting each pattern for arteries and for veins, n = 3 mice for each age group. All data are presented as mean ± SEM. Stars represent the p values for statistically significant tests (ns p ≥ 0.05; *p < 0.05; **p < 0.01; ***p < 0.001; ****p < 0.0001). Scale bars 50 µm (b, c), 10 µm (d) and 100 µm (g).
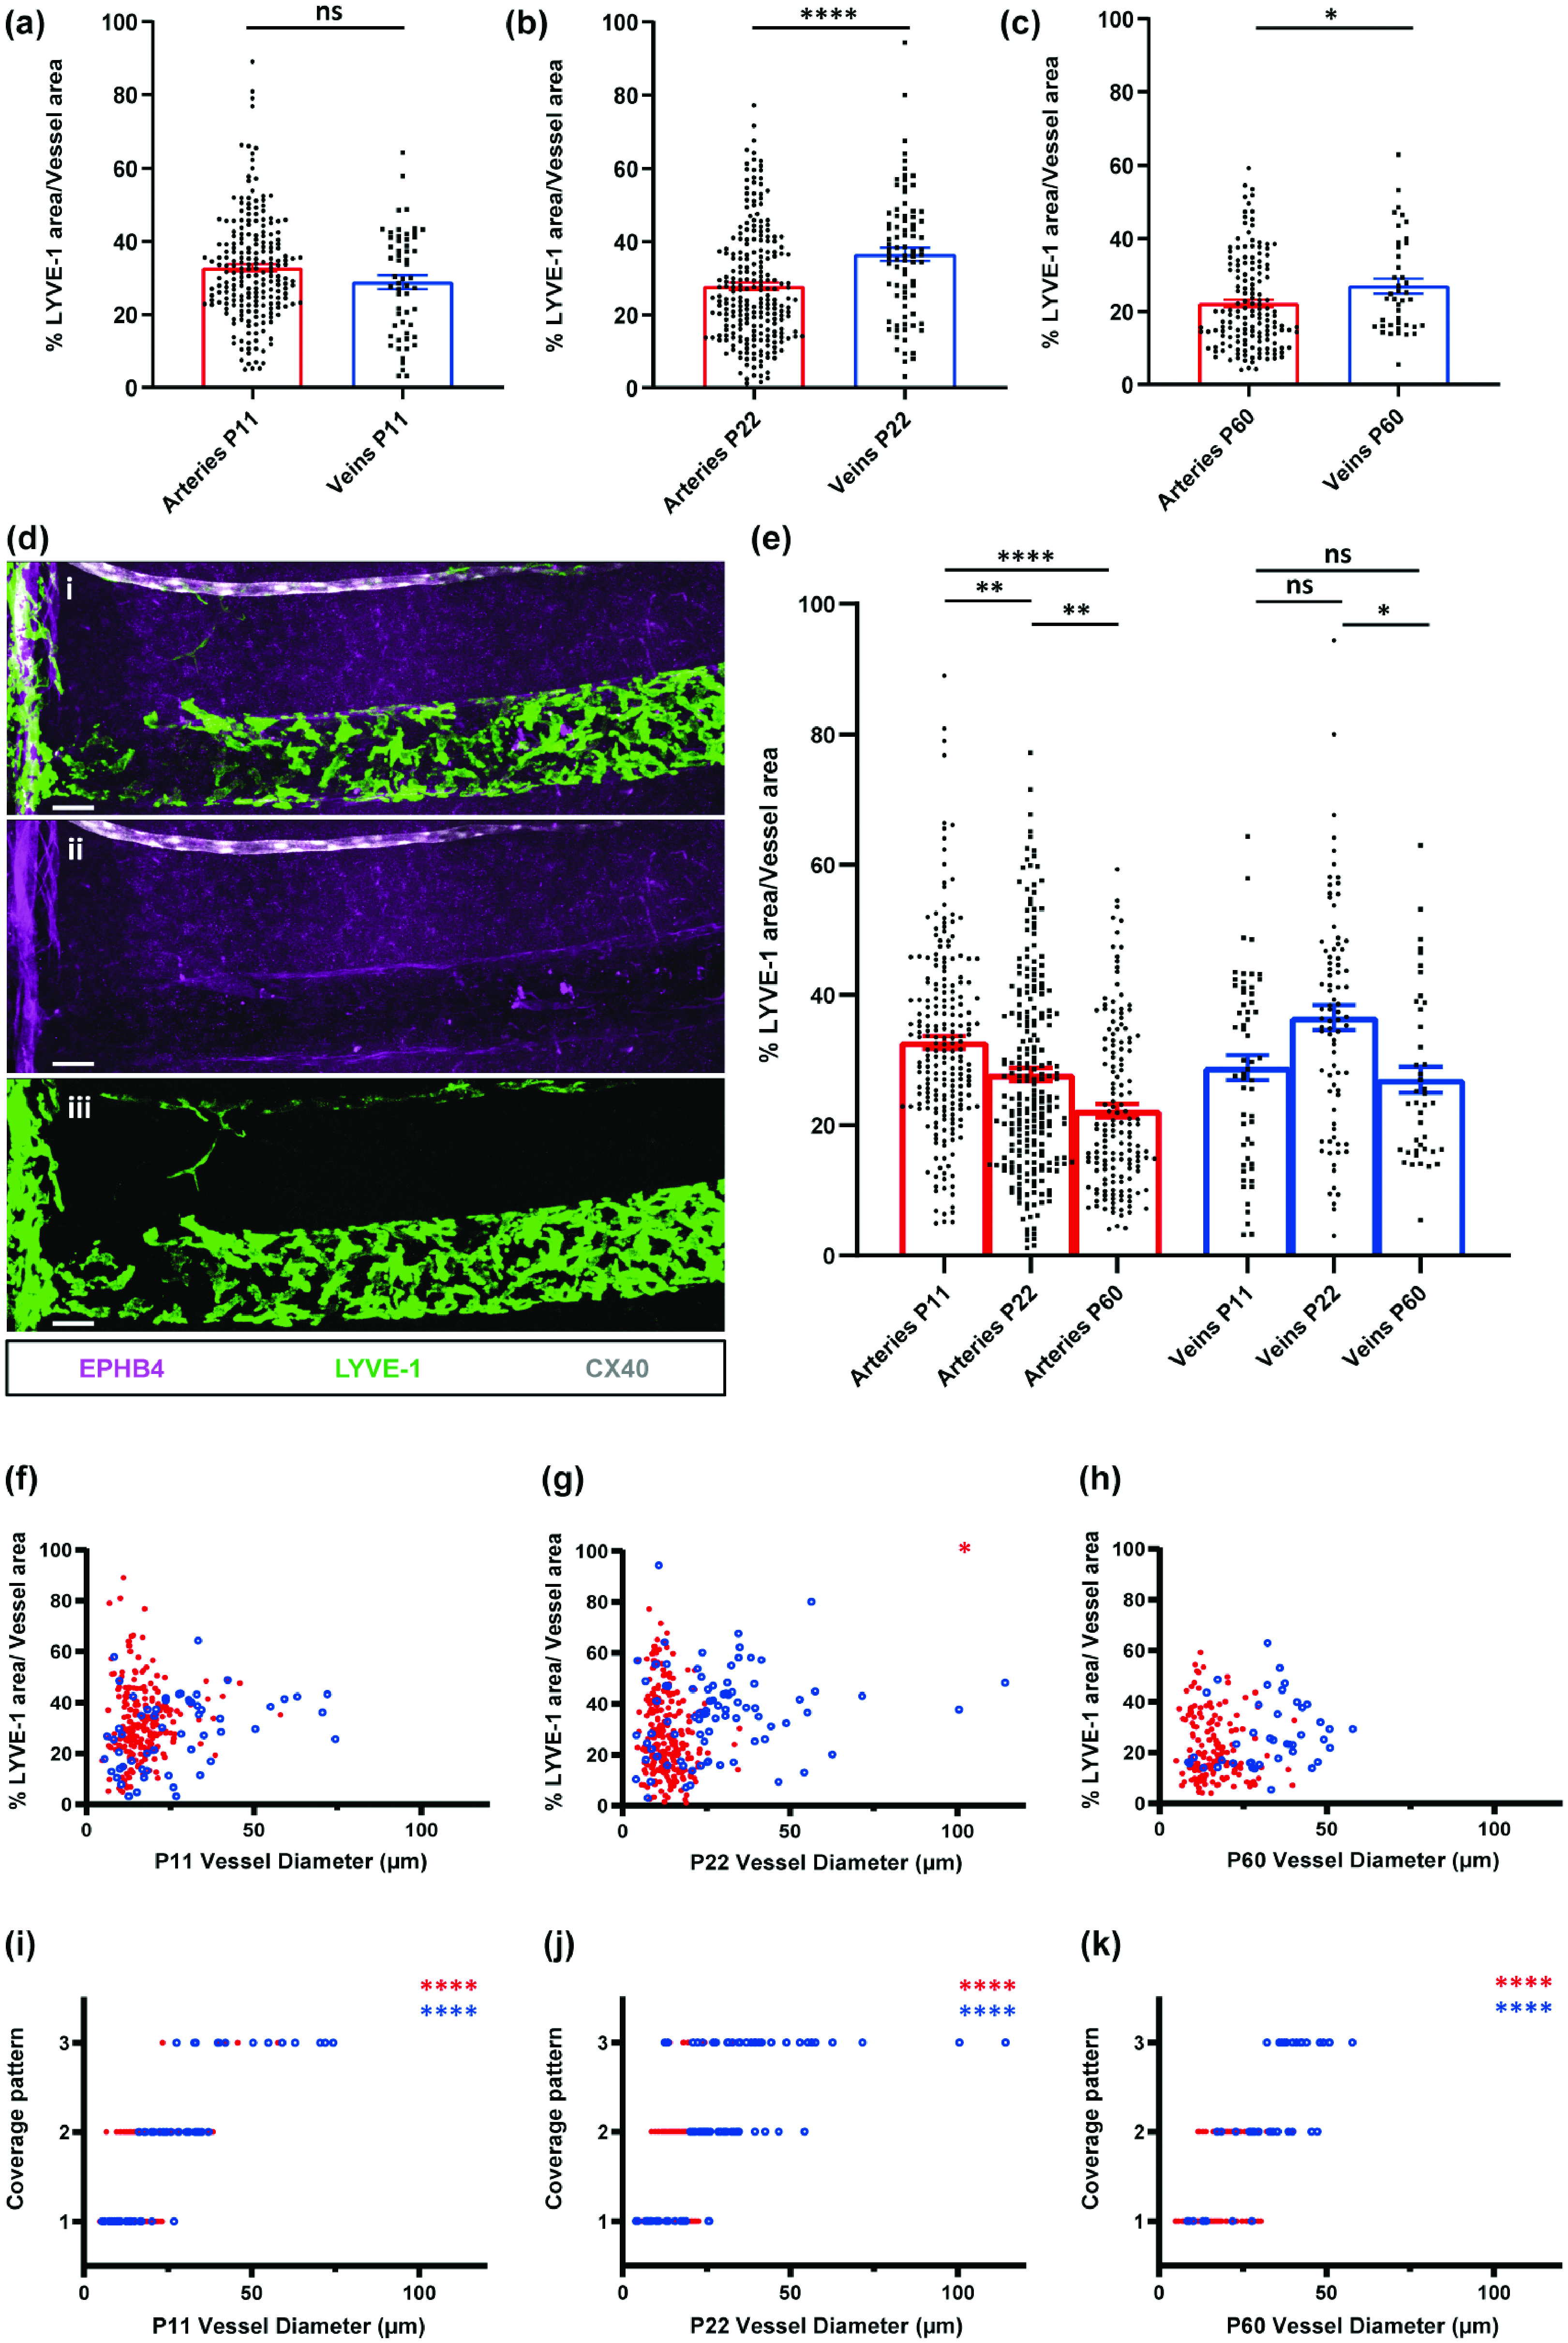
BrLyVM coverage of arteries and veins during postnatal development. (a–c) Quantification of BrLyVM coverage density of arteries (red bars) and veins (blue bars) at different developmental stages (P11-left; P22-middle; P60-right). Each point represents an individual vessel. Mann-Whitney tests were used to compare artery and vein coverage for each age group, n = 3 mice.Contiuned.(d) Representative confocal image showing an artery (CX40, white) and a large vein (EPHB4, magenta) with different BrLyVM (LYVE-1, green) coverage patterns and density. The artery is covered in a linear pattern while the vein in a circumferential pattern. (e) Data taken from (a,b and c), represented here according to vessel type. Kruskal-Wallis tests followed by Dunn’s multiple comparisons tests were used to compare the coverage density at P11, P22 and P60 for arteries and veins. (f–k) Influence of vessel diameter. Top panels: scatter plots showing the relation, at P11(f), P22(g) and P60(h), between vessel diameter and BrLyVM coverage density. Using Spearman’s Rank, no significant associations between diameter and coverage density were found for veins or arteries at P11 or P60. A minor negative association was found at P22 between diameter and coverage density. Bottom panels: scatter plots showing the relation, at P11(i), P22(j) and P60(k), between vessel diameter and BrLyVM coverage pattern. Significant positive associations were identified in each age group for both arteries and veins. Each unfilled blue circle represents a vein while each filled red circle represents an artery, n = 3 for each age group. (a, b, c and e) data are presented as mean ± SEM. Stars represent the p values for statistically significant tests (ns p ≥ 0.05; *p < 0.05; **p < 0.01; ***p < 0.001; ****p < 0.0001). Scale bars 50µm (b).
For Figure 3(d) and (e), Z-stacks were acquired using Axiozoom (Zeiss) at X80 magnification. For colocalization, a custom-written plugin performed object segmentation using a difference of Gaussian filter followed by a thresholding step on each input channel and detected co-localized objects using mcib3D libraries. 23 The user predefines the following parameters: size, intensity object, colocalization percentage and thresholding method of each channel. We used the following values: Maximal Cell Size- 10,000 microns; Maximal mean intensity- 15,000; Colocalization threshold- 65%. P22 and P60 cortical slices were thresholded using Tri detection method for CD206 and Li detection method for LYVE-1. P11 cortical slices were thresholded using Li detection for both markers. The plugin segments the objects using the input parameters and computes colocalization based on the colocalization threshold that was input.
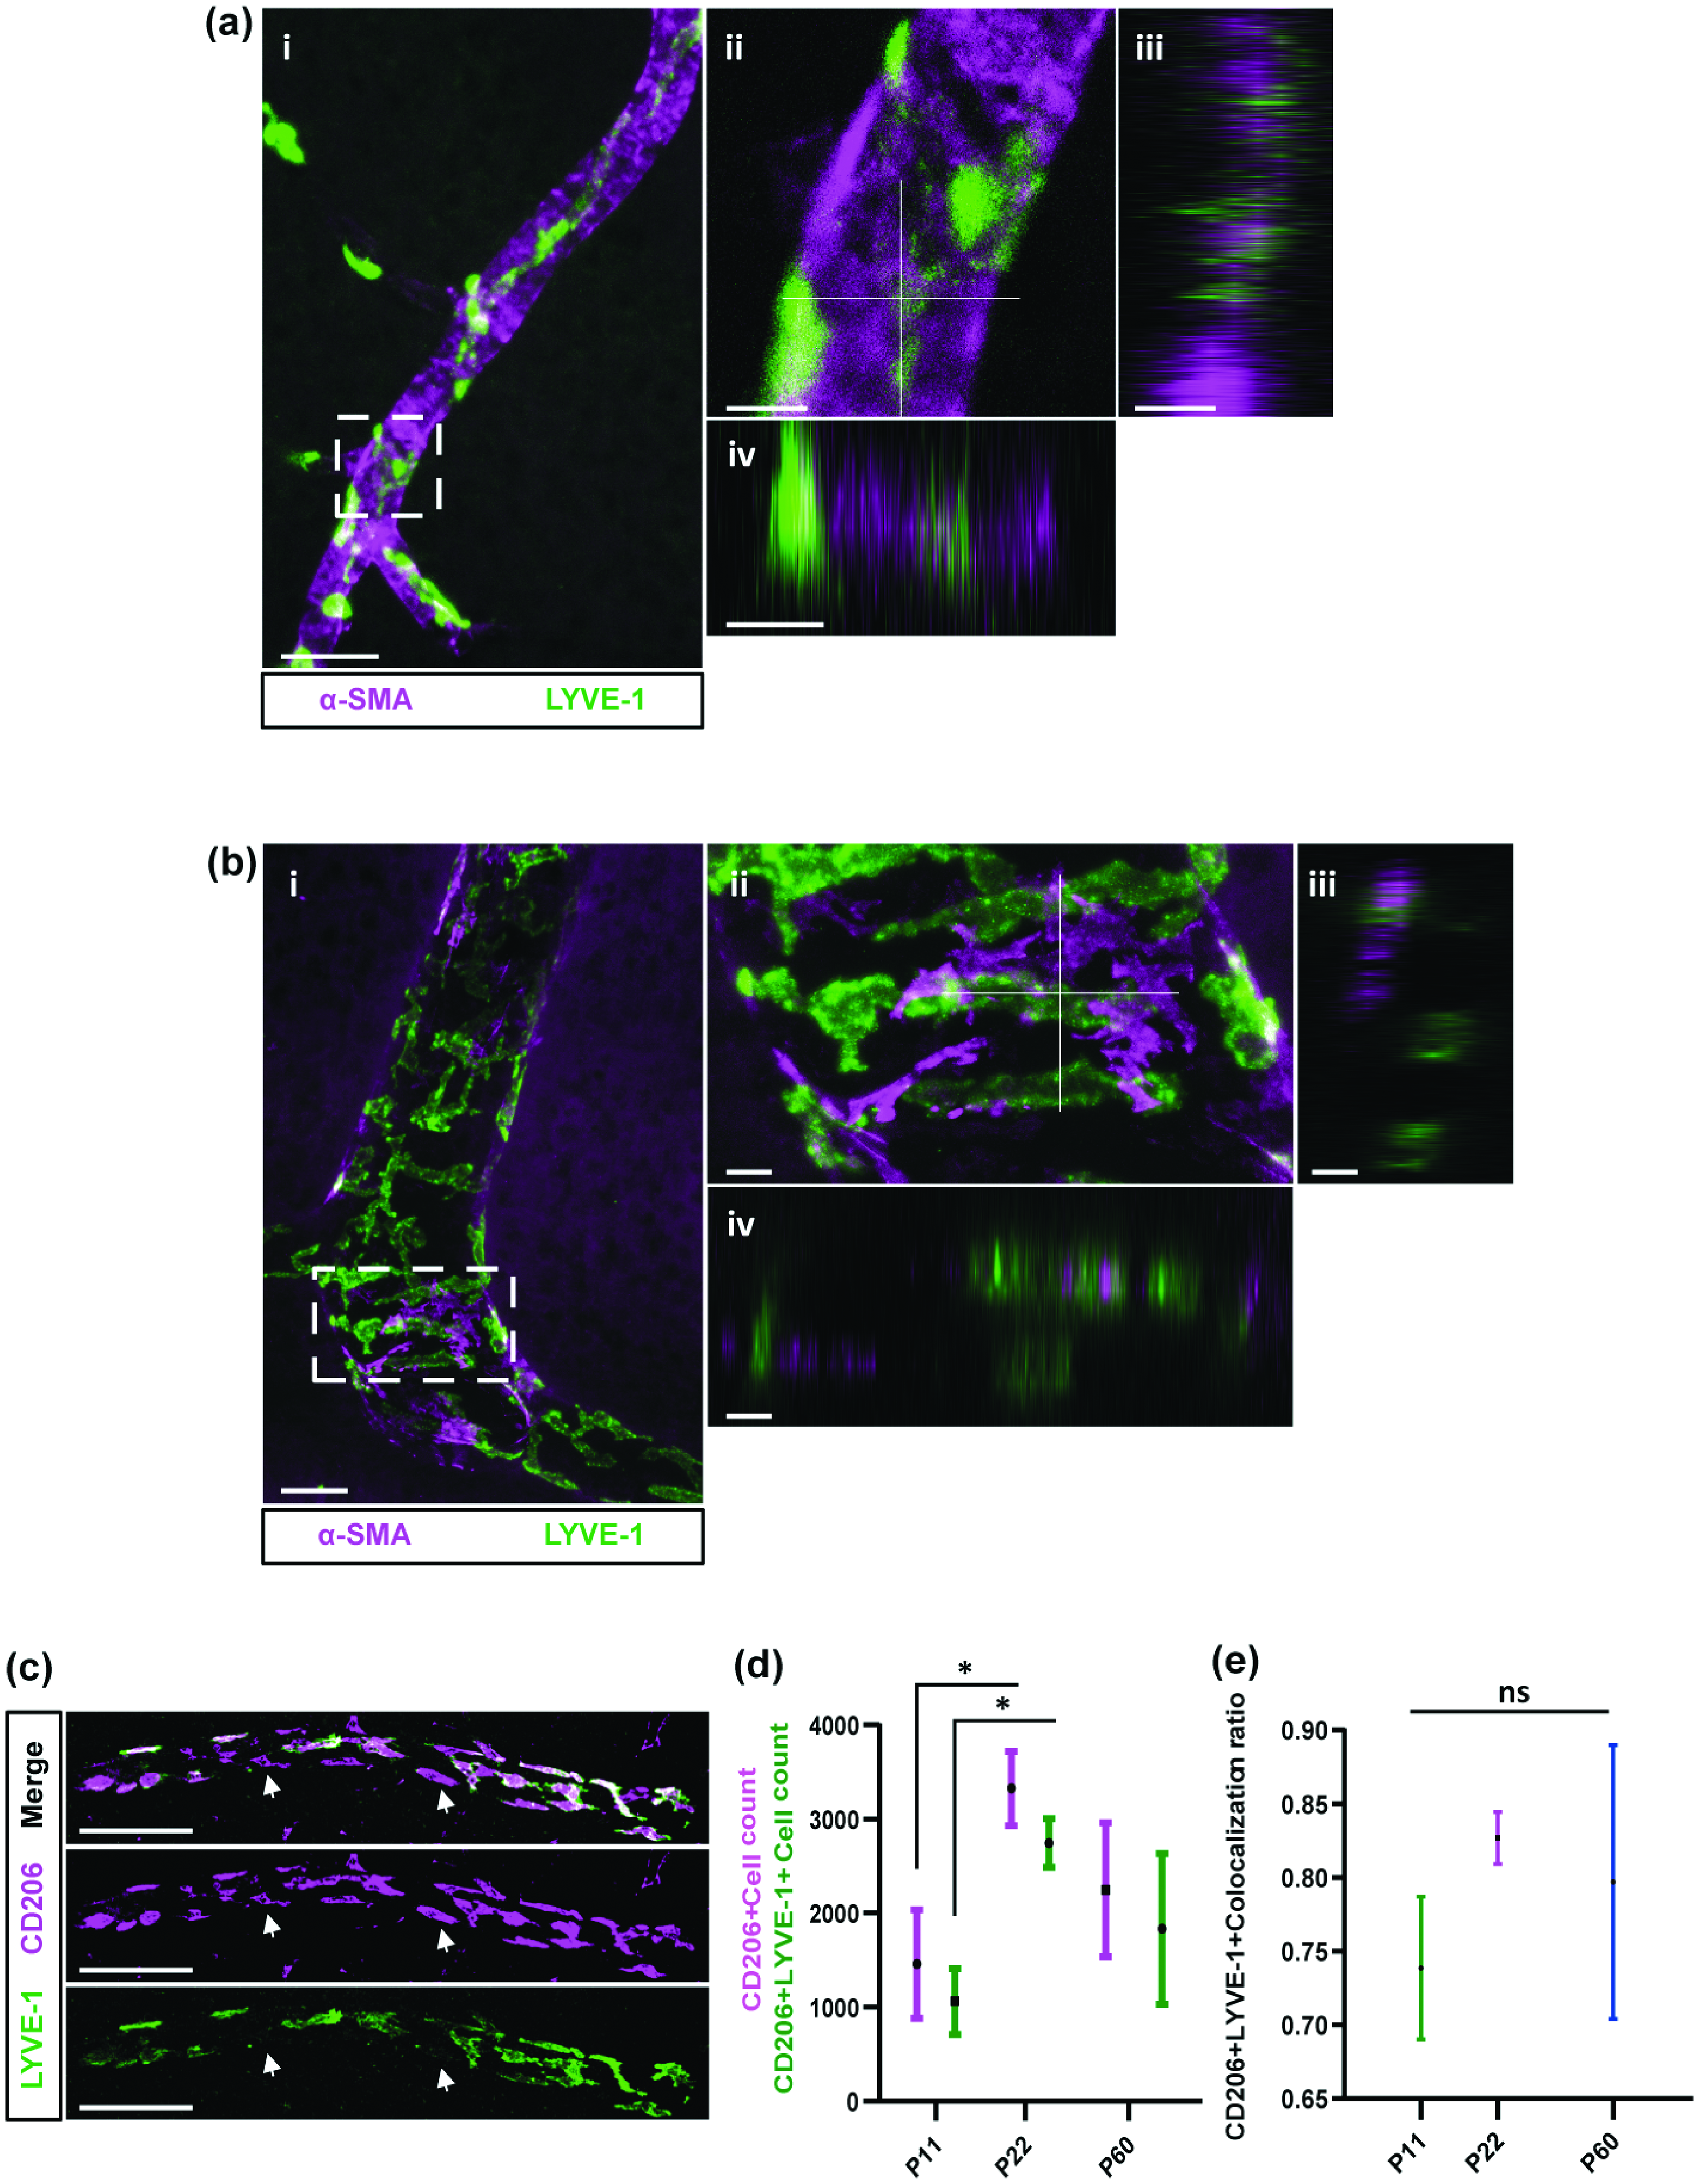
BrLyVMs in relation to smooth muscle cells and CD206+ cells. (a) Confocal image of an artery and its coverage of BrLyVMs (LYVE-1, green) and dense smooth muscle cells (α-SMA, magenta). aii Higher magnification of the box in ai and the associated orthogonal views (aiii and aiv) along the white axes shown in the aii. (b) Confocal image of a large caliber vessel and its coverage of BrLyVMs (LYVE-1, green) and sparse smooth muscle cells (α-SMA, magenta). bii Higher magnification of the box in bi and the associated orthogonal views (biii and biv) along the white axes shown in the bii. (c) Co-immunolabeling for LYVE-1 (green) and CD206 (magenta). Scale bar 100μm. Arrows point to cells that express CD206 but are negative for LYVE-1. (d) Quantification of the number of cells expressing CD206 and those expressing CD206 and LYVE-1 in the cortex at different developmental stages, P11, P22, P60 and (e) colocalization ratio for the LYVE-1 and CD206 markers in the cortex at these developmental stages. Data are presented as mean ± SD with n = 3 for each age group and compared using one-way ANOVA tests followed by Bonferroni post-hoc tests. Stars represent the p values for statistically significant tests (*p < 0.05). Scale bars 50µm (ai, bi),10 µm (aii-aiv, bii-biv) and 100 µm (c).
For Figure 4, 5 and 6 (d) Imaris software 9.7.2 was used to process the brain by extracting in 3D its different regions (OB, Cortex, Hippocampus, Brainstem and Cerebellum) using a contour surface to manually select the brain region contours on 2D slices while precisely and specifically removing the pial surface. This was followed by a mask step for the created surface.
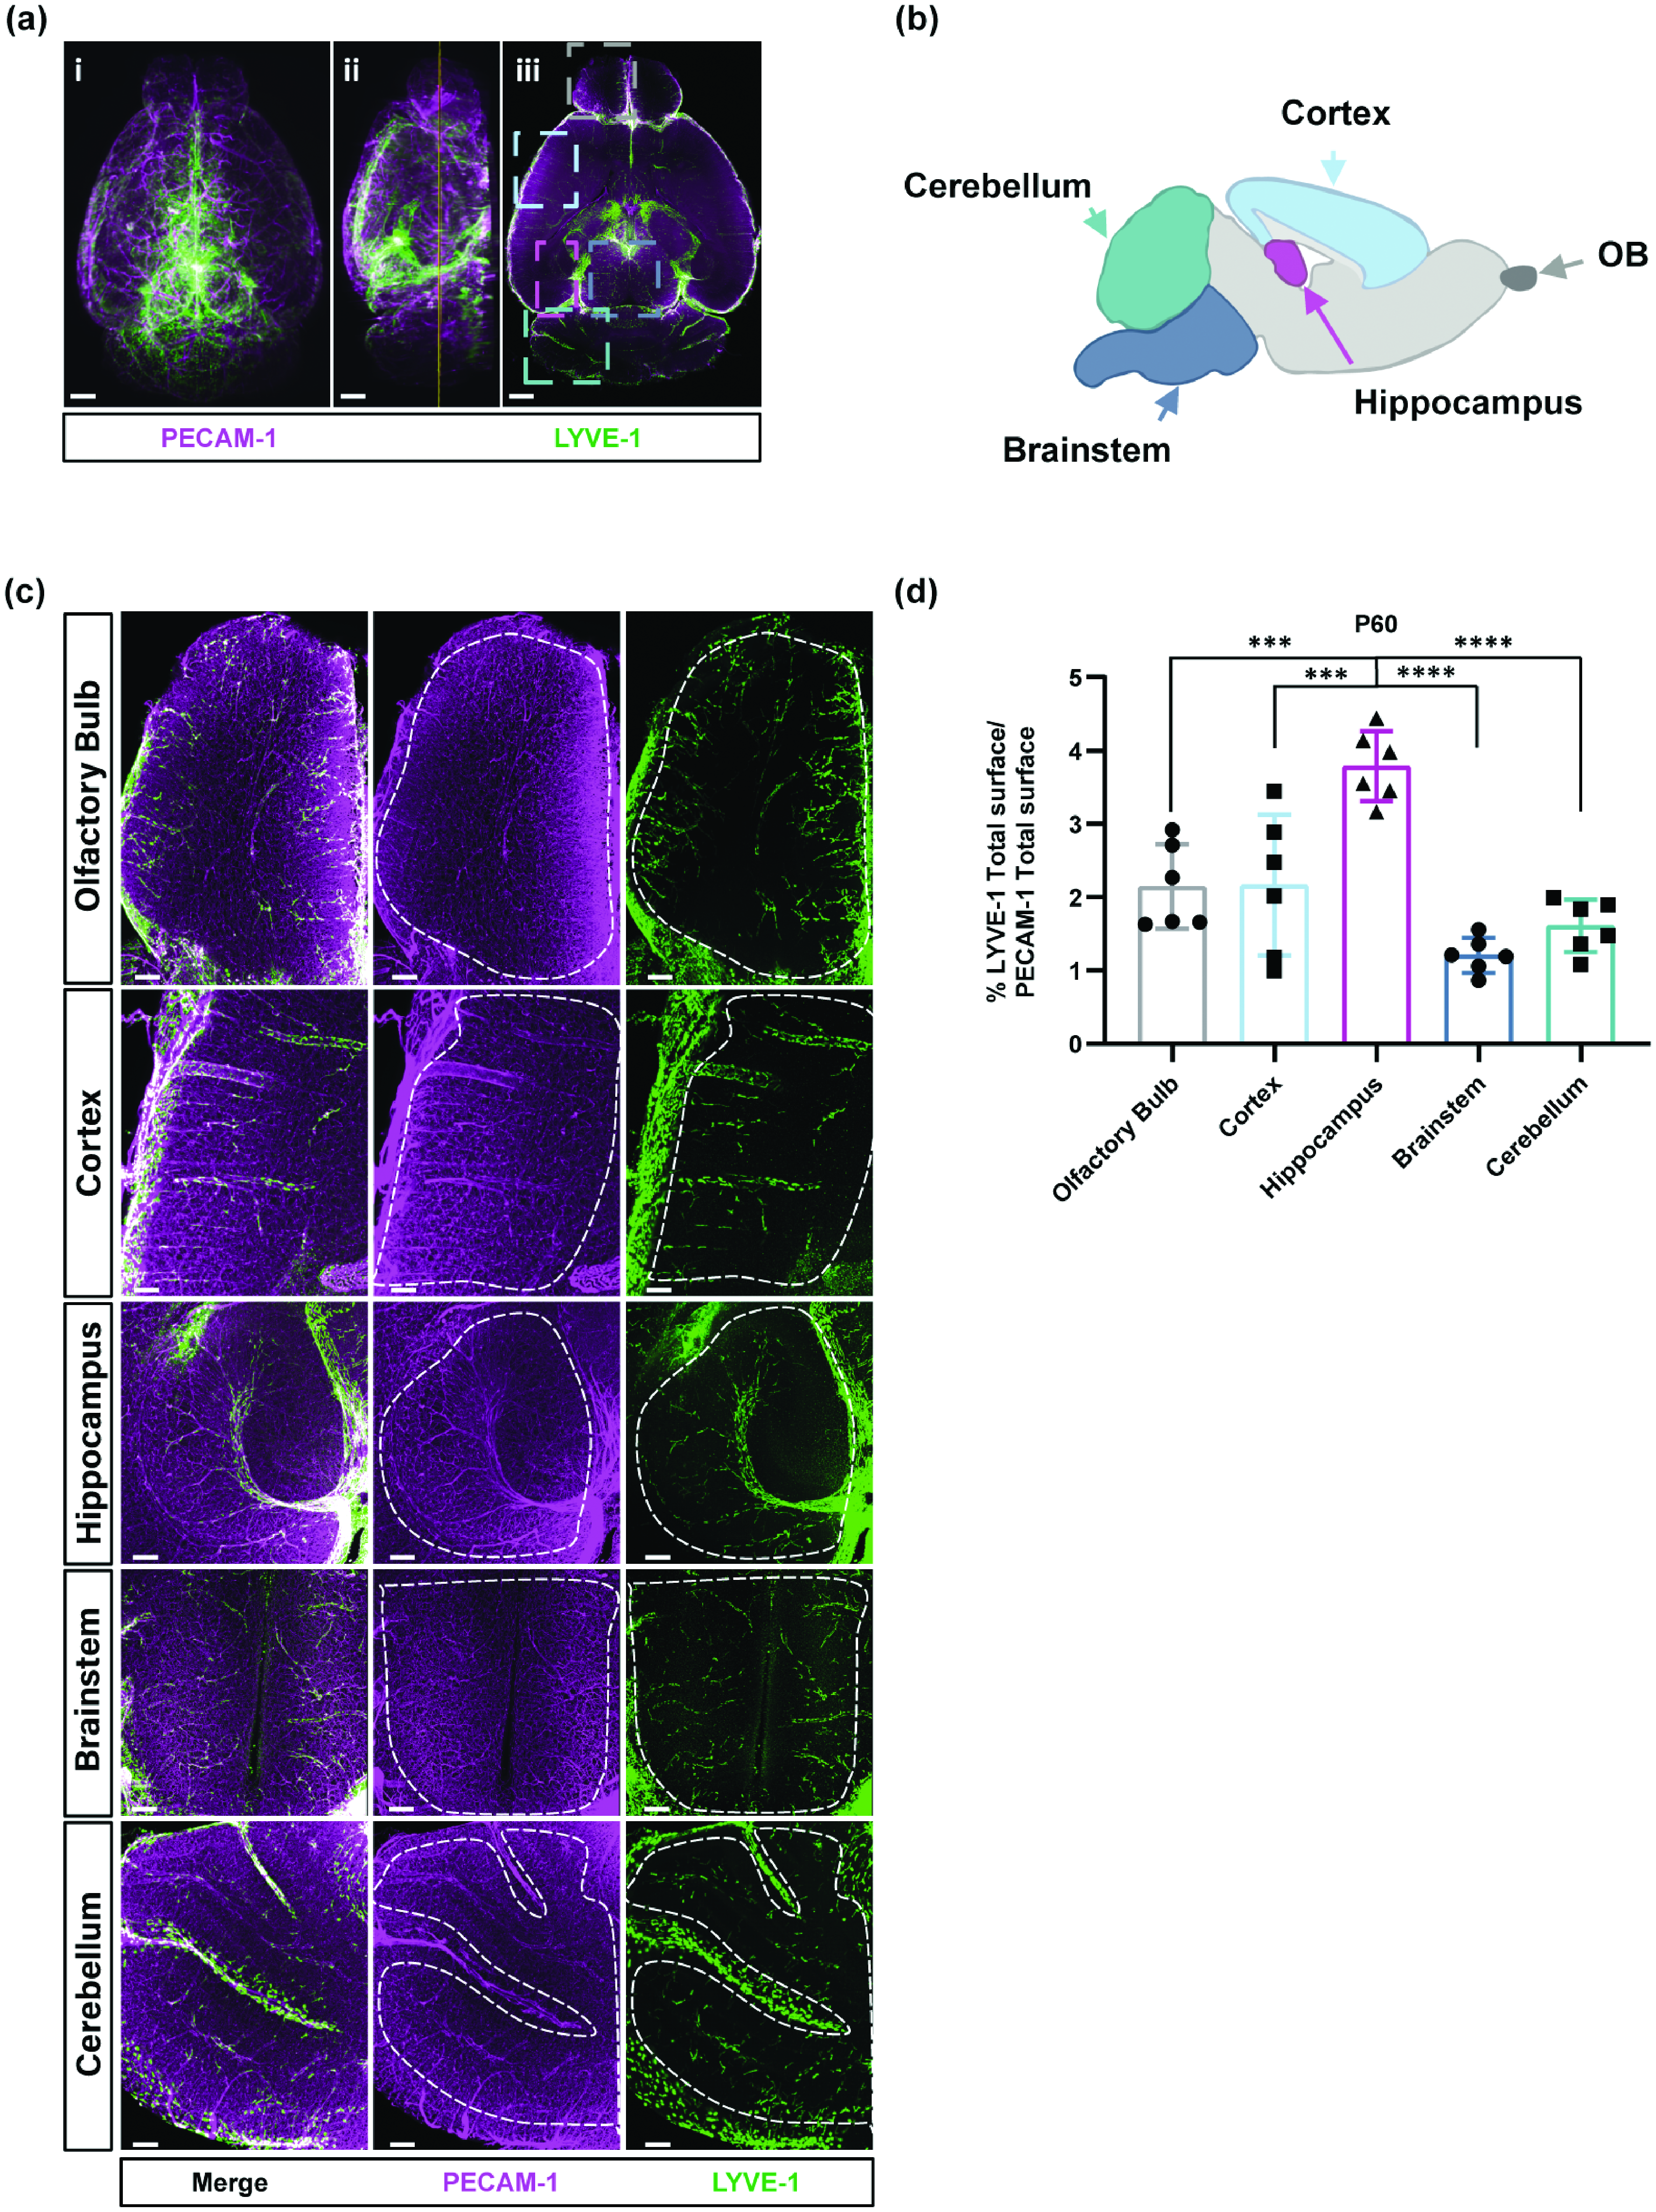
The heterogeneity of BrLyVMs distribution and density in the adult mouse brain revealed by tissue clearing. (a) 3D renderings of dorsal (ai), lateral (aii) and a single-optical slice (aiii) views of LYVE-1 (green) and PECAM-1 (magenta) wholemount immunolabeling. (b) Schematic annotated representation of five brain regions shown in color-coded dashed boxes in aiii. (c) Higher magnification of the boxes highlighted in aiii representing 500µm-thick optical slice. Dashed lines encircle the regions that were used for the analysis (shown in d) and (d) Quantification of LYVE-1 surface area as a fraction of total PECAM-1 surface area in each region shown in (c), each point represents one mouse (n = 6). A one-way ANOVA followed by Bonferroni-corrected t-tests was used to compare regions. All data are presented as mean ± SD. Stars represent the p values for statistically significant tests (***p < 0.001; ****p < 0.0001). Scale bars 700 µm (a) and 200 µm (c).
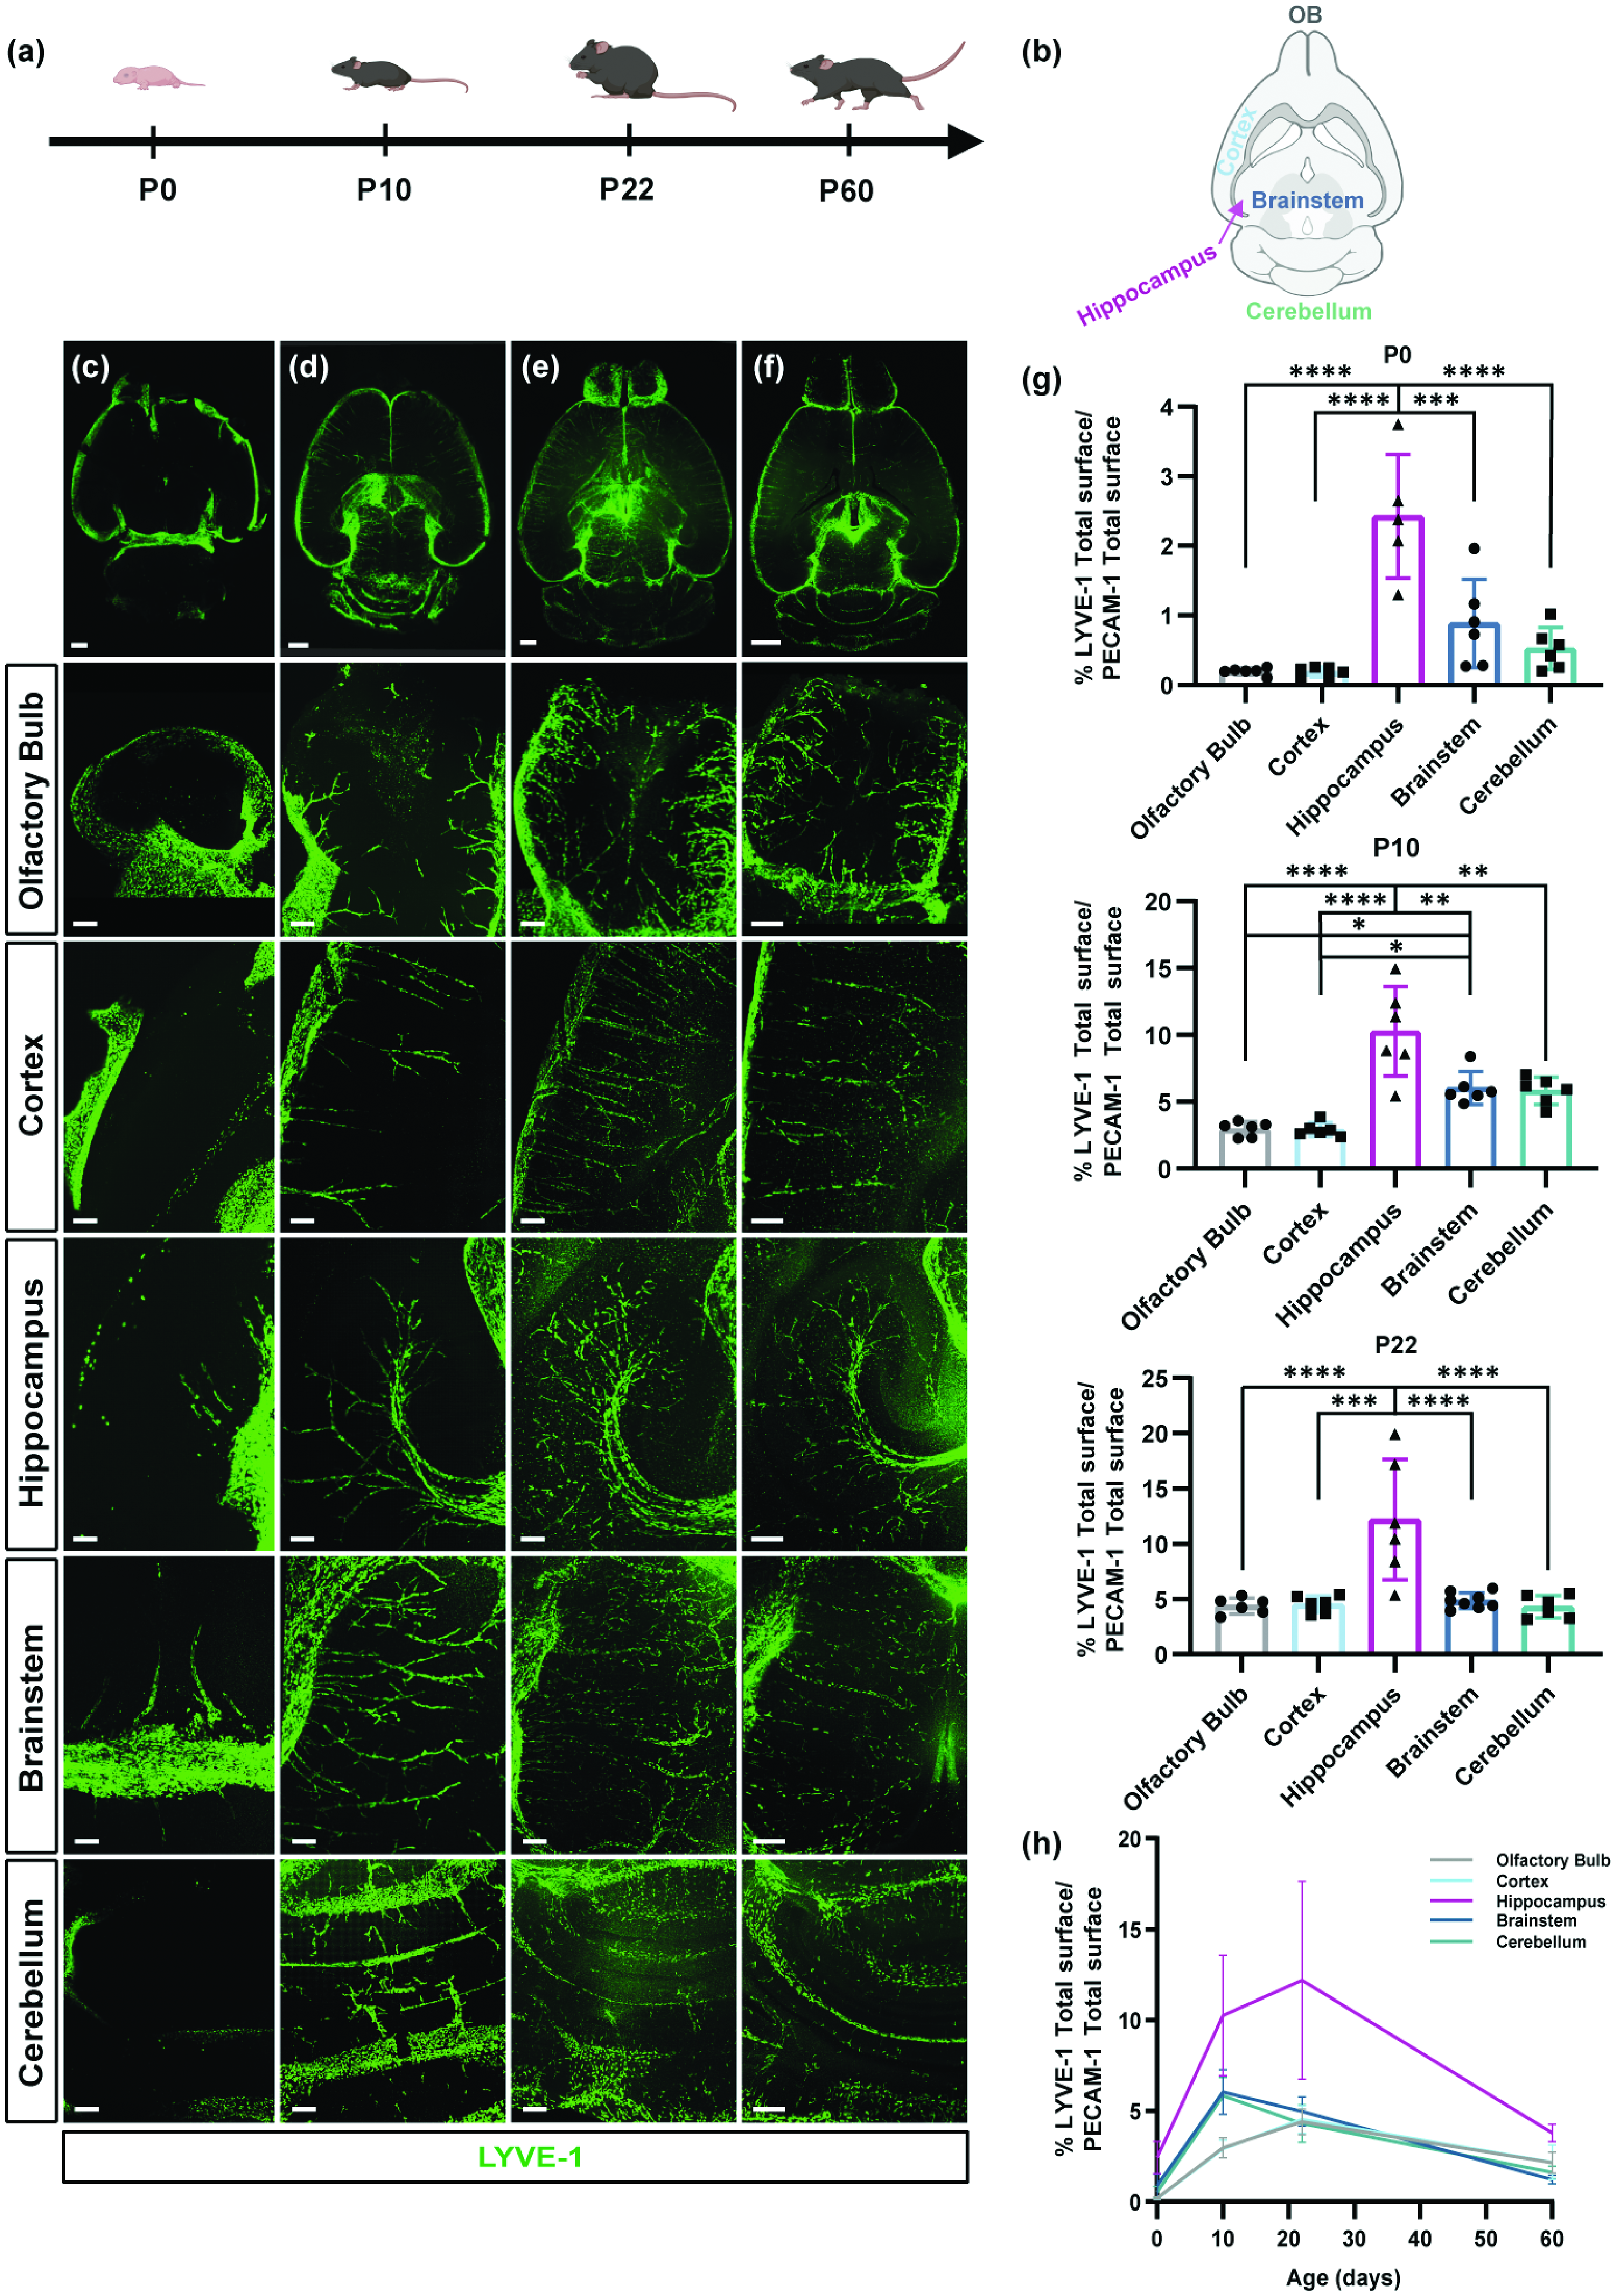
BrLyVMs dynamics at different developmental stages revealed by tissue clearing. (a) Schematic representation of the different developmental stages examined. (b) Schematic representation of the different regions that were used for imaging and for quantification. (c–f) Representative 200 µm optical-slice dorsal views of LYVE-1 (green) wholemount immunolabeling of the olfactory bulb, cortex, hippocampus, brainstem and cerebellum at the different stages. c, d, e and f correspond to P0, P10, P22 and P60, respectively. (g) Quantification of the LYVE-1 surface area as a fraction of the total PECAM-1 surface area in each region at the different developmental stages. Each point represents one mouse (n = 6). For each age-group, a one-way ANOVA test followed by Bonferroni post-hoc test was used to compare regions and (h) Graphical representation of the LYVE-1 surface area as a fraction of the PECAM-1 surface area across the developmental timeline. All data are presented as mean ± SD. Stars represent the p values for statistically significant tests (*p < 0.05; **p < 0.01***p < 0.001; ****p < 0.0001). Scale bars 100 µm (c) and 200 µm (d, e, f).
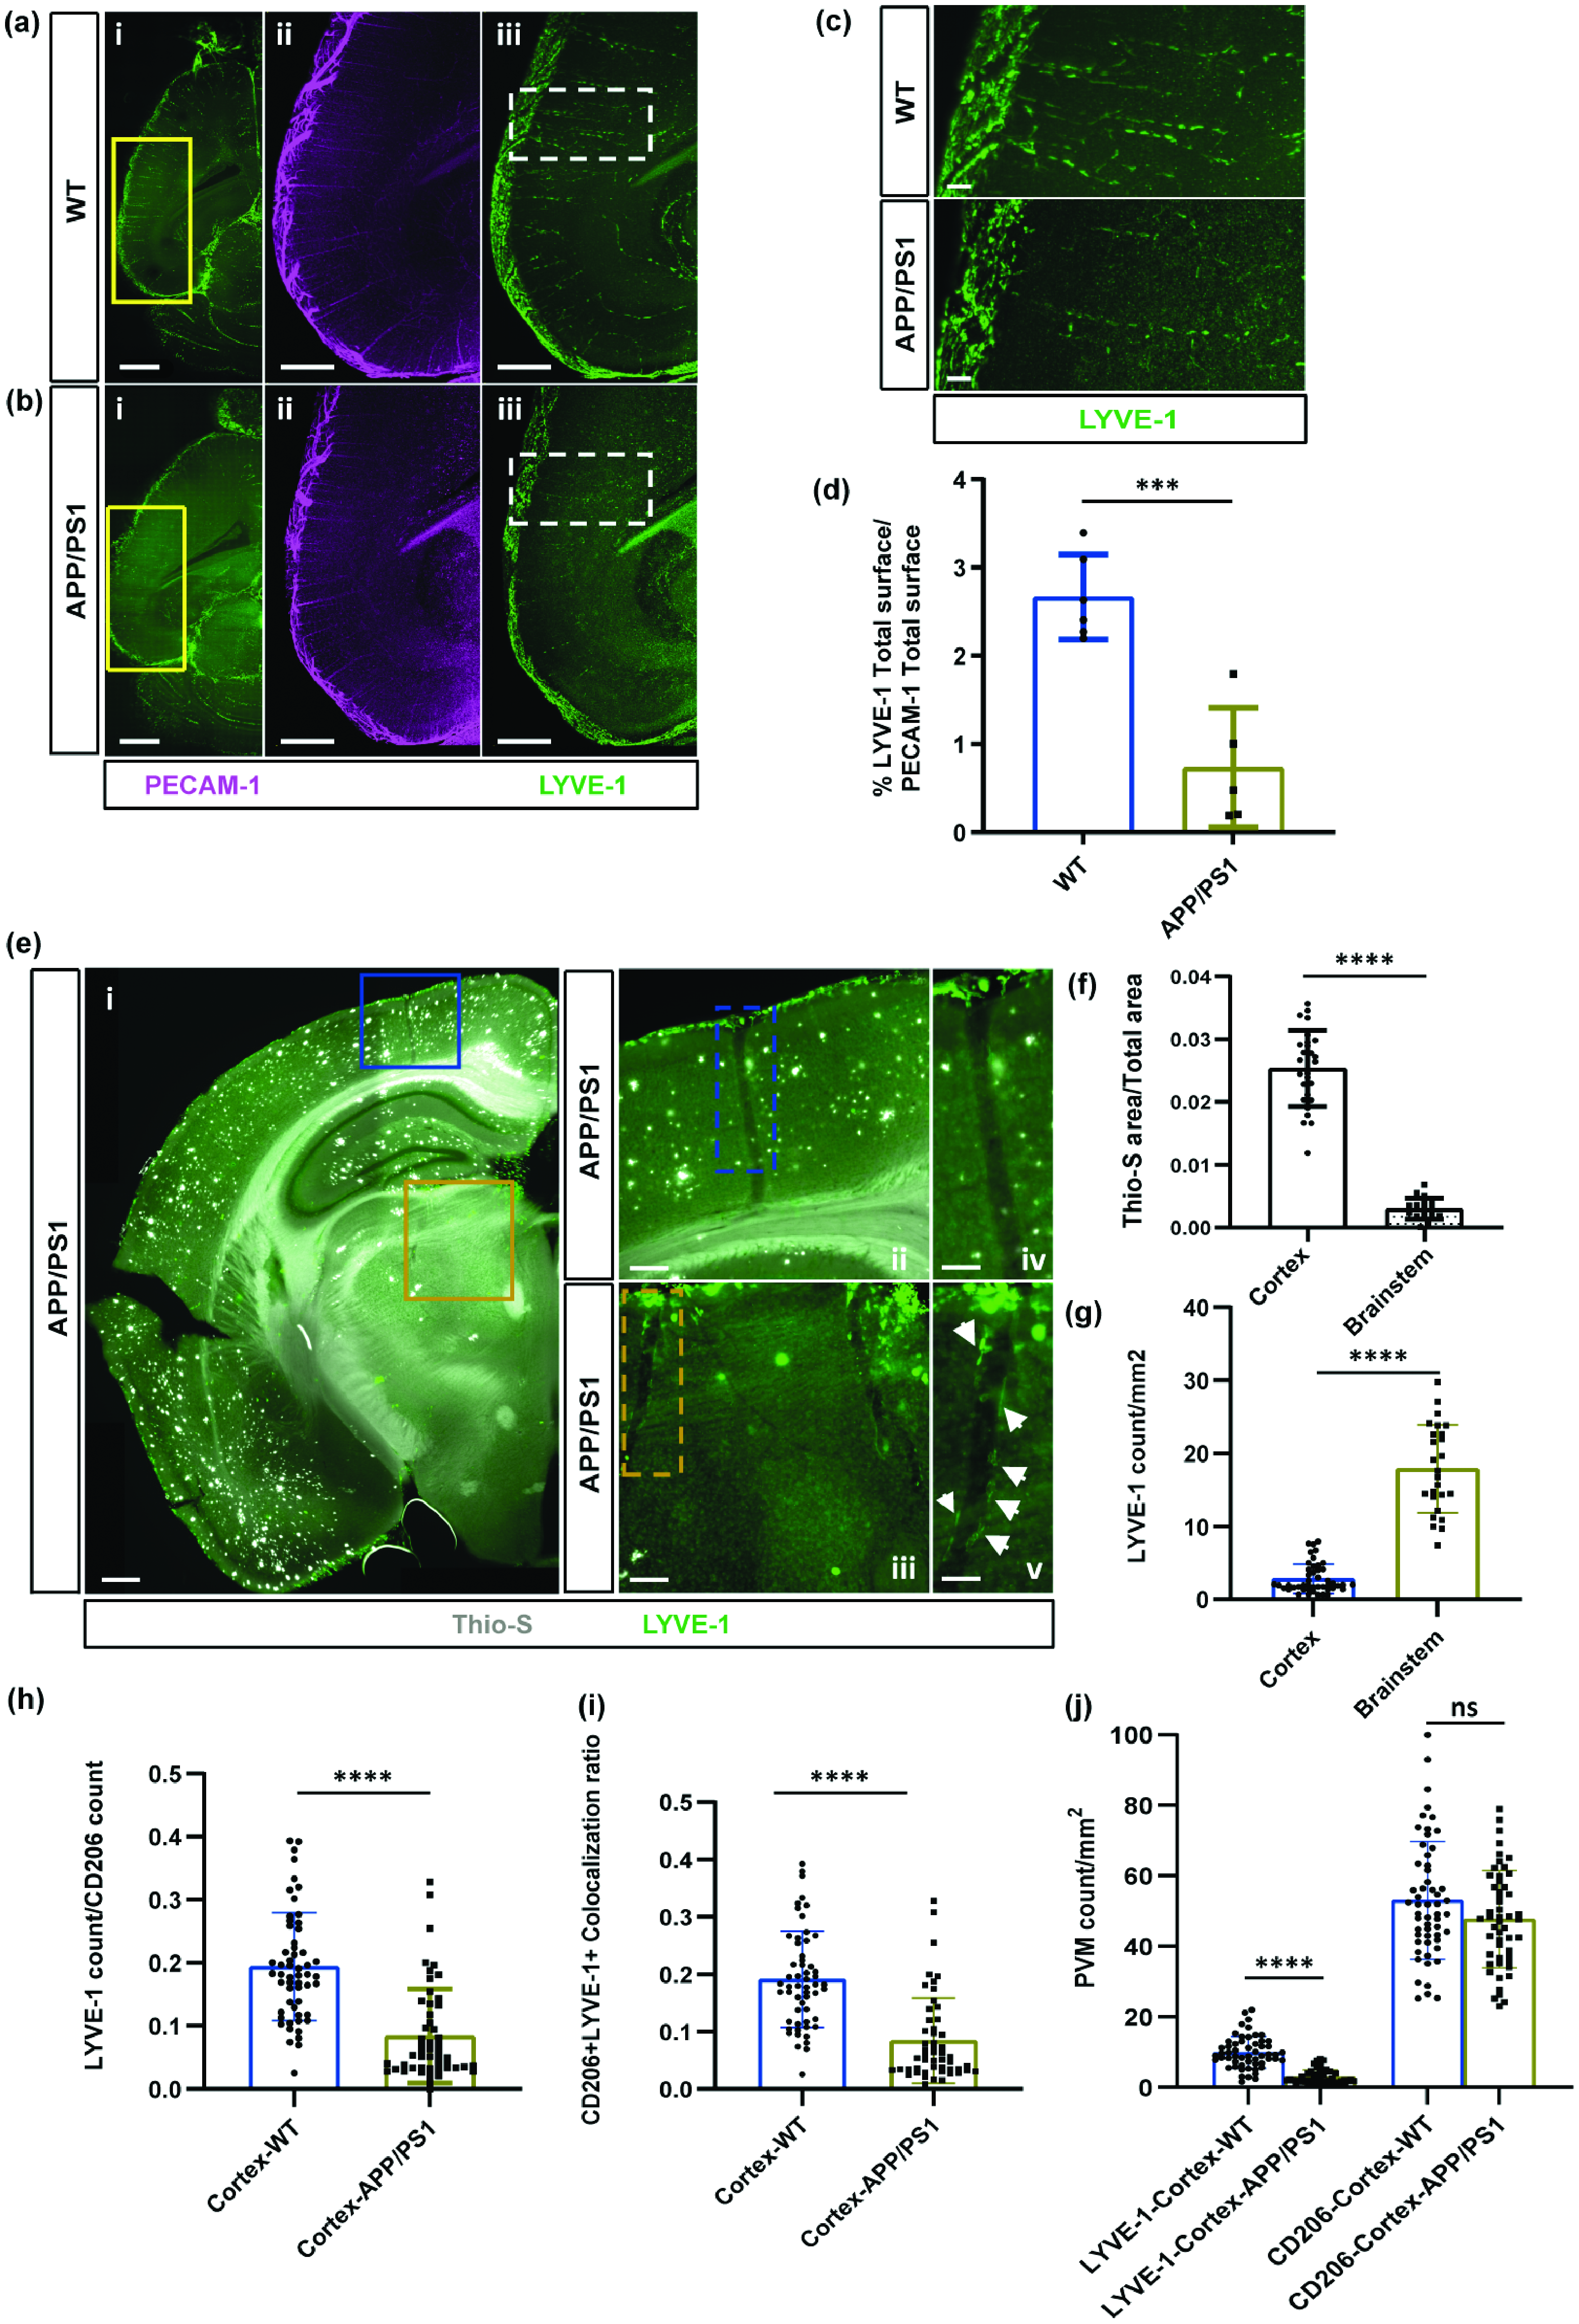
BrLyVMs density changes in the APP/PS1 Alzheimer’s Disease mouse model. (a, b) Representative 200µm optical slice of LYVE-1 (green) and PECAM-1 (magenta) wholemount immunolabeling of WT sibling (a) and APP/PS1 (b) brains at P700 (dorsal view). The yellow boxes in ai and bi are magnified in aii-aiii and bii-biii respectively. (c) Higher magnification of the boxes highlighted in aiii and biii. (d) Quantification of LYVE-1 surface area as a fraction of total PECAM-1 surface area in the cortex of P700 WT siblings and APP/PS1 mice. Data are presented as means ± SDs with each point representing one mouse (n = 6 mice for WT and n = 5 for APP/PS1); and compared using a Student’s t test. (e) Representative images of Thio-S staining in the cortex and brainstem of a P600 APP/PS1 mice. The blue box in ei is magnified in eii and in eiv, and the yellow box in ei is magnified in eiii and in ev. (f) Quantification of Thio-S area as a proportion of the total cortex and brainstem area in APP/PS1 mice. (g) Quantification of LYVE-1 abundance as a proportionContinued. of the total cortex and brainstem area in APP/PS1 mice. (h) Quantification of LYVE-1 abundance over CD206 abundance in the cortex of WT siblings and APP/PS1 mice. (i) Quantification of the proportion of CD206+/LYVE-1+ cells out of all CD206+ in the cortex of WT and APP/PS1 mice and (j) Quantification of the abundance of LYVE-1+ (left) and CD206+ (right) cells per mm2 in the cortex of WT and APP/PS1 mice. For f–i data are presented as means ± SEMs with each point representing a R.O.I; comparisons between the WT (n = 3) and APP/PS1 (n = 3) in each case were made using Mann-Whitney tests. Stars represent the p values for statistically significant tests (ns p ≥ 0.05; ***p < 0.001; ****p < 0.0001). Scale bars 1000 µm (ai, bi), 500 µm (aii–iii, bii–iii, ei), 100 µm (c, eii-iii), 50 µm (eiv-v).
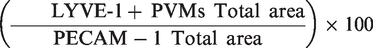
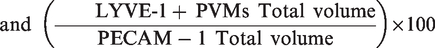
For the quantification process, the brain vessels and LYVE-1 + PVMs were identified, segmented and measured (area and volume) using Surfaces. The ratio calculated to generate LYVE-1 + PVMs region and age dependent density were:
For Figure 6(i) to (j) and Supplementary Figure 7E, CD206, LYVE-1 and Z-stacks were acquired using Axiozoom (Zeiss) at X80 Magnification. Cells expressing CD206 and LYVE-1 were identified visually and counted manually. For Figure 6, analysis was performed without prior knowledge of group allocation.
For Supplementary Figure 1B, C57BL6 mice were stained with CD206 and LYVE-1 and Z-stacks were acquired using Axiozoom (Zeiss) at X40 magnification. Maximal projections were generated with ImageJ software 1.53f51, and each channel was thresholded separately by eye. Particle analysis was used to count segmented objects and the number of cells was extracted.
For Supplementary Figure 7D, using ImageJ software 1.53f51, a thresholding step was made for the Thio-S channel in order to extract its area.
Statistical analysis
All statistics were conducted using GraphPad Prism7 software. For Figures 1(h) and 2(c) and Supplementary Fig 1B, a non-parametric Kruskal-Wallis test was performed followed by a Dunn’s multiple comparisons test. For Figures 2(a) and 6(f) to (j), a non-parametric Mann-Whitney test was performed. For Figure 2(d) Spearman’s Rank correlation tests were used in order to test for associations.
For Figures 3, 4 and 5 and Supplementary Figure 6, a parametric one-way ANOVA test was performed followed by Bonferroni post-hoc test for the mean comparisons between each group. For Figure 6(d) and Supplementary Figure 7B, a parametric student t-test was used. For Figure 6(g), (h) and (j), outliers were identified and removed following the ROUT Method.
All parametric data were represented as mean ± SD, and non-parametric data were represented as mean ± SEM. All sample sizes and p values are indicated in the figure legends. In all instances, n indicated within figure legends represents the number of mice used and numbers of quantified events displayed as scatter dot plots and are referred to in figure legends.
Results
To learn more about the immediate environment in which brain LYVE-1 + PVMs (hereafter referred to as “BrLyVM”) are situated, we co-immunolabeled PECAM-1 to label the endothelium and LYVE-1 to label BrLyVMs. LYVE-1 signal did not co-localize with PECAM-1-labeled endothelium but rather enveloped it, confirming a perivascular localization of BrLyVM (Figure 1(a) and (b), and Supplementary Video 1). While PVMs and parenchymal microglia are known to have common molecular markers, 24 BrLyVMs were elongated and morphologically distinct from microglia, which had a punctate-like staining pattern, as seen by co-immunolabeling for LYVE-1 and for the microglial marker IBA-1 (Figure 1(c)). To better understand where in the perivascular space BrLyVMs are situated, we stained for PECAM-1, LYVE-1 and Aquaporin 4, and found that BrLyVMs were situated between the endothelium and the glia limitans (Figure 1(d)). The signal level of the staining was also measured, confirming the perivascular localization of these BrLyVMs (Figure 1(e) and represented schematically in Figure 1(f)).
The existing uncertainty in the literature regarding the distribution of PVMs around arteries and veins 9 led us to next ask whether BrLyVMs are found around veins or arteries. To address this question, we used the transgenic mouse reporter line CONNEXIN-40-GFP 22 (CX40-GFP) in which arterial endothelial cells express the fluorescent protein GFP. We co-immunostained CX40 mice cortical slices for LYVE-1 and for EPHB4, an established venous marker.25,26 Vessels that were CX40-positive were EPHB4-negative, and vessels that were EPHB4-positive were CX40-negative, indicating that CX40 and EPHB4 exclusively label arterial and venous vascular segments, respectively (Arrows, Figure 1(g), left panel). The LYVE-1 immunolabeling enabled us to detect BrLyVMs around CX40-positive arteries and EPHB4-positive veins (Figure 1(g), right panel).
We noticed that BrLyVMs encircled the cortical vasculature (hereafter, for the purpose of readability, we refer to any vessel that is encircled by BrLyVMs as “LYVessel”) typically in one of three coverage patterns (Figure 1(g), right panel). Pattern I (“linear”) refers to a single chain of BrLyVMs around the vessel. Pattern II (“intermediate”) vessels contained more than one BrLyVM around their cross-section. In addition, pattern II vessels BrLyVMs displayed an irregular cellular shape. Pattern III (“circumferential”) showed a higher density of coverage and an irregular cellular shape (Figure 1(g)).
The presence of BrLyVMs around veins and arteries, and the different coverage patterns that we observed prompted us to ask whether these patterns could be related to the identity of the vessels, i.e. vein or artery, and whether any such association pattern could change during development. We thus co-stained CX40-GFP cortical slices of P11, P22 and P60 mice with EPHB4 and LYVE-1, and analyzed the different patterns in relations to the vessel’s identity and to its diameter, in these three stages. The analysis revealed a few interesting features. Overall, pattern I was associated with small-caliber vessels, while pattern III with large caliber vessels (Figure 1(h) to (j)). Across all age groups, pattern I was more abundant around small-caliber vessels, typically in the range of 10–25 µm in diameter. Pattern II was found in vessels of 15–50 µm in diameter, and pattern III was associated with large vessels in the range of 30 to more than 100 µm in diameter, although vessels of smaller diameter were occasionally also observed (Figure 1(h) to (j)). Of note, no pattern III coverage was detected on arteries at P60, consistent with a potential link between LYVE-1 pattern and arterial diameter that tend to be smaller than venous ones. LYVE-1 coverage could be defined by both the pattern of coverage and the density of LYVE-1 coverage. To understand whether arteries and veins were associated with a similar degree of coverage density regardless of their diameter we analyzed the density of LYVE-1 coverage around arteries and veins in these age groups. We found that coverage densities spanned a large range (Figure 2(a) and (d)) and that at P11 there was no difference in coverage density between veins and arteries (Figure 2(a)). However, at P22 and P60 a significant difference was observed, where veins were covered at higher densities than were arteries (Figure 2(b) and (c)). Moreover, while the coverage density of arteries seemed to diminish with age, that of veins increased between P11 to P22 and then slightly diminished at P60 (Figure 2(a) to (e)). Lastly, to learn more about how coverage density and coverage pattern change as a function of vessel diameter, we analyzed these parameters in arteries and veins in the three postnatal stages. Vessel diameter showed no clear relation with coverage density (Figure 2(f) to (h)) as indicated by a lack of significant correlations (measured by Spearman’s Rank correlation tests) in almost all but one (arteries at P22, Figure 2(g)) condition. However, coverage pattern showed a clear relation with vessel diameter (Figure 2(l) to (k)) with greater diameters being associated with more intermediate and circumferential patterns (all conditions showed significant Spearman’s Rank tests).
We wanted to examine whether perivascular components could account for some of the phenotypic diversity that was observed between the different patterns, notably patterns II and III. In order to do so, we co-stained brain slices for LYVE-1 and for smooth-muscle-actin (SMA), which localizes in vascular Smooth Muscle Cells (vSMCs) around the vessel wall. Interestingly, we found that SMA staining around pattern II LYVessel (Figure 3(a)) was dense and continuous, different than that of pattern III LYVessel (Figure 3(b)) that appeared to be interlaced with LYVE-1.
The morphological diversity that we observed led us to examine whether PVMs and BrLyVMs are molecularly diverse. BAMs are known to express CD206, 27 also known as MRC1, but the relative abundance of CD206 and LYVE-1 in brain tissue has never been visualized in situ.
We thus co-immunolabeled brain slices for these two markers and quantified the number of cells that were positive for each marker in five different brain regions at P60 (Supplementary Figure 1 A-B). We then calculated the ratio of the number of LYVE-1+ cells to CD206+ cells. In order to eliminate intra-regional differences that could arise from the absolute area of the analyzed tissue, we normalized the values to 1mm2. We found that the cortex, cerebellum and brainstem had lower normalized ratios compared to the OB and hippocampus, suggesting that in different regions, CD206 and LYVE-1 are maintained/expressed differently.
In order to understand whether the ratios of LYVE-1 and CD206 are maintained in the cortex during development, we quantified the number of cells that were positive for each marker in the cortex at P11, P22 and P60 (Figure 3(c)) and observed a significant increase in the numbers of detected markers between P11 to P22 (Figure 3(d)). We performed a colocalization analysis and asked what is the fraction of CD206+/LYVE-1+ cells out of all detected CD206+ cells (see Material and Methods). We found that this proportion slightly increases between P11 to P22, and then slightly decreases in P60 (Figure 3(e)) but those were only tendencies and the ratio of colocalization remains significantly stable.
PVMs are not abundant in the brain, 8 and furthermore we noticed that BrLyVMs abundance in the cortex was sparse and occasionally varied between brain regions (not shown). This raised the hypothesis that across different brain regions, BrLyVMs may be associated to different extents with the vasculature, which prompted us to investigate their heterogeneity at a global brain-wide scale. We used the iDisco tissue-clearing method that enables to detect and visualize large volumes of tissue at high resolution. 21 We verified the binding specificity of the LYVE-1 antibody with iDisco (Supplementary Figure 1 C), and then co-immunolabeled entire brains with PECAM-1 and LYVE-1 (Figure 4(a) and (b)). Inspection of immuno-labeled cleared cortical tissue revealed that BrLyVMs covered the endothelium (Figure 4(a) and (c)), in agreement with our results obtained on tissue slices (Figure 1).
We were next curious to understand how BrLyVM are distributed in the brain and whether this distribution is homogenous in nature. Indeed, while examining the cleared immunolabeled brains we noticed that although the fluorescent signal was not ubiquitous as that of PECAM-1 (Figure 4(c)) across the brain, it was nevertheless detectable in specific regions in the brain (Figure 4(c)). We detected LYVE-1 staining in prominent brain structures: the cortex, hippocampus, olfactory bulb, cerebellum and brainstem, indicative of efficient antibody labeling and penetration across the brain. We visually identified gross-level differences in the labeling distribution (Figure 4(c)). To learn more about these differences and about if and how different brain regions differ in BrLyVM density, we proceeded by quantifying our datasets after removal of pial LYVE-1 signal (Supplementary Figure 2). We reasoned that in order to exclude anatomical intra-regional differences in vasculature density, it was necessary to normalize the density of BrLyVMs to that of the vasculature in each region. We thus calculated the fraction of the vasculature that is associated with BrLyVMs by normalizing the surface area of LYVE-1 to that of PECAM-1 in each of the examined regions (see Materials and Methods). We analyzed the olfactory bulb, cortex, hippocampus, brain stem and cerebellum, and found that BrLyVM density varied across these regions and was significantly higher in the hippocampus (Figure 4(d)).
Given that little is known about how BrLyVMs are distributed around the vasculature in the hippocampus, together with the relatively higher density of hippocampal BrLyVMs that we found (Figure 4), we were prompted to examine this region in more detail. We noticed that hippocampal BrLyVMs were distributed in a stereotypical pattern (Supplementary Video 2). To learn more about this pattern, we first co-stained PECAM-1 and LYVE-1 and detected a preferential BrLyVMs association to large-caliber hippocampal vessels (Supplementary Figure 3Ai). We then investigated if in the hippocampus, BrLyVMs are associated with arteries or veins. We co-labeled for LYVE-1 and for arteries, using either the CX40-GFP transgenic mouse line (Supplementary Figure 3Aii) or by co-immunolabeling for SMA to detect the arterial wall28,29 (Supplementary Figure 3Aiii). The results showed that in the hippocampus, BrLyVMs are associated with most if not all arteries. Arrows in Supplementary Figure 3Aiii indicate that LYVE-1 staining alternates with arteries within the hippocampus. We reasoned that this staining could be BrLyVMs that are associated with veins, thus to see whether BrLyVMs are found around hippocampal veins, we analyzed cleared brain samples co-immunolabeled for LYVE-1 and for EPHB4. We found that BrLyVMs are also present around large-caliber hippocampal veins (Supplementary Figure 3B).
The heterogeneity that we observed in different brain regions led us to hypothesize that BrLyVM are dynamic and spatially-regulated over time. The abundance of BAMs and of PVMs in different embryonic mouse stages was recently shown to be developmentally regulated, 13 and we hypothesized that BrLyVMs would display a dynamic organization from early postnatal stages into adulthood. In order to examine this hypothesis, we used whole-brain iDisco clearing of entire brains at P0, P10, P22 and P60 (Figure 5(a) to (f) and Supplementary Figures 4, 5, 6 A–D) and quantified BrLyVMs density as before (Figure 5(g) and (h), and Supplementary Figure 6E-I). We found that at P0, the majority of the LYVE-1 signal was detected in the pia (Figure 5(c) and Supplementary Video 3). Although LYVessels were generally absent at this stage, we could nevertheless identify some, notably in the brainstem and in the hippocampus (Figure 5(c)). At P10 and P22 (Figures 5(d) and (e) respectively) we saw a significant increase in LYVE-1 signal that was concomitantly associated with the vasculature, in the examined brain regions (Figure 5(g) and Supplementary Figures 4, 5 and 6, and Supplementary Video 4). The quantification revealed that while the density of BrLyVMs in the brainstem and the cerebellum peaks at around P10, the same density reaches its peak at around P22 in the other examined regions, namely the olfactory bulb, cortex and hippocampus (Figure 5(g) and (h) and Supplementary Figure 6E-G). Interestingly, a small but significant decrease in the density was noted in all regions by P60 (Figures 4(d) and 5(f) to (h) and Supplementary Figure 6E-I).
The results that we observed during the different developmental stages (Figure 5) suggested that BrLyVM density and number are not constant but are rather dynamically regulated in response to the physiological condition and age of the animal. Interestingly, among the areas investigated, two distinct temporal dynamics were identified, and the hippocampus showed a BrLyVM density that is significantly higher than the one found in all other brain areas over time.
PVMs in the cortex are known to have a role in regulation of vascular amyloid-beta (Aβ) plaques deposition. 30 We thus asked whether we could detect alterations in cortical BrLyVMs density in a mouse model of Alzheimer’s Disease (AD), namely the APP/PS1 transgenic line in which Aβ plaques develop in the cortex, as visualized with Thio-S staining (Supplementary Figure 7 A,B). We first performed PECAM-1 and LYVE-1 immunolabeling on entire brains of 700 days-old mice followed by tissue clearing (Figure 6(a) to (c)). We quantified BrLyVM density after normalizing to the density of the vasculature, and found that it was significantly reduced in APP/PS1 mutants compared to their wild type siblings (Figure 6(d)), indicating that the population of BrLyVMs is altered in the cortex of these mice. This prompted to examine more closely the spatial distribution of plaques and PVMs. We co-labeled brain slices of APP/PS1 mice with Thio-S and LYVE-1 to visualize plaques and BrLyVMs respectively, and quantified the relative abundance of these two markers in the cortex and in the brainstem (Figure 6(e) to (g)). We found that Thio-S staining was more abundant in the cortex than in the brainstem, and surprisingly found that regions that were enriched in Thio-S staining had very little BrLyVM presence, and regions that showed little Thio-S staining were more enriched with BrLyVMs (Figure 6(f) to (g)). We were next interested in knowing whether the phenotype that we observed in the cortex is LYVE-1-specific, or whether CD206 labeling would be modulated as that of LYVE-1 in APP/PS1 mice, and co-immunolabeled cortical slices from these mice with CD206 and LYVE-1 (Supplementary Figure 7C–D). We found that the ratio of LYVE-1 staining to CD206 staining was significantly higher in littermate mice compared to APP/PS1 mutant mice (Figure 6(h)) and a further co-localization analysis of the two markers confirmed that the ratio of the number of CD206+LYVE-1+ PVMs out of all CD206+ PVMs was significantly lower in APP/PS1 mice than littermates (Figure 6(l)). In order to better understand the reason behind this difference, we analyzed separately the abundance of each marker, and noticed that while the number of CD206+ cells remained relatively unchanged in the littermate and APP/PS1 mice, that of LYVE-1 was significantly reduced (Figure 6(j)). This suggests that in APP/PS1 mice, the observed phenotype is specific to LYVE-1, and that the fraction of CD206+/LYVE-1+ is significantly smaller in the cortex of APP/PS1 mice compared to aged-matched littermates. We also detected phenotypical differences in the shape of BrLyVMs in cortical regions where Thio-S staining was not vascular to regions where it was vascular and where Aβ build-up on the vessel wall could be observed (Supplementary Figure 7E–F).
Discussion
Here we studied the postnatal distribution of LYVE-1+ PVMs across the mouse brain by examining different stages from birth until adulthood, and in a mouse model of AD. We used a combination of tissue-specific reporter mice and immunolabeling of brain slices, and immunolabeling of intact brains to detect and visualize BrLyVMs and study how they are distributed around the endothelium across the brain. This methodology proved to be highly reliable and recapitulated hallmark properties of PVMs, and we established iDisco as a bona-fide technique for the study of BrLyVMs. Altogether, these results demonstrate that BrLyVMs occupy different proportions of the vasculature in different brain regions, and that these proportions vary in postnatal stages. While a small percentage of brain vasculature is associated with them, we noticed that some vessels are encircled for considerable lengths, reaching a few millimeters in certain cases (not shown).
We detected BrLyVMs in combination with CX40-GFP labeling to identify arteries and EPHB4 immunolabeling to identify veins (Figures 1 and 2). We found these labels to be specific, which enabled us to study the relative distribution of BrLyVMs around arteries and veins in the cortex, confirming previous studies that suggest that PVMs associate not only with arteries.12,18 Our samples enabled us to detect for the first time different coverage patterns in which BrLyVMs encircle the endothelial wall. The existence of these patterns was confirmed on cleared samples whose structural integrity remained intact.
We thus find that BrLyVMs associate with the vasculature in one of three typical coverage patterns, and our analysis revealed that coverage pattern is correlated to both the identity of the vessel and to its diameter. Thus, the linear pattern I is more associated with small caliber arteries, while pattern III is more abundant around larger caliber veins. Whether this correlation and the distribution patterns of BrLyVMs around arteries and veins in other brain regions is similar to that of the cortex, remains to be explored, but in any case, a differential pattern and coverage density of PVMs around arteries and veins could imply that PVMs may have different roles around arteries and around veins. This furthermore suggests that arterial and venous BrLyVMs may be molecularly distinct, in line with the molecular heterogeneity of arterial and venous endothelial cells. 31
By examining the distribution pattern of BrLyVMs in early postnatal stages we show that there is a considerable difference in BrLyVM density during the first postnatal weeks in a brain-region-dependent manner. BrLyVMs massively populate the brain between P0 to P10, peaking at around P10 or P20, depending on the brain region. We find that at P0, most of the LYVE-1 signal is associated with the pia, although a small number of LYVessels can be detected in specific brain regions, namely the brainstem and the hippocampus. Our results are in agreement with low PVM numbers that are found in E18.5 brains. 13 Between P0 and P10 there is a significant increase in LYVE-1 signal inside the brain, where the signal is detected in BrLyVMs. This suggests that between these two time points there is a massive invasion of BrLyVMs into the brain tissue, in a manner that is similar to the way that microglia colonize the brain until the second postnatal week in mice. 32 From a developmental point of view, our results substantiate the reported cellular plasticity of BAMs during the first few weeks of postnatal development. 14 Future studies focusing on the dynamics and mechanisms underlying PVM movement from the pia to the perivascular position will contribute to the understanding of their overall development and interactions with the brain environment.
The anatomical data we obtained support the view that BrLyVMs are not abundant in the brain, 8 and that they are associated with a small fraction of the vasculature, which suggests a low density of LYVessels in the brain. This raises the possibility that LYVessels have a specific signature that renders them different from neighboring non-LYVessels. This signature could be molecular or functional, or both, and remains to be elucidated, but in any case, our observations are in agreement with the known diversity of BAMs. 14 Thus it is also likely that different sub-classes of PVMs, as identified by the different markers, associate with different vessels and that their ensemble yields a more significant coverage of the vasculature. Indeed, our data shows that CD206, another prominent marker of PVMs, can be used as a marker that labels LYVE-1− PVMs (Figures 3 and Supplementary Figures 1 and 6). The variability that we see in the coverage density between different brain regions is intriguing and is also in-line with previous reports showing that brain endothelium exhibits considerable molecular and functional heterogeneity between different brain regions33,34 and even within-region differences.29,35
We additionally find that in the APP/PS1 AD mouse model there is a significant difference in the density of BrLyVMs in brain regions that contain a high number of plaques versus regions that have a low number of plaques. Regions that were enriched with plaques correlated with low densities of LYVE-1, whereas regions that contained relatively higher levels of LYVE-1 had low plaque numbers. We furthermore show that is specific to LYVE-1, as CD206 levels remain largely unchanged as compared to littermates. This implies that presence of plaques is correlated with BrLyVMs, but exactly how this happens, and whether plaque deposition can be altered by modulating BrLyVM density, remains to be deciphered. Based on our findings here, together with the perivascular location of BrLyVMs, and the suggested perturbations in perivascular clearance routes in AD,36,37 it is possible that BrLyVMs play an important role in the plaque-clearance and thus in the abundance of the plaques. Studies examining more in detail the dynamics of this process across the brain will most likely shed more light on this hypothesis.
So far, BAMs have been characterized mostly in mice, but also in zebrafish and in non-human primates (NHP). Zebrafish BAMs comprise mainly MMs,38,39 and to a lesser extent PVMs and CPMs. 40 Interestingly, zebrafish BAMs are CD206+/LYVE-1+, and in NHP, CD206+ PVMs respond to viral infections.41–43 An across-species molecular and anatomical comparison of BAMs in general, and of BrLyVMs specifically, is expected to yield important insights about the evolution and ontogeny of these cells, and about their functional roles.
In conclusion, we provide here evidence to show that BrLyVMs are unevenly distributed across the brain, and that their distribution changes with age. This population of PVMs is plastic and dynamic overtime. Taken together with the existing evidence about the role of PVMs in general and BrLyVMs in particular, we propose that they play a significant role in brain physiology through currently unidentified interactions with the brain’s vascular system.
Supplemental Material
sj-jpg-1-jcb-10.1177_0271678X221101643 - Supplemental material for Heterogeneity and developmental dynamics of LYVE-1 perivascular macrophages distribution in the mouse brain
Supplemental material, sj-jpg-1-jcb-10.1177_0271678X221101643 for Heterogeneity and developmental dynamics of LYVE-1 perivascular macrophages distribution in the mouse brain by Marie Karam, Hadrien Janbon, Guy Malkinson and Isabelle Brunet in Journal of Cerebral Blood Flow & Metabolism
Supplemental Material
sj-jpg-2-jcb-10.1177_0271678X221101643 - Supplemental material for Heterogeneity and developmental dynamics of LYVE-1 perivascular macrophages distribution in the mouse brain
Supplemental material, sj-jpg-2-jcb-10.1177_0271678X221101643 for Heterogeneity and developmental dynamics of LYVE-1 perivascular macrophages distribution in the mouse brain by Marie Karam, Hadrien Janbon, Guy Malkinson and Isabelle Brunet in Journal of Cerebral Blood Flow & Metabolism
Supplemental Material
sj-jpg-3-jcb-10.1177_0271678X221101643 - Supplemental material for Heterogeneity and developmental dynamics of LYVE-1 perivascular macrophages distribution in the mouse brain
Supplemental material, sj-jpg-3-jcb-10.1177_0271678X221101643 for Heterogeneity and developmental dynamics of LYVE-1 perivascular macrophages distribution in the mouse brain by Marie Karam, Hadrien Janbon, Guy Malkinson and Isabelle Brunet in Journal of Cerebral Blood Flow & Metabolism
Supplemental Material
sj-jpg-4-jcb-10.1177_0271678X221101643 - Supplemental material for Heterogeneity and developmental dynamics of LYVE-1 perivascular macrophages distribution in the mouse brain
Supplemental material, sj-jpg-4-jcb-10.1177_0271678X221101643 for Heterogeneity and developmental dynamics of LYVE-1 perivascular macrophages distribution in the mouse brain by Marie Karam, Hadrien Janbon, Guy Malkinson and Isabelle Brunet in Journal of Cerebral Blood Flow & Metabolism
Supplemental Material
sj-jpg-5-jcb-10.1177_0271678X221101643 - Supplemental material for Heterogeneity and developmental dynamics of LYVE-1 perivascular macrophages distribution in the mouse brain
Supplemental material, sj-jpg-5-jcb-10.1177_0271678X221101643 for Heterogeneity and developmental dynamics of LYVE-1 perivascular macrophages distribution in the mouse brain by Marie Karam, Hadrien Janbon, Guy Malkinson and Isabelle Brunet in Journal of Cerebral Blood Flow & Metabolism
Supplemental Material
sj-jpg-6-jcb-10.1177_0271678X221101643 - Supplemental material for Heterogeneity and developmental dynamics of LYVE-1 perivascular macrophages distribution in the mouse brain
Supplemental material, sj-jpg-6-jcb-10.1177_0271678X221101643 for Heterogeneity and developmental dynamics of LYVE-1 perivascular macrophages distribution in the mouse brain by Marie Karam, Hadrien Janbon, Guy Malkinson and Isabelle Brunet in Journal of Cerebral Blood Flow & Metabolism
Supplemental Material
sj-jpg-7-jcb-10.1177_0271678X221101643 - Supplemental material for Heterogeneity and developmental dynamics of LYVE-1 perivascular macrophages distribution in the mouse brain
Supplemental material, sj-jpg-7-jcb-10.1177_0271678X221101643 for Heterogeneity and developmental dynamics of LYVE-1 perivascular macrophages distribution in the mouse brain by Marie Karam, Hadrien Janbon, Guy Malkinson and Isabelle Brunet in Journal of Cerebral Blood Flow & Metabolism
Supplemental Material
sj-pdf-8-jcb-10.1177_0271678X221101643 - Supplemental material for Heterogeneity and developmental dynamics of LYVE-1 perivascular macrophages distribution in the mouse brain
Supplemental material, sj-pdf-8-jcb-10.1177_0271678X221101643 for Heterogeneity and developmental dynamics of LYVE-1 perivascular macrophages distribution in the mouse brain by Marie Karam, Hadrien Janbon, Guy Malkinson and Isabelle Brunet in Journal of Cerebral Blood Flow & Metabolism
Footnotes
Funding
The author(s) disclosed receipt of the following financial support for the research, authorship, and/or publication of this article: This work was funded by Inserm and Agemed. MK is funded by the French Ministry of Higher Education and Research. GM was funded by College de France and Inserm.
Acknowledgements
The authors would like to thank members of the Brunet lab for technical assistance, Sara Makhoul for assistance with preparing the schematic illustrations and Philippe Mailly and the rest of the Orion imaging facility, CIRB, for their support with the imaging presented in this article.
Declaration of conflicting interests
The author(s) declared no potential conflicts of interest with respect to the research, authorship, and/or publication of this article.
Authors’ contributions
MK, GM and IB contributed to the conceptualization and experimental design.
MK performed experiments and analyzed the data.
HJ performed experiments and analyzed the data.
All authors interpreted the analyzed data.
GM drafted the manuscript.
All authors edited, revised and approved the final manuscript.
Supplemental material
Supplemental material for this article is available online.
References
Supplementary Material
Please find the following supplemental material available below.
For Open Access articles published under a Creative Commons License, all supplemental material carries the same license as the article it is associated with.
For non-Open Access articles published, all supplemental material carries a non-exclusive license, and permission requests for re-use of supplemental material or any part of supplemental material shall be sent directly to the copyright owner as specified in the copyright notice associated with the article.