
Abstract
Hypoglycemia triggers increases in cerebral blood flow (CBF), augmenting glucose supply to the brain. We have tested whether astrocytes, which can regulate vessel tone, contribute to this CBF increase. We hypothesized that hypoglycemia-induced adenosine signaling acts to increase astrocyte Ca2+ activity, which then causes the release of prostaglandins (PGs) and epoxyeicosatrienoic acids (EETs), leading to the dilation of brain arterioles and blood flow increases. We used an awake mouse model to investigate the effects of insulin-induced hypoglycemia on arterioles and astrocytes in the somatosensory cortex. During insulin-induced hypoglycemia, penetrating arterioles dilated and astrocyte Ca2+ signaling increased when blood glucose dropped below a threshold of ∼50 mg/dL. Application of the A2A adenosine receptor antagonist ZM-241385 eliminated hypoglycemia-evoked astrocyte Ca2+ increases and reduced arteriole dilations by 44% (p < 0.05). SC-560 and miconazole, which block the production of the astrocyte vasodilators PGs and EETs respectively, reduced arteriole dilations in response to hypoglycemia by 89% (p < 0.001) and 76% (p < 0.001). Hypoglycemia-induced arteriole dilations were decreased by 65% (p < 0.001) in IP3R2 knockout mice, which have reduced astrocyte Ca2+ signaling compared to wild-type. These results support the hypothesis that astrocytes contribute to hypoglycemia-induced increases in CBF by releasing vasodilators in a Ca2+-dependent manner.
Introduction
Hypoglycemia, a reduction in blood glucose concentration, is a serious complication of insulin treatment for diabetes. 1 The brain is uniquely vulnerable to hypoglycemia due to its high metabolic need and limited energy reserves. 2 Hypoglycemia can cause acute deficits in cognition 3 and, in severe cases, can lead to coma and death. 4 Over time, repeated episodes of hypoglycemia may cause long-term damage to the brain, leading to cognitive decline. 5
Hypoglycemia induces a global increase in cerebral blood flow (CBF) of 8 to 21%,6–10 which leads to increased glucose supply to the brain.11,12 This increase in CBF occurs as blood glucose levels fall below approximately 50 mg/dL in both humans and rodents. Previous research has shown that global increases in CBF are mediated by adenosine signaling.13–15 It is not known, however, whether adenosine acts directly on blood vessels or on some other cellular target.
One potential target for adenosine is astrocytes, the principal glial cells of the brain. Astrocytes control the tone of cerebral blood vessels and respond to adenosine with increases in cytoplasmic Ca2+ concentration.16–18 Increased Ca2+ activity in astrocytes leads to the release of arachidonic acid (AA) metabolites, including the vasodilators prostaglandin E2 (PGE2) and epoxyeicosatrienoic acids (EETs).19,20 Astrocytes provide tonic control of arteriole diameter via cyclooxygenase-1 (COX-1) activity, a prostanoid-synthesizing enzyme upstream of PGE2.21,22 In addition to regulating vessel tone under control conditions, COX-1 and astrocyte Ca2+ also contribute to vasodilation seen during hypercapnia. 23 However, the role of astrocytes in mediating increases in CBF during hypoglycemia has not been previously explored.
In this study, we tested the hypothesis that astrocytes contribute to hypoglycemia-induced increases in CBF. We monitored astrocyte Ca2+ signaling and the diameter of penetrating arterioles in the somatosensory cortex of the awake mouse as hypoglycemia was induced by insulin administration. We find that astrocyte Ca2+ signaling is enhanced during hypoglycemia and that this Ca2+ increase is dependent on activation of adenosine receptors. We further show that hypoglycemia-induced arteriole dilation is dependent on astrocyte Ca2+ increases and on the synthesis of prostaglandins and EETs. Our results demonstrate that astrocytes contribute to arteriole dilation during hypoglycemia, leading to CBF increases.
Material and methods
Ethics statement
All experimental procedures were approved by and adhered to the guidelines of the Institutional Animal Care and Use Committee of the University of Minnesota, which is governed by the “Guide for the Care and Use of Laboratory Animals, 8th edition” of the National Research Council of the National Academies, USA (2011) as well as by the “Animal Care and Use in Research” guidelines of the National Institutes of Health, USA (2021). All experimental procedures adhered to the ARRIVE guidelines.
Animals
Experiments were performed on 12 to 20-week-old male wild-type and inositol 1,4,5-trisphosphate receptor, type 2 (IP3R2) −/− mice on a C57BL/6 background. IP3R2−/− mice were obtained from Dr. J. Chen, University California, San Diego, La Jolla, CA. Male mice were used exclusively as there are known sex differences in response to hypoglycemia where females have lower counterregulatory responses to hypoglycemia in both humans and mice.24,25
Surgery and virus injection
Surgical methods were adopted from a procedure developed by Tran and Gordon. 26 Mice were anesthetized with isoflurane (4% induction, 1.5% maintenance). The bregma, lambda and sagittal sutures were exposed and a titanium headbar was secured to the frontal and parietal bones with cyanoacrylate glue and two screws. A 3 mm diameter craniotomy over the left whisker barrel cortex was performed while keeping the dura intact.
In some experiments, astrocyte Ca2+ signaling was monitored with membrane-tethered GCaMP6f induced by viral transfection. The plasmid gfaABC1D-Lck-GCaMP6f (Addgene plasmid #52924, from Baljit Khakh) was packaged into AAV serotype 5 by Addgene. The promoter and serotype were chosen for selective GCaMP6f expression in astrocytes. 27 750 to 1000 nL of AAV5-gfaABC1D-Lck-GCaMP6f (1 × 10¹² particles/mL) was injected into the barrel cortex 350 to 500 µm beneath the cortical surface through a glass micropipette (35 to 50 µm tip diameter) at 250 nL/min. 28 The cranial window was then rinsed with saline to remove excess blood and the craniotomy covered with a glass coverslip plug (two 3 mm diameter and one 5 mm diameter glass coverslips stacked and glued together) and glued into place with cyanoacrylate glue. The glass window and the headbar were further secured with dental cement.
Cortical imaging
The barrel cortex was imaged in awake mice (Figure 1). Two weeks after surgery, mice underwent two days of acclimation on a treadmill used in the imaging experiments. The treadmill allowed mice to move freely, reducing stress. However, data were taken only when mice were stationary during and for 10 s before a trial began. Experiments were performed 2 to 8 weeks following surgery and viral injection. Prior to an experimental session, mice were injected with 0.05 mL of 3% (W/V) Texas Red dextran (70,000 kDA, Sigma no. D1830) subcutaneously to label vessels for imaging. Mice were then secured by their headbar and imaged with a custom-built two-photon laser scanning (2 P) microscope and a 16X, 0.8 NA objective (Nikon CF175 LWD 16xW) based on a previous design Figure 1(a).29 The orientation of the 2 P microscope objective was adjustable and was oriented perpendicular to the cranial window.
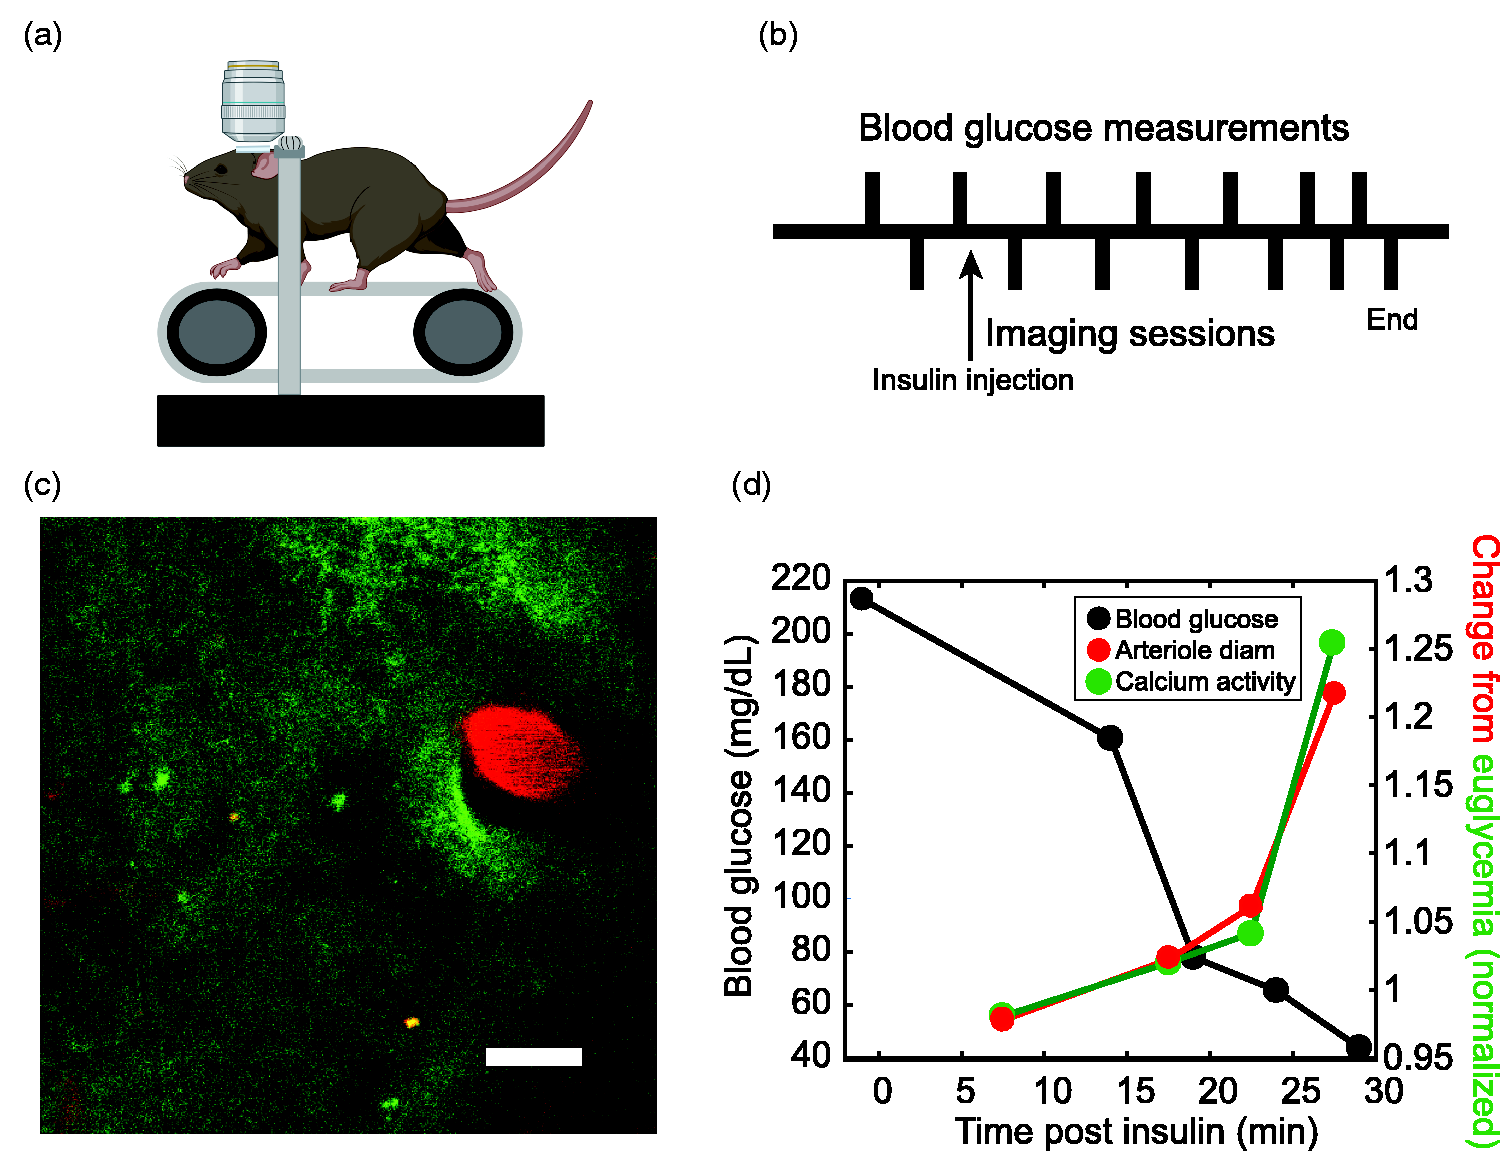
Measurement of arteriole diameter and astrocyte Ca2+ activity during hypoglycemia. (a) Two-photon microscopy imaging of the awake mouse cortex. The head-fixed mouse rests on a treadmill. Drawing created with BioRender.com. (b) Experimental timeline; insulin or insulin vehicle is injected at time = 0. Blood glucose collection points are shown above and interleaved two-photon imaging sessions below the timeline. Blood glucose was sampled at 15 min intervals at the beginning of an experiment and more frequently as the experiment progressed. (c) Example two-photon image of a penetrating arteriole labeled with Texas Red dextran (red) and astrocyte Ca2+ activity indicated by membrane-tethered GCaMP6f (green). Scale bar, 20 µm. (d) Results from one experiment showing arteriole diameter (red) and Ca2+ activity (green) increasing over the course of the experiment as blood glucose levels (black) decrease. Diameter and Ca2+ activity results are normalized to the average euglycemic value.
Two-photon excitation of GCaMP6f and Texas Red dextran was achieved using a Ti:sapphire laser (Chameleon Vision, Coherent) tuned to 925 nm (30 to 65 mW post-objective laser power). Fluorescence was detected using bandpass emission filters (GCaMP6f, Chroma ET525/50m; Texas Red, Chroma ET630/75m) and GaAsP photomultiplier tubes (H10770PA-40; Hamamatsu). Images (512 × 512 pixels) were acquired at 1.07 Hz.
Induction of hypoglycemia and blood glucose monitoring
We utilized a protocol to mimic insulin-induced hypoglycemia (Figure 1(b)). Prior to experiments, mice were fasted for 2 to 4 hours with water given ad libitum and an initial blood glucose reading was taken. An arteriole and astrocyte Ca2+ were then imaged for a “pre” session. Blood glucose was measured again and then insulin glargine (3 U/kg, Sanofi # 00088-2220-33, diluted 1:50 with saline vehicle containing glycerol and ZnCl2 30 ) or control vehicle was injected subcutaneously. After injection, imaging sessions and blood glucose testing were alternated every 5 to 15 min. More frequent blood glucose samples were taken as animals became hypoglycemic in order to detect and prevent severe hypoglycemia. Blood glucose was initially tested with a tail prick and a commercial blood glucose meter (OneTouch Ultra). Subsequent blood glucose testing was achieved by wiping the tail and massaging gently, although, if necessary, the tail was pricked an additional time. Experiments were ended when blood glucose levels dropped below 35 mg/dL or when mice showed signs of distress. Following an experiment, animals were injected subcutaneously with 1 mL of 20% dextrose and allowed food ad libitum.
Imaging sessions consisted of three 30 second trials at 1.07 Hz taken while the mouse was at rest. Animals were monitored with an infrared camera and trials where mice walked, ran, or had large movements in the 10 seconds prior to a trial or during the trial were discarded. Each mouse was utilized for four or fewer episodes of hypoglycemia, spaced at least a week apart to prevent development of compensatory mechanisms to hypoglycemia and to allow animals time to recover from blood draws.
Pharmacology
For pharmacology experiments, an initial imaging session was conducted before drugs were administered. All drugs were dissolved in DMSO which was then diluted in corn oil for a final vehicle concentration of 10% DMSO. 0.1 mL of drug in the DMSO vehicle was injected in mice ∼30 grams in weight, yielding an average systemic DMSO concentration of 0.033%. Animals were injected with either 5 mg/kg SC-560 (Cayman #70340), 20 mg/kg miconazole (Sigma #M3512), 1 mg/kg ZM-241385 (Cayman #20447), or DMSO vehicle. All drugs used are able to cross the blood brain barrier31–33 and were administered by intraperitoneal injection. The drugs did not cause arteriole dilation under euglycemic conditions. Thus, a hypotensive-induced autoregulatory dilation was not present following drug administration. Insulin was administered 30 min after drug injection.
Vehicle control experiments were conducted to ensure that the DMSO vehicle had no intrinsic effects. No differences were seen in mice given DMSO vehicle and data from naïve and vehicle mice were combined in all experiments where DMSO was used.
Analysis
The diameter of Texas Red dextran-filled arterioles (Figure 1(c), red) was measured using a custom MATLAB program. Three lines were hand-drawn at different angles across the diameter of a penetrating arteriole, which was viewed in cross section. The diameter of the vessel was taken as the full width at half maximum of the intensity profiles along the lines. The three diameters were averaged together to account for potential asymmetries in vessel response.
Astrocyte Ca2+ (Figure 1(c), green) was analyzed using AQuA, 34 an event-based analysis program based on machine learning principles. The same AQuA parameters were used in analyzing all Ca2+ data. Unless otherwise indicated, the AQuA “area under the curve” measure of Ca2+ signaling was used to quantify astrocyte Ca2+ activity. Prior to AQuA analysis, all labeled blood vessels and bright autofluorescence debris visible in the Texas Red channel were masked to avoid any bleed-through into the Ca2+ fluorescence channel. Detection of Ca2+ events was robust, as indicated by AQuA z-scores 34 ranging from 4–11. Calcium activity was measured in two astrocyte compartments, endfeet surrounding the arteriole of interest and astrocyte processes. Endfoot activity was measured in an annular region of interest (ROI) with an inner radius at the vessel edge and an outer radius 7.5 µm beyond the edge. Astrocyte process activity was measured in a second annular ROI with inner and outer radii of 7.5 and 15 µm beyond the vessel edge. Measurements were normalized to ROI area.
Statistics
Two sample t-tests and one-way and two-way ANOVAs were used, as appropriate. Experimental data were obtained from wild-type and IP3R2 KO mice (9 male WT mice; 7 male IP3R2KO mice). A subset of these mice was labeled with Lck-GCaMP6f (8 WT mice; 3 IP3R2 KO mice). For each experimental group, data were combined across mice and across session. All data displayed are mean ± SD. Statistical n’s are based on the number of vessel diameter or Ca2+ measurement trials. Each trial represents an average of 3 imaging series. The n’s for each experiment are reported in the Results section and figure legends. Outliers that were 3 scaled median absolute deviations from the median were removed (isoutlier function, MATLAB). Most groups had no outliers, but outliers were removed from some Ca2+ analyses, as indicated in the relevant figure legends. All sets of data had standard normal distributions after outliers were removed, as assessed by the one-sample Kolmogorov-Smirnov test (kstest function, MATLAB).
Results
We tested whether astrocytes contribute to hypoglycemia-induced increases in CBF. We hypothesized that increases in brain adenosine that occur during hypoglycemia 14 activate adenosine receptors on astrocytes, leading to astrocyte Ca2+ increases. These Ca2+ increases, in turn, may result in the production and release of vasoactive molecules which dilate vessels and produce CBF increases. This hypothesis leads to a number of predictions which we have tested: (i) astrocyte Ca2+ activity will increase during hypoglycemia, (ii) reducing this Ca2+ increase will decrease hypoglycemia-induced vessel dilation, (iii) inhibiting the production of vasodilators released by astrocytes will decrease hypoglycemia-induced vessel dilation, and (iv) blocking adenosine receptors will reduce hypoglycemia-induced astrocyte Ca2+ increases as well as vessel dilation.
Arterioles dilate in response to mild and moderate hypoglycemia
We induced hypoglycemia by administration of insulin. Following insulin injection, blood glucose levels dropped continually over a period of ∼1 hour (Figure 1(d)), at which time experiments were terminated. The diameter of penetrating arterioles increased as mice became hypoglycemic (Figure 1(d)). Arteriole dilations occurred both during mild hypoglycemia, defined as glucose = 50–70 mg/dL, and during moderate hypoglycemia, defined as 30–50 mg/dL.
Arterioles dilated in a threshold dependent manner, producing a “hockey stick” shaped relation with the diameter increasing abruptly as blood glucose decreased below ∼50 mg/dL (Figure 2(a) to (c)). Arteriole dilation was not caused by the insulin itself. Following insulin injection, arterioles did not dilate when the animal was euglycemic, defined as glucose >=70 mg/dL (Figure 2(c)). To further control for the possibility of a direct effect of insulin, insulin was co-administered with up to 1 mL of 20% dextrose to prevent hypoglycemia in the presence of insulin. Dextrose administration was adjusted to maintain blood sugar in the euglycemic range. Under these conditions, arteriole diameter did not increase. Instead, a decline in diameter of 4.4% (p < 0.05) was observed after 30–60 minutes (Figure 3(a)).
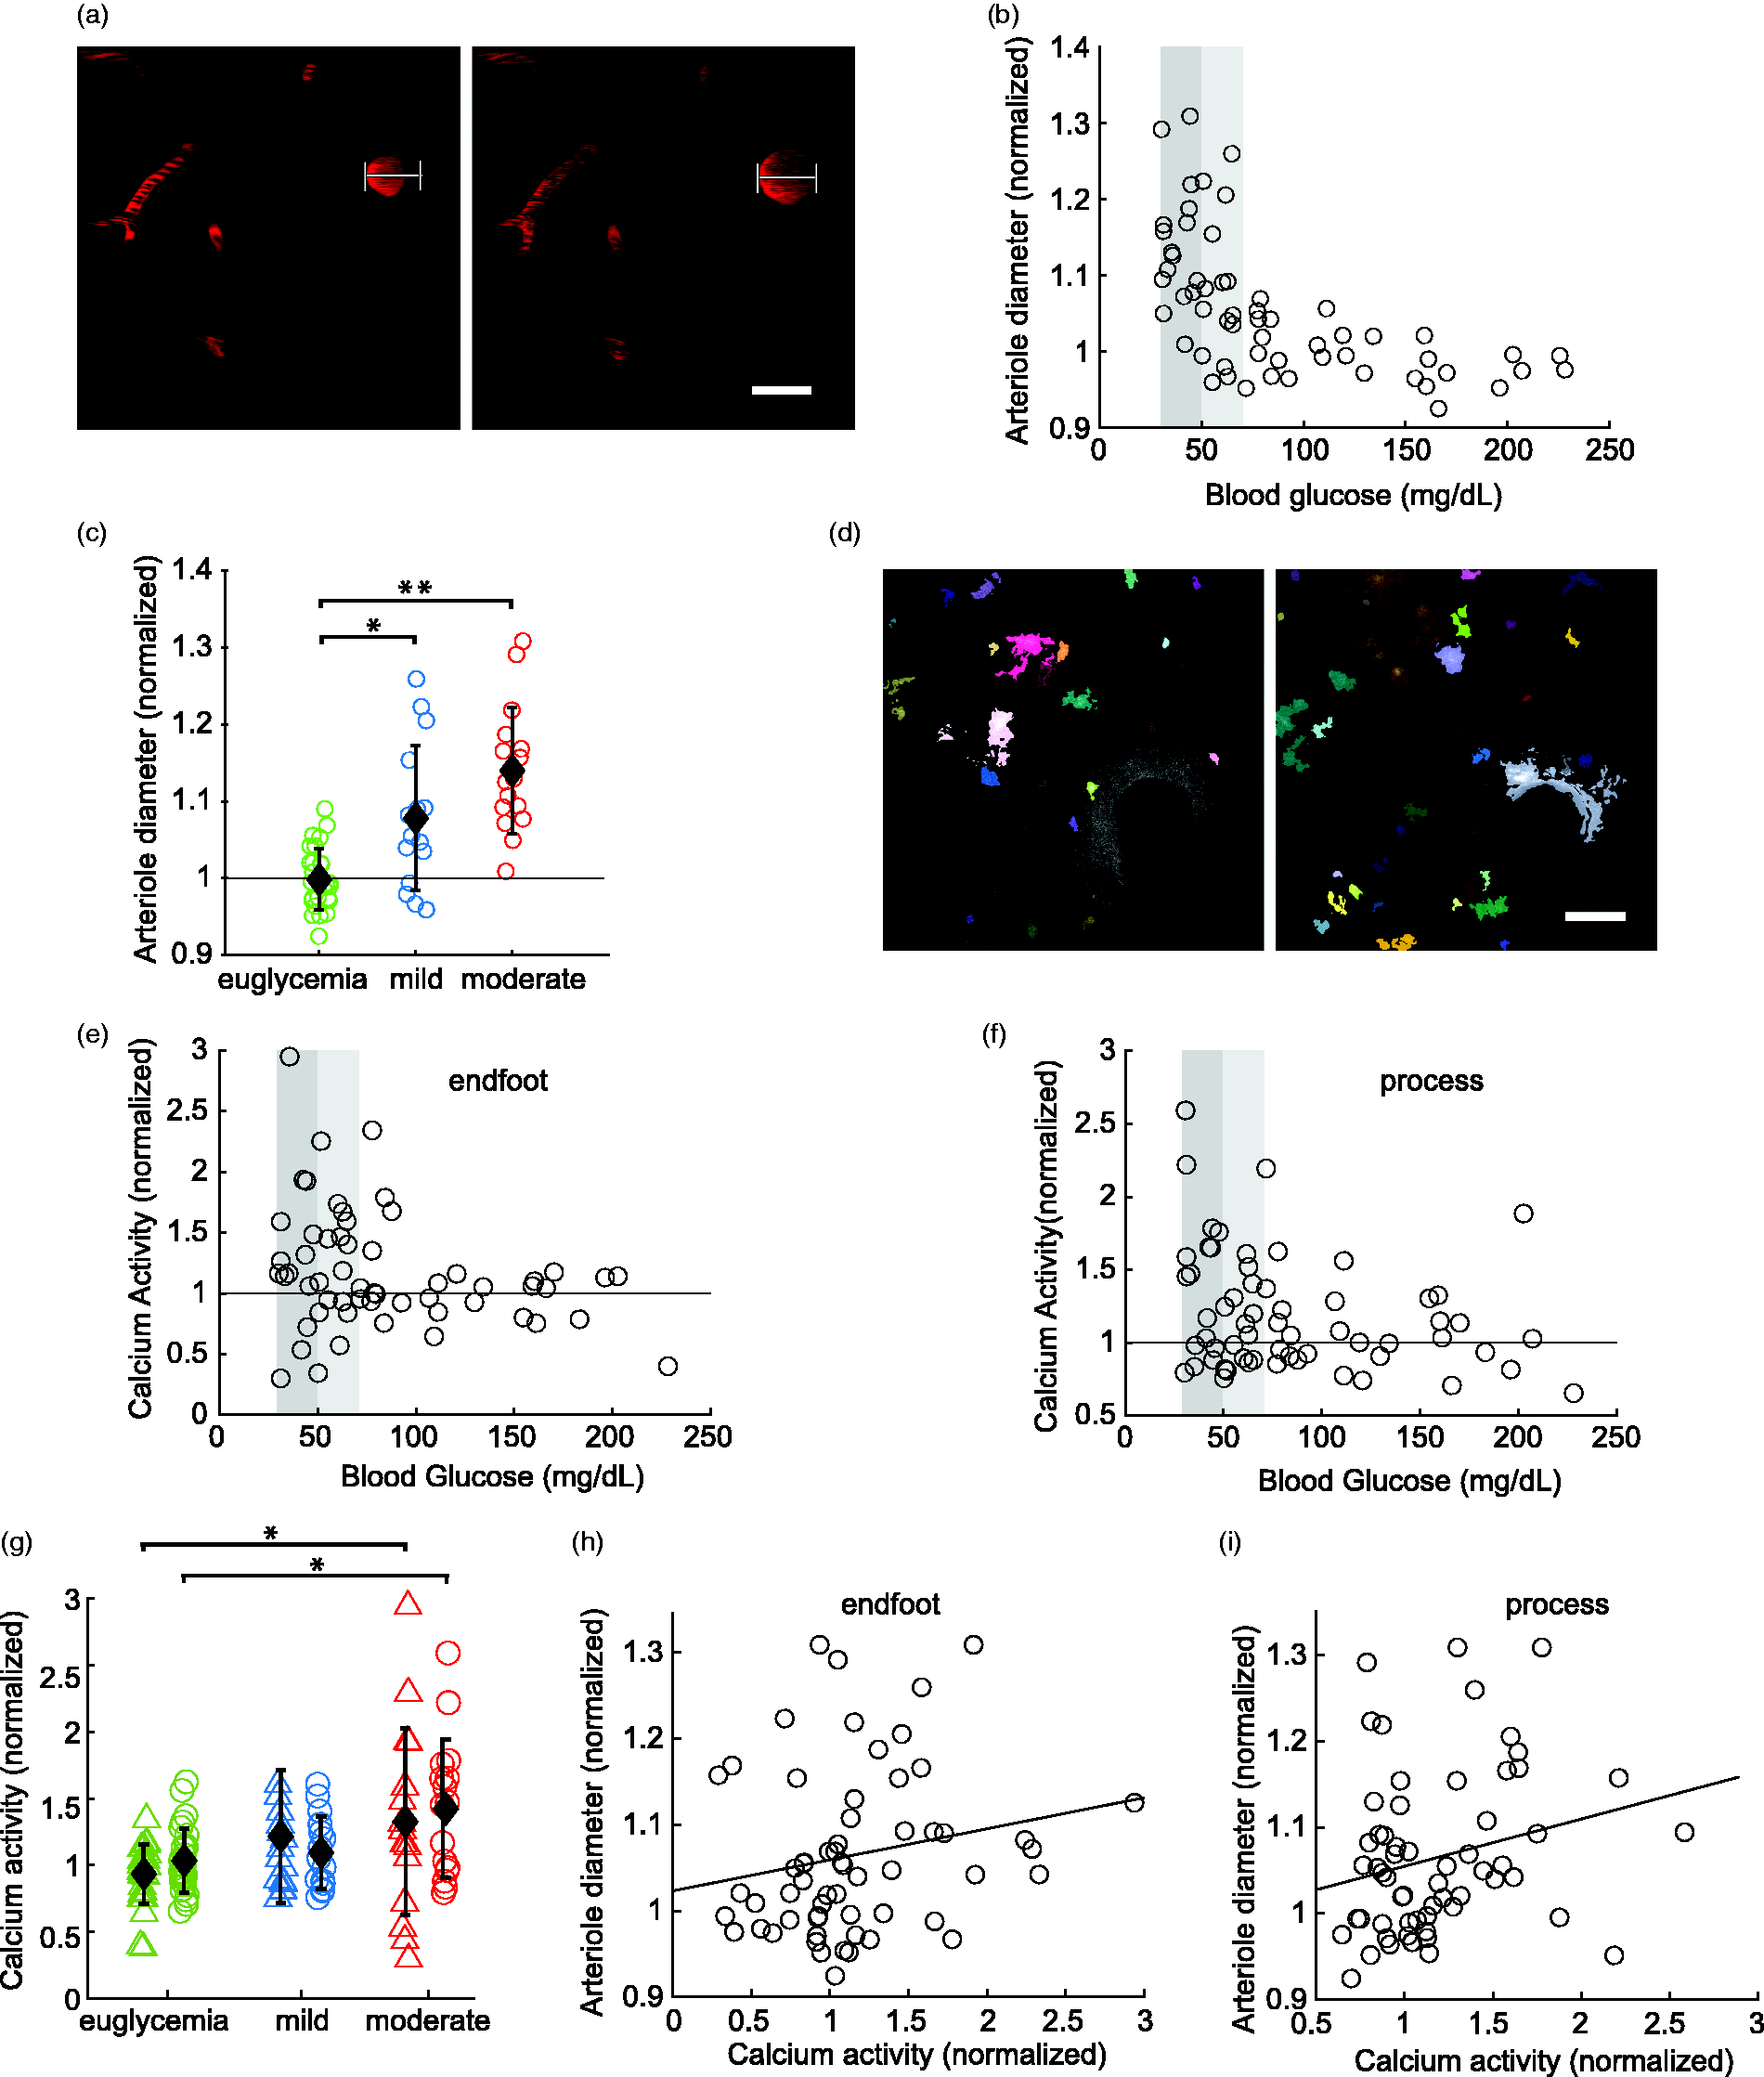
Hypoglycemia increases arteriole diameter and astrocyte Ca2+ activity. (a) Example images of the dilation of a penetrating arteriole during euglycemia (left) and during moderate hypoglycemia (right). White lines denote vessel diameter during hypoglycemia. Scale bar, 20 µm. (b) Change in arteriole diameter as blood glucose decreases. Arteriole diameter is normalized to the diameter prior to insulin administration. Light and dark shaded regions indicate mild and moderate hypoglycemia ranges, respectively. (c) Summary showing changes in arteriole diameter during euglycemia (green; >70 mg/dL), mild hypoglycemia (blue; 50–70 mg/dL) and moderate hypoglycemia (red; 30–50 mg/dL); n = 30, 18, and 19 trials, respectively. (d) Example images showing Ca2+ events in a single image frame during euglycemia (left) and moderate hypoglycemia (right) as determined by AQuA. Scale bar, 20 µm. (e and f) Calcium activityContinued.as blood glucose decreases, measured in astrocyte endfeet surrounding an arteriole (e) and in astrocyte processes (excluding endfeet; f). Calcium activity was normalized to pre-insulin activity levels and was measured as the summed “area under the curve” (see Methods section). (g) Summary showing Ca2+ activity in astrocyte endfeet (triangles) and processes (circles) during euglycemia (green), mild hypoglycemia (blue) and moderate hypoglycemia (red); n = 26, 27, and 15 trials (endfeet) and 15, 16, and 16 trials (processes), respectively. (h and i) Correlation between Ca2+ activity and arteriole diameter in endfeet (h) and processes (i). r = 0.22 and 0.23, respectively. Summary data shown are mean ± SD; *p < 0.05, **p < 0.01; two-way ANOVA.
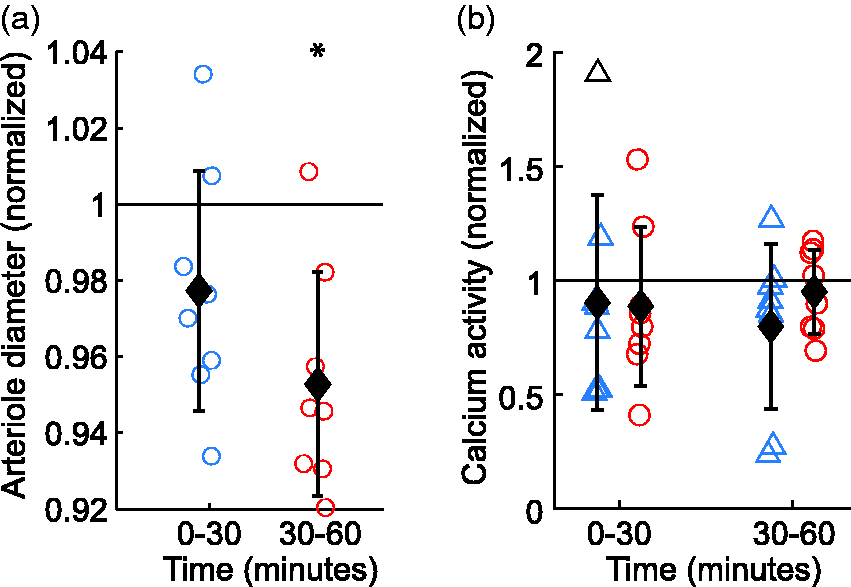
Insulin administration does not induce increases in arteriole diameter and astrocyte Ca2+ activity when co-administered with dextrose to maintain euglycemia in mice that were initially euglycemic. (a) Change in vessel diameter 0 to 30 minutes and 30 to 60 minutes after administration of insulin and dextrose. (b) Change in astrocyte Ca2+ activity in endfeet (triangles) and processes (circles) 0 to 30 minutes and 30 to 60 minutes after administration of insulin and dextrose. For all categories, n = 8. Data normalized to pre-insulin + dextrose measurements. T-test used to compare difference from the null condition of 1. Data are mean ± SD; *p < 0.05.
Calcium activity increases during moderate hypoglycemia
The first prediction of our hypothesis is that hypoglycemia induces increases in astrocyte Ca2+ activity. Changes in astrocyte Ca2+ were monitored using the membrane-tethered genetically encoded Ca2+ indicator Lck-GCaMP6f. Calcium activity was analyzed using the event-based analysis program AQuA. 34 Calcium activity was measured in two astrocyte regions, the endfeet surrounding the arteriole of interest and astrocyte processes within 15 µm of the arteriole. Astrocyte Ca2+ activity increased significantly in both endfeet and processes during moderate hypoglycemia but not during mild hypoglycemia (Figure 1(d), Figure 2(d) to (g)). In control experiments, when insulin was co-administered with dextrose to prevent hypoglycemia, astrocyte Ca2+ activity was unchanged in both endfeet and processes over a 60 min period post administration (Figure 3(b)). The increase in arteriole diameter was weakly, but not significantly correlated with increased Ca2+ activity in both endfeet and processes, (correlation and p values, r = 0.22, p = 0.087 and r = 0.23, p = .072, respectively; Figure 2(h) and (i)). The lack of significant correlation may be due to the large variance in the astrocyte Ca2+ measurements.
Astrocyte calcium activity is reduced in IP3R2 knockout mice
If astrocyte Ca2+ signaling contributes to hypoglycemia-induced vessel dilation, dilations should be smaller when Ca2+ signaling is reduced. This prediction was tested using IP3R2 KO mice, where astrocyte Ca2+ activity is reduced, but not completely eliminated.35–37,44 In order to determine the differences in Ca2+ signaling between IP3R2 KO and wild-type mice in our preparation, we compared the Ca2+ activity of wild-type and IP3R2 KO mice in both endfeet and processes. We analyzed four measures of Ca2+ activity that were computed with the AQuA analysis program, which detects individual Ca2+ transient events: the sum of the area under the curve of Ca2+ events, the total number of events, the average area of events, and event duration (Figure 4(a) to (d)). Under euglycemic conditions, Ca2+ signaling was reduced in IP3R2 KO mice compared to wild-type mice, as shown by decreases in area under the curve (processes, Figure 4(a)), number of Ca2+ events (Figure 4(b), both endfeet and processes), and average area of events (Figure 4(c), both endfeet and processes). Calcium event duration did not change in IP3R2 KO animals (Figure 4(d)).
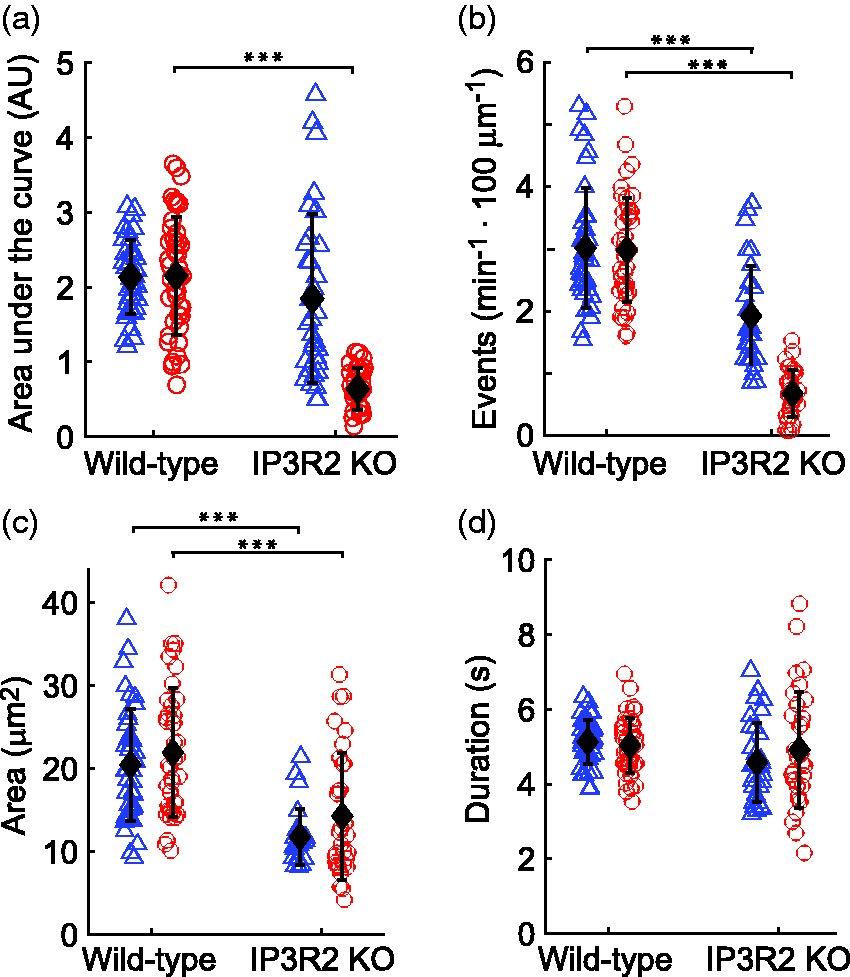
Astrocyte Ca2+ signaling is reduced in IP3R2 KO mice in both endfeet (triangles) and processes (circles). Astrocyte Ca2+ activity, as measured by the area under the curve of Ca2+ events (a), the total number of Ca2+ events (b), the average area of Ca2+ events (c), and the duration of Ca2+ events (d). The area under the curve of Ca2+ events was reduced in processes of IP3R2 KO mice and the size and number of events was reduced in both endfeet and processes of IP3R2 KO mice. For (a–d), n = 38, 44, 32, and 32 for WT endfeet, WT processes, IP3R2 KO endfeet and IP3R2 KO processes, respectively. One-way ANOVA used to compare WT to IP3R2 KO mice. Seven outlier values were removed from (a), 6 from (b), 13 from (c), and zero from (d). Data are mean ± SD; ***p < 0.001.
Arteriole dilation is reduced in IP3R2 knockout mice
Since IP3R2 KO animals have reduced Ca2+ signaling, we next examined hypoglycemia-induced vessel dilation in IP3R2 KO mice. Compared to wild-type animals, arteriole dilation in IP3R2 KO mice was significantly reduced during both mild and moderate hypoglycemia conditions (Figure 5(a)). Arteriole dilations, normalized to euglycemic baseline diameters, were reduced from 1.094 ± 0.090 to 1.038 ± 0.040 in IP3R2 KO mice during mild hypoglycemia, a reduction of 60% (p < 0.05). Arteriole dilations were reduced from 1.142 ± 0.070 to 1.049 ± 0.055 in IP3R2 KO mice during moderate hypoglycemia, a reduction of 65% (p < 0.001). These results support the hypothesis that astrocyte Ca2+ signaling contributes to hypoglycemia-induced vessel dilation.
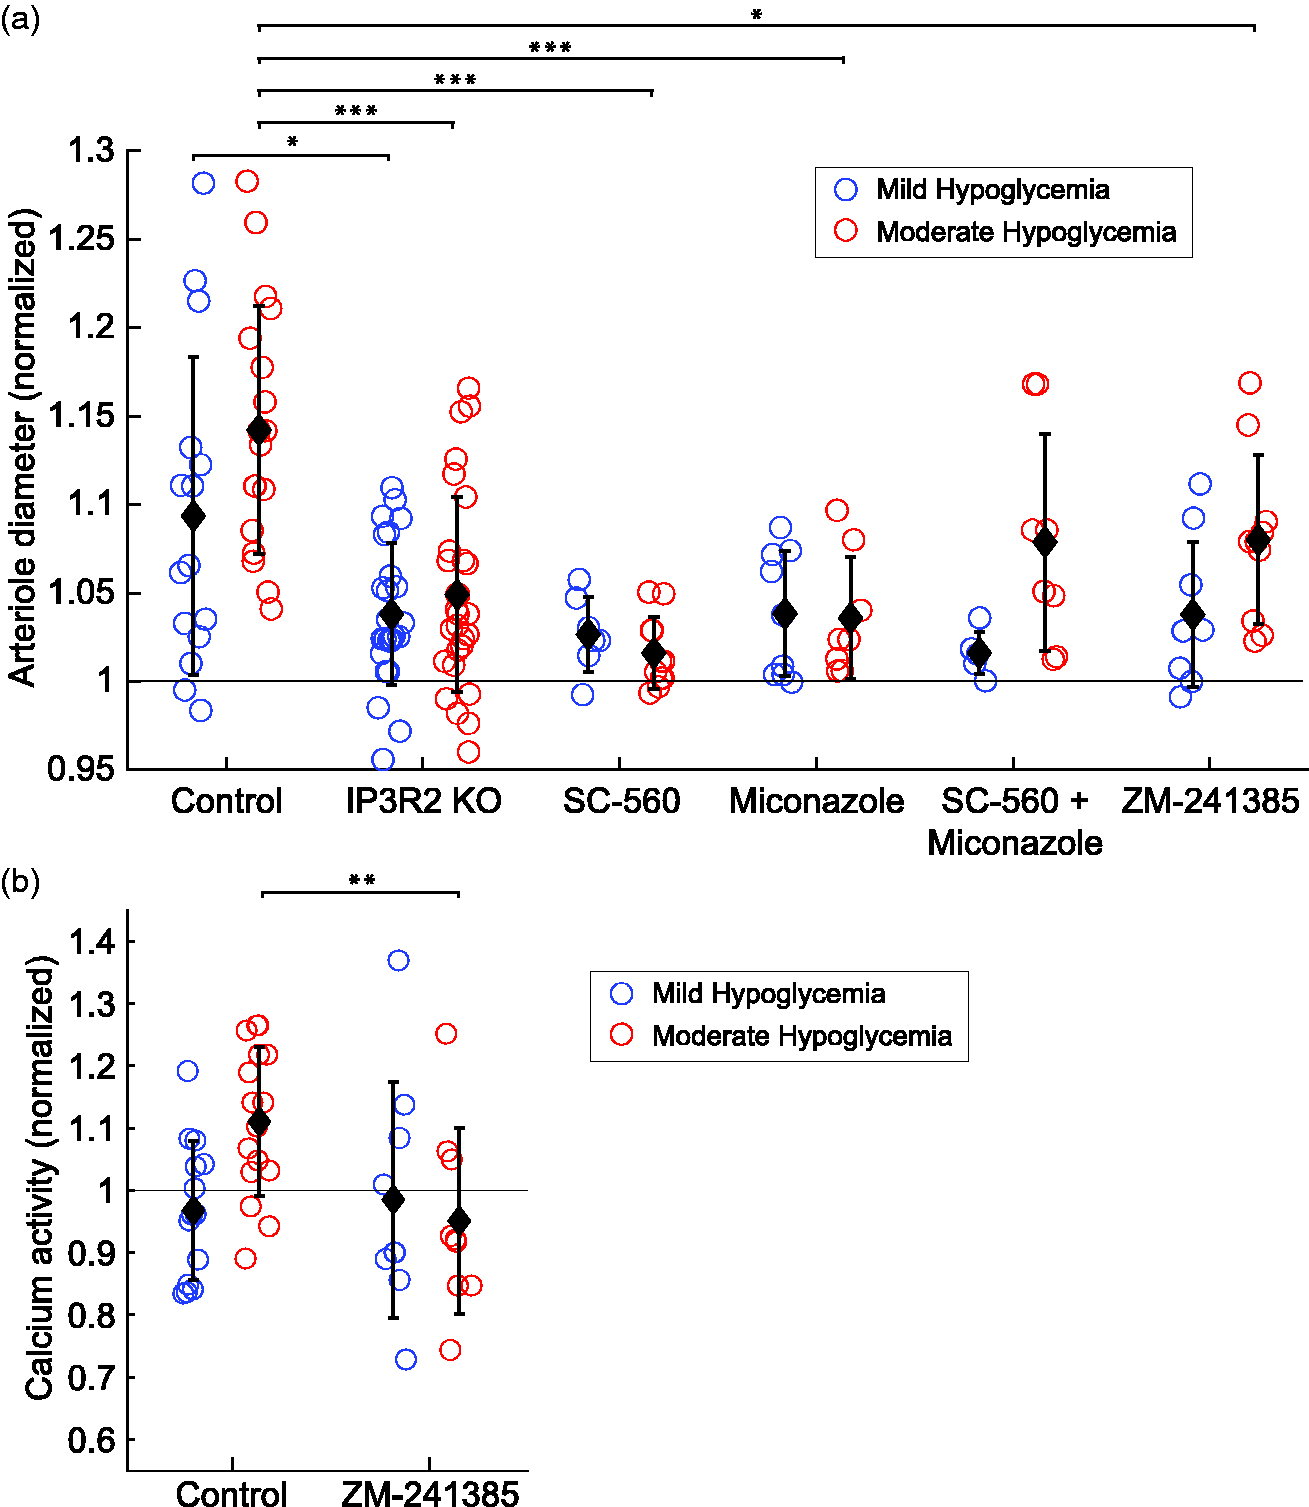
Arteriole diameter and astrocyte Ca2+ activity are altered during hypoglycemia in IP3R2 KO mice and with pharmacological inhibitors. (a) Arteriole diameter change from euglycemia in control mice (n = 15, 18 for mild and moderate hypoglycemia), IP3R2 KO mice (n = 25, 28), and mice given SC-560 (n = 7, 11), miconazole (n = 9, 8), combined SC-560 and miconazole (n = 6, 8), and ZM-241385 (n = 9, 10). (b) Astrocyte Ca2+ activity (endfoot and process, combined) for control mice (n = 14, 16) and mice given ZM-241385 (n = 9, 9). Data are normalized to euglycemia data from the same session. For statistical significance, data are compared to control mice of the same glycemic status using one-way ANOVAs. Data are mean ± SD; *p < 0.05, **p < 0.01, ***p < 0.001.
Arachidonic acid metabolites regulate vessel tone during hypoglycemia
Astrocyte Ca2+ increases lead to the production and release of vasodilators, including PGE2 and EETs.20,31,38 If astrocytes contribute to hypoglycemia-induced arteriole dilation in a Ca2+-dependent manner, it is likely to be mediated by these vasodilators. We tested this prediction by inhibiting the synthesis of prostaglandins and EETs. Production of prostaglandins was blocked by administration of the COX-1 inhibitor SC-560. By inhibiting COX-1, SC-560 blocks the conversion of AA to the precursors of prostaglandins. SC-560 reduced hypoglycemia-induced vasodilation during moderate hypoglycemia (Figure 5(a)). Vasodilations, normalized to euglycemic baseline diameters, were reduced from 1.142 ± 0.070 to 1.016 ± 0.020 with SC-560, a reduction of 89% (p < 0.001).
Production of the vasodilator EETs was blocked by administration of miconazole, an inhibitor of P450 epoxygenase, the EETs synthesizing enzyme. 39 Miconazole also blocked hypoglycemia-induced vasodilation. Vasodilations, normalized to euglycemic baseline diameters, were reduced from 1.142 ± 0.070 to 1.036 ± 0.034 with miconazole, a reduction of 76% (p < 0.001) during moderate hypoglycemia (Figure 5(a)). Somewhat surprisingly, when production of both prostaglandins and EETs were simultaneously blocked by administration of SC-560 and miconazole together, reduction of hypoglycemia-induced vasodilation was not as robust and the decreases in vasodilation were not significant (Figure 5(a)). This may reflect a common final effector or other interaction between the two drugs.
Both prostaglandins and EETs may be released under euglycemic conditions as well as during hypoglycemia. It could be argued that inhibition of these vasodilators may act to reduce hypoglycemia-induced vasodilation, not by blocking release of the vasodilators during hypoglycemia, but rather by tonically constricting arterioles during euglycemia to such an extent that they are unable to dilate during hypoglycemia. We tested this by comparing arteriole diameters under euglycemic conditions in the absence of insulin, both before and after administration of SC-560 and miconazole. Neither drug significantly reduced the diameter of arterioles, even when applied together (Figure 6). Note that the occasional minor reduction in diameter that was observed when these drugs were applied would likely prime the vessels for greater, rather than less dilation. Neither was the reduction in hypoglycemia-induced vasodilation caused by drug-induced vasodilation, which might also diminish vasodilation in response to hypoglycemia. Neither drug increased arteriole diameter during euglycemia (Figure 6).
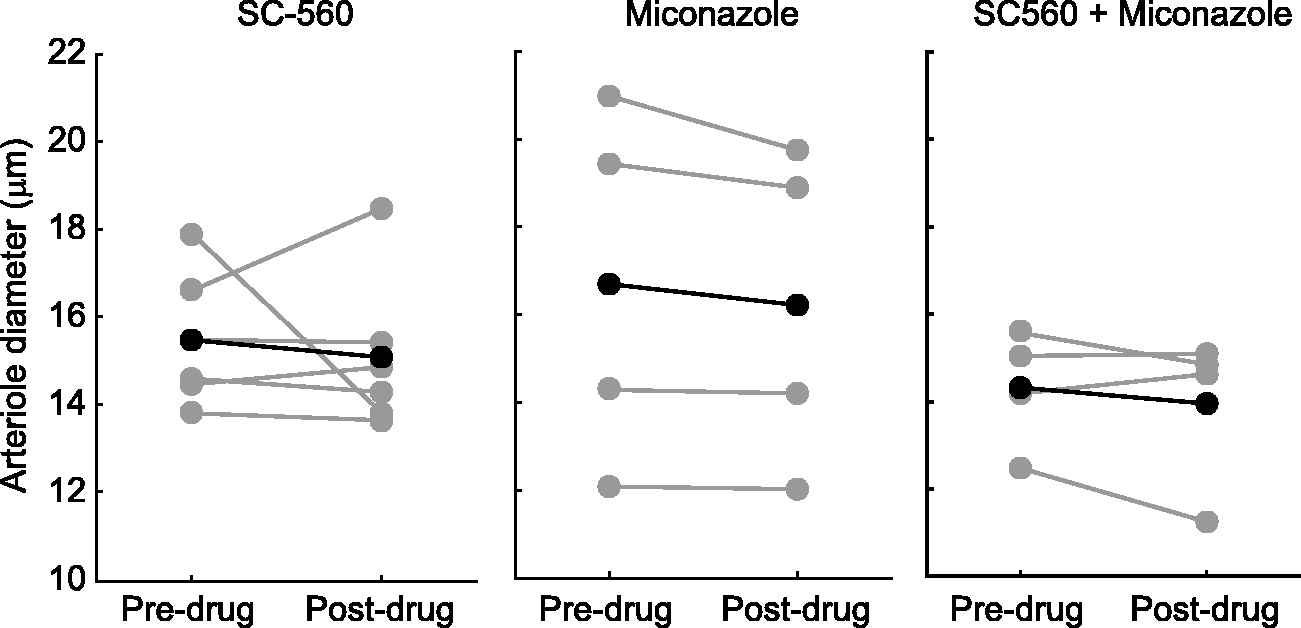
Inhibition of PGs and EETs synthesis does not constrict arterioles. Arteriole diameter before and after administration of SC-560 to inhibit PG synthesis (n = 5), miconazole to inhibit EETs synthesis (n = 4), and administration of combined SC-560 and miconazole (n = 4). Individual trials (gray circles) and means (black asterisks) are shown. Student’s t-test comparing pre-drug to post-drug arteriole diameter. No results were significantly different.
Inhibition of A2A adenosine receptors eliminates astrocyte calcium responses and reduces arteriole dilations
Adenosine receptor antagonists reduce hypoglycemia-induced increases in CBF.13–15 We predicted that these antagonists should reduce hypoglycemia-induced increases in astrocyte Ca2+ signaling as well as vessel dilation. We tested this prediction by administering ZM-241385, a selective A2A adenosine receptor antagonist. Consistent with previous work, ZM-241385 reduced hypoglycemia-induced vasodilation. Vasodilations, normalized to euglycemic baseline diameters, were reduced from 1.142 ± 0.070 to 1.080 ± 0.048, a reduction of 44% (p < 0.05) during moderate hypoglycemia (Figure 5(a)). Hypoglycemia-induced increases in astrocyte Ca2+ signaling were blocked completely in the presence of ZM-241385. Calcium activity was lower during moderate hypoglycemia than during the control period (Figure 5(b)).
Additional controls were conducted to determine whether ZM-241385 by itself modified astrocyte Ca2+ signaling. In the absence of insulin administration, there was no significant difference in the level of astrocyte Ca2+ activity between ZM-241385 and controls (p > 0.5; n = 7 and 15, respectively; data not shown).
Discussion
It is well established that hypoglycemia leads to increases in CBF.11,12,14,15 It was not known, however, which vessels within the brain contribute to these CBF increases. Using two-photon microscopy to image vessels in the awake mouse somatosensory cortex, we have demonstrated that hypoglycemia induced by insulin administration results in the dilation of penetrating arterioles. These dilations occur in a threshold-dependent manner, as blood glucose drops below approximately 50 mg/dL. This finding is consistent with previous studies showing that CBF increases during neuroglycopenia, a shortage of glucose in the brain, in both rodent models and human fMRI studies.11,12 Although not investigated in this study, capillaries within the brain and arteries on the pial surface of the brain may also dilate during hypoglycemia and contribute to CBF increases.
The cellular mechanisms that mediate hypoglycemia-induced increases in vessel dilation and CBF increase remain uncertain. Astrocytes are known to control the tone of arterioles and capillaries within the brain,19,20 and we have tested the hypothesis that astrocytes contribute to hypoglycemia-induced increases in vessel dilation. We found that hypoglycemia evokes an increase in astrocyte Ca2+ activity, demonstrating that astrocytes respond to changes in glycemic status. Both astrocyte endfeet and processes respond to hypoglycemia with increases in Ca2+ activity. Both cellular compartments could contribute to vessel dilation, although it is likely that endfoot Ca2+ increases contribute more as previous studies have demonstrated that increases in endfoot Ca2+ result in arteriole dilation.35,40,41 Increases in astrocyte Ca2+ signaling have previously been linked to the synthesis and release of vasodilating molecules and the dilation of brain vessels 22,23,40,42 and we tested whether these Ca2+ increases mediate hypoglycemia-induced vessel dilation. We used the IP3R2 KO mouse, where Ca2+ release from internal stores is blocked in astrocytes. 43 In line with previous studies, we found a strong reduction, but not a total elimination, of Ca2+ activity in both endfeet and processes of KO animals.36,37,44
Our finding that hypoglycemia evokes increased astrocyte Ca2+ activity suggests that astrocytic glial cells contribute to hypoglycemia-induced vasodilation. We tested this hypothesis by monitoring vessel diameter in IP3R2 KO animals. Arteriole dilation was significantly reduced in these mice during both mild and moderate hypoglycemia, indicating that the release of Ca2+ from internal stores plays a contributing role in vasodilation. IP3R2 KO mice still displayed significant arteriole dilations during mild and moderate hypoglycemia, however, indicating that additional pathways contribute to vessel dilation.
The IP3R2 KO mouse is a global knockout and an important limitation of the model is that there may be effects on cell types other than astrocytes that express IP3R2 receptors. Although IP3R2 receptors are expressed primarily in astrocytes in the brain, 45 they are also expressed in vascular endothelial cells including those of the basilar artery. 46 In addition, arteriole tone might be altered in IP3R2 KO animals, affecting their ability to dilate. However, previous research from our lab 35,47 and others 43,48,49 has shown that arteriole diameter and arteriole dilation evoked by sensory or electrical stimuli are not altered in IP3R2 KO mice, indicating that arterioles within the CNS of KO mice are functionally normal in most contexts. This leads us to focus on astrocyte Ca2+ as a potential mechanism of hypoglycemia-induced vasodilation.
Brain adenosine levels increase during metabolic stress and hypoglycemia 14 and are believed to mediate hypoglycemia-induced CBF increases.13–15 Adenosine can signal directly to endothelial and smooth muscle cells to cause vasodilation 50 and may be responsible for the residual dilation seen in IP3R2 KO mice. Additionally, neurons may release AA and its metabolites, which can act directly on vessels or diffuse into astrocytes to be further converted to vasodilators in a Ca2+-independent process. 51
Adenosine signaling may contribute to the observed increases in astrocyte Ca2+ activity, as astrocytes express A2A adenosine receptors and activation of these receptors leads to increased Ca2+ signaling.16–18 We found that the increase in Ca2+ activity observed during moderate hypoglycemia was completely blocked by the addition of the A2A adenosine receptor antagonist ZM-241385. The receptor antagonist also reduced vessel dilation during moderate hypoglycemia, in agreement with previous studies which have shown that non-selective adenosine receptor antagonists reduce CBF during hypoglycemia.13–15 Our results demonstrate that A2A receptors contribute to this increase in CBF.
The A2A receptor antagonism reduced but did not eliminate hypoglycemia-induced vasodilation, indicating that other adenosine receptors may be involved. A2B receptors are expressed on endothelial cells and smooth muscle cells 52 and these receptors may also contribute to an adenosine-mediated vasodilation. A2B receptors mediate pial vasodilation during autoregulation, 53 suggesting that they may contribute to vessel regulation during hypoglycemia.
The vasodilators prostaglandins and EETs are synthesized and released from astrocytes in a Ca2+-dependent manner.19,20 Increases in astrocyte Ca2+ activate phospholipase A2 and phospholipase D2, which results in the conversion of membrane phospholipids to AA.19,54 Arachidonic acid, in turn, is enzymatically converted into PGE2 by COX-1. We found that inhibiting the synthesis of these vasoactive molecules reduces vasodilation during moderate hypoglycemia, demonstrating their role in hypoglycemia-induced vasodilation. Although prostaglandins are released from both neurons and astrocytes, COX-1 is highly expressed in astrocyte endfeet and is required for astrocyte-mediated vasodilation.31,54 EETs are similarly released from astrocytes in a Ca2+-dependent manner and have been shown to mediate vasodilation.55–58 Blocking the synthesis of either prostaglandins or EETs significantly reduced arteriole dilations, with prostaglandin inhibition having the larger effect. Interestingly, blocking the synthesis of both vasodilators simultaneously did not lead to a significant reduction in vasodilation. This may be due to interactions between COX-1 signaling and EETs synthesis, where inhibiting COX-1 can increase EETs production. 59
An important caveat to these experiments is that, in addition to astrocytes, vascular endothelial cells are sites of EETs production.60,61 Reduction of hypoglycemia-induced vasodilation by inhibiting EETs synthesis may reflect an endothelial cell as well as astrocyte contribution. A potential off target effect of EETs inhibition by miconazole is that the drug also inhibits inducible nitric oxide synthase (iNOS). Previous studies have shown, however, that increased CBF during hypoglycemia is NOS-independent. Another consideration when inhibiting prostaglandins and EETs is basal vasoconstriction. Inhibiting these vasodilators can cause vasoconstriction,21,39,62 which can affect a vessel’s potential to dilate. In our preparation, however, no significant constriction was seen after administration of either SC-560 or miconazole.
Increases in astrocyte Ca2+ may also lead to the release of adenosine from astrocytes, either directly or via the release of ATP, which is rapidly converted to adenosine by ectonucleotidases 63,64 and could act on vessels. This additional astrocyte signaling mechanism is likely to occur, although it was not examined in this study.
Taken together, our results support a novel mechanism for mediating hypoglycemia-induced increases in CBF where adenosine acts to increase astrocyte Ca2+ activity via A2A adenosine receptors, which then causes the release of prostaglandins, EETs and perhaps adenosine, leading to the dilation of brain arterioles (Figure 7).
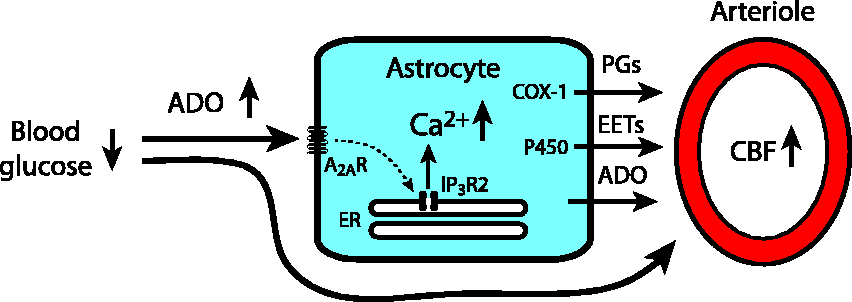
Proposed mechanism of an astrocyte contribution to hypoglycemia-induced CBF increases. Hypoglycemia-induced increases in brain adenosine (ADO) activate adenosine receptors on astrocytes, including A2A receptors (A2AR), leading to the release of Ca2+ from the endoplasmic reticulum (ER) through IP3 type 2 receptors (IP3R2). The resulting increase in astrocyte Ca2+ leads to the synthesis and release of prostaglandins (PGs) via cyclooxygenase-1 (COX-1) and epoxyeicosatrienoic acids (EETs) via P450 epoxygenase (P450), leading to the dilation of brain arterioles and to increases in cerebral blood flow (CBF). Astrocyte Ca2+ increases may also result in the release of adenosine, either by direct release of adenosine or via release of ATP, which is rapidly converted to adenosine by ectonucleotidases. In addition to stimulating astrocytes, hypoglycemia-evoked adenosine can directly activate receptors on arterioles to cause vasodilation.
Elucidating the mechanisms mediating hypoglycemia-induced CBF increases may lead to new therapeutic strategies for the treatment and management of insulin-induced hypoglycemia. Adenosine receptor inhibitors as well as COX-1 inhibitors are widely used therapeutically in a variety of disorders. This study suggests that these inhibitors may affect hypoglycemic changes in CBF and may alter the perception of hypoglycemia and influence acute cognitive impairment during hypoglycemia.
Footnotes
Funding
The author(s) disclosed receipt of the following financial support for the research, authorship, and/or publication of this article: Supported by National Institutes of Health Grants R01-EY-026514, R01-EY-026882, and P30-EY-011374 to EAN and by National Institutes of Health Grants T32 EY025187 and F31 DK116498 to ARN.
Declaration of conflicting interests
The author(s) declared no potential conflicts of interest with respect to the research, authorship, and/or publication of this article.
Authors’ contributions
ARN designed the research; ARN, PPC and APDF performed the research; ARN analyzed the data; ARN and EAN wrote the manuscript.
Availability of data and materials
The data that support the findings of this study and the MATLAB routines used to analyze the data are available from the corresponding author upon reasonable request.