
Abstract
An unbiased, automated and reliable method for analysis of brain lesions in tissue after ischemic stroke is missing. Manual infarct volumetry or by threshold-based semi-automated approaches is laborious, and biased to human error or biased by many false -positive and -negative data, respectively. Thereby, we developed a novel machine learning, atlas-based method for fully automated stroke analysis in mouse brain slices stained with 2% Triphenyltetrazolium-chloride (2% TTC), named “StrokeAnalyst”, which runs on a user-friendly graphical interface. StrokeAnalyst registers subject images on a common spatial domain (a novel mouse TTC- brain atlas of 80 average mathematical images), calculates pixel-based, tissue-intensity statistics (z-scores), applies outlier-detection and machine learning (Random-Forest) models to increase accuracy of lesion detection, and produces volumetry data and detailed neuroanatomical information per lesion. We validated StrokeAnalyst in two separate experimental sets using the filament stroke model. StrokeAnalyst detects stroke lesions in a rater-independent and reproducible way, correctly detects hemispheric volumes even in presence of post-stroke edema and significantly minimizes false-positive errors compared to threshold-based approaches (false-positive rate 1.2–2.3%, p < 0.05). It can process scanner-acquired, and even smartphone-captured or pdf-retrieved images. Overall, StrokeAnalyst surpasses all previous TTC-volumetry approaches and increases quality, reproducibility and reliability of stroke detection in relevant preclinical models.
Keywords
Introduction
Quantification of an ischemic stroke lesion in relevant rodent models is routinely based on laborious and time-consuming manual measurements on stained tissue sections. The most commonly used staining for stroke detection is the 2,3,5-Triphenyltetrazolium chloride (TTC) on thick brain slices,1,2 followed by Nissl or Cresyl Violet staining, 3 MAP2-immunostaining4,5 or less common stainings (HSP72, HSP27)5 of thin brain sections. These manual measurements, despite their wide application and value, can be highly subjective and prone to human error and bias, as reviewed in detail elsewhere.6,7
Efforts to improve the quantification of stroke lesions on TTC-stained coronal slices have used semi-automated (e.g. based on ImageJ, https://imagej.nih.gov/ij/) 7 or automated (e.g. InfarctSizer 8 ) analysis. These efforts are based on thresholding operations for infarct detection, but suffer from significant false-positive identification of areas that do not belong to the infarct or even the tissue per se7,8 and confer large detection bias. InfarctSizer, for example, detects the infarct based on color and thresholding information but also misclassifies the background as a lesion, does not provide information on hemispheric volumes, and usually counts the white corpus callosum as infarct. Additionally, to the best of our knowledge, none of the available volumetry methods on TTC-slices extracts neuroanatomical information (neuroanatomical mapping) allocated to the ischemic lesion. Although a manual projection of available anatomical masks (Allen brain atlas) 9 over the delineated lesion (infarct) masks, via the landmarking tools of ImageJ (as suggested previously 10 ) could be a relevant solution here, this is usually not done because it is highly laborious and time-costly per section. Still, a fully automated neuroanatomical mapping that could link structural and functional information11,12 to the detected ischemic lesion would translationally13–15 add high value for behavioral/neurological observations and associations to each rodent infarct.
In the present study, we developed a machine learning based system for stroke volumetry analysis and neuroanatomical mapping of stroke-lesions in TTC-stained sections. We call our system “StrokeAnalyst” (SA). Its methodology is adapted from methods already used for human MRI- or computed tomography (CT) stroke imaging data (e.g. random forest classifiers 16 or Markov Random Field 17 ) as described and reviewed previously in detail.16–21 It is based on a newly constructed TTC-brain atlas for mice. It can detect fast, reliably, and without user-bias, the infarcted area, the ipsi- and contralateral hemispheres and the respective middle-line edema-related shifts, in each TTC-slice, without false-positive, threshold-depended, selections of normal tissue. At the end of the process, it also automatically extracts neuroanatomical information about the brain areas affected by the ischemic lesion in each animal, thus providing ‒ for the first time on TTC sections ‒ a direct neuroanatomical link between ischemic-lesion and the functional outcome of stroke in mice.
Materials and methods
Animal handling and experimental design
Adult male and female C57BL/6N (n = 107), 3 months old, inbred mice (Laboratory of Pharmacology, Athens Medical School) were used for the study. Animals were housed in a pathogen-free animal facility, under standard housing conditions. Experiments were conducted according to institutional guidelines of the Athens Medical School after approval of the Greek Veterinary Authorities (protocol number 120935/18-04-2019), according to the National (PD56/2013) and EU (Directive 2010/63/EU) guidelines.
All animals subjected to stroke were assessed for baseline normal behavior and were blindly randomized before stroke induction. Naive animals for atlas construction (n = 83, male and female) were not assessed behaviorally. All data are reported according to the ARRIVE criteria. 22
Stroke induction using the filament middle cerebral artery occlusion model (fMCAo)
Mice were subjected to 60 minutes ischemia followed by reperfusion, using the filament model of middle cerebral artery occlusion (fMCAo), as previously described in detail. 4 Mice were grouped in two main experiments: one for the development (Exp1, n = 14) and a second, independent one, for validation of “StrokeAnalyst” (Exp2, n = 10). A third group of animals (Exp3) subjected to fMCAo (n = 4) provided TTC-sections for the evaluation of StrokeAnalyst on variable image-acquisition modalities and resolution (see below).
Evaluation of neurological and behavioral deficits after fMCAo
Evaluation for focal neurological deficits and signs of diffuse malaise in all stroked mice was performed using the Experimental Stroke Scale (ESS: fESS and gESS components for focal and general-diffuse deficits respectively), as previously described, 4 at baseline and 24 hours after stroke, prior to brain collection for TTC-staining. Bodyweight (BW) and surface body temperature (BT) of each animal were also measured.
Tissue collection, brain sectioning, slice TTC-staining and scanning from naive and stroked animals
All stroked animals were terminally anesthetized at 24 h post-ischemia, and tissues were collected for TTC staining (n = 10 + 14 + 4). Naïve mice (n = 83), euthanized for other reasons, were used for the construction of the TTC brain atlas. For optimal brain slicing, brains were placed in a brain mold for coronal sectioning at 1 mm (Agnthos, Art. No. 69-2175-1) and cooled at −20°C for 5 minutes to slightly harden the tissue. Then, slices were stained with 2% TTC in normal saline for 20 minutes, as previously described.
2
Finally, each set of slices was transferred on transparent films and was scanned (as a block of TTC-slices per brain) using a common flatbed scanner at 1200 dpi. The acquired digital images (as one slice-block per brain, image
For the evaluation of StrokeAnalyst on variable image-acquisition modalities and resolution, TTC-slices of Exp3 were additionally scanned at 600, 1200 and 2400 dpi over a white or black background or captured at 72 dpi with the camera of a commercial smartphone. Retrieved images of TTC-stained slices from previously published manuscripts (online, from their pdf) in white 23 and black background 24 were also used. All these images had to be converted to a standard 1200 dpi resolution prior to analysis with StrokeAnalyst, done with any image-processing software, e.g. Adobe Photoshop.
Concept and methodology overview of “StrokeAnalyst”, construction of the mouse TTC-atlas
Our present framework aims to detect and analyze the lesion of stroke in coronal TTC-slices of a mouse brain, using artificial intelligence methods that mimic the flow of lesion analysis by humans. We name our framework StrokeAnalyst (SA). The entire detailed methodology is described in detail in the relevant Supplementary materials and methods file. The methodology is based on more classical machine-learning and not deep learning techniques because the former are more robust with fewer training data,19,25 as is our case. All computational and code-writing work was performed in Matlab-2018b. 26 The complete code of StrokeAnalyst can be found on github.com (https://github.com/BBooda/StrokeAnalyst). Below, we sketch the concept and main steps of SA and TTC-atlas construction.
We start with the initial digital slice extraction from scanned brain images (Suppl. Section S-2.1.). Each brain is originally presented as a digital image of 2D coronal slices scanned in one image
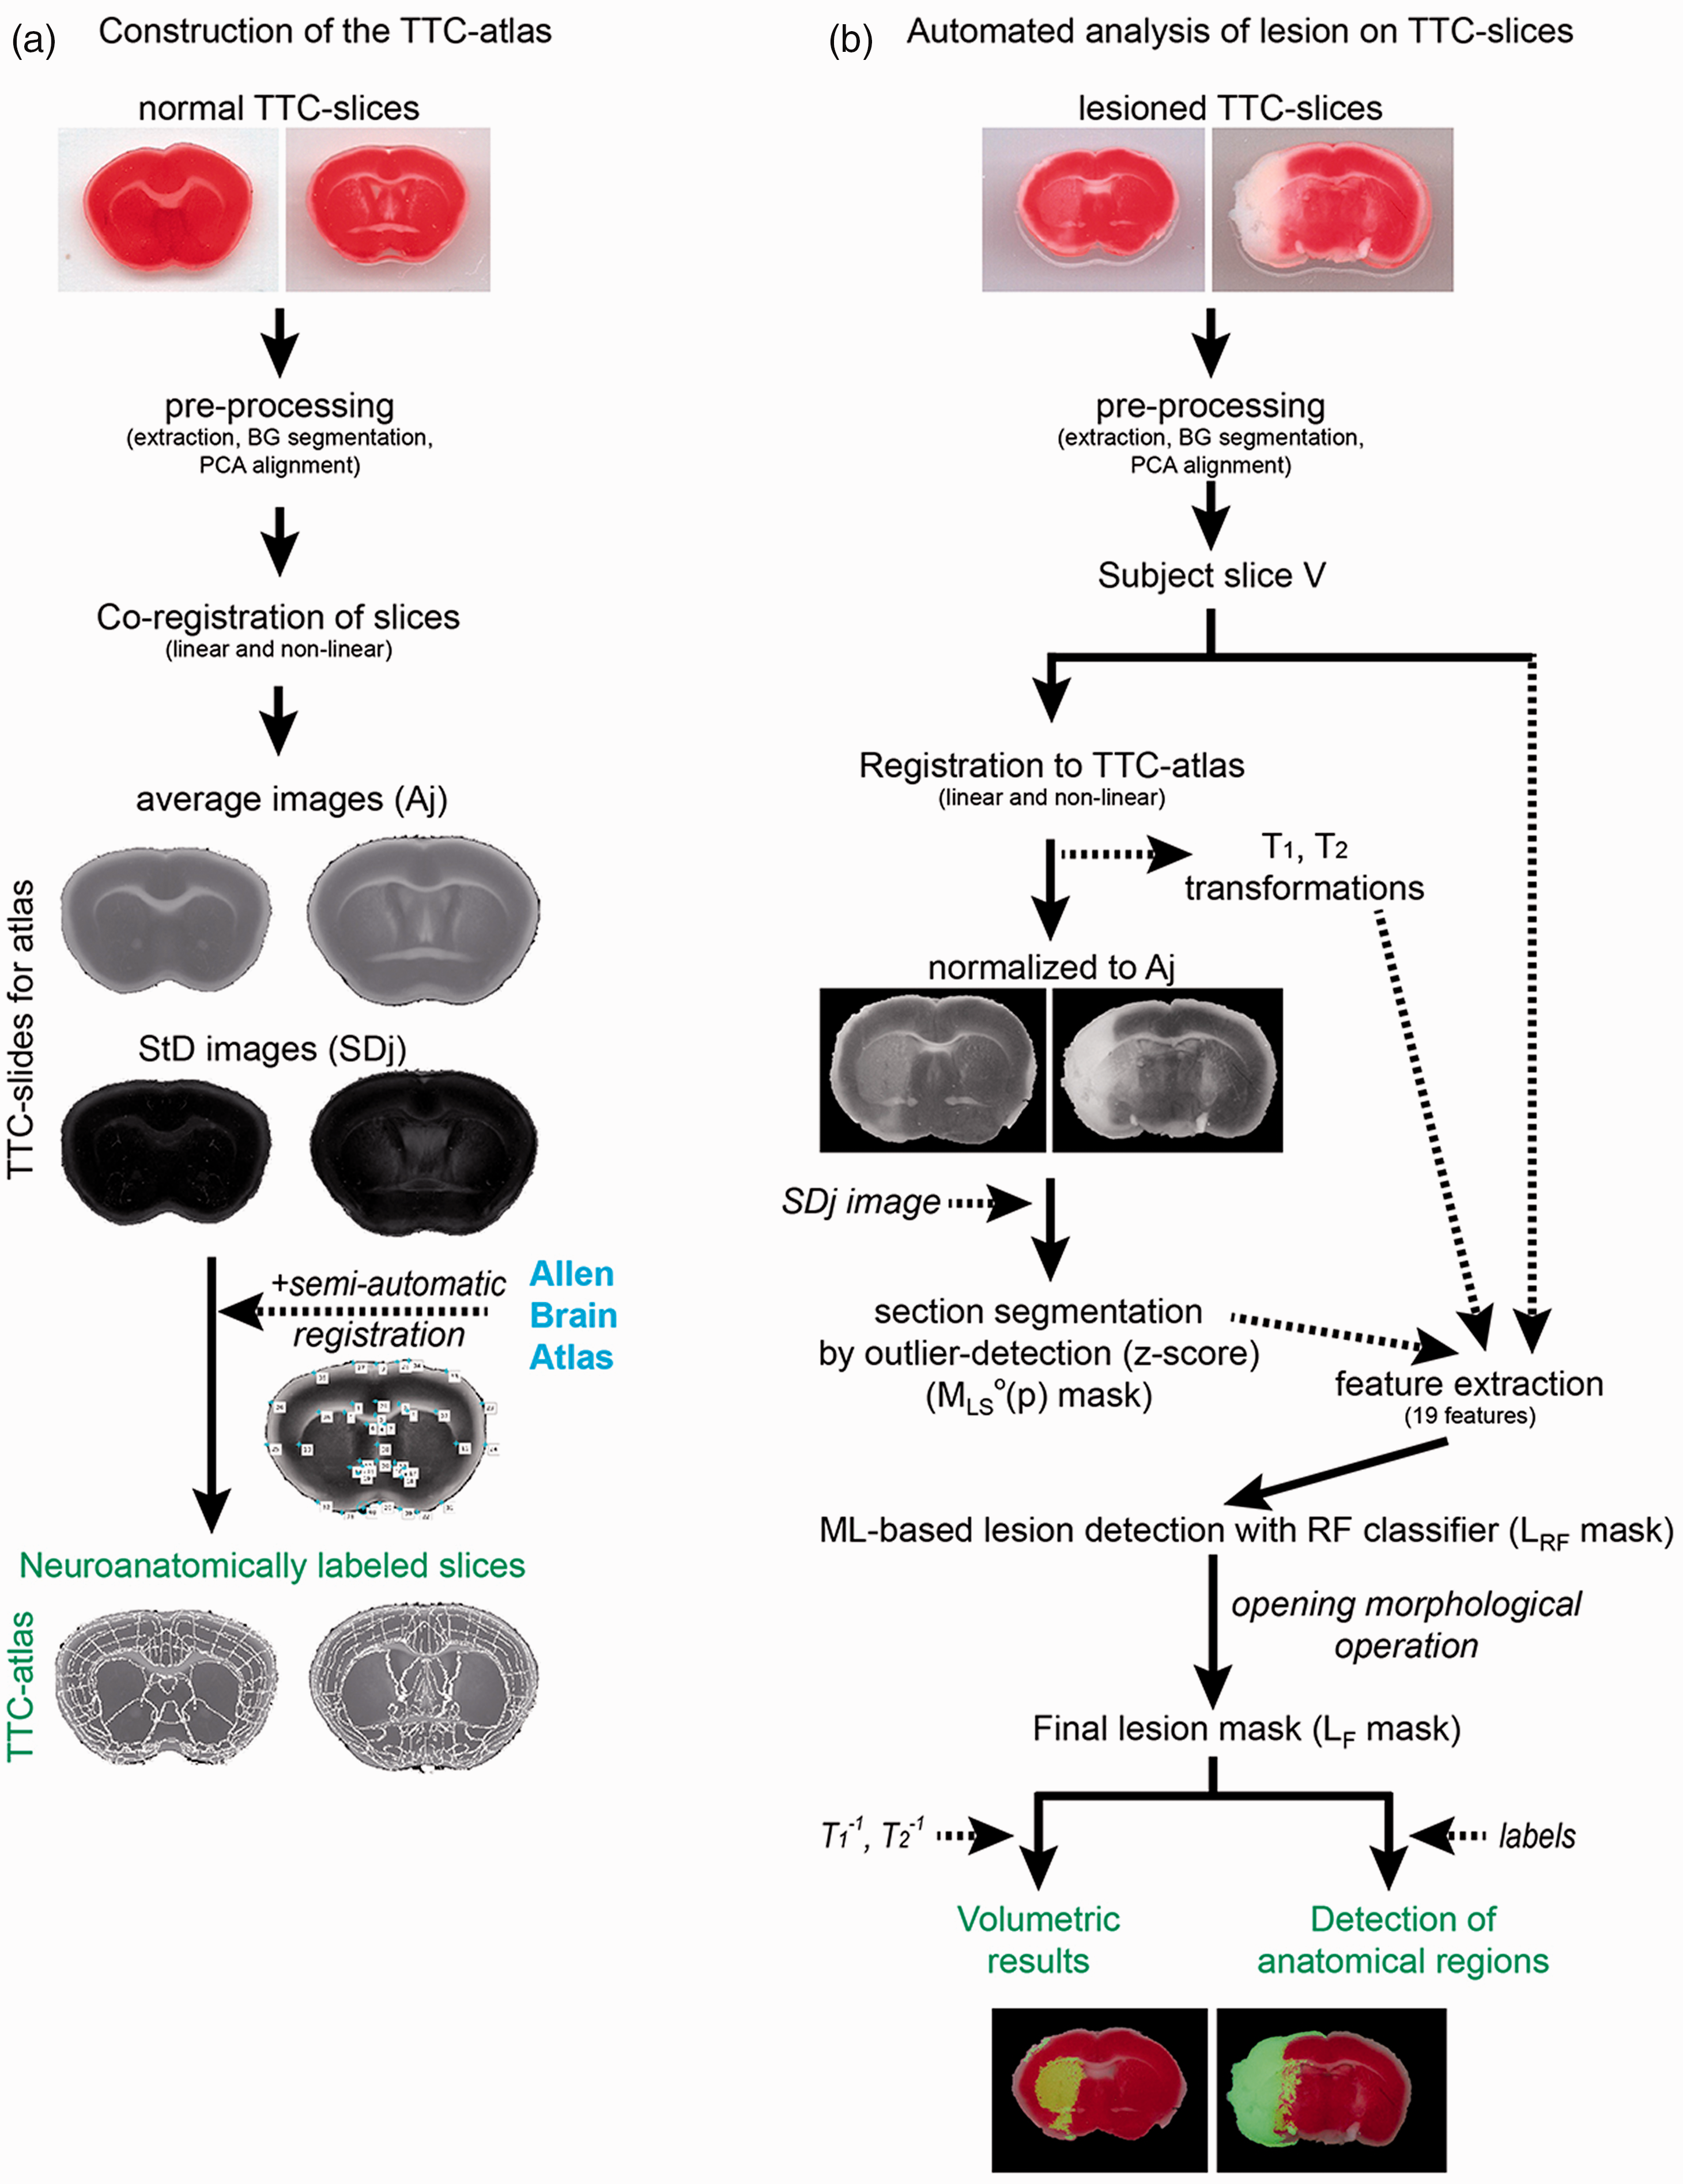
Pipeline of software development. Left column (a) shows the steps for constructing the TTC-atlas. Slices from normal mice stained with TTC were scanned (
In a second step, for the needs of lesion analysis by SA, we had to develop a reference 2D brain TTC-atlas that consist of pairs of pixelwise average (Aj) and standard deviation images (SDj) representing the intensity variation in each coronal plane at the anteroposterior axis, in normal C57 mice. Its detailed construction is described in Supplementary Section S-2.3. and Figure 1(a) shows the relevant overview. The construction of the atlas was mandatory because lesions in TTC-slices show a similar intensity profile (white) with healthy tissue in some anatomical areas (white matter tracts) or staining-related artifacts. Here, automatic lesion segmentation by intensity thresholding-methods is significantly inaccurate. 7 In addition, in order to include detailed neuroanatomical information within our TTC-atlas, we mapped anatomical information in it from Allen Brain Atlas (ABA) 9 by a semi-automated registration process and calculation of a Local Weighted Mean transformation 38 (Suppl. Section S-2.4. and Suppl. Figure 2).
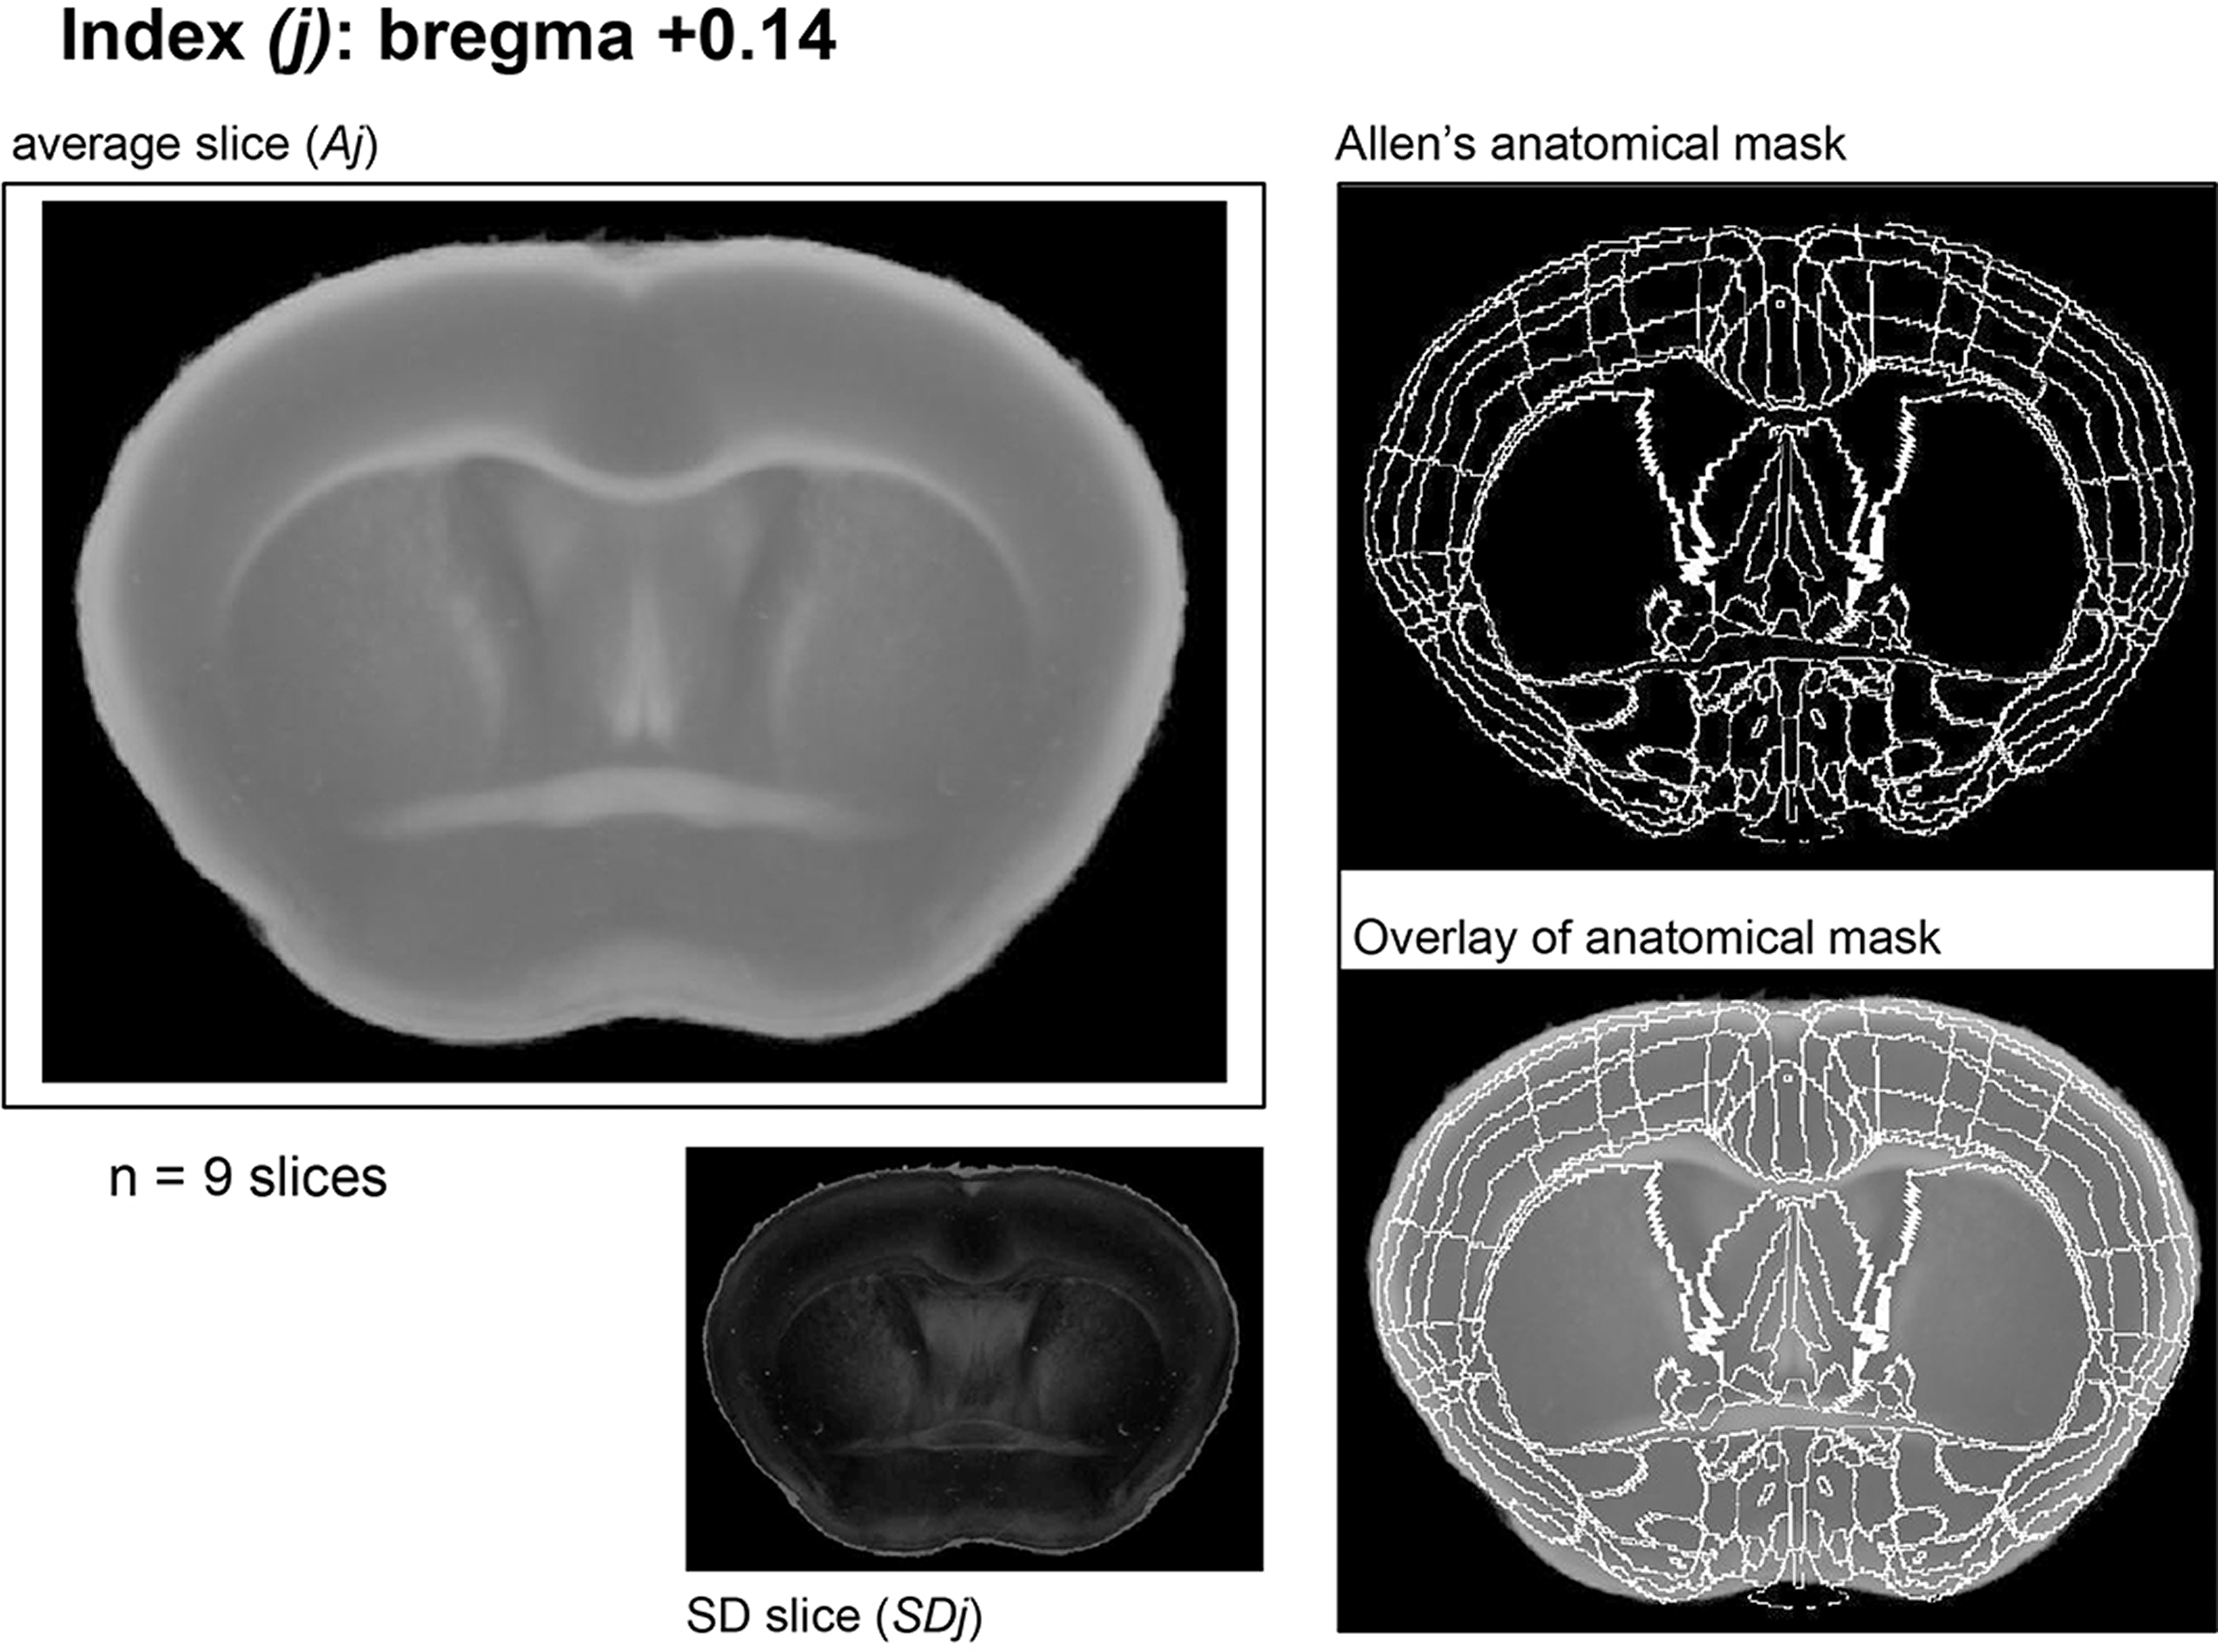
Construction of TTC-atlas. A corresponding plate of each coronal slice in TTC-atlas. An index is the anteroposterior distance of the slice from bregma, Aj is the average slice for each index and SDj the corresponding mathematical standard deviation image for Aj. The plate includes the corresponding Allen's anatomical mask and its overlay over the Aj. For each plate, the number of used single TTC slices is indicated (here, for index j = +0.14 mm we used n = 9 slices).
The main function of lesion detection on TTC-slices by SA is based on a mathematical comparison of each lesioned slice against the corresponding normal ones of the TTC-atlas (thresholding-methodology was completely avoided) (see details in Suppl. Section S-2.5.). This begins with manual indexing of each obtained TTC coronal slice (TTC-slices Ir named from now on as subject slice V) to its bregma coordinates (anteroposterior axis). Then, each subject slice V is registered -fully automatically- to the corresponding TTC-atlas slice (Figure 1(b)). For this we used a widely recognized approach based on spatial normalization of the brain volume to a standard stereotaxic space (TTC-atlas) using linear and non-linear registration techniques.
39
We estimated the linear transformation by maximizing the Mutual Information cost function40,41 using the Matlab image registration toolbox.
26
The non-linear deformable mapping was then estimated using the “Deformable Registration via Attribute Matching and Mutual-Saliency Weighting” (Dramms) software.
42
Then, lesion detection is initially based on an outlier tissue probability map which localizes deviations from normality expressed by the statistical atlas (z-score mask,
Eventually, the whole process returns volumetric and neuroanatomical data for each lesion. A graphical user interface of SA was also built for effortless, user-friendly usage by inexperienced users. It provides overall visual control of the process, options for correction, if necessary, of significant false-positive or false-negative detection areas and various output displays of the produced results (lesion and hemispheric masks). We provide the relevant programming code of SA, a detailed installation guide and an operator guide (main properties, panels, working and output options of the program) as Supplementary files. The link for downloading StrokeAnalyst can be found here: https://drive.google.com/drive/folders/1MrexC-oDJiXCLQr64I8hNj0jSalFVgX5?usp=sharing or here: https://www.pharmacology-research.gr/portal/en/research-focus-neuro.
Implementation of StrokeAnalyst for infarct volumetry
In order to develop StrokeAnalyst (SA) we utilized Exp1 (n = 14). We used sections of various quality and stroke-healthy tissue contrast. We compared its volumetry results (namely left and right hemispheric volumes, infarct volume) primarily against manual (human) delineation of stroke (using ImageJ, as described before2,4) and secondarily to the threshold-based automated method called InfarctSizer. 8 In the latter case, separate hemisphere volumes could not be produced by the program. Attempts to analyze TTCs using the ImageJ macro (threshold-based) described by Friedlander et al. 7 provided excessive noise and this was not pursued further.
Manual analysis was performed by an experienced and an inexperienced user that delineated manually the lesion and hemispheric masks (manual masks) to the native space of each mouse brain slice by ImageJ4. All manual analyses were done blindly to the results of SA or InfarctSizer. Pixel size was set at 0.021 × 0.021 = 0.000441 mm2. In both human- and SA- output mask data, areas were calculated in the native TTC slice space and could be used for calculation of infarct volume (%Vinf) and hemispheric edema (%HE) as previously described2,4 (see Suppl. Section S-2.7.). For validation of StrokeAnalyst, we utilized Exp2 (n = 10).
We also measured the time (in seconds) required for the (manual and automated) generation of each mask. Neuroanatomical mapping was only possible via StrokeAnalyst, as such no automated tool is available to perform the comparison at this level.
Evaluation of brain segmentation and lesion detection, statistical analysis
Each step of StrokeAnalyst was individually evaluated. The accuracy of tissue-background segmentation at produced images
The accuracy of volumetry results by StrokeAnalyst was evaluated based on previous suggestions. 47 In absence of a gold standard 7 and presence of imperfect reference standard (i.e. manual volumetry), we used the mean of the human volumetry data (from the 2 experts) as a constructed reference standard (named “composite reference standard”, CRS) 47 to evaluate the index test (i.e. volumetry results from StrokeAnalyst). Bland-Altmann plots searched for bias in the masks (areas) of infarct and hemispheric analysis.48,49 The accuracy of the detected infarct area per each slice (SA versus human masks) was tested by the Soerensen-DICE coefficient50,51 (Dice-scores; range 0–1, 0/1 equals to no/complete overlap), as previously described in detail. 52 The false-positive detected areas were expressed by the false-positive rate (FPR; range 0–1, 0/1 equals to no/complete false-positive detection).
StrokeAnalyst was also compared against the “InfarctSizer” (IS). 53 Here, TTC-slices were sub-grouped according to their staining quality (good or poor differentiation of infarcted/healthy tissue) and relevant Dice- or FPR-scores (SA or IS vs human) were sub-analyzed accordingly. Due to fundamental processing differences (analysis of all slices simultaneously instead of single ones), a comparison to the threshold-based method of Friedlander et al. 7 was not possible.
All statistical analyses were performed with GraphPad 8. Normality of data was tested by D'Agostino and Pearson test; parametric (t-test for 2 groups or one-way ANOVA with Tukey's correction for multiple comparisons of >2 groups) or non parametric tests (Wilcoxon matched-pairs signed rank test for paired or Mann-Whitney test for unpaired data) were then used appropriately. Correlation plots and Pearson's correlation analysis were performed between clinical (fESS scores) and infarct volumetry data (infarct volume in mm3 or as %Vinf). Data are reported in the text as mean ± SD and presented in Figures as mean ± 95% Confidence intervals of mean (95%CI), unless stated otherwise; p < 0.05 defines statistical significance. Our data are reported based on the relevant good laboratory practices guidelines. 54
Results
TTC-slice extraction, spatial normalization and tissue-background segmentation
Scanning of the TTC-slices for each (standard resolution at 1200 dpi) produced one digital image file per brain (
Construction of the mouse TTC-atlas and its registration to the Allen Brain atlas
The complete mouse TTC brain atlas is provided as a Supplementary pdf file (“TTC mouse brain atlas”). An example at index +0.14 is shown in Figure 2. We collected 576 slices from 83 mouse brains, spanning bregma +2.96 mm to −6.96 mm. From those, 59 slices were excluded (cutting artifacts, tissue folding during positioning for scanning, incorrect staining), and the remaining 517 slices were used for the TTC-atlas construction. Out of those, 94.98% were background-segmented fully automatically, while 5.2% (27 slices) required further manual correction of background segmentation. Each of the segmented slices was assigned to the closest anteroposterior index j (80 distinct positions were defined by the Paxinos mouse brain atlas 55 ) and used to construct 80 pairs of average (Aj) and standard deviation (SDj) images, comprising the novel “TTC-atlas”. Each Aj slice with its corresponding calculated SDj slice was derived from 3–10 single, normal TTC-slices.
Co-registration of Aj slices with the corresponding digital anatomical masks of Allen mouse brain atlas 9 (Supplementary Figure 2) was accurate for indexes +2.96 mm to −5.40 mm. For slices −5.40 to −6.96 mm co-registration and mapping was not possible due to inaccurate cerebellum anatomy and mapping.
Evaluation of the machine learning model for stroke detection
Our Random Forest classification (RF) model was tested on 72 TTC slices with stroke and achieved a strong detection performance: 2.3 ± 1.6% FPR (false positive rate), 77 ± 12% TPR (true positive rate) and mean Dice-score of 0.78 ± 0.10. The corresponding values of the threshold-based, z-score statistical map at a fixed cutoff, were 2.7 ± 1.9% FPR, 69 ± 14% TPR and mean Dice-score of 0.70 ± 0.11. The cutoff value was set to achieve high specificity. The AUC value of the RF model is 96.86%, close to those of z-score map (94.58%). As shown in Suppl. Figure 4, the z-score maps were characterized in practice by high false-positive (white arrows) and false-negative (white asterisks) areas that are dictated by the thresholding values. Our RF model could discriminative such false-detected areas compared to the z-score thresholding maps, especially in slices where the lesion/healthy discrimination is weak (examples in Suppl. Figure 4 and 5).
Lesion volume analysis by StrokeAnalyst
StrokeAnalyst was developed on TTC-slices from 14 mice with stroke (Exp1). Animals weighted 23.2 ± 1.8 gr (mean±SD) at baseline and 20.8 ± 1.7 gr at 24 h. Their body temperature was 35.5 ± 0.8 °C and 35.5 ± 0.4 °C at baseline and 24 h respectively. Their focal neurological score (fESS) at 24 h was 14.0 ± 7.7 (i.e. moderate to severe lesions) with a gESS score of 4.5 ± 2.2 (diffuse post-stroke malaise). Data from volumetry analysis of their brains (infarct size, left/right hemispheric volumes, and hemispheric edema), using the StrokeAnalyst, manual volumetry (human 1 (h1), human 2 (h2) and composite reference score(CRS)) and the InfarctSizer (IS) are shown in Figure 3(a) to (e). StrokeAnalyst detected a mean 80.4 ± 36.9 mm3 infarct volume (for h1, h2, IS and CRS: 85.5 ± 41.4, 76.7 ± 32.7, 62.5 ± 32.0 and 81.1 ± 36.3 mm3 respectively, Figure 3(a)), with 4.2 ± 4.1% hemispheric edema (for h1, h2 and CRS: 7.4 ± 6.8, 4.6 ± 7.4 and 6.1 ± 6.1% respectively, Figure 3(c); hemispheric edema cannot be technically calculated by IS) in our first animal cohort. StrokeAnalyst was accurate in well-cut sections (122/129 or 94.6% of slices) and failed only in badly cut and severely distorted slices (7/129 or 6.4% of slices, examples in Suppl. Figure 3, usually at cerebellum-mesencephalon levels, bregma >5 mm); here, manual volumetry was mandatory and these slices were excluded from further single-slice analysis (their corresponding manual values “supplemented” the gaps in SA and IS total volumes' calculations). The calculated infarct volume (as a %) by StrokeAnalyst correlated significantly to fESS scores (Pearson's r = 0.556, p < 0.05, Figure 3(f)), as previously reported for human lesion analysis. 4
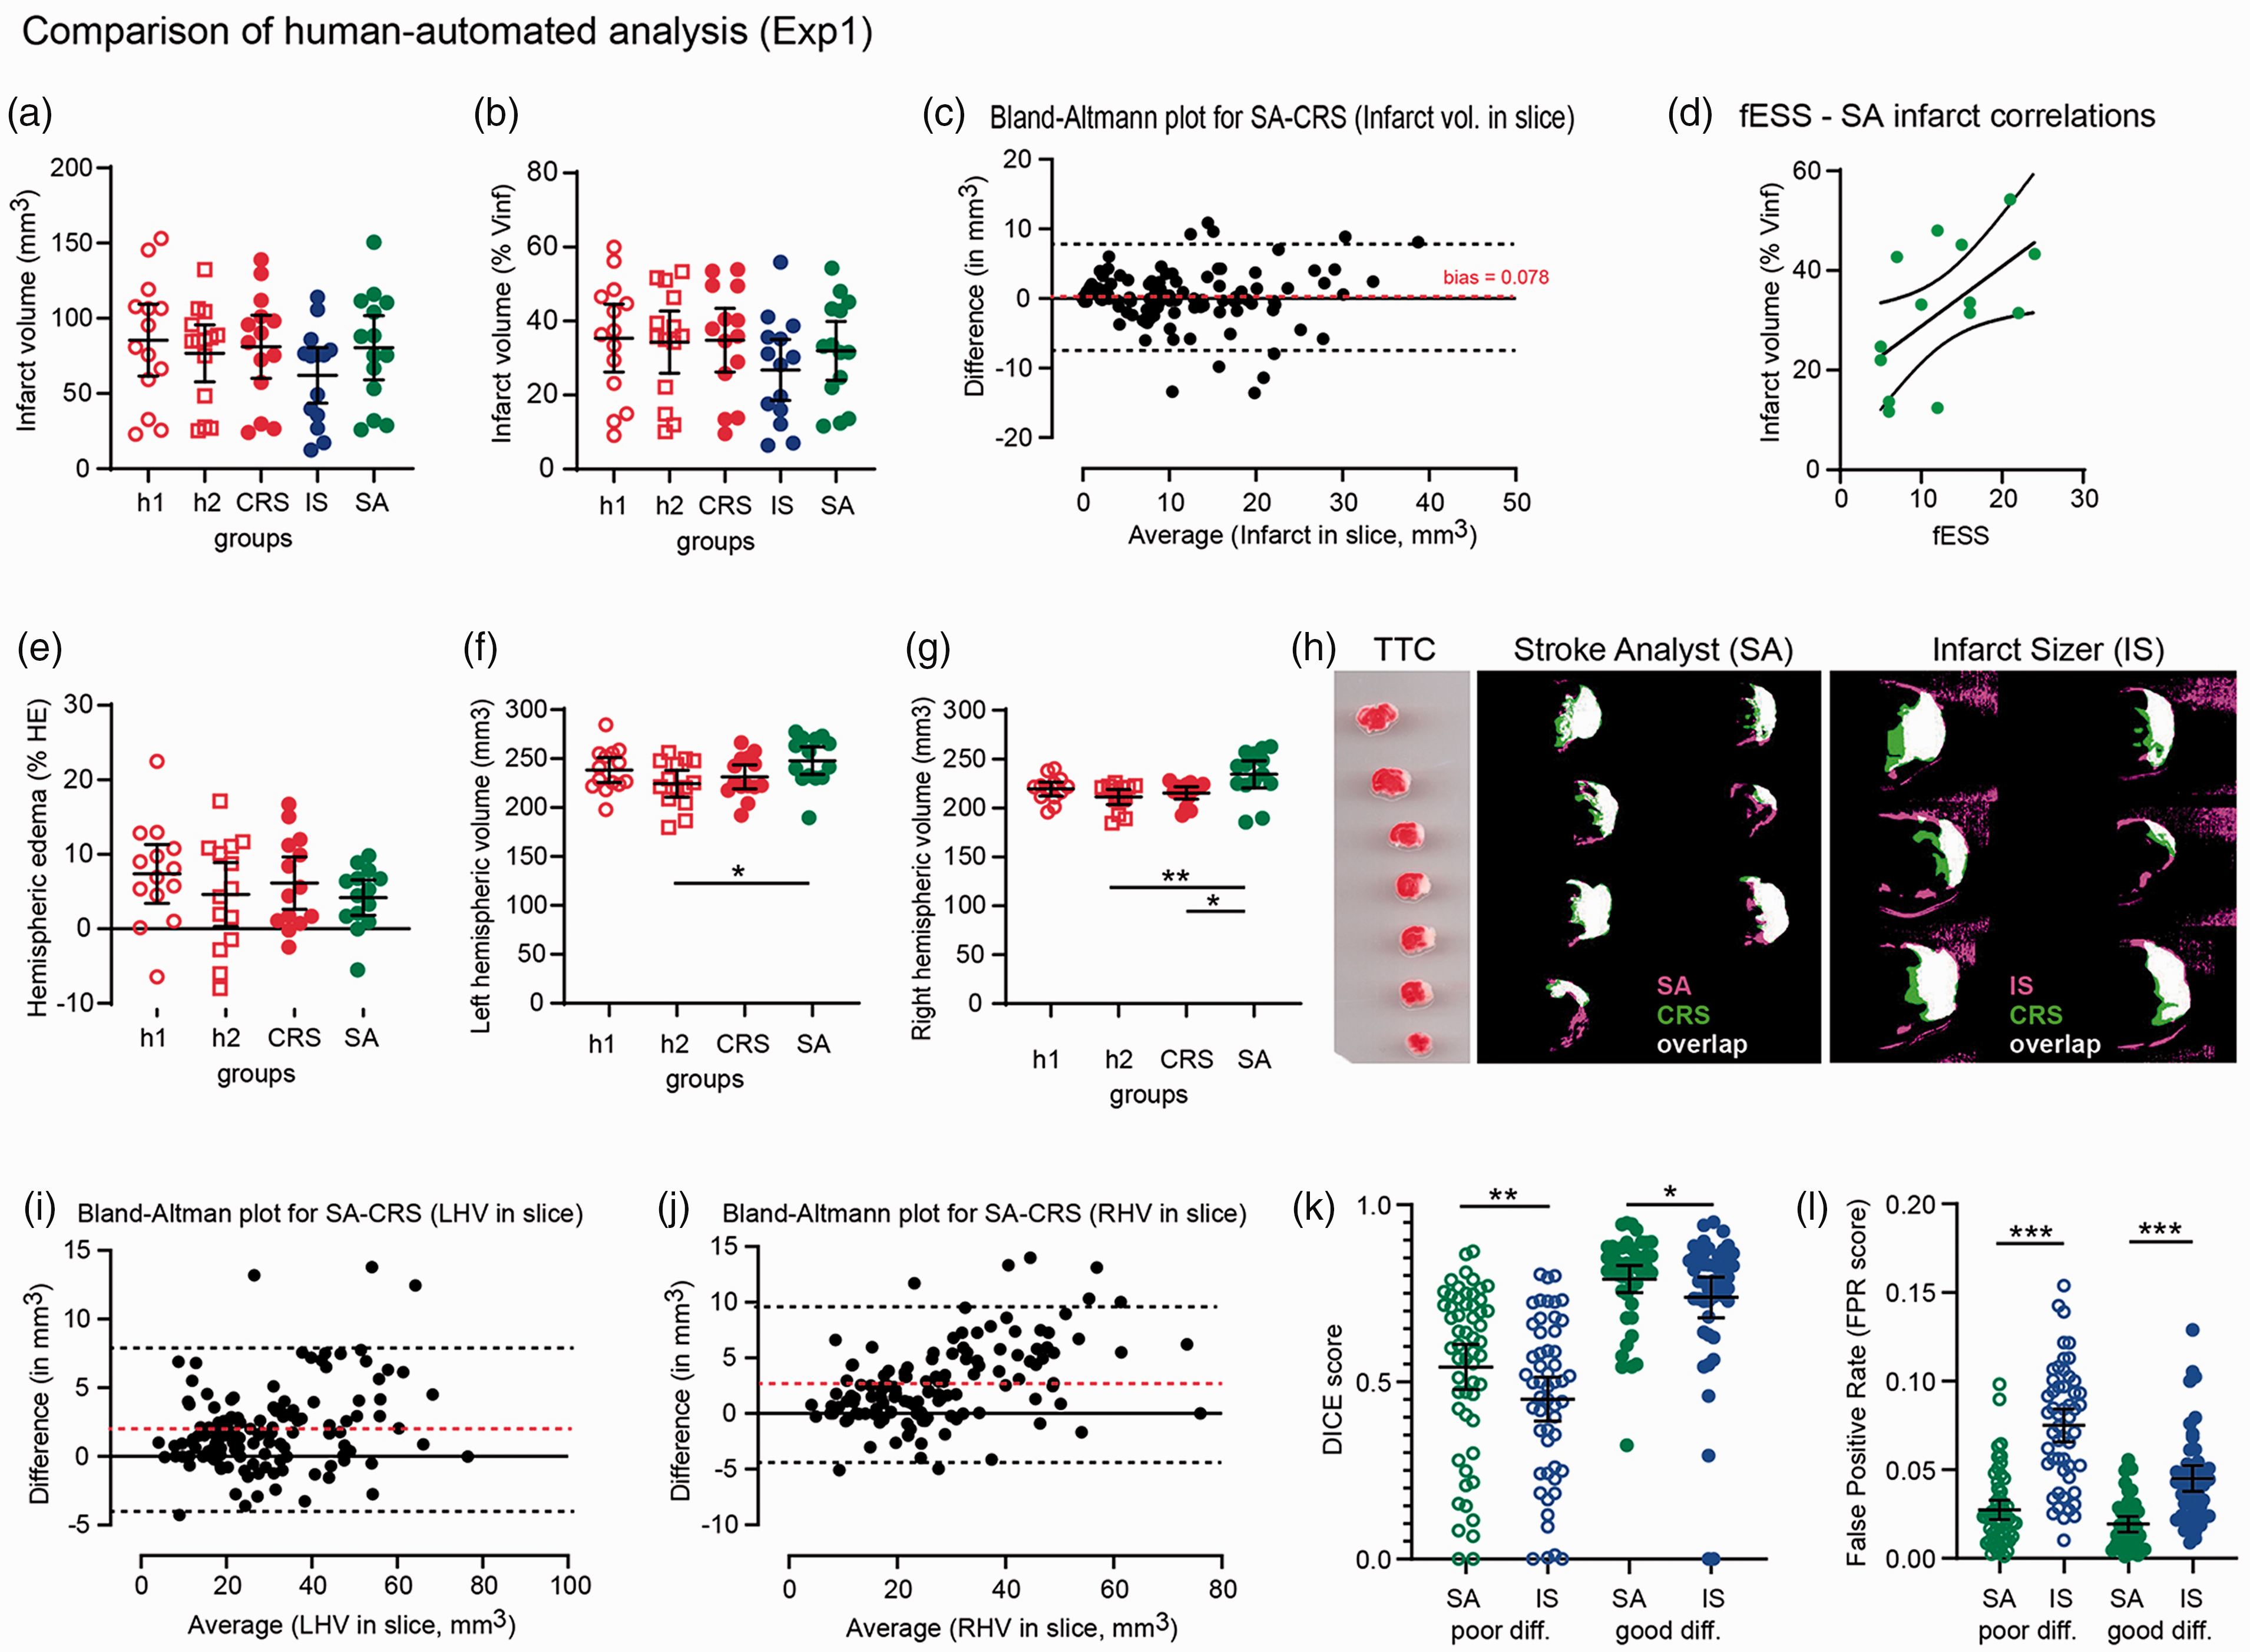
Results of SA on the initial experimental set (Exp1) compared to manual volumetry. The infarct volumes measured by SA in mm3 (a) or as % percentage of left hemisphere (b) are similar to that of manual volumetry (h1 and h2), do not differ to CRS (as "ground truth" 47 ) and are larger but not statistical different to those measured by InfarctSizer (IS). Bland-Altman plot for infarct volumes per single slices (c) shows an almost zero bias by SA compared to CRS. Infarct volumes (as % Vinf) correlate strongly to fESS values per animal (d), indicating that focal neurological deficits in fESS reflect the underlying infarct size. Hemispheric edemas as % percentage are also similar to human and CRS (e), despite that hemispheric volumes (right and left hemispheric volumes, RHV and LHV respectively, in mm3) are proportionally overestimated by SA compared to human or CRS measurements (f and g), as also shown in Bland-Altman plots (i) and (j). Image analyses of SA- and IS- versus CRS-masks through Dice-scores (k) and false positive rates (FPR, l) show that SA detects infarct areas better compared to IS; this applies in both cases where TTC-staining has a poor and good infarct-healthy differentiation. Most important, SA detects infarcts more reliably (specific), as indicated by a very low FPR rate in all cases (poor and good “differentiated” slices). A representative overlay projection (white) of SA (pink) and CRS (green) mask is shown in (h).
Detection of hemispheres and infarct areas by StrokeAnalyst (SA) was highly accurate. Hemispheric masks reached a high metric IoU of 0.965 ± 0.009 for 2D slice data, indicating an almost perfect match between the data produced from the SA and human-based assessment. Similarly, left and right hemispheric volumes as measured by SA correlated well to the manual annotations of both experienced (h1) and less experienced (h2) researchers (Figure 3(f) and (g)), although the correlation was better to the measurements of rater h1. SA over-estimated the area of left and right hemisphere per slice (Bland-Altman plots, Figure 3(i) and (j) respectively), with a bias of +2.0 mm3 and +2.7 mm3 respectively. This is due to the detection of a thin water ring around the TTC-slices, as part of their handling and scanning process. On the contrary, detection of infarct area shows an almost zero bias (0.078mm3, Bland-Altmann plot, Figure 3(g)), indicating an unbiased and accurate stroke detection. Most importantly, the SA lesion masks were accurate and highly specific when compared over the human ones by Dice scores (0.66 ± 0.23) and FPR scores (0.023 ± 0.018, meaning a 2.3% false positive detection). In addition, SA was superior to the threshold-based InfarctSizer, 8 both in terms of overall accuracy (Dice for IS 0.58 ± 0.26; p < 0.001 vs SA) and specificity (FPR for IS 0.060 ± 0.034, or 6% false-positive detection; p < 0.0001). Of note, SA outperformed IS in both good and poorly differentiated TTC-slices (i.e. good color discrimination of infarct versus healthy tissue; p < 0.05; Figure 3(k) and (l)), highlighting the efficacy of SA even for difficult TTC-slices.
Validation of StrokeAnalyst
Validation of StrokeAnalyst followed in an independent cohort of animals (“Exp2”, n = 10). Animals weighted 27.0 ± 2.4 gr at baseline and 23.1 ± 2.7 gr at 24 h. Their baseline and 24 h body temperatures were 35.8 ± 0.7 °C and 35.1 ± 0.7 °C respectively. Their fESS was 15.1 ± 3.3 and their gESS score of 2.1 ± 0.8 at 24 h. Infarct size in mm3 was measured at 49.3 ± 35.7 by SA and 54.1 ± 37.2 by human (Suppl. Figure 5a). Infarct size in % was measured by 26.9 ± 20.1% by SA and 32.2 ± 21.9% by human (Suppl. Figure 5b). Bland-Altmann plot analysis returned minimal bias for infarct size (−0.85 ± 3.24 mm3, Suppl. Figure 5c) and slightly larger for left and right hemispheres (1.86 ± 2.55 and 2.23 ± 2.16mm3 respectively), similarly to Exp1. As expected, fESS scores correlated well with the % infarct volume (Pearson's r 0.775, p < 0.01, Suppl. Figure 5d). Volumes of left and right hemispheres were measured respectively at 177.3 ± 15.9 mm3 and 168.6 ± 13.4 mm3 by SA, compared to 166.8 ± 13.5 mm3 and 156.0 ± 11.6 mm3 by human. Hemispheric edema was measured at 5.1 ± 4.1% by SA and 6.6 ± 5.0 by human (Suppl. Figure 5e). Analysis of lesion masks (Suppl. Figure 5f-g) returned a Dice-score of 0.65 ± 0.20 with a very low FPR at 0.012 ± 0.009 (or 1.2 ± 0.9% false positive rate). Similarly to Exp1, SA performed better in TTC-slices with good healthy-infarcted color differentiation (red-white), achieving a consistent high Dice-score of 0.81 ± 0.07 compared to a 0.51 ± 0.17 score by poor differentiation (Suppl. Figure 5f and relevant examples of slices in Suppl. Figure 5i-j). Importantly though, the FPR score remained constant low in both poor/good differentiation slides (0.013 ± 0.011 for poor and 0.011 ± 0.006 for good differentiation; Suppl. Figure 5h), indicating very high specificity of SA for stroke detection.
Evaluation of StrokeAnalyst on variable image-acquisition modalities and resolutions
We tested the functionality of StrokeAnalyst on images scanned at different resolutions (600, 1200 and 2400 dpi) and backgrounds (white and black), on images from published manuscripts,23,24 and images captured by a mobile-phone camera at a low resolution of 72 dpi. In all cases, as shown representatively in Figure 4, StrokeAnalyst successfully detected the ischemic lesion, even in TTC-slices with poor color differentiation (slice on black background in Figure 4(a) to (c)). As expected, a higher resolution of the acquired image produced better results (>300–600 dpi, optimally at ≥1200 dpi). This indicates that our algorithm is efficient for a large range of acquisition-related imaging parameters, in any laboratory working on TTC-slices.
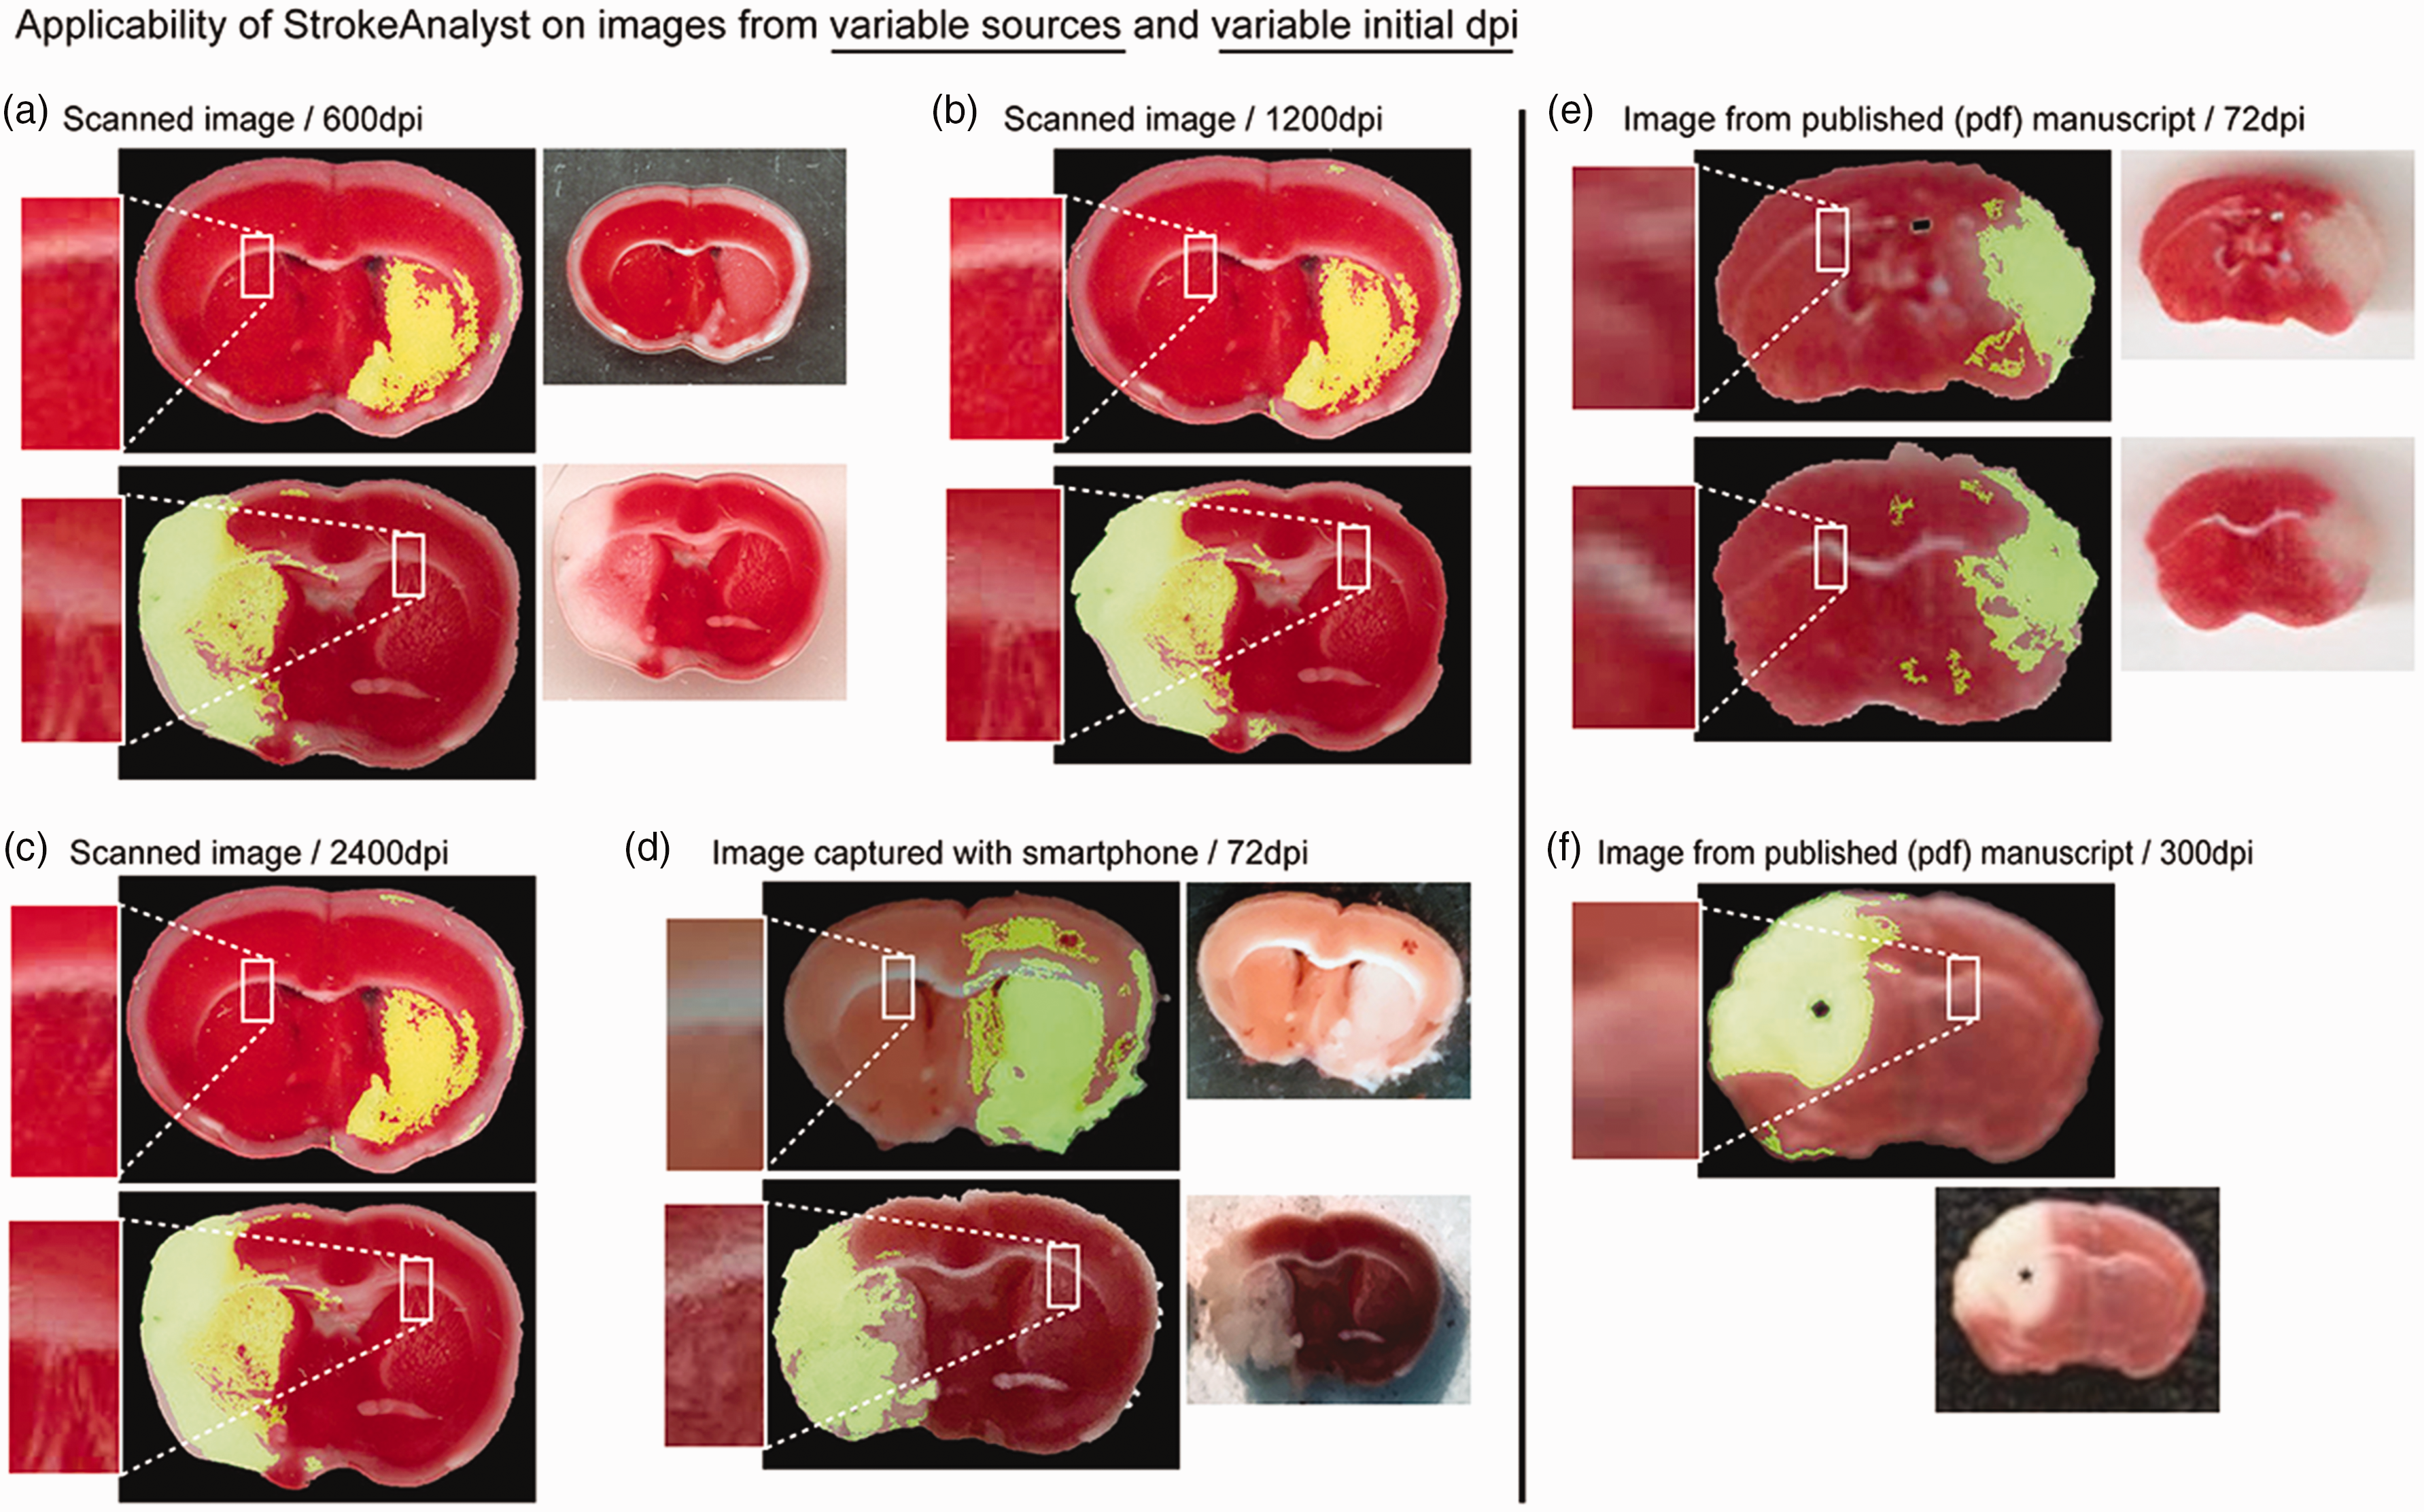
SA can detect stroke lesions on images from variable sources and initial dpi. SA detects infarcts on scanned images with 600, 1200 and 2400 dpi (a to c) or even from the image captured with a common mobile phone at 72 dpi (d). Note that the white or black background does not affect the detection or segmentation process. Smartphone acquisition brings shadows (d, at white background) and its low resolution at 72 dpi brings relative inaccuracies. SA can surprisingly detect strokes even in images acquired online from previously published manuscripts23,24 (e and f); here resolution is again the only determining factor: the low resolution of 72 dpi in (e) provides moderate accuracy compared to the 300 dpi in (f).
Clinical-anatomical correlations/detections based on lesion mapping
StrokeAnalyst introduces an automated neuroanatomical mapping of stroke lesions in TTC-stained brains for neuroanatomical-clinical/behavioral correlations. Depending on the size of stroke, different anatomical areas are affected, as shown in Figure 5. As such, an fMCAo-induced stroke can induce limb paresis (upper and lower), sensory deficits in whiskers, upper-limb, lower limb, mouth and nose (cortical somatosensory areas and thalamus), fear-stress disorders (amygdala nuclei), memory deficits (hippocampus), visual deficits (cortex and geniculate complex) and lateralized movement disorders (substantia nigra, caudoputamen). Moreover, the affected visceral and gustatory areas may induce gastrointestinal or autonomic symptoms that may be however masked due to bilateral cortical representation of such functions. Based on these clinicoanatomical correlations appropriate clinical/behavioral tests can be designed or applied.
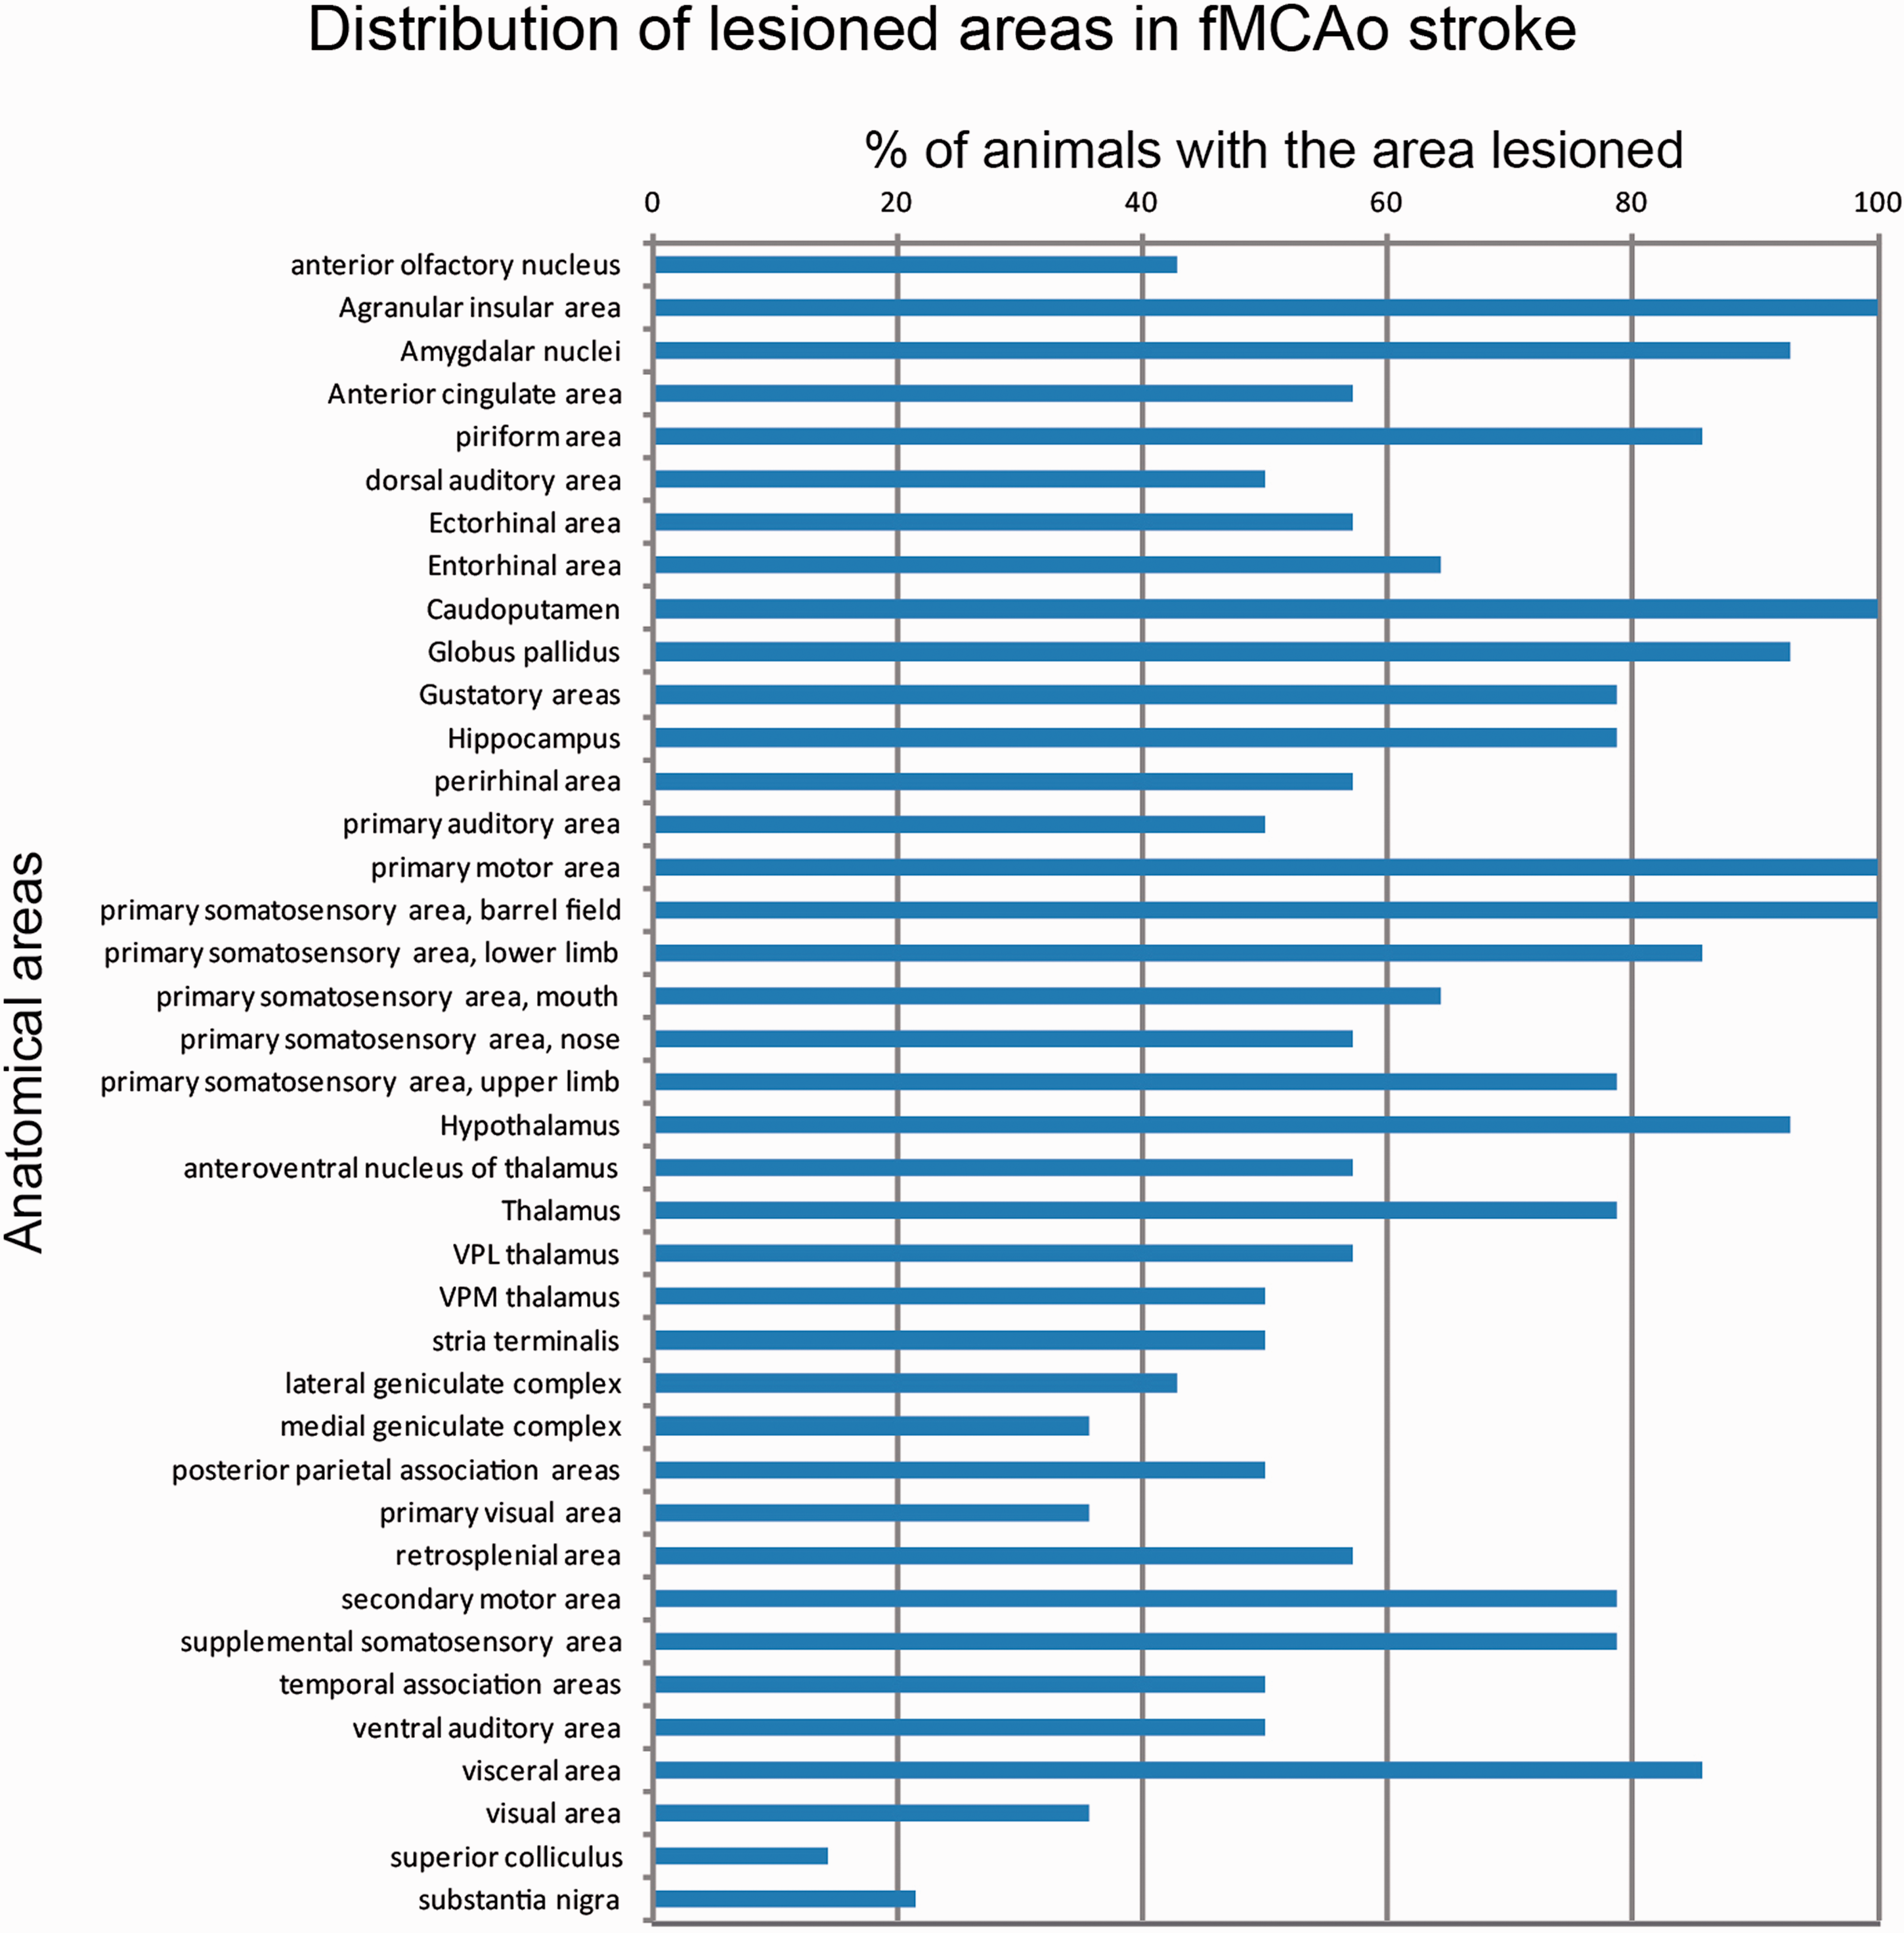
Important neuroanatomical mapping data derived from SA. Each blue bar shows (as % percentage) the corresponding prevalence of the damaged area in the cohort of Exp1 animals. Of note, agranular insular area, amygdalar nuclei, caudoputamen, globus pallidus, primary motor area, primary somatosensory area and hypothalamus were almost constant damaged by the fMCAo model in our cohort. Interestingly, our model affected also -among others- visual areas, visceral areas and auditory areas, with unknown significance and effects to preclinical stroke studies.
Discussion
In the present work we developed, applied and verified a novel software for automated, artificial-intelligence based volumetry and neuroanatomical analysis of stroke in mouse tissue sections. We name this software StrokeAnalyst (SA). It is based on a novel mouse brain TTC-atlas and runs on machine learning and outlier detection methodology, via a user-friendly interface that provides a user-overview and possible adjustments. StrokeAnalyst removes human detection bias, increases the reliability of volumetry analysis on TTC mouse slices, and automatically produces detailed neuroanatomical mapping data of the lesion for clinico-anatomical correlations. As such, it excels all available methods of manual or semi-automated infarct analysis for relevant stroke experiments. 56
Manual delineation of the ischemic lesions on stained slices using ImageJ (usually TTC or Nissl stained) is the current practice in preclinical stroke studies. 4 Problems and pitfalls of this approach are widely known: it is laborious, highly time-consuming, highly expertise-dependent, with high rate of detection bias and low intra- and inter-rater data reproducibility. Semi- or fully-automated stroke-volumetry methods could remove human bias and accelerate the analysis process per se, but only few such exist: the InfarctSizer by Lee et al., 8 a color-based image-analysis by Goldlust et al., 57 an analysis based on an ImageJ-macro by Regan et al. 53 and analysis of infarct based on automated-thresholding on ImageJ by Friedlander et al. 7 However, they are all based on intensity- and/or color-thresholding of the image, which results in significant false-positive detections and artifacts. In practice, the aforementioned methods have not achieved a wide appreciation and applicability by stroke laboratories, probably due to falsely detection of normal white-matter as lesion, significant inaccuracies upon poor processing and staining, and inability to correct falsely detected areas by the user. Although MRI-imaging58,59 could theoretically compensate for stroke volumetry on sections, this is practically not widely applicable due to refractory high costs. Eventually, StrokeAnalyst addresses all these problems on tissue-based infarct-analysis by outlier detection and machine learning on a process that partially reflects the way human brain also works during manual lesion-analysis.
SA requires a “ground-truth” to distinguish infarct from healthy-tissue, as a common feature of comparative imaging analysis.60–62 This “ground-truth” is a novel-constructed TTC-atlas with 81 average slices (spanning the brain from bregma +2.96 mm to bregma -6.96 mm) that summarizes the expected variation in a normative space, and supports SA to seek and find the infarct lesions. The TTC-atlas contains both optical (Aj images) and mathematical (SDj images) information that supports image registration and mathematical calculation of “normal/lesion” for each pixel based initially on z-scores. Allen brain mouse atlas 9 or Paxinos mouse brain atlas 55 were not compatible due to staining incompatibility (Allen and Paxinos),55,63 tissue shrinkage by dehydration (thus, tissue misalignments between TTC- and Allen/Paxinos- brain slices) and/or lack of digital representation (Paxinos). 55 For similar reasons the Fitter altas 64 was also incompatible (developed for histological sections). As such, the de novo construction of the TTC-atlas with manual and software-supported registration of Allen neuroanatomical mapping on it (Suppl. Figure 2) was mandatory, and solved tissue-processing related discrepancies.
During the development of SA several problems related to the nature of the data (e.g. 2D-physically deformed tissue-slices, no reliable acquisition of 3D data on TTC-slices, etc) had to be resolved. First, we were based on machine-learning and not deep-learning methods, as the latter would require a prohibitively large (for our settings) number of TTC-stained brain slices to appropriately train the deep neural network and ovoid overfitting.19,20,65 Second, the correct background removal was critical for accurate registration. As simple thresholding techniques alone are inaccurate for background segmentation, especially in cases of weak tissue-background contrast, we utilized image-analysis and machine learning methodology from the MRI-field (superpixels, 27 k-Means29,30 and Markov Random Fields optimization techniques 66 ). This achieved correct and automated background segmentation in >95% of the slices; in the remaining <5% of TTC-slices with severe cutting/processing problems a manual correction was possible. Third, for the accurate registration of the indexed subject-slice on the corresponding TTC-atlas slice, relevant software such as Matlab-based, 26 Elastix 67 and 3D-slicer 68 from the field of MRI-based approaches, were found inadequate to the needs of 2D TTC-slices. Here, the Dramms software 42 performed best. Fourth, accurate middle-line detection for hemispheric separation, was critical, especially in presence of hemispheric edema. Such efforts based on symmetry/asymmetry of the tissue were not accurate; we solved the problem based on neuroanatomical atlas-based middle-line information after correct subject-slice registration with the Dramms software. Fifth, infarct detection based on z-score calculation was insufficient by itself (see examples in Suppl. Figure 5) due to extensive false-positive and -negative selections. Machine learning (i.e. random forest classification) and morphological constrains corrected both of them, similarly to previous MRI works. 16 Sixth, we had to compare the volumetry results of SA to a “gold-standard”, which does not exist for TTC-slices. 7 For that, we created a “composite reference standard” (CRS), as suggested previously. 47 For comparisons of the detected lesion/hemispheric areas per slice, the corresponding Dice-scores were far more informative and appropriate, compared to simple Bland-Altmann plots or numerical comparisons, because they provide actual pixel-to-pixel information on masks overlapping: 17 Dice-scores demonstrated the high false-positive lesion detection by thresholding approaches such as the InfarctSizer. Eventually, we included a user-verification/correction step to insert a sense of “user-control” over the automated processes and allow for possible corrections of remaining false-positive/negative areas, still without undermining the value of the automated lesion detection.
StrokeAnalyst has several strengths for routine stroke lesion analysis on TTC-slices. First and most importantly, SA minimizes or even excludes human bias, a long-standing problem in stroke volumetry.7,56 It selects lesions based on pixel-to-pixel signal comparison over a mathematical norm-slice, and can even detect crisp-like isolated ischemic signals among healthy tissue or even weak ischemic signal in TTC-slices, both of which are almost impossible for unbiased human (manual) annotation. Second, SA discerns and excludes white-colored normal brain areas or white artifacts in the borders of the tissue, both of which distort all available threshold-based methods of infarct detection (e.g. InfarctSizer or ImageJ-based ones). Third, impressively enough, SA is not limited to a “fixed” image source (i.e. scanner at 1200 dpi): it can detect infarcts in almost any kind of image, namely scanned, obtained from pdf files or even from a smartphone camera (Figure 4). This supports SA's efficiency at variable acquisition-related imaging parameters, in any laboratory working on TTC-slices, independent of slice-orientation, background or slice-positioning constrains that apply in other software-based approaches.7,8 Fourth, batch-analysis of sections through the SA reduces human effort and time, while users still retain a visual control over the produced results. Fifth, the indexing of slices returns additional lesion-related neuroanatomical information for clinical-anatomical associations. Based on these (Figure 5), the fMCAo model, apart from apparent motor and somatosensory deficits, may induce fear and anxiety, 69 central endocrine/temperature or primary feeding-behavior alterations or even affect gastrointestinal motility with results on gut microbiome,70,71 all of which require special attention during experimentation or further studies. Eventually, our SA is translationally utilizing machine learning -enabled methodology from 3D human MRI- or CT-imaging data16–21 on 2D tissue imaging data, reaching -at least- similar detection efficiency.16,17 Recently published relevant MRI-data for rodents achieve results directly comparable to those of our SA for good-stained sections (Dice of 0.86 and FPR of 0.04) 59 .
SA has some limitations, that remain a field for future improvement. A prerequisite for all image analysis methods is an optimal scanning and staining quality of input-images. Severely misfolded slices or with large parts of missing tissue, cannot be analyzed by SA; this is a general limitation of all available image-analysis methods. Acquired images have to be stored (or converted, if acquired in another resolution) to a standard “1200dpi” resolution due to the TTC-atlas' mathematical properties (Aj and SDj properties), but this was easily done. Correct slice-indexing at bregma coordinates adds some user- processing -time, nevertheless it supports proper registration to the reference image as a common feature of comparative imaging analysis and brings necessary information for additional neuroanatomical mapping. Additionally, the measured % mean hemispheric edema by StrokeAnalyst is slightly smaller, but not statistically different, compared to human measurements. We cannot provide a definite explanation for this, but it could be attributed to either 1) existing bias from human measurements (Figure 3(e)), 2) small inaccuracies from StrokeAnalyst to detect brain boundaries due to “scanning debris” and inaccurate segmentation volumes (see Figure 3(f) and (g)), or 3) combinations of the aforementioned reasons. Finally, due to the nature of data (tissue slices, approximately 1 mm thick) 3D-space techniques (voxel-wise) could not be applied.
In conclusion, we developed and validated an automated, machine learning-based, algorithm (StrokeAnalyst) for user-unbiased stroke detection on tissue TTC-stained sections, which runs on a user-friendly interface. SA reduces human errors, bias and labor in stroke volumetry, increases accuracy and fine lesion detection even in areas undistinguishable by manual volumetry, removes all previously reported pitfalls of threshold-based stroke lesion analysis and automatically extracts relevant neuroanatomical mapping data. Future works could expand the methodology of SA for histopathological (e.g. Nissl) or immunostained (e.g. MAP2) brain sections from stroke or other types of lesions (e.g. trauma) or investigate other machine learning methodologies, e.g. based on deep neural networks. Eventually, StrokeAnalyst improves the standards in analysis of infarct volumetry on brain tissue slices to reduce experimental bias and increase data quality for stroke.
Supplemental Material
sj-pdf-1-jcb-10.1177_0271678X221083387 - Supplemental material for Machine learning based analysis of stroke lesions on mouse tissue sections
Supplemental material, sj-pdf-1-jcb-10.1177_0271678X221083387 for Machine learning based analysis of stroke lesions on mouse tissue sections by Gerasimos Damigos, Evangelia I Zacharaki, Nefeli Zerva, Angelos Pavlopoulos, Konstantina Chatzikyrkou, Argyro Koumenti, Konstantinos Moustakas, Constantinos Pantos, Iordanis Mourouzis and Athanasios Lourbopoulos in Journal of Cerebral Blood Flow & Metabolism
Supplemental Material
sj-jpg-2-jcb-10.1177_0271678X221083387 - Supplemental material for Machine learning based analysis of stroke lesions on mouse tissue sections
Supplemental material, sj-jpg-2-jcb-10.1177_0271678X221083387 for Machine learning based analysis of stroke lesions on mouse tissue sections by Gerasimos Damigos, Evangelia I Zacharaki, Nefeli Zerva, Angelos Pavlopoulos, Konstantina Chatzikyrkou, Argyro Koumenti, Konstantinos Moustakas, Constantinos Pantos, Iordanis Mourouzis and Athanasios Lourbopoulos in Journal of Cerebral Blood Flow & Metabolism
Supplemental Material
sj-jpg-3-jcb-10.1177_0271678X221083387 - Supplemental material for Machine learning based analysis of stroke lesions on mouse tissue sections
Supplemental material, sj-jpg-3-jcb-10.1177_0271678X221083387 for Machine learning based analysis of stroke lesions on mouse tissue sections by Gerasimos Damigos, Evangelia I Zacharaki, Nefeli Zerva, Angelos Pavlopoulos, Konstantina Chatzikyrkou, Argyro Koumenti, Konstantinos Moustakas, Constantinos Pantos, Iordanis Mourouzis and Athanasios Lourbopoulos in Journal of Cerebral Blood Flow & Metabolism
Supplemental Material
sj-jpg-4-jcb-10.1177_0271678X221083387 - Supplemental material for Machine learning based analysis of stroke lesions on mouse tissue sections
Supplemental material, sj-jpg-4-jcb-10.1177_0271678X221083387 for Machine learning based analysis of stroke lesions on mouse tissue sections by Gerasimos Damigos, Evangelia I Zacharaki, Nefeli Zerva, Angelos Pavlopoulos, Konstantina Chatzikyrkou, Argyro Koumenti, Konstantinos Moustakas, Constantinos Pantos, Iordanis Mourouzis and Athanasios Lourbopoulos in Journal of Cerebral Blood Flow & Metabolism
Supplemental Material
sj-jpg-5-jcb-10.1177_0271678X221083387 - Supplemental material for Machine learning based analysis of stroke lesions on mouse tissue sections
Supplemental material, sj-jpg-5-jcb-10.1177_0271678X221083387 for Machine learning based analysis of stroke lesions on mouse tissue sections by Gerasimos Damigos, Evangelia I Zacharaki, Nefeli Zerva, Angelos Pavlopoulos, Konstantina Chatzikyrkou, Argyro Koumenti, Konstantinos Moustakas, Constantinos Pantos, Iordanis Mourouzis and Athanasios Lourbopoulos in Journal of Cerebral Blood Flow & Metabolism
Supplemental Material
sj-jpg-6-jcb-10.1177_0271678X221083387 - Supplemental material for Machine learning based analysis of stroke lesions on mouse tissue sections
Supplemental material, sj-jpg-6-jcb-10.1177_0271678X221083387 for Machine learning based analysis of stroke lesions on mouse tissue sections by Gerasimos Damigos, Evangelia I Zacharaki, Nefeli Zerva, Angelos Pavlopoulos, Konstantina Chatzikyrkou, Argyro Koumenti, Konstantinos Moustakas, Constantinos Pantos, Iordanis Mourouzis and Athanasios Lourbopoulos in Journal of Cerebral Blood Flow & Metabolism
Supplemental Material
sj-pdf-7-jcb-10.1177_0271678X221083387 - Supplemental material for Machine learning based analysis of stroke lesions on mouse tissue sections
Supplemental material, sj-pdf-7-jcb-10.1177_0271678X221083387 for Machine learning based analysis of stroke lesions on mouse tissue sections by Gerasimos Damigos, Evangelia I Zacharaki, Nefeli Zerva, Angelos Pavlopoulos, Konstantina Chatzikyrkou, Argyro Koumenti, Konstantinos Moustakas, Constantinos Pantos, Iordanis Mourouzis and Athanasios Lourbopoulos in Journal of Cerebral Blood Flow & Metabolism
Supplemental Material
sj-pdf-8-jcb-10.1177_0271678X221083387 - Supplemental material for Machine learning based analysis of stroke lesions on mouse tissue sections
Supplemental material, sj-pdf-8-jcb-10.1177_0271678X221083387 for Machine learning based analysis of stroke lesions on mouse tissue sections by Gerasimos Damigos, Evangelia I Zacharaki, Nefeli Zerva, Angelos Pavlopoulos, Konstantina Chatzikyrkou, Argyro Koumenti, Konstantinos Moustakas, Constantinos Pantos, Iordanis Mourouzis and Athanasios Lourbopoulos in Journal of Cerebral Blood Flow & Metabolism
Footnotes
Funding
The author(s) received no specific financial support for the research, authorship, and/or publication of this article.
Acknowledgments
Results can be provided by the authors upon reasonable request. Code and software can be found in https://github.com/BBooda/StrokeAnalyst and ![]() respectively.
respectively.
Declaration of conflicting interests
The author(s) declared no potential conflicts of interest with respect to the research, authorship, and/or publication of this article.
Authors’ contributions
GD, EZ wrote and developed the SA algorithm; NZ, AP, KC and AK performed animal experiments, collected and analyzed data; KM, EZ, IM and CP critically corrected the manuscript; AL, GD and EZ wrote the manuscript; AL conceived the idea and supervised the manuscript. The present study was partial financially supported by UniPharma S.A., National- and EU- funding grants (EuroNanomed3).
Supplemental material
Supplemental material for this article is available online.
References
Supplementary Material
Please find the following supplemental material available below.
For Open Access articles published under a Creative Commons License, all supplemental material carries the same license as the article it is associated with.
For non-Open Access articles published, all supplemental material carries a non-exclusive license, and permission requests for re-use of supplemental material or any part of supplemental material shall be sent directly to the copyright owner as specified in the copyright notice associated with the article.