
Abstract
Ischemic lesion Net Water Uptake (NWU) quantifies cerebral edema formation and likely correlates with the microvascular perfusion status of patients with acute ischemic stroke due to large vessel occlusion (AIS-LVO). We hypothesized that favorable tissue-level collaterals (TLC) predict less NWU and good functional outcomes. We performed a retrospective multicenter analysis of AIS-LVO patients who underwent thrombectomy triage. TLC were measured on cerebral perfusion studies using the hypoperfusion intensity ratio (HIR; volume ratio of brain tissue with [Tmax > 10 sec/Tmax > 6 sec]); favorable TLC were regarded as HIR
580 patients met inclusion criteria. Favorable TLC (β: 4.23, SE: 0.65; p < 0.001) predicted smaller NWU after treatment. Favorable TLC (OR: 2.35, [95% CI: 1.31–4.21]; p < 0.001), and decreased NWU (OR: 0.75, [95% CI: 0.70–0.79]; p < 0.001) predicted good functional outcome, while controlling for age, glucose, CTA collaterals, baseline NIHSS and good vessel reperfusion status.
We conclude that favorable TLC predict less ischemic lesion NWU after treatment in AIS-LVO patients. Favorable TLC and decreased NWU were independent predictors of good functional outcome.
Introduction
Acute ischemic stroke due to large vessel occlusion (AIS-LVO) is caused by blockage of a cervical or cerebral artery that supplies oxygenized blood to the brain tissue. 1 Cerebral edema occurs as a result of persistent brain tissue hypoxia and is the pathophysiological hallmark of ischemic brain undergoing infarction. 2 Extensive tissue-edema formation indicates more profound ischemic damage to the brain and is associated with larger ischemic core lesions and increased risk of secondary intracranial hemorrhage in patients with AIS-LVO.2,3 An adequate assessment of brain edema is crucial for monitoring patients’ clinical course and the identification of imaging biomarkers associated with brain edema progression are an elementary challenge of acute stroke imaging. 4
Robust pial arterial collaterals may temporarily preserve blood flow to otherwise critically hypoperfused brain tissue.5,6 Collateral status is commonly assessed on baseline CT-angiography (CTA) images and has been associated with lower baseline infarct core volumes, smaller early edema formation and infarct progression in AIS-LVO patients.3,7–10 However, collateral assessment on CTA is not standardized, subject to variable interpretation depending upon the used imaging technique, and may be unreliable to accurately measure cerebral perfusion. 5 Tissue-level collaterals (TLC) are assessed automatically and standardized on CT or MRI perfusion imaging by the hypoperfusion intensity ratio (HIR) and have been associated with infarct progression, final core volume and favorable outcomes regardless of CTA collateral status. 7 The correlation between TLC and brain edema progression has not been described.
We hypothesized that a robust TLC profile on perfusion imaging would correlate with less ischemic lesion water uptake after treatment on follow-up non-contrast CT (NCCT). We tested this hypothesis by determining the correlation between TLC using the HIR and ischemic lesion net water uptake (NWU) using a recently proposed CT-based voxel-wise densitometry approach4,11 in AIS-LVO patients undergoing thrombectomy triage. We further hypothesized that a favorable TLC profile and decreased NWU are correlated with good functional outcome after treatment.
Materials and methods
The data that support the findings of this study are available from the corresponding author upon reasonable request.
Study design
We performed a multicenter retrospective cohort study of consecutive patients undergoing thrombectomy triage for AIS-LVO treatment at two comprehensive stroke centers (University Medical Center Hamburg-Eppendorf, Germany and Stanford University Hospital, USA) between January 2013 and December 2019. The study protocol was approved by the institutional review boards of both study centers and complied with the Health Insurance Portability and Accountability Act (HIPAA) and followed the guidelines of the Declaration of Helsinki. Patient informed consent was waived by our review boards for this retrospective study.
Patient inclusion, population and clinical data
Patients were identified from prospectively maintained stroke databases at each center, and clinical, imaging, and demographic data were obtained from the electronic medical records.
Inclusion criteria were: (1) Patients with suspected AIS-LVO who underwent thrombectomy triage within 16 hours after stroke onset; (2) follow-up head non-contrast computed tomography (NCCT) available within 24–48hrs of baseline thrombectomy triage imaging to allow for NWU determination; 11 (3) Follow-up NCCT or b1000 DWI MRI images available 48–72hrs of thrombectomy or hospital admission to assess final infarct core volume; (4) interpretable CT or MR perfusion imaging that allowed for Hypoperfusion Intensity Ratio TLC assessment. In most cases, TLC was determined by CT perfusion performed at the same time as CTA. If CT perfusion was not available, then TLC was determined from MR perfusion studies performed within an average of two hours of the CTA to clarify treatment decisions; (5) anterior circulation large vessel occlusion of the internal carotid artery or first (M1) or second (M2) segment of the middle cerebral artery. Exclusion criteria were: (1) poor CTP or MRP image quality due to excessive motion or failed contrast bolus, (2) absence of at least one follow-up head NCCT examination within 24–48hrs of thrombectomy or hospital admission; (4) absence of at least one follow-up head NCCT/MRI examination within 48–72hrs of thrombectomy or hospital admission; (5) incomplete medical record data for essential clinical or demographic patient data.
Imaging analysis
All CT and MR perfusion studies were automatically analyzed with RAPID (iSchemaView, Menlo Park, CA). The ischemic core was defined as the volume of tissue with a 70% or more reduction in cerebral blood flow relative to the contralateral cerebral hemisphere on CT perfusion or the volume of tissue with restricted diffusion (apparent diffusion coefficient <620 x10−6 mm2/second) on diffusion-weighted MRI. TLC were determined by the HIR, which is the volume of ischemic brain tissue with a time-to-maximum of the tissue residue function (Tmax) delay of >10 seconds divided by the volume of brain tissue with a Tmax delay of >6 seconds. 12 Favorable TLC was defined as HIR ≤0.4, and poor collaterals were defined as HIR >0.4. 8
CTA collaterals were assessed using the modified Tan scale, 13 and good collaterals were defined as filling of ≥50% of the MCA territory, whereas poor collaterals were defined as filling of <50% of the MCA territory.
Ischemic lesion Net Water Uptake on follow-up NCCT imaging was assessed in each patient, following the approach previously described by Broocks et al. and Minnerup et al.4,11 In brief: The density of ischemic tissue (Dischemic) was measured in a region of interest (ROI) defining the demarcated hypoattenuated ischemic lesion on follow-up NCCT. The corresponding normal density (Dnormal) was determined as a ROI mirrored symmetrically to the non-ischemic hemisphere and adjusted anatomically to exclude sulci. The related ROI histogram was sampled between 20 and 80 Hounsfield units (HU). Based on Dischemic and Dnormal, we calculated NWU per volume of infarct, as described previously. 11
The Alberta Stroke Program Early CT Score (ASPECTS) 14 was determined on pre-treatment NCCT images.
Reperfusion after treatment was defined as modified thrombolysis in cerebral infarction (TICI) 2 b-3 in patients who underwent thrombectomy or by interval recanalization of a large vessel occlusion after intravenous administration of recombinant tissue-plasminogen activator (tPA) or spontaneous vessel recanalization without treatment before diagnostic Digital Subtraction Angiography.
Final infarct volume was acquired by manually segmentation on follow-up NCCT images or b1000 DWI MRI images acquired within a period of 48 h–72hrs after patients’ admission and treatment using the software package Horos (Horos Project©, v 3.3.6) by a single neuroradiologist.
Outcome measures
Primary outcome was ischemic lesion NWU (in %). Secondary outcome was assessed by using good functional outcomes (mRS 0–2) 90-days after treatment.
Imaging protocols
University Medical Center Hamburg-Eppendorf: All CT scans were performed on a 256 slice scanners (Philips iCT 256) with the following imaging parameters: NCCT with 120 kV, 280–320 mA, 5.0 mm slice reconstruction; CTA: 100–120 kV, 260–300 mA, 1.0 mm slice reconstruction, 5 mm MIP reconstruction with 1 mm increment, 0.6 mm collimation, 0.8 pitch, H20f soft kernel, 80 mL highly iodinated contrast medium and 50 mL NaCl flush at 4 mL/s; scan starts 6 s after bolus tracking at the level of the ascending aorta). CTP: 80 kV, 200–250 mA, 5 mm slice reconstruction (max. 10 mm), slice sampling rate 1.50 s (min. 1.33 s), scan time 45 s (max. 60 s), biphasic injection with 30 ml (max. 40 ml) of highly iodinated contrast medium with 350 mg iodine/ml (max. 400 mg/ml) injected with at least 4 ml/s (max. 6 ml/s) followed by 30 ml sodium chloride chaser bolus.
Stanford University: Non-contrast head CT and CTA were performed in all patients with standard protocols using a 64-slice helical CT scanner (LightSpeed; GE Medical Systems, Waukesha, WI). Axial non-contrast head CT images were obtained with 120 kVp, 170 mA, and 5-mm slice thickness reconstruction. CTA: axial images were acquired at 100–120 kV, 260–300 mA, 1.0 mm slice reconstruction, 0.6 mm collimation, 0.8 pitch, H20f soft kernel. Iodinated contrast was injected into an antecubital vein at 4–5 mL/s with a saline flush. Images were acquired using a bolus tracking technique based upon contrast opacification of the ascending aorta.
CTP: a 35–0 ml bolus of iodinated contrast is delivered by power injection into an antecubital vein at a rate of 4–5 ml/sec followed by a 20 ml saline chase at the same injection rate. Dynamic cine image acquisition is performed following a 5–7 second delay after the contrast injection. Image acquisition; two slab acquisition at 80 kV, 200–250 mA, 5 mm slice reconstruction.
Statistical analysis
Patient demographics, clinical variables, and neuroimaging data were compared between two groups using the χ2 and Wilcoxon rank-sum tests. Kolmogorov-Smirnov test was computed to assess for normality of data distribution. Clinical and imaging variables association with NWU and functional outcome was assessed using multivariable models: General Linear Model (GLM) regression with ANOVA analysis and binary logistic regression, respectively. The model for primary outcome was adjusted for age, presentation National Institutes of Health Stroke Scale (NIHSS), TLC, serum glucose at enrollment, robust CTA collateral status, and for good vessel reperfusion status (TICI 2 b-3 achieved by thrombectomy or after tPA administration or spontaneous vessel recanalization). The model for the secondary outcome was adjusted for age, presentation NIHSS, serum glucose at enrollment, TLC, NWU on follow-up NCCT, vessel reperfusion status (TICI 2 b-3 achieved by thrombectomy or after tPA administration or spontaneous vessel recanalization), and robust CTA collaterals. Alpha was set at the 0.05 level, and all reported results are two-sided. Statistical analysis was done using IBM SPSS statistics, v. 26.0.
Results
A total of 740 patients underwent thrombectomy triage, and 580 met inclusion criteria (Supplementary Figure 1). Patients were dichotomized into favorable TLC (TLC+; HIR: ≤0.4) and unfavorable TLC (TLC-; HIR: >0.4). There were 276 patients in the TLC+ and 304 patients in the TLC- group.
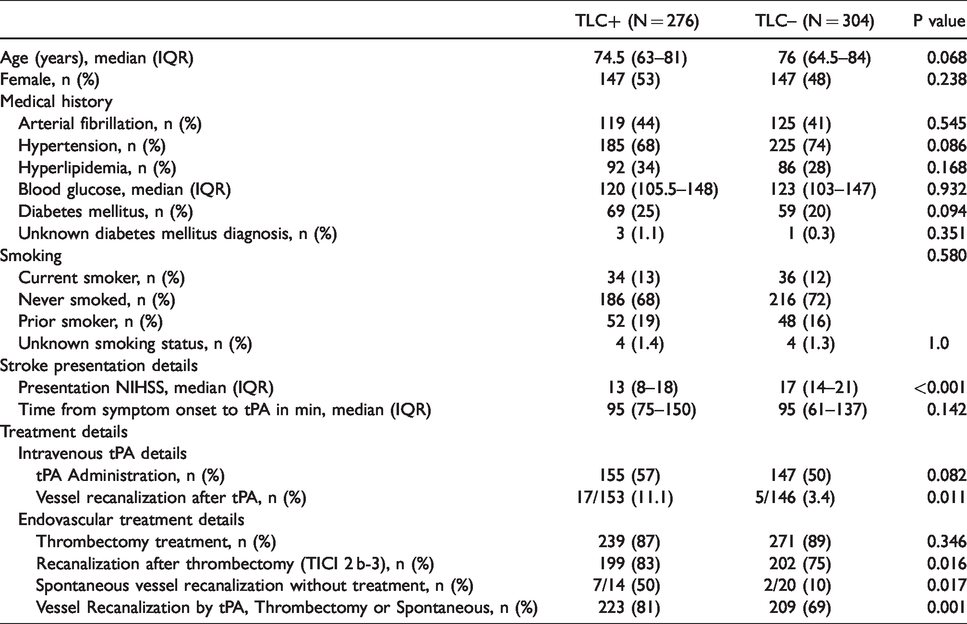
There was no significant difference in patients’ age (median 74.5 years [IQR 63–81] versus 76 years [IQR 64.5–84]; p = 0.068) or sex (female patients: 53% versus 48%; p = 0.238) between the TLC+ and TLC- group.
TLC+ patients were more likely to achieve vessel recanalization after intravenous tPA administration (11.1% vs. 3.4%, p=0.011; Table 1) and thrombectomy (83% versus 75%; p=0.016) and presented with less severe symptoms (median presentation NIHSS 13 [IQR 8–18] versus 17 [IQR 14–21]; p < 0.001). There were no other significant differences with respect to patient demographics or medical comorbidities. These results are summarized in Table 1.
Patient characteristics and stroke presentation details.
On baseline imaging evaluation, TLC+ patients had higher ASPECTS (median 8 [IQR 7 – 9.5] versus 7 [IQR 6 – 8]; p < 0.001), smaller baseline ischemic core volumes (median 0 ml [IQR 0 – 8] versus 31 ml [IQR 14 – 64]; p < 0.001), smaller penumbra volumes (median 92 ml [IQR 55 – 144] versus 147.5 ml [IQR 92.5 – 200.5]; p < 0.001), and more favorable CTA collateral profiles (88% versus 58%; p < 0.001) compared to TLC- patients. Ischemic lesion NWU was significantly lower in patients with TLC+ compared to TLC- profiles (8.67% [IQR 5.13–14.8] versus 17.0% [IQR 11.73–22.03] (Figure 1). These findings are summarized in Table 2.
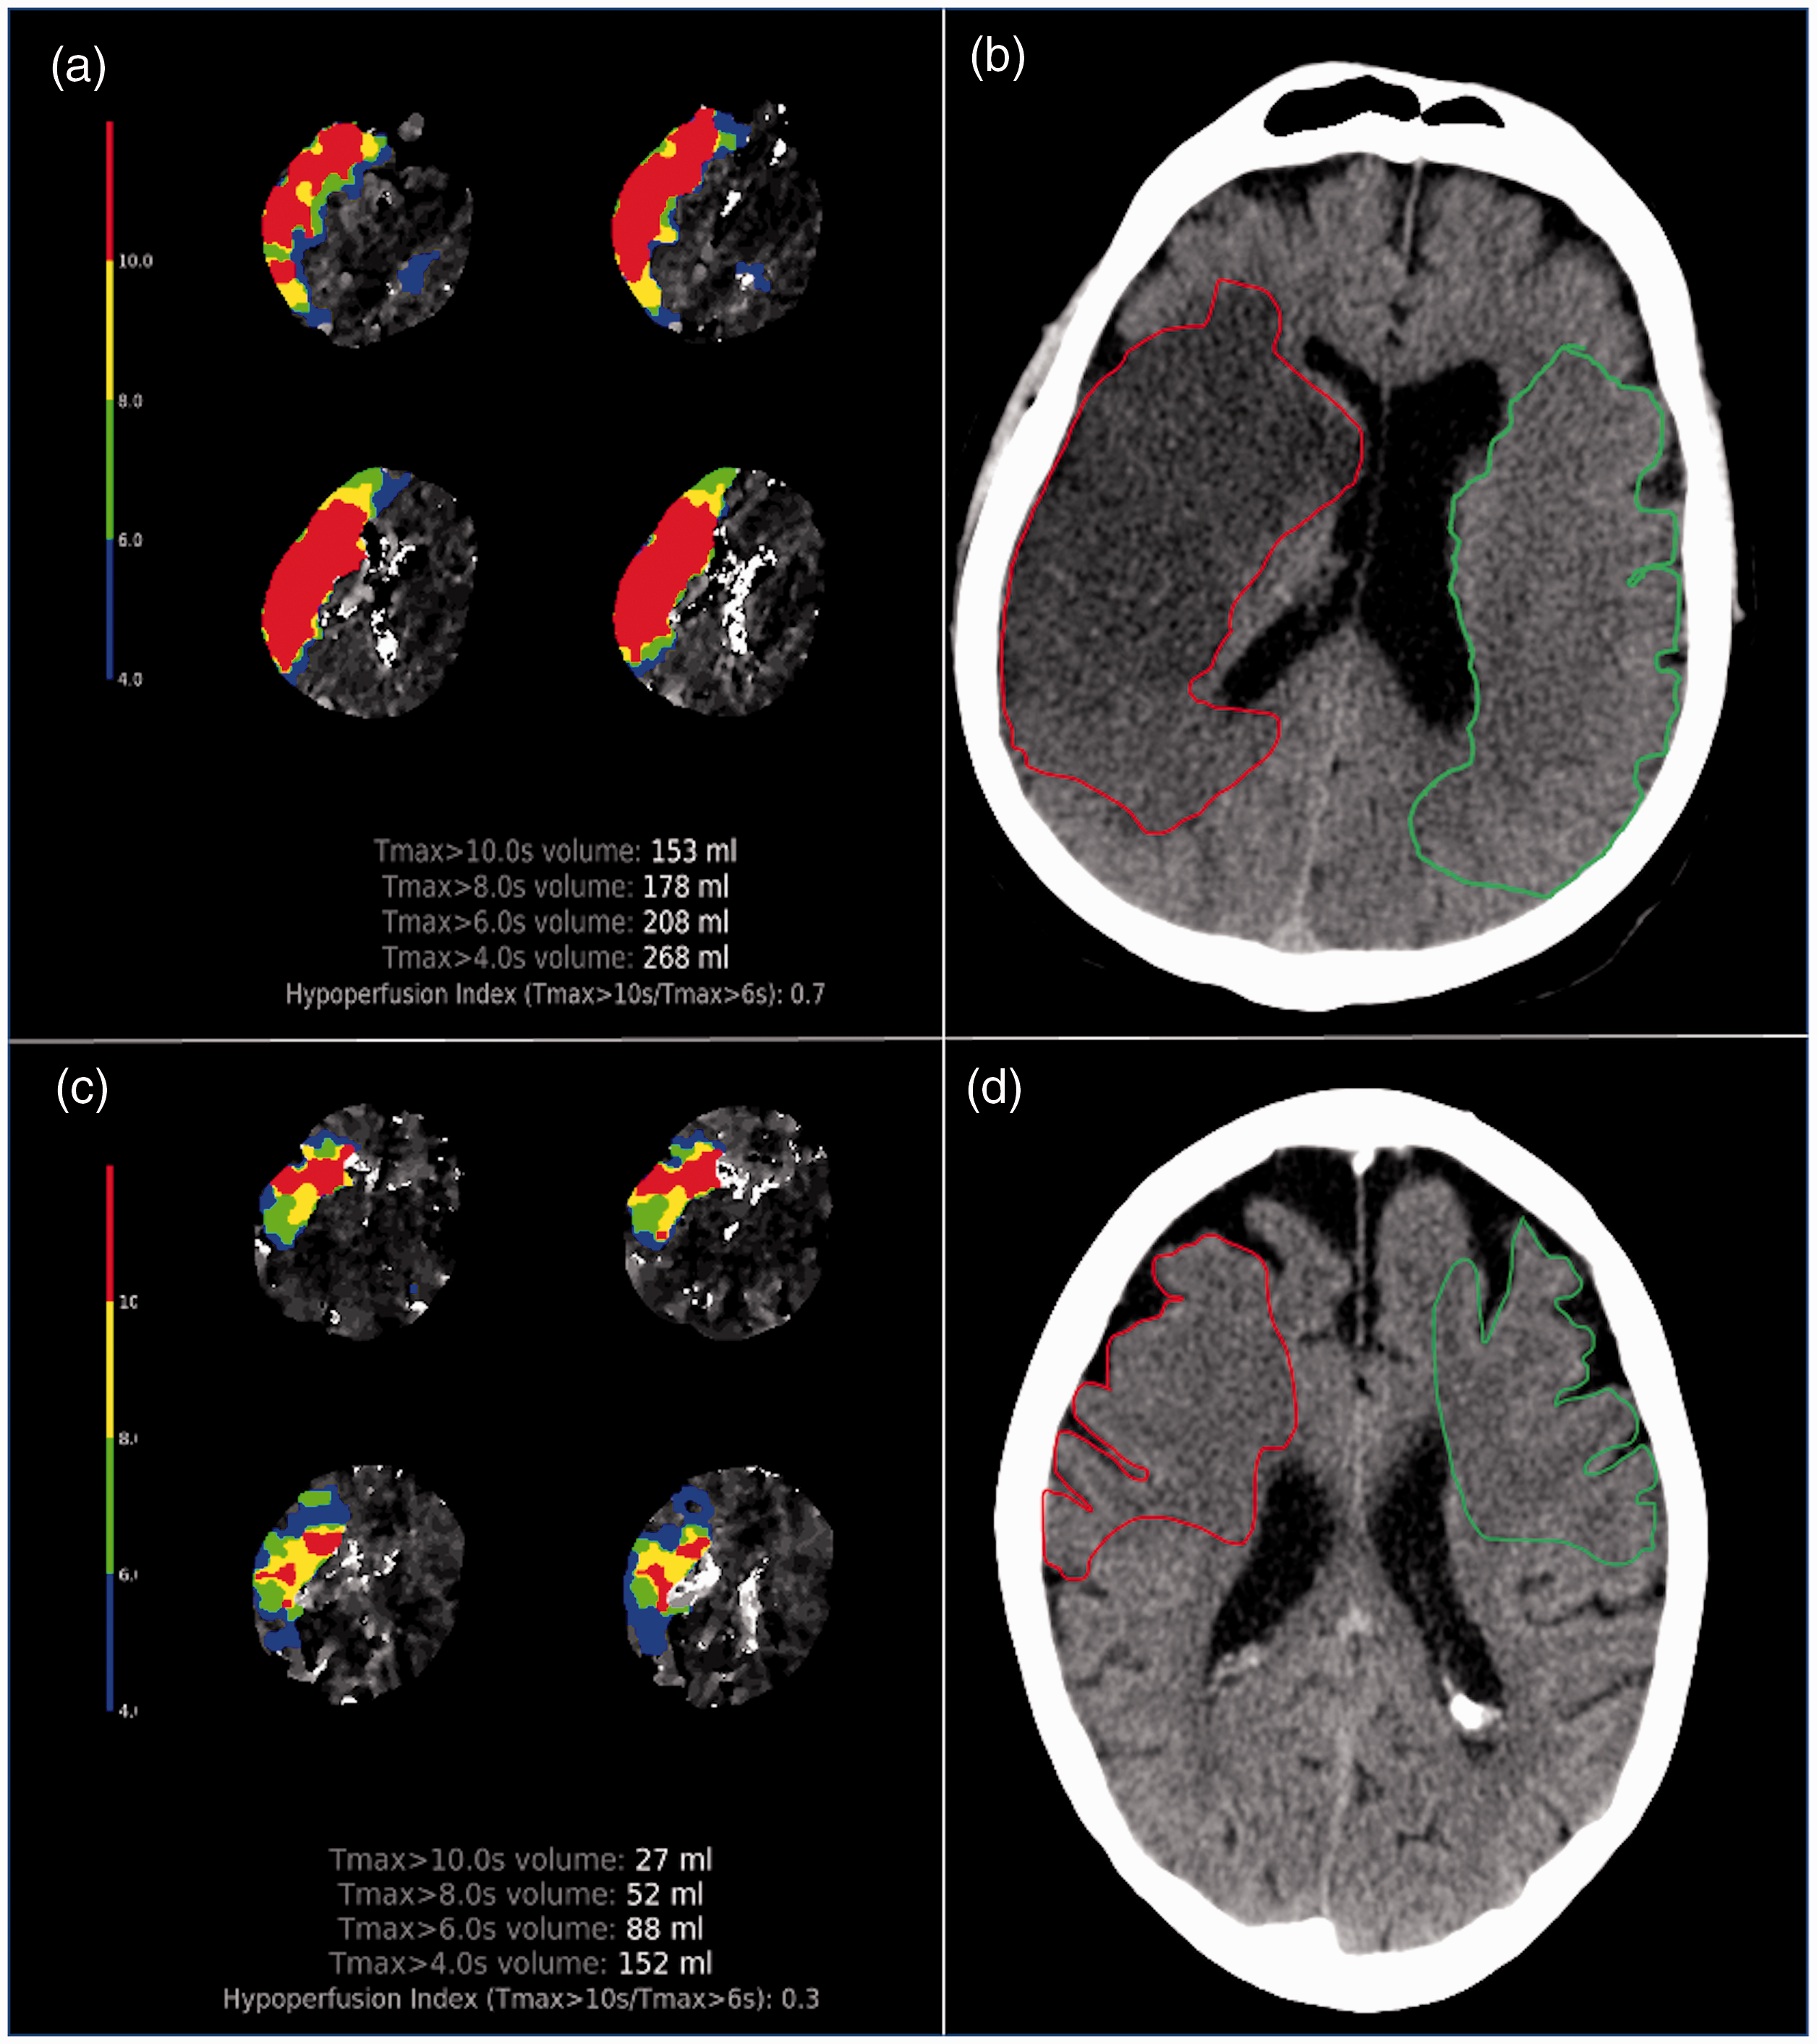
Association between TLC and NWU in AIS-LVO patients.
Presentation imaging details dichotomized by tissue level collateral profile.

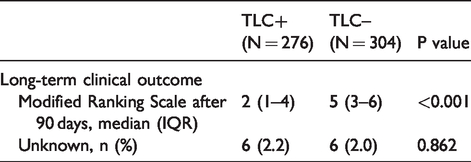
90-days after treatment TLC+ patients had significantly better functional outcomes compared to TLC- patients (median 2 [IQR 1 – 4] vs. 5 [IQR 3 – 6]: p < 0.001) (Table 3).
Clinical outcomes.
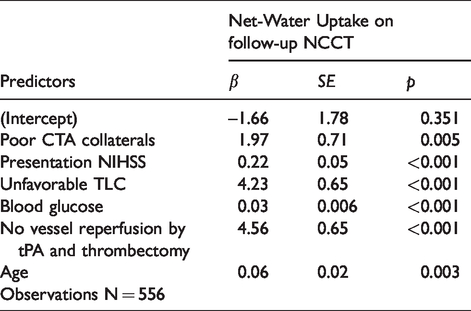
For primary outcome analysis, 556 patients were included in a multivariable GLM regression model. Twenty-four patients were excluded from this analysis, n = 8 due to unknown presentation NIHSS and n = 16 due to unknown blood glucose. Under control for all other variables in the model (Table 4), unfavorable TLC (β: 4.23, SE: 0.65; p < 0.001), poor CTA collaterals (β: 1.97, SE: 0.71; p = 0.005), presentation NIHSS (β: 0.22, SE: 0.05; p < 0.001), admission blood glucose (β: 0.03, SE: 0.006; p < 0.001), age (β: 0.06, SE: 0.02; p = 0.03) and poor vessel reperfusion status after thrombectomy or tPA administration (β: 4.56, SE: 0.65; p < 0.001) predicted higher ischemic lesion NWU on follow-up NCCT.
Linear regression analysis (ANOVA) for primary outcome (net water uptake).
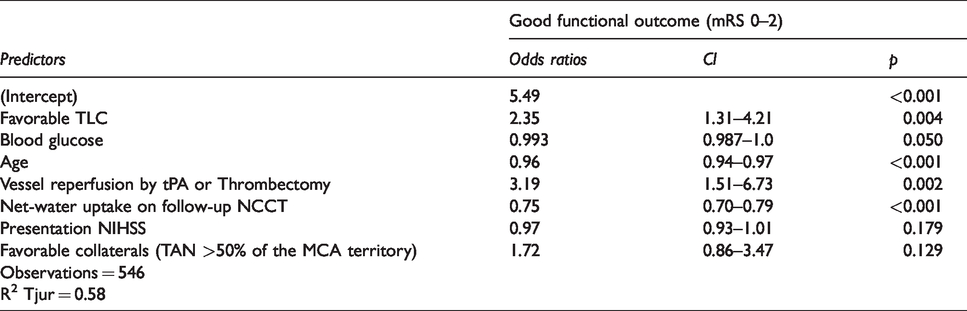
In the regression model for secondary outcome analysis, favorable TLC (OR: 2.35, CI: 1.31–4.21; p = 0.004), less ischemic lesion NWU (OR: 0.75, CI: 0.70–0.79; p < 0.001) (Figure 2), lower blood glucose (OR: 0.993, CI: 0.987–1.0; p = 0.05), younger patients’ age (OR: 0.96, CI: 0.94–0.97; p < 0.001) and vessel recanalization status after tPA or thrombectomy (OR: 3.19, CI: 1.51–6.73; p = 0.002) were independent predictors of a favorable functional outcome, under control for all other variables in the model. CTA collaterals were not found to be independent predictors of functional outcome (OR: 1.72, CI: 0.86–3.47; p = 0.129) (Table 5).
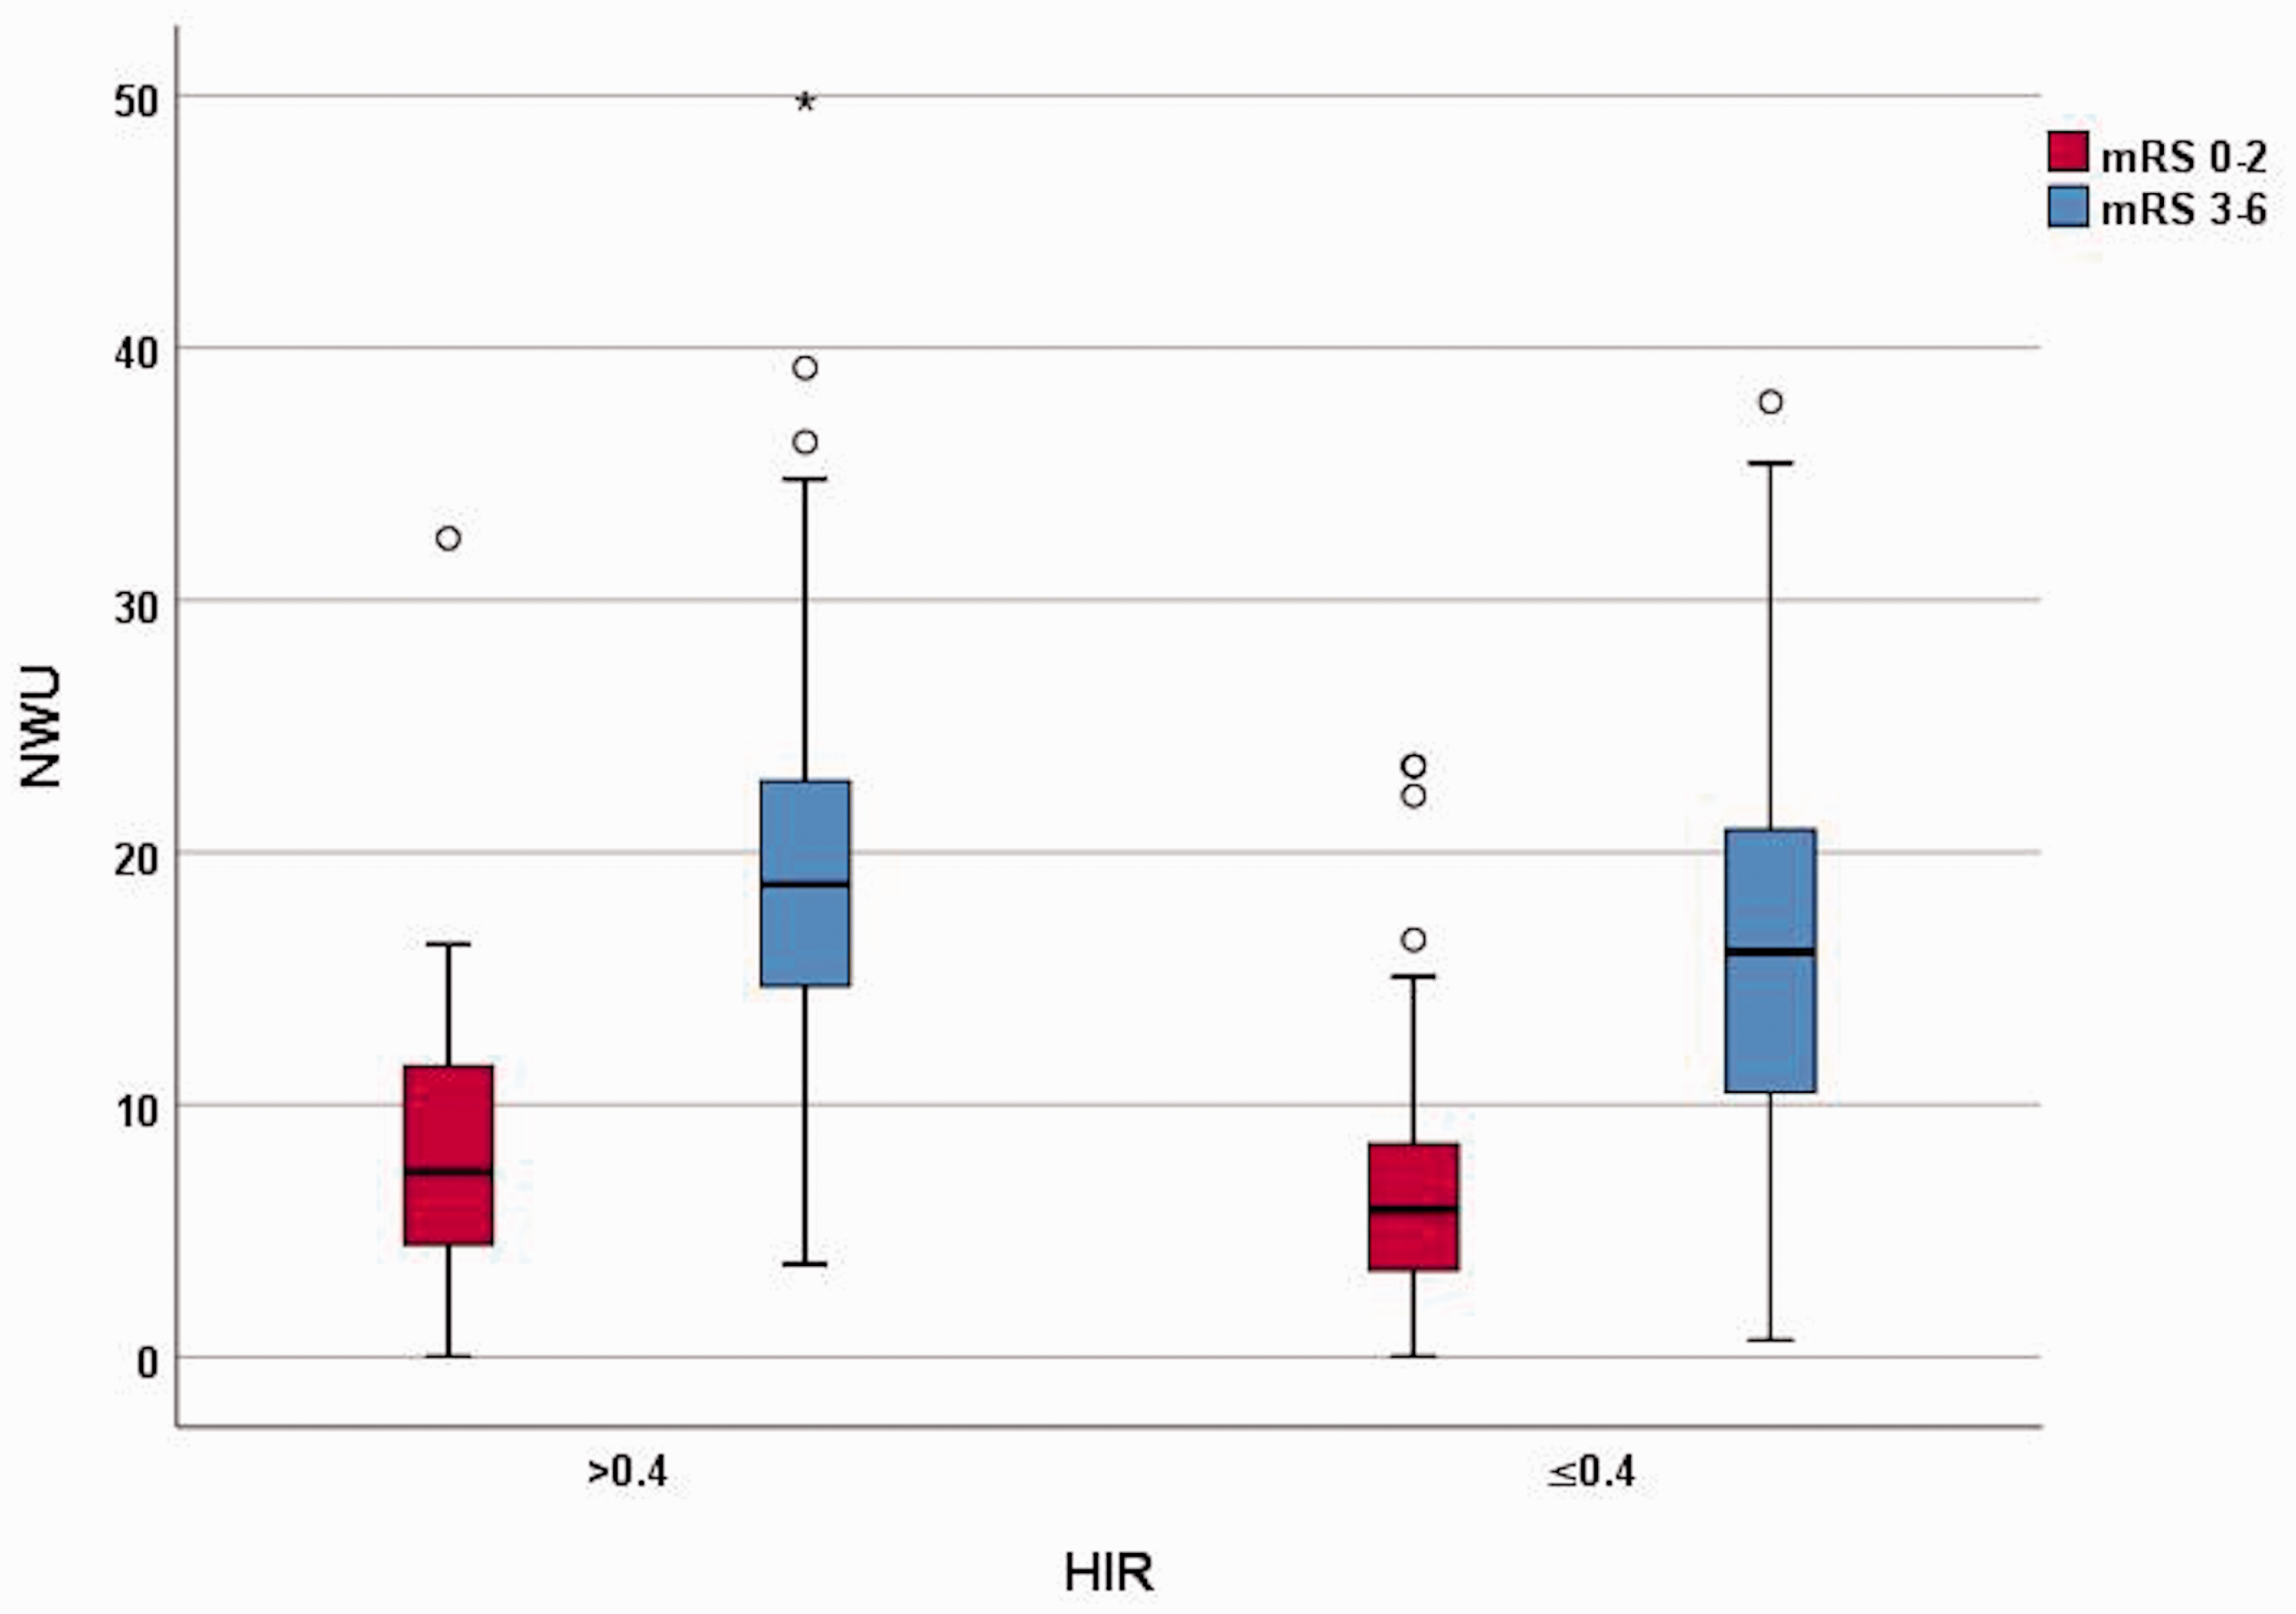
Relationship of HIR and NWU with functional outcomes.
Binary logistic regression analysis for secondary outcome (modified Ranking scale).
Discussion
In this study of AIS-LVO patients, we found that favorable TLC were strongly associated with less ischemic lesion NWU on follow-up NCCT after treatment. Further, we found that favorable TLC and decreased ischemic lesion NWU predicted good functional outcome regardless of CTA collaterals status. Our study highlights the importance of the TLC status, assessed by perfusion imaging, for brain edema formation and provides important insights into how cerebral microvascular perfusion profiles of AIS-LVO patients are linked to ischemic lesion edema formation and clinical outcomes after treatment.
Favorable TLC are an accurate measure of whether blood filling the pial arterial collateral network successfully permeates the brain tissue. 8 The association of favorable TLC profiles with robust CTA collaterals supports the theory that unhindered arterial collateral blood flow in ischemic brains is associated with better tissue microperfusion. This assumption is further strengthened by our findings that patients with favorable TLC profiles exhibited higher ASPECTS, lower baseline ischemic core volumes, and less severe initial symptoms (lower NIHSS). These results are comparable to prior studies that found patients with favorable TLC (reflected by HIR) to have more robust CTA collateral profiles, smaller ischemic core volumes and reduced final infarct volumes in AIS-LVO patients treated with thrombectomy.7,8
However, the association between pial collateral flow, TLC and brain edema formation after treatment is not well understood. Prior studies suggested that extensive brain edema formation is associated with poor microvascular perfusion in AIS-LVO patients.15,16 In addition, a strong association was found between collateral status on CTA and early edema progression rate, determined by NWU, prior to treatment. 10 Our findings that increased ischemic lesion NWU is strongly correlated with poor CTA collateral profiles and unfavorable TLC support the theory that more extensive brain edema formation occurs secondary to poor microvascular perfusion.
In this study, we did study whether admission CT ischemic NWU is correlated with TLC and post-treatment NWU. A prior study 10 found an association between lower NWU progression rates and robust CTA collaterals, and it is conceivable that a similar relationship would exist for favorable TLC and presentation NWU values. We note however that TLC, like pial arterial collaterals, may be dynamic and are likely to be dependent upon hemodynamic parameters. Therefore, the relationship between NWU and TLC may be dynamic, and future studies are needed to understand better the relationship between ischemic lesion formation and cerebral blood flow as a stroke evolves.
Further, extensive brain edema formation itself hinders cerebral microperfusion. After onset of a large vessel occlusion, pronounced levels of brain edema with progressive tissue water uptake may lead to elevated interstitial pressure, which may result in increasing resistance of collateral arterioles and downstream perforating arterioles in the hypoperfused area. 10 These reinforcing mechanisms may even further aggravate ischemic brain edema progression over time, resulting in adverse functional outcomes even after successful endovascular recanalization. 15 Consequently, there is an urgent need for reliable imaging biomarkers that strongly correlate with time-dependent ischemic edema formation and functional outcome after treatment. 3
Our finding that increased ischemic lesion NWU strongly predicts functional outcome are line with prior studies.2,3,9,10,15 Interestingly, we found that favorable TLC and lower ischemic lesion NWU were strong predictors of good functional outcome regardless of CTA collateral status. The uncoupling of CTA collateral robustness, despite being an independent predictor of final infarct volume, from TLC as a predictor of functional outcome in AIS-LVO patients has been described before. 7 Prior studies presumed that this finding may be explained by an ultimate failure of the collateral circulation of AIS-LVO patients that were not recanalized, 17 which would consequently make them comparable to patients with a poor collateral profile in terms of infarct growth and impaired functional outcome.7,18 In addition, another explanation was that in comparison to TLC, single-phase CTA collateral assessment may not reliably determine pial and parenchymal arteries and arterioles that still allow for retrograde blood flow, even when the CTA collateral status appears to be poor. 7
The interconnection between TLC and ischemic lesion NWU and their correlation with clinical outcome regardless of CTA collateral status may also be explained by edema-induced alterations of regional tissue perfusion. Regional brain perfusion is correlated with the spatial magnitude of edema influx: In human stroke, magnetic resonance imaging (MRI) shows that edema is first found in peri-infarct regions that are actively perfused. 19 Newer theories moreover suggest that cerebral tissue microperfusion on the level of parenchymal arteries and arterioles is decreased secondary to a progressive cascade of cytotoxic edema, followed by ionic and vasogenic edema.20,21 It is conceivable that tissue-specific perfusion imaging measures of blood flow, such as TLC, more accurately reflect edema-induced regional alterations of cerebral microvascular perfusion and arterial collateral flow status. Additional studies are needed to investigate the correlation between TLC and early brain edema formation, as well as edema progression over time to identify the underlying mechanisms of our findings.
Our study has several limitations. The retrospective design may introduce bias and limit the generalizability of our findings. In addition, variable CT scanner hardware and protocols and other population differences between our two sites may confound our results. Collateral assessment on CTA is inherently subjective and similar to prior studies, we did not have more sensitive measures of collateral status, such as multiphase CTA or catheter angiography, for all patients in the study. 7 The use of multiphase CTA or angiography collaterals may have led to different findings regarding the association of CTA collateral status with functional outcomes, as both measures also optimally reflect delayed filling of pial collaterals and smaller arterioles.22,23 The heterogeneity in final core infarction volume and perfusion parameters due to different imaging modalities (MRI and CT) may also introduce bias. As mentioned before, we did not assess ischemic-lesion NWU on pre-treatment NCCT. Consequently, our study does not allow any assumptions regarding an association of CTA collaterals and TLC with early edema formation or edema progression over time. Additional studies are warranted to further investigate the impact of distinct microvascular perfusion measures for edema quantification over time.
Conclusion
In AIS-LVO patients, favorable TLC and robust CTA collaterals were strongly associated with less ischemic lesion NWU on follow-up NCCT imaging. Favorable TLC and decreased NWU strongly predicted good functional outcome regardless of CTA collateral status. These findings support the idea that tissue-specific imaging biomarkers of microvascular perfusion, such as TLC, more accurately reflect the arterial collateralization status compared to conventional collateral measures and may be a reliable biomarker for the prediction of cerebral edema formation in AIS-LVO patients after treatment.
Supplemental Material
sj-pdf-1-jcb-10.1177_0271678X21992200 - Supplemental material for Perfusion imaging-based tissue-level collaterals predict ischemic lesion net water uptake in patients with acute ischemic stroke and large vessel occlusion
Supplemental material, sj-pdf-1-jcb-10.1177_0271678X21992200 for Perfusion imaging-based tissue-level collaterals predict ischemic lesion net water uptake in patients with acute ischemic stroke and large vessel occlusion by Tobias D Faizy, Reza Kabiri, Soren Christensen, Michael Mlynash, Gabriella Kuraitis, Gabriel Broocks, Uta Hanning, Jawed Nawabi, Maarten G Lansberg, Michael P Marks, Gregory W Albers, Jens Fiehler, Max Wintermark and Jeremy J Heit in Journal of Cerebral Blood Flow & Metabolism
Footnotes
Funding
The author(s) disclosed receipt of the following financial support for the research, authorship, and/or publication of this article: Tobias Djamsched Faizy was funded by the German Research Foundation (DFG) for his work as a postdoctoral research scholar at Stanford University, Department of Neuroradiology (Project Number: 41,16,21,970).
Declaration of conflicting interests
The author(s) declared the following potential conflicts of interest with respect to the research, authorship, and/or publication of this article: Dr Tobias D. Faizy reports no disclosure; Mr Reeza Kabiri reports no disclosure; Dr Maarten G. Lansberg reports no disclosure; Dr Gregory W. Albers reports equity and consulting for iSchemaView and consulting from Medtronic; Dr Michael Mlynash reports no disclosure; Dr. Michael Marks reports equity in ThrombX Medical; Ms. Gabriela Kuraitis reports no discosure; Dr Uta Hanning reports no disclosure; Dr Gabriel Broocks reports no disclosure; Dr Jawed Nawabi reports no disclosure; Dr Soren Christensen reports no disclosure; Dr Jens Fiehler reports no disclosure; Dr Max Wintermark reports no disclosure; Dr Jeremy J. Heit reports consulting for Medtronic and MicroVention and Medical and Scientific Advisory Board membership for iSchemaView.
Authors’ contributions
The authors of this study contributed as follows:
Tobias D. Faizy: Study design and conceptualization. Acquisition of the data. Image processing. Image analysis. Data analysis. Drafting the manuscript and revising it critically. Approving a final version of the manuscript to be published.
Reza Kabiri: Study design and conceptualization. Acquisition of the data. Image processing. Drafting the manuscript and revising it critically. Approving a final version of the manuscript to be published.
Soren Christensen: Study design and conceptualization. Acquisition of the data. Image processing. Image analysis. Data analysis. Drafting the manuscript and revising it critically. Approving a final version of the manuscript to be published.
Michael Mlynash: Acquisition of the data. Data analysis. Statistical supervisor and statistical analysis. Drafting the manuscript and revising it critically. Approving a final version of the manuscript to be published.
Gabriella Kuraitis: Acquisition of the data. Image processing. Data analysis. Drafting the manuscript and revising it critically. Approving a final version of the manuscript to be published.
Gabriel Broocks: Data analysis. Drafting the manuscript and revising it critically. Approving a final version of the manuscript to be published.
Uta Hanning: Data analysis. Drafting the manuscript and revising it critically. Approving a final version of the manuscript to be published.
Jawed Nawabi: Data analysis. Data interpretation. Drafting the manuscript and revising it critically. Approving a final version of the manuscript to be published.
Maarten G. Lansberg: Data interpretation. Supervision. Drafting the manuscript and revising it critically. Approving a final version of the manuscript to be published.
Michael P. Marks: Data interpretation. Supervision. Drafting the manuscript and revising it critically. Approving a final version of the manuscript to be published.
Gregory W. Albers: Conceptualization of the study. Data interpretation. Supervision. Drafting the manuscript and revising it critically. Approving a final version of the manuscript to be published.
Jens Fiehler: Data interpretation. Supervision. Drafting the manuscript and revising it critically. Approving a final version of the manuscript to be published.
Max Wintermark: Conceptualization of the study. Data interpretation. Supervision. Drafting the manuscript and revising it critically. Approving a final version of the manuscript to be published.
Jeremy J. Heit: Study design and conceptualization. Acquisition of the data. Image processing. Image analysis. Data analysis. Supervision. Drafting the manuscript and revising it critically. Approving a final version of the manuscript to be published.
Supplemental material
Supplemental material for this article is available online.
References
Supplementary Material
Please find the following supplemental material available below.
For Open Access articles published under a Creative Commons License, all supplemental material carries the same license as the article it is associated with.
For non-Open Access articles published, all supplemental material carries a non-exclusive license, and permission requests for re-use of supplemental material or any part of supplemental material shall be sent directly to the copyright owner as specified in the copyright notice associated with the article.