
Abstract
Vascular contributions to cognitive impairment and dementia (VCID) are the second leading cause of dementia behind Alzheimer’s disease. Apolipoprotein E (ApoE) is a lipid transporting lipoprotein found within the brain and periphery. The APOE ε4 allele is the strongest genetic risk factor for late onset Alzheimer’s disease and is a risk factor for VCID. Our lab has previously utilized a dietary model of hyperhomocysteinemia (HHcy) to induce VCID pathology and cognitive deficits in mice. This diet induces perivascular inflammation through cumulative oxidative damage leading to glial mediated inflammation and blood brain barrier breakdown. Here, we examine the impact of ApoE ε4 compared to ε3 alleles on the progression of VCID pathology and inflammation in our dietary model of HHcy. We report a significant resistance to HHcy induction in ε4 mice, accompanied by a number of related differences related to homocysteine (Hcy) metabolism and methylation cycle, or 1-C, metabolites. There were also significant differences in inflammatory profiles between ε3 and ε4 mice, as well as significant reduction in Serpina3n, a serine protease inhibitor associated with ApoE ε4, expression in ε4 HHcy mice relative to ε4 controls. Finally, we find evidence of pervasive sex differences within both genotypes in response to HHcy induction.
Introduction
Vascular contributions to cognitive impairment and dementia (VCID) are the second leading cause of dementia behind Alzheimer’s disease (AD).1,2 Our lab has previously demonstrated a dietary animal model of VCID via induction of hyperhomocysteinemia (HHcy), an established independent risk factor for stroke and VCID.3,4 The diet acts by severely reducing vitamins B6, B12, and folate, while elevating methionine, in order to drive the production of homocysteine (Hcy). 5 Use of this diet has been shown to generate cognitive impairment, hemorrhagic vascular pathology, and gliosis in wild type mice.3–5 The Hcy dietary model of VCID is thought to exert pathology by way of endothelial oxidative stress, initiating a sequelae of events including inflammation, upregulation of matrix-metalloproteinases, degradation of the basement membranes and tight junctions of the vasculature, ultimately resulting in blood-brain barrier breakdown and astrocytic end-foot dissociation, microhemorrhages, and cognitive impairment.3,4,6
Apolipoprotein E (ApoE) is a lipid binding protein involved primarily in the binding and transport of cholesterol within the brain and periphery.7,8 The ε4 allele of
In the current study, we examine the impact of ApoE ε3 and ApoE ε4 homozygous carriage on HHcy-induced VCID using a humanized ApoE mouse model in conjunction with a dietary HHcy model. We find that ε3 mice developed more severe levels of HHcy than ε4 s, along with significant differences in methylation metabolites involved in the HHcy cycle. Further, there was significant inflammatory differences between the two genotypes, with ε3 s presenting with higher levels of neuroinflammatory cytokines than ε4 s, namely, IL1β and members of the matrix metalloprotease systems. Contrary to our hypothesis at the outset, the ε4 mice presented with fewer instances of hemorrhagic vascular pathology than their ε3 counterparts. We also show significant increases in the expression of APOE and SERPINA3N in ε4 mice reared on a HHcy diet in a sex dependent manner. Finally, we show substantial sex differences within genotypes in response to the HHcy diet in most experimental endpoints presented here, suggesting an interaction between sex and APOE genotype in the progression of VCID.
Methods & reagents
Mouse husbandry
Human ApoE 3/3 and 4/4 homozygote knock-in mice as described previously were used for this study.21,22 Groups are laid out in Supplemental Table 1. Mice were bred in house and housed in groups of 2-4 typically, with only 3 mice being singly housed. Mice were aged to approximately 6 months old before administering respective diets. The study was approved by the University of Kentucky Institutional Animal Care and Use Committee and conformed to the National Institutes of Health Guide for the Care and Use of Animals in Research. All studies were performed blinded. All studies were completed in compliance with the Animal Research: Reporting In Vivo Experiments guidelines. Sample sizes were based on power analyses performed for previous papers involving mice on the HHcy diet that did not identify sex-specific differences so we did not power this study to specifically examine sex differences leading to lower numbers here than ideal for comparisons between sexes.17,23
Diet administration
Mice were given either the HHcy diet [(Envigo TD130867; Indianapolis, IN)(Supplemental Figure 2)] which is deficient in vitamins B12, B6 and folate and enriched in methionine, or a nutritionally corrected Control diet (Envigo TD01636) ad libitum. Animals were weighed weekly to monitor body mass loss and any forms of ailments. (Supplemental Figure 1). Diet was administered for 12 weeks, at which point animals were euthanized and tissue collected.
Tissue collection and processing
Animals were euthanized and tissue collected as previously described. 3 Briefly, animals received a lethal intraperitoneal injection of beuthanasia-D. When animals were unresponsive to footpad and tail stimulation, animals were then intracardially perfused with 20 mL normal saline. Blood was collected at euthanasia prior to perfusion and spun at 1000xg at 4 degrees for 15 minutes and plasma collected. Brain was removed for further dissection. The right hemisphere was dissected into frontal cortex, posterior cortex, hippocampus, striatum, cerebellum, thalamus, and the remainder of midbrain and flash frozen in liquid nitrogen and stored at –80 °C until performance of studies. The left hemisphere was placed into freshly prepared 4% paraformaldehyde for 24 hours. The left hemispheres were passed through a gradient of 10% and 20% sucrose for 24 hours each and 30% sucrose for 48 hours for cryoprotection. Tissue was sectioned horizontally at a thickness of 25 µm serially using a sliding microtome with a freezing stage. Sections were stored at 4°C in a 1xPBS solution containing sodium azide (0.82 g in 1 L).
RNA extraction
Frozen right hippocampi were extracted for RNA as previously described. 3 Thus, all gene expression measures herein are hippocampal expression, specifically. Briefly, tissue was homogenized via rotor homogenization and then RNA was extracted using the E.Z.N.A. Total RNA Kit (Omega Bio-Tek, Norcross, GA) according to manufacturer’s instructions. Aliquots of the RNA were sent to the UK College of Medicine Genomics Core for concentration and RNA integrity determination using an Agilent 2100 Bioanalyzer.
NanoString
Aliquots of 10 µL of 10 ng/µL RNA were prepared and ran on the NanoString SPRINT system using the NanoString Mouse Neuroinflammatory Panel kit by the UK College of Medicine Genomics core. Data was returned to experimenters in the form of spreadsheets containing raw counts for each of the included targets.
Gene expression for all endogenous genes was investigated using multivariable linear regression models (Gene Expression Data Analysis Guidelines. Nanostring Technologies. 2017). Transcript counts for each gene were regressed on the sum of all positive control gene counts (for normalization), and an indicator for: diet (HHcy diet or control diet), genotype (ε3 or ε4), or sex (male or female). Since gene expression counts were expected to be right-skewed, gene expression counts and the sum of all positive control gene counts were log-transformed (base 2) prior to modeling (nCounter Advanced Analysis 2.0 Plugin for nSolver Software. NanoString Technologies, 2018). The differential expression p-values for diet, genotype, and sex were adjusted using an FDR cutoff of 0.05 and converted to q-values.
All analyses were performed in R version 4.0.3 (R Core Team (2020), Vienna, Austria).
cDNA preparation
RNA from the right hippocampus was also used to generate cDNA as previously described (Sudduth et al., 2017). Briefly, the High Capacity cDNA Kit (ThermoFisher, Grand Island, NY) was used to generate cDNA at a concentration of 50 ng/µL and then stored at −20°C in preparation for RT-qPCR.
RT-qPCR
RT-qPCR was performed for the probes listed in Supplemental Table 2 as previously described (Sudduth et al, 2017). Briefly, 1 µL of cDNA was diluted with 6 µL of RNase-free water and then added to a mix of 1 µL of the respective probe and 10 µL of FastTaq. Target amplification was achieved using the ViiA7 (Applied Biosystems, Grand Island, NY). Results were collected as Comparative CT relative to 18 s rRNA, used as our endogenous control. Fold change was calculated for each sample based on −ΔΔCT calculations (Livak and Schmittgen, 2001). Grubbs outlier test was applied to each group prior to analysis. Samples that were identified as statistical outliers were removed from further analysis of that particular measure. ANOVA and each-way t-tests were performed between groups for each target using JMP Statistical Software (JMP Pro 13). Group averages and standard error of the mean were then plotted using GraphPad Prism 9.
Tissue histology
7–8 sections spaced 600 µm apart were utilized for all staining protocols.
Prussian Blue Staining: Sections were mounted onto slides and dried overnight before 30 second rehydration in distilled water. This is followed by a 30-minute incubation in a solution of 2 mL concentrated HCl, 198 mL water, and 2 g potassium ferrocyanide mixed immediately before use. Slides are then washed for 5 minutes in distilled water twice, and tap water once. Slides were then incubated for 5 minutes in neutral red (Sigma Aldrich, St. Louis, MO). Slides rinsed 3 times for 1 minute in tap water. Slides dipped momentarily in 95% ethanol, ensuring that neutral red staining is not lost. This is followed by another quick dip into 100% ethanol. Slides then went through two 5-minute xylene incubations prior to cover-slipping using DPX Mounting Media and VWR Micro Cover Glass (VWR, Radnor, PA). Slides were then imaged at 20x using the Zeiss AxioScan. Images were then transferred to the HALO Image Analysis software in order to detect potential microhemorrhages in the form of positive Prussian blue staining. The blinded experimenter then examined each potential microhemorrhage to determine whether it was an artifact or a true microhemorrhage. Briefly, the staining had to be associated with a vessel, had to be in the same focal plane as the tissue, and could not contain any obvious instances of artifacts. Multiple bleeds associated with a segment of blood vessel were counted as an individual microhemorrhage. Once artifacts had been removed, the number and area of microhemorrhages for each group were analyzed. First, statistical outliers were removed using the Grubbs’ Outlier test. ANOVA and each-way student’s t-tests were then performed between each group using JMP Statistical Software (JMP Pro 13). Group averages and standard error of the mean were then plotted using GraphPad Prism 9.
Immunohistochemistry Staining: Immunohistochemistry for IBA-1 (Wako/Fuji Film cat#019-19741, Richmond Virginia), GFAP (Agilent, DAKO Cat# Z033401, Santa Clara, CA), and albumin (Bethyl, Cat#A90-234A, Montgomery, TX) were performed in the following manner. Tissue was placed into PBS before being washed with a methanol solution (10% methanol, 3% hydrogen peroxide, PBS) for 15 minutes. Following the methanol solution, the tissue was washed 3 times in a PBS and 4% goat serum solution and then placed into a blocking solution (0.2% triton-X, 4% goat serum, 0.0019% L-lysine in PBS) for 30 minutes. The sections were then transferred into a primary antibody solution (4% goat serum, PBS, respective ratio of primary antibody: IBA-1 (1:1,000), GFAP (1:10,000), Albumin (1:10,000)) for one hour at room temperature and then to 4°C overnight. The following day, the sections were placed at room temperature for one hour before washing three times in PBS and 4% goat serum for five minutes each. Sections were then transferred to a secondary antibody solution ((4% goat serum, PBS, respective amount of secondary antibody: IBA-1 – anti-rabbit (1:3,000), GFAP – anti-rabbit (1:5,000), Albumin – anti-goat (1:5,000)) for two hours, followed by another set of washes. Sections were then treated for one hour with an ABC solution (Vectastain Elite ABC Kit, Vector Laboratories, Burlingame, CA) consisting of 1 drop of each reagent A&B to 10 mL of PBS. Following another set of washes, the sections were then transferred into a DAB solution kit (ImmPACT DAB EqV Kit, Vector Laboratories, Burlingame, CA for albumin & DAB Kit w/nickel [SK4100], Vector Laboratories, Burlingame, CA for IBA-1 and GFAP) consisting of a 1:1 ratio of reagents A and B for a respective amount of time (IBA-1 – 26 seconds, GFAP – 30 seconds, Albumin – 19 seconds). Sections were washed another three times and then mounted onto slides and cover-slipped as described above. Slides were imaged on the Zeiss Axio Slide Scanner as described above and the images transferred to the HALO Image Analysis software for further analysis. Two analyses were run for the IBA-1 staining: a binary percent area analysis for positive IBA-1 staining and a microglial activation analysis. The microglial activation analysis suite from HALO Image Analysis uses morphology in order to assess activation status of microglia, based on number of processes and their length. Statistical outliers were removed using the Grubbs’ Outlier test. ANOVA and each-way student’s t-tests were then performed between each group using JMP Statistical Software (JMP Pro 13). Group averages and standard error of the mean were then plotted using GraphPad Prism 9.
tHcy and methylation metabolite mass spectrometry
Plasma and brain tissue levels of soluble and lipoprotein bound homocysteine, or total homocysteine (tHcy), was determined by liquid chromatography electrospray positive ionization tandem mass spectrometry (LC-ESI-MS/MS) as previously described. 24 Brain tissue was processed using a modified technique to extract protein-bound Hcy. The tissue was homogenized in 4 vol of 5 mM DTT and 10 µM 2H4-Hcy and incubated on ice for 20 min. The homogenized samples were centrifuged at 14,000 rpm at 4 °C for 10 min. Aqueous supernatant was transferred to a 10,000 MW cutoff filter unit and centrifuged at 14,000 rpm at 4 °C for 25 min. The filtered extract was directly injected in the LC-MS/MS system.
Plasma and tissue methylation metabolites (SAM, SAH, methionine, cystathionine, choline and betaine) were determined by LC-ESI-MS/MS25,26 as previously described. For plasma, 20 µL was added to 180 µl of isotope internal standards and loaded into a microtiter plate before being centrifuged for 60 min prior to analysis. For methylation metabolites in brain tissue, samples were deproteinized with 4 volumes of 0.1 M perchloric acid. After centrifugation, brain extracts were diluted 1:10 with the LC mobile phase containing 5–25 µM labeled-isotope internal standards. Two levels of quality control samples were used to monitor precision of the method. In all cases the coefficient of variation was less than 10% for all metabolites.
Normality tests
Normality of each data set was assessed via visual inspection and application of the Shapiro-Wilks test for normality using JMP. Non-parametric data sets were analyzed using Wilcoxon tests, as opposed to t-tests for parametric data sets. Appropriate adjustments to figures containing non-parametric data is reported in each figure legend.
Results
ApoE Genotype Modulates tHcy Levels and Accompanying 1-C Metabolites:
Plasma metabolites
Clinical hyperhomocysteinemia, in humans and mice, is defined as any concentration of Hcy higher than 15 µmol/L, with ranges from 15 to 100 µmol/L. 27 The 1-C metabolic pathway which homocysteine is a part of is illustrated in Figure 1(a). Administration of the HHcy diet led to significantly higher levels of plasma tHcy in the ε3 mice compared to ε3 Control and was even significantly higher compared to the ε4 HHcy group. The ε4 HHcy group had elevated plasma tHcy compared to ε4 Control (Figure 1(b)). Both HHcy groups were hyperhomocysteinemic according to the referenced criteria above. Methylation metabolites involved in the Hcy cycle were also measured. Cystathionine was significantly elevated in ε3 HHcy group relative to ε3 control and the ε4 HHcy group (Figure 1(c)). Betaine was also significantly different between all groups, with controls having higher levels than groups on the HHcy diet (Figure 1(d)). Plasma S-adenosyl methionine (SAM) was significantly lower in the ε4 Control group relative to the ε4 HHcy group, while the ε3 HHcy and control groups showed no significant difference to one another (Figure 1e). Methionine (Supp. Figure 2a), choline (Supp. Figure 2 b), and S-adenosylhomocysteine (SAH) (Figure 1(f)) were not significantly different at the group level. SAM is a global methyl donor, while SAH acts as an inhibitor of SAM methyl donation. Therefore, the ratio of the two metabolites provides insight into methylation capacity via SAM. The ratio of SAM to SAH was not significantly different between groups (Figure 1(g)). We observed sex differences in terms of these measures as well and these are illustrated in Supplemental Figure 3.
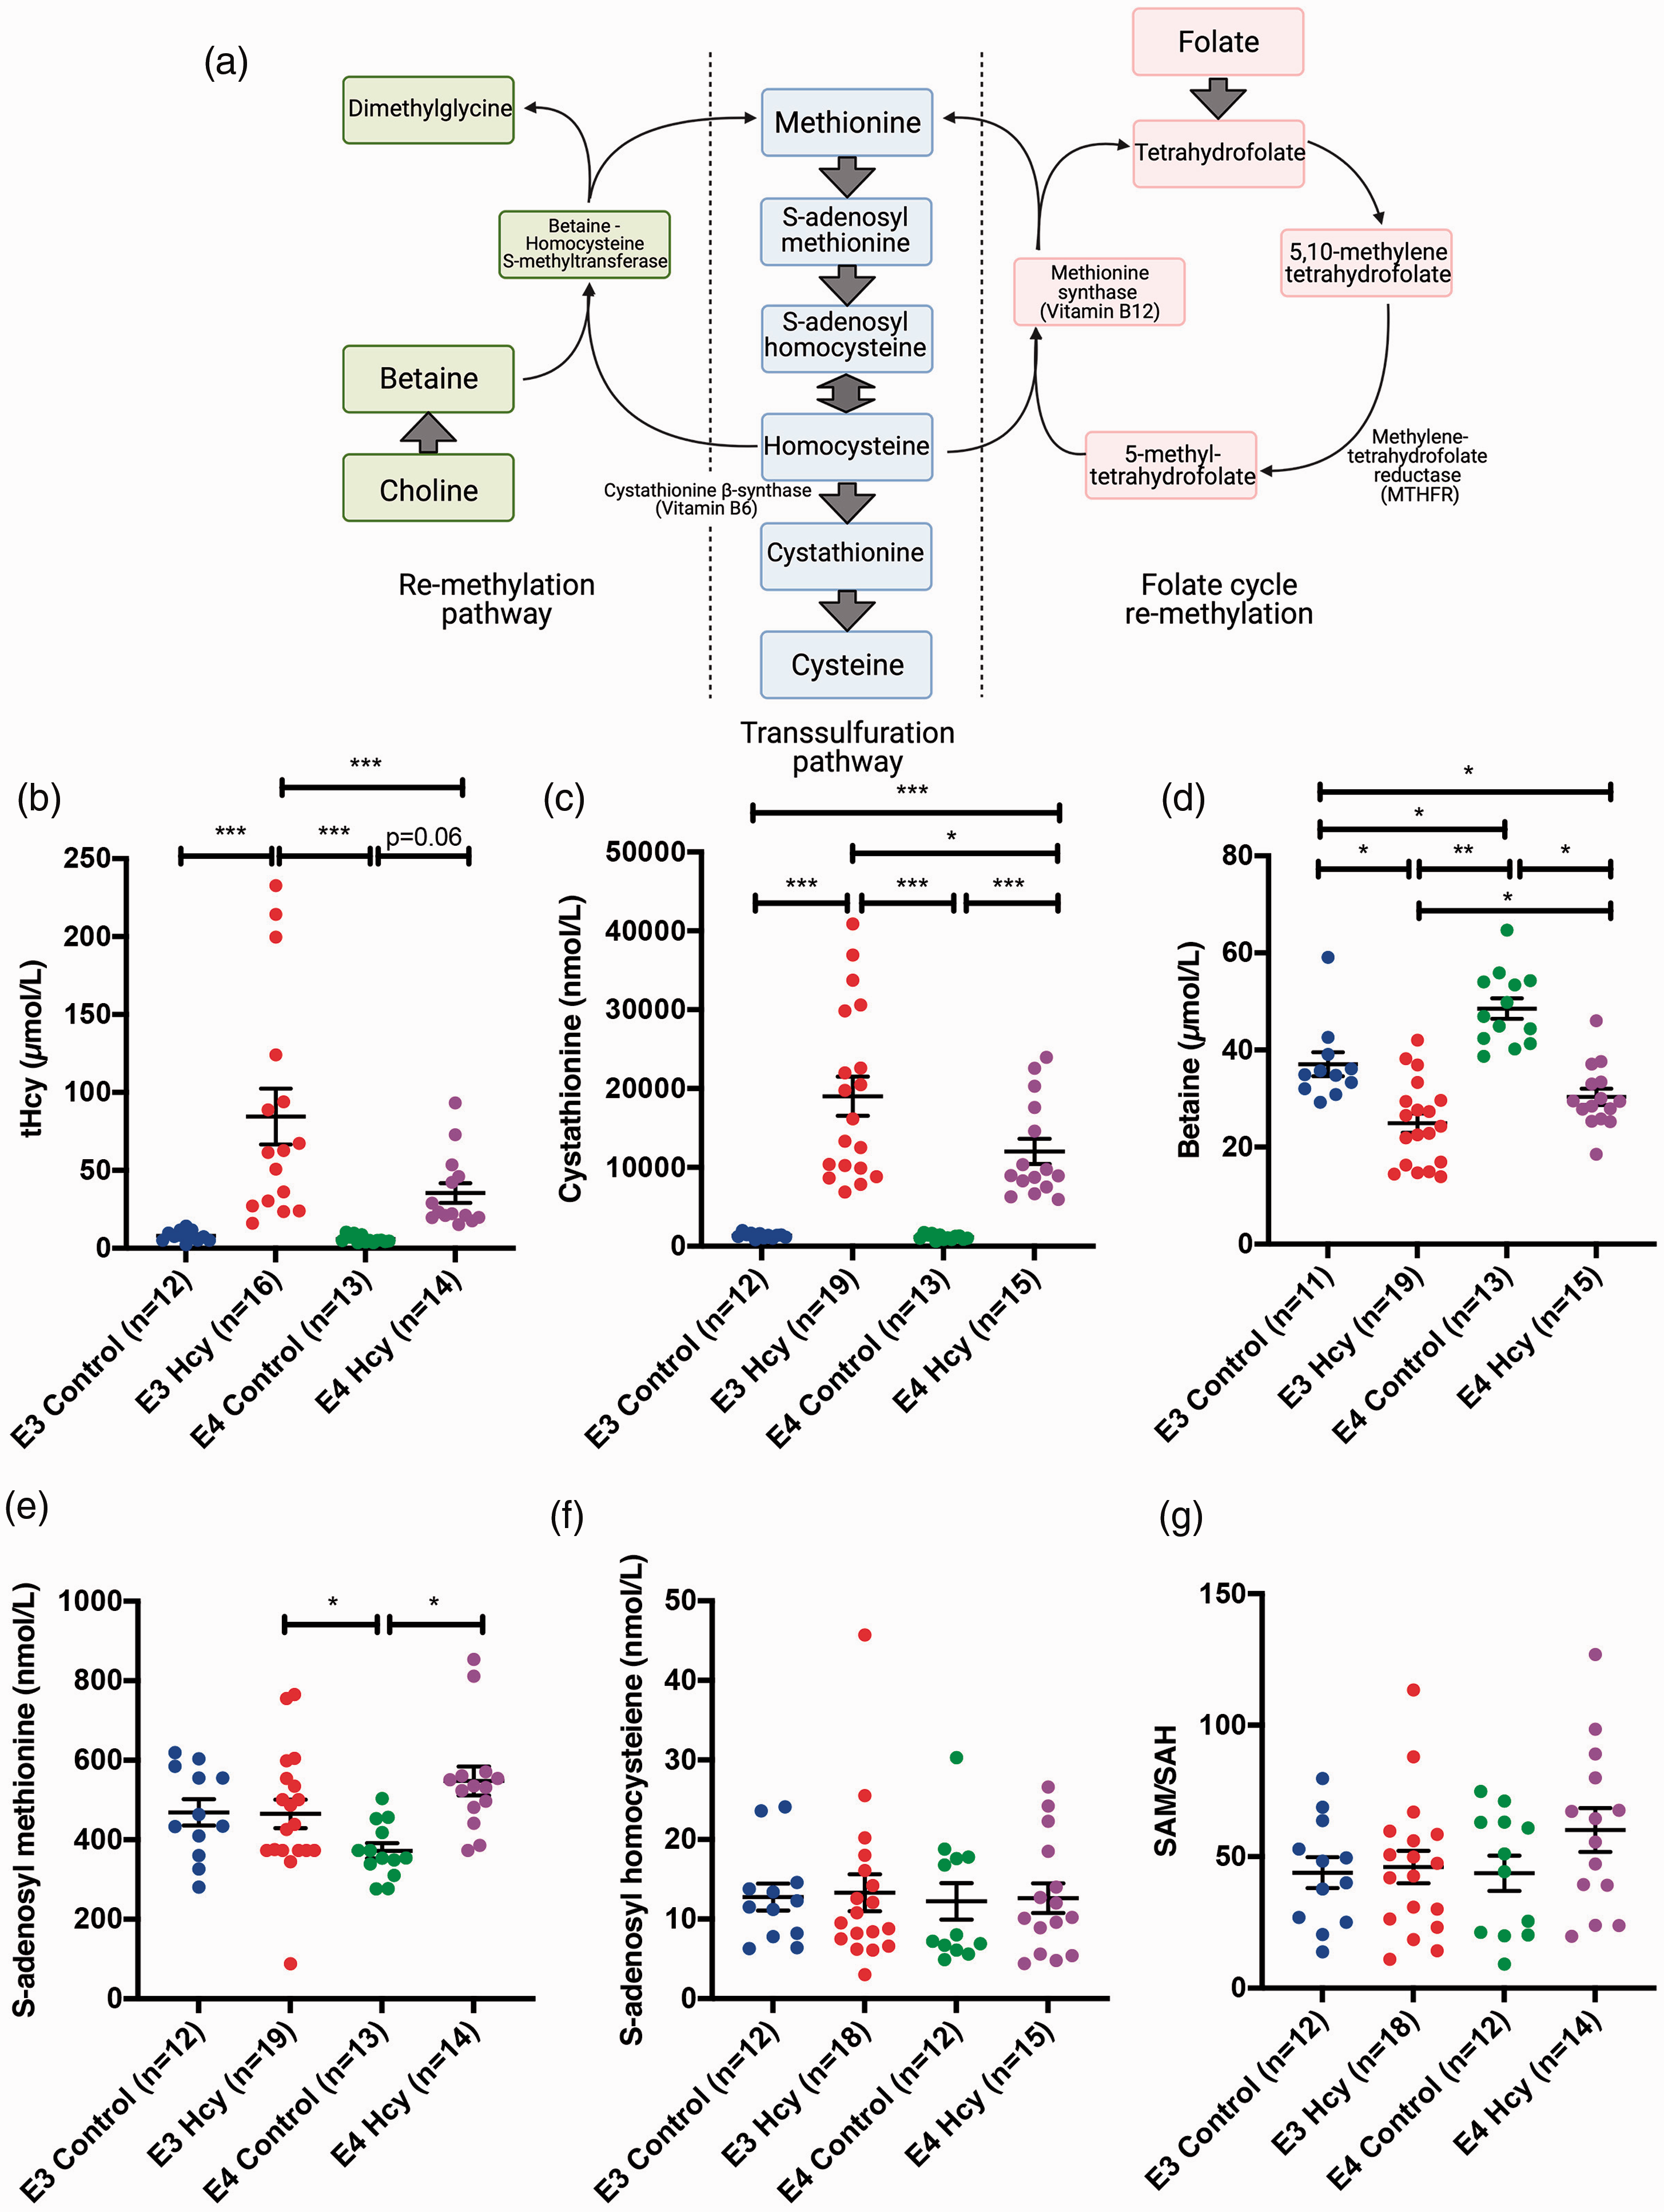
Induction of hyperhomocystienemia is limited in ApoE4/4 mice. (a) Pathway illustrating relevant homocysteine metabolic pathways. Group-wise comparisons independent of sex were performed for plasma levels of (b) total homocysteine (tHcy), (c) cystathionine, (d) betaine, (e) S-adenosyl methionine, and (f) S-adenosyl homocysteine. (g) S-adenosyl methionine to S-adenosyl homocysteine ratios were calculated for each subject as a measure of methylation capacity. Data are presented as the median and interquartile range, overlaid with individual data points. All comparisons by each-way Wilcoxon test. Comparisons denoted with *, **, and *** have p-values <0.05, 0.01, and 0.005, respectively.
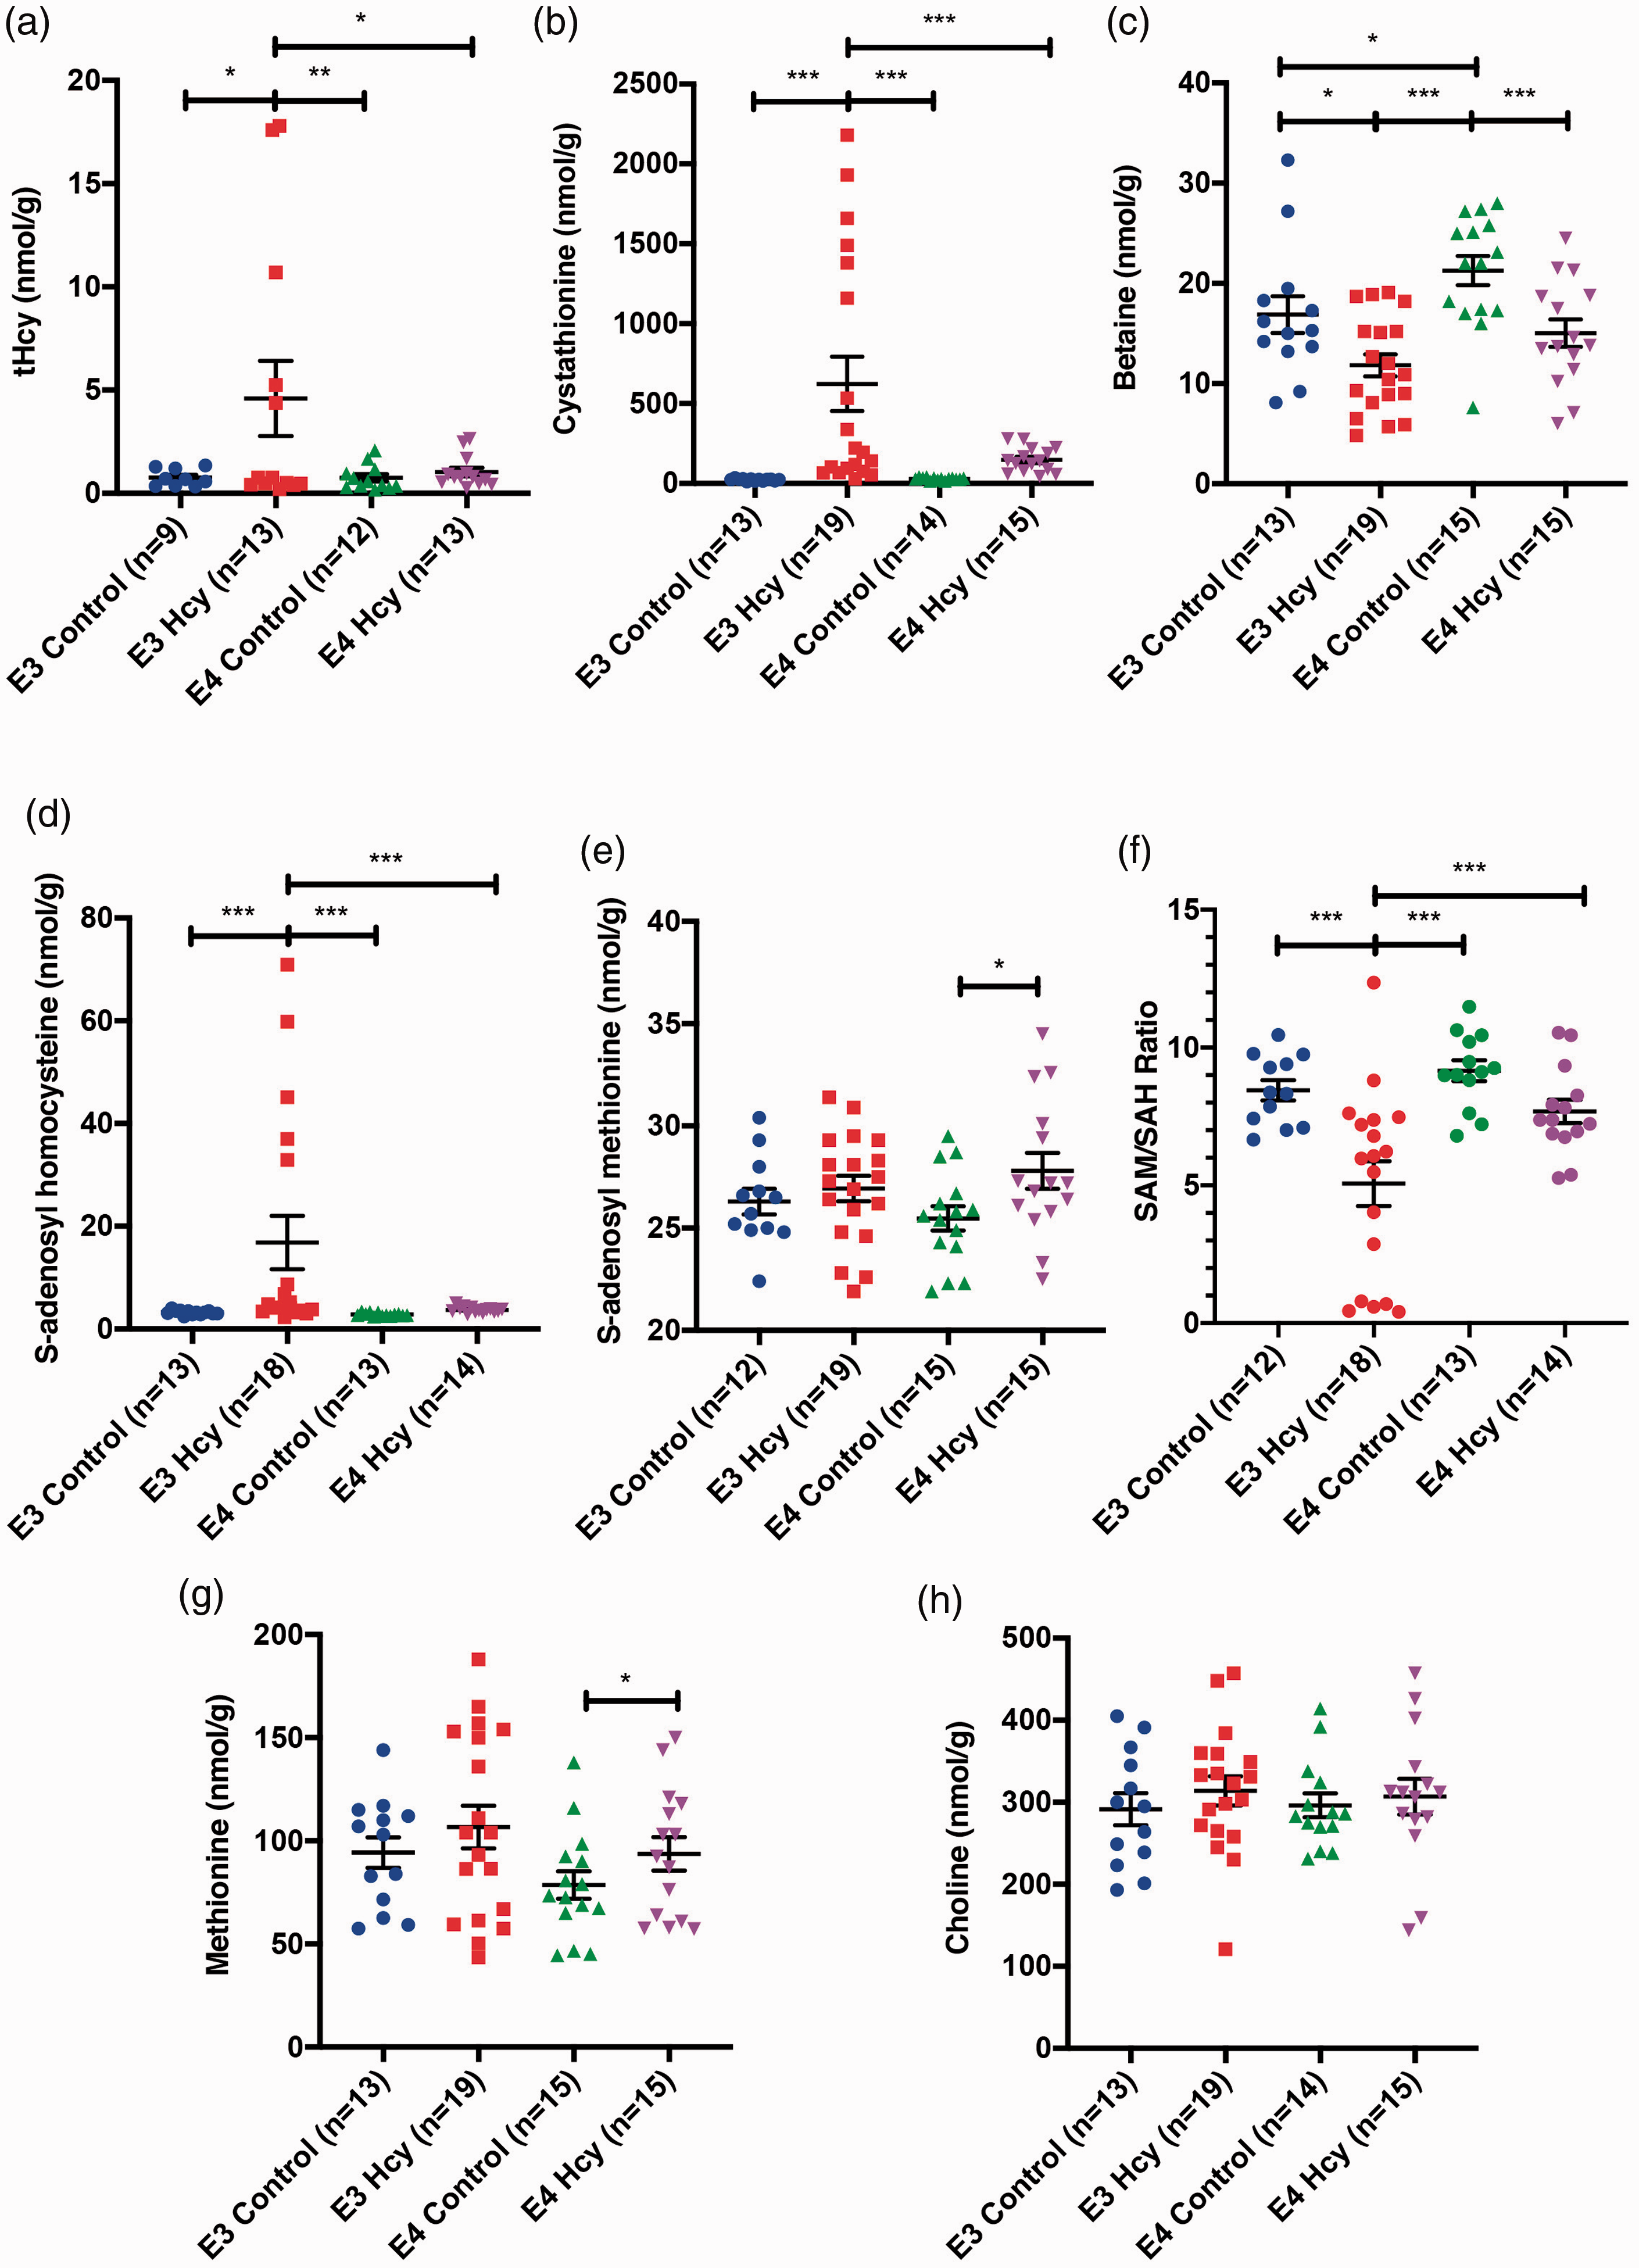
Accumulation of homocysteine in the parenchyma of the brain is impaired by the presence of ApoE4. Group-wise comparisons independent of sex were performed for midbrain tissue levels of (a) total homocysteine (tHcy), (b) cystathionine, (c) betaine, (d) S-adenosyl homocysteine, and (e) S-adenosyl methionine. (f) S-adenosyl methionine to S-adenosyl homocysteine ratios were calculated for each subject as a measure of methylation capacity. Tissue levels of (g) methionine and (h) choline were also measured. Data are presented as the median and interquartile range, overlaid with individual data points. All comparisons by each-way Wilcoxon test. Comparisons denoted with *, **, and *** have p-values <0.05, 0.01, and 0.005, respectively.
Tissue metabolites
Midbrain tissue was also analyzed for levels of tHcy and related methylation metabolites. This area was the only region consistently with enough tissue for mass spectrometry experiments. We observed no difference in the level of tHcy between groups (Figure 2(a)). Cystathionine levels were significantly elevated in the ε3 HHcy group over all other groups (Figure 2(b)). Differences were also observed in betaine (Figure 2(c)). SAH (Figure 2(d)) and SAM (Figure 2(e)) levels were also markedly different, with SAH elevated in E3 HHcy mice and SAM levels increased E4 HHcy mice over E4 control mice. Importantly, there was a significant reduction of the SAM/SAH ratio in the ε3 HHcy group relative to all other groups, suggesting a limited methylation capacity (Figure 2(f)). Methionine levels were elevated in the E4 HHcy group over E4 controls (Figure 2(g)). No differences were observed in terms of choline levels (Figure 2(h)). Sex differences were observed amongst these metabolites as well and are summarized in Supplemental Figure 4.
ε3 mice showed higher incidence of cortical vascular pathology
Prussian blue staining indicated an increase in cortical microhemorrhages in the ε3 HHcy groups relative to each of the control groups. The ε4 HHcy group showed no difference compared to ε4 control group (Figure 3(a)). No significant differences, at the group level, were observed in the number of hippocampal bleeds (Figure 3(b)). Microhemorrhage area in the cortex was nearly significant in E3 HHcy over controls (Figure 3(c)). Meanwhile, E4 control mice had a greater microhemorrhage area than either E3 group (Figure 3(d)). Sex differences were observed in terms of hippocampal bleeds in the E3 HHcy and E4 Control groups, though no sex differeces were observed in terms of cortical pathology (Supp. Fig. 5).
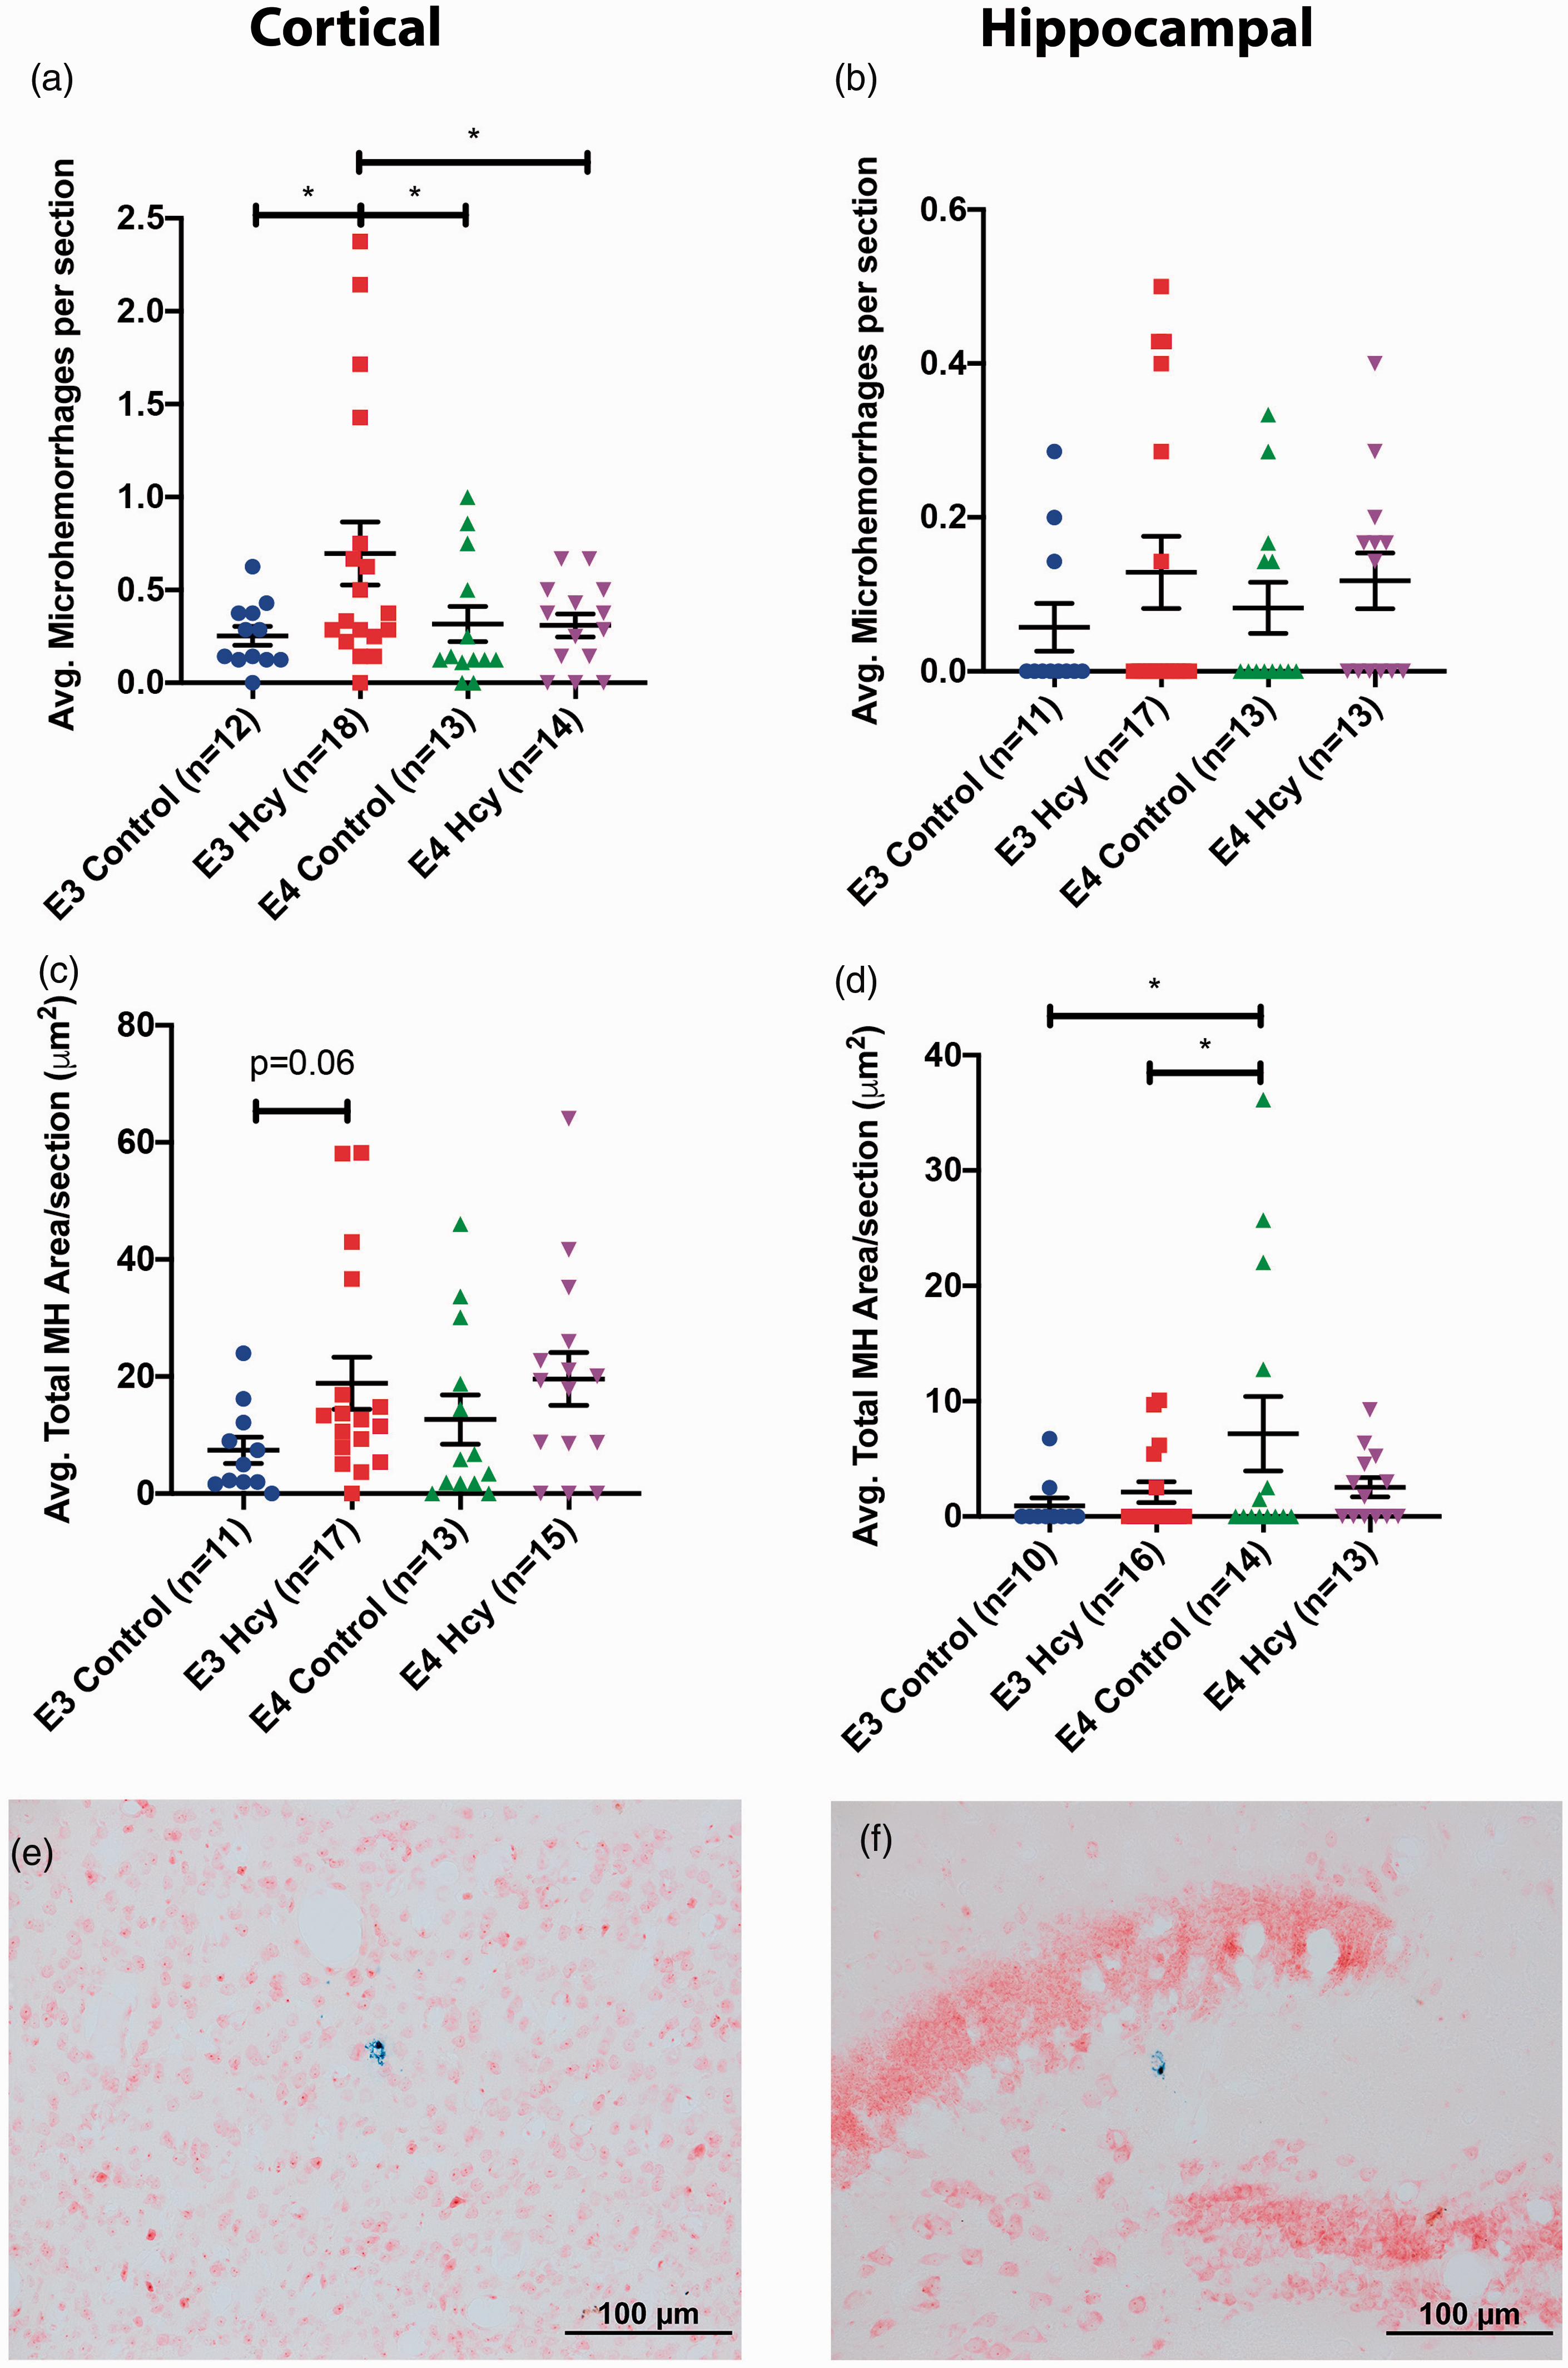
ApoE4 mice given homocysteine diet develop fewer cortical microhemorrhages than ApoE3 mice under the same treatment. Average microhemorrhages per section for (a) cortical and (b) hippocampal were calculated for each group. Additionally, the average area of staining for each section in the (c) cortical and (d) hippocampal regions was calculated and then compiled for each group. Data are presented as the median and interquartile range, overlaid with individual data points. All comparisons by each-way Wilcoxon test. Comparisons denoted with *, **, and *** have p-values <0.05, 0.01, and 0.005, respectively. Representative image of a (e)cortical and (f) hippocampal microhemorrhages are shown at 20x magnification. Microhemorrhage is shown as blue staining on neutral red counterstaining.
ε4 mice exhibited atypical MMP & TIMP modulation in response to HHcy induction
TIMP2 expression in ε4 controls was significantly higher than ε3 controls (Figure 4(a)). MMP2 was elevated in both the ε3 HHcy and ε4 control groups over ε3 control (Figure 4(b)). Expression of MMP9, which our lab has previously shown to contribute to the development of vascular pathology, was elevated in the ε4 HHcy group, relative to the ε3 control group. The ε3 HHcy and ε4 control groups were not significantly different (Figure 4(c)). Expression of MMP3 was not significantly different between groups (Figure 4(d)). Expression of TIMP1 was not significantly different between groups (Figure 4(e)). MMP14 was elevated in ε3 HHcy over control, with no differences between ε4 groups (Figure 4(f)). The relationships between each of the MMPs and TIMPs are illustrated in Figure 4(g). Sex differences in terms of TIMP and MMP expression is summarized in Supplemental Figure 6.
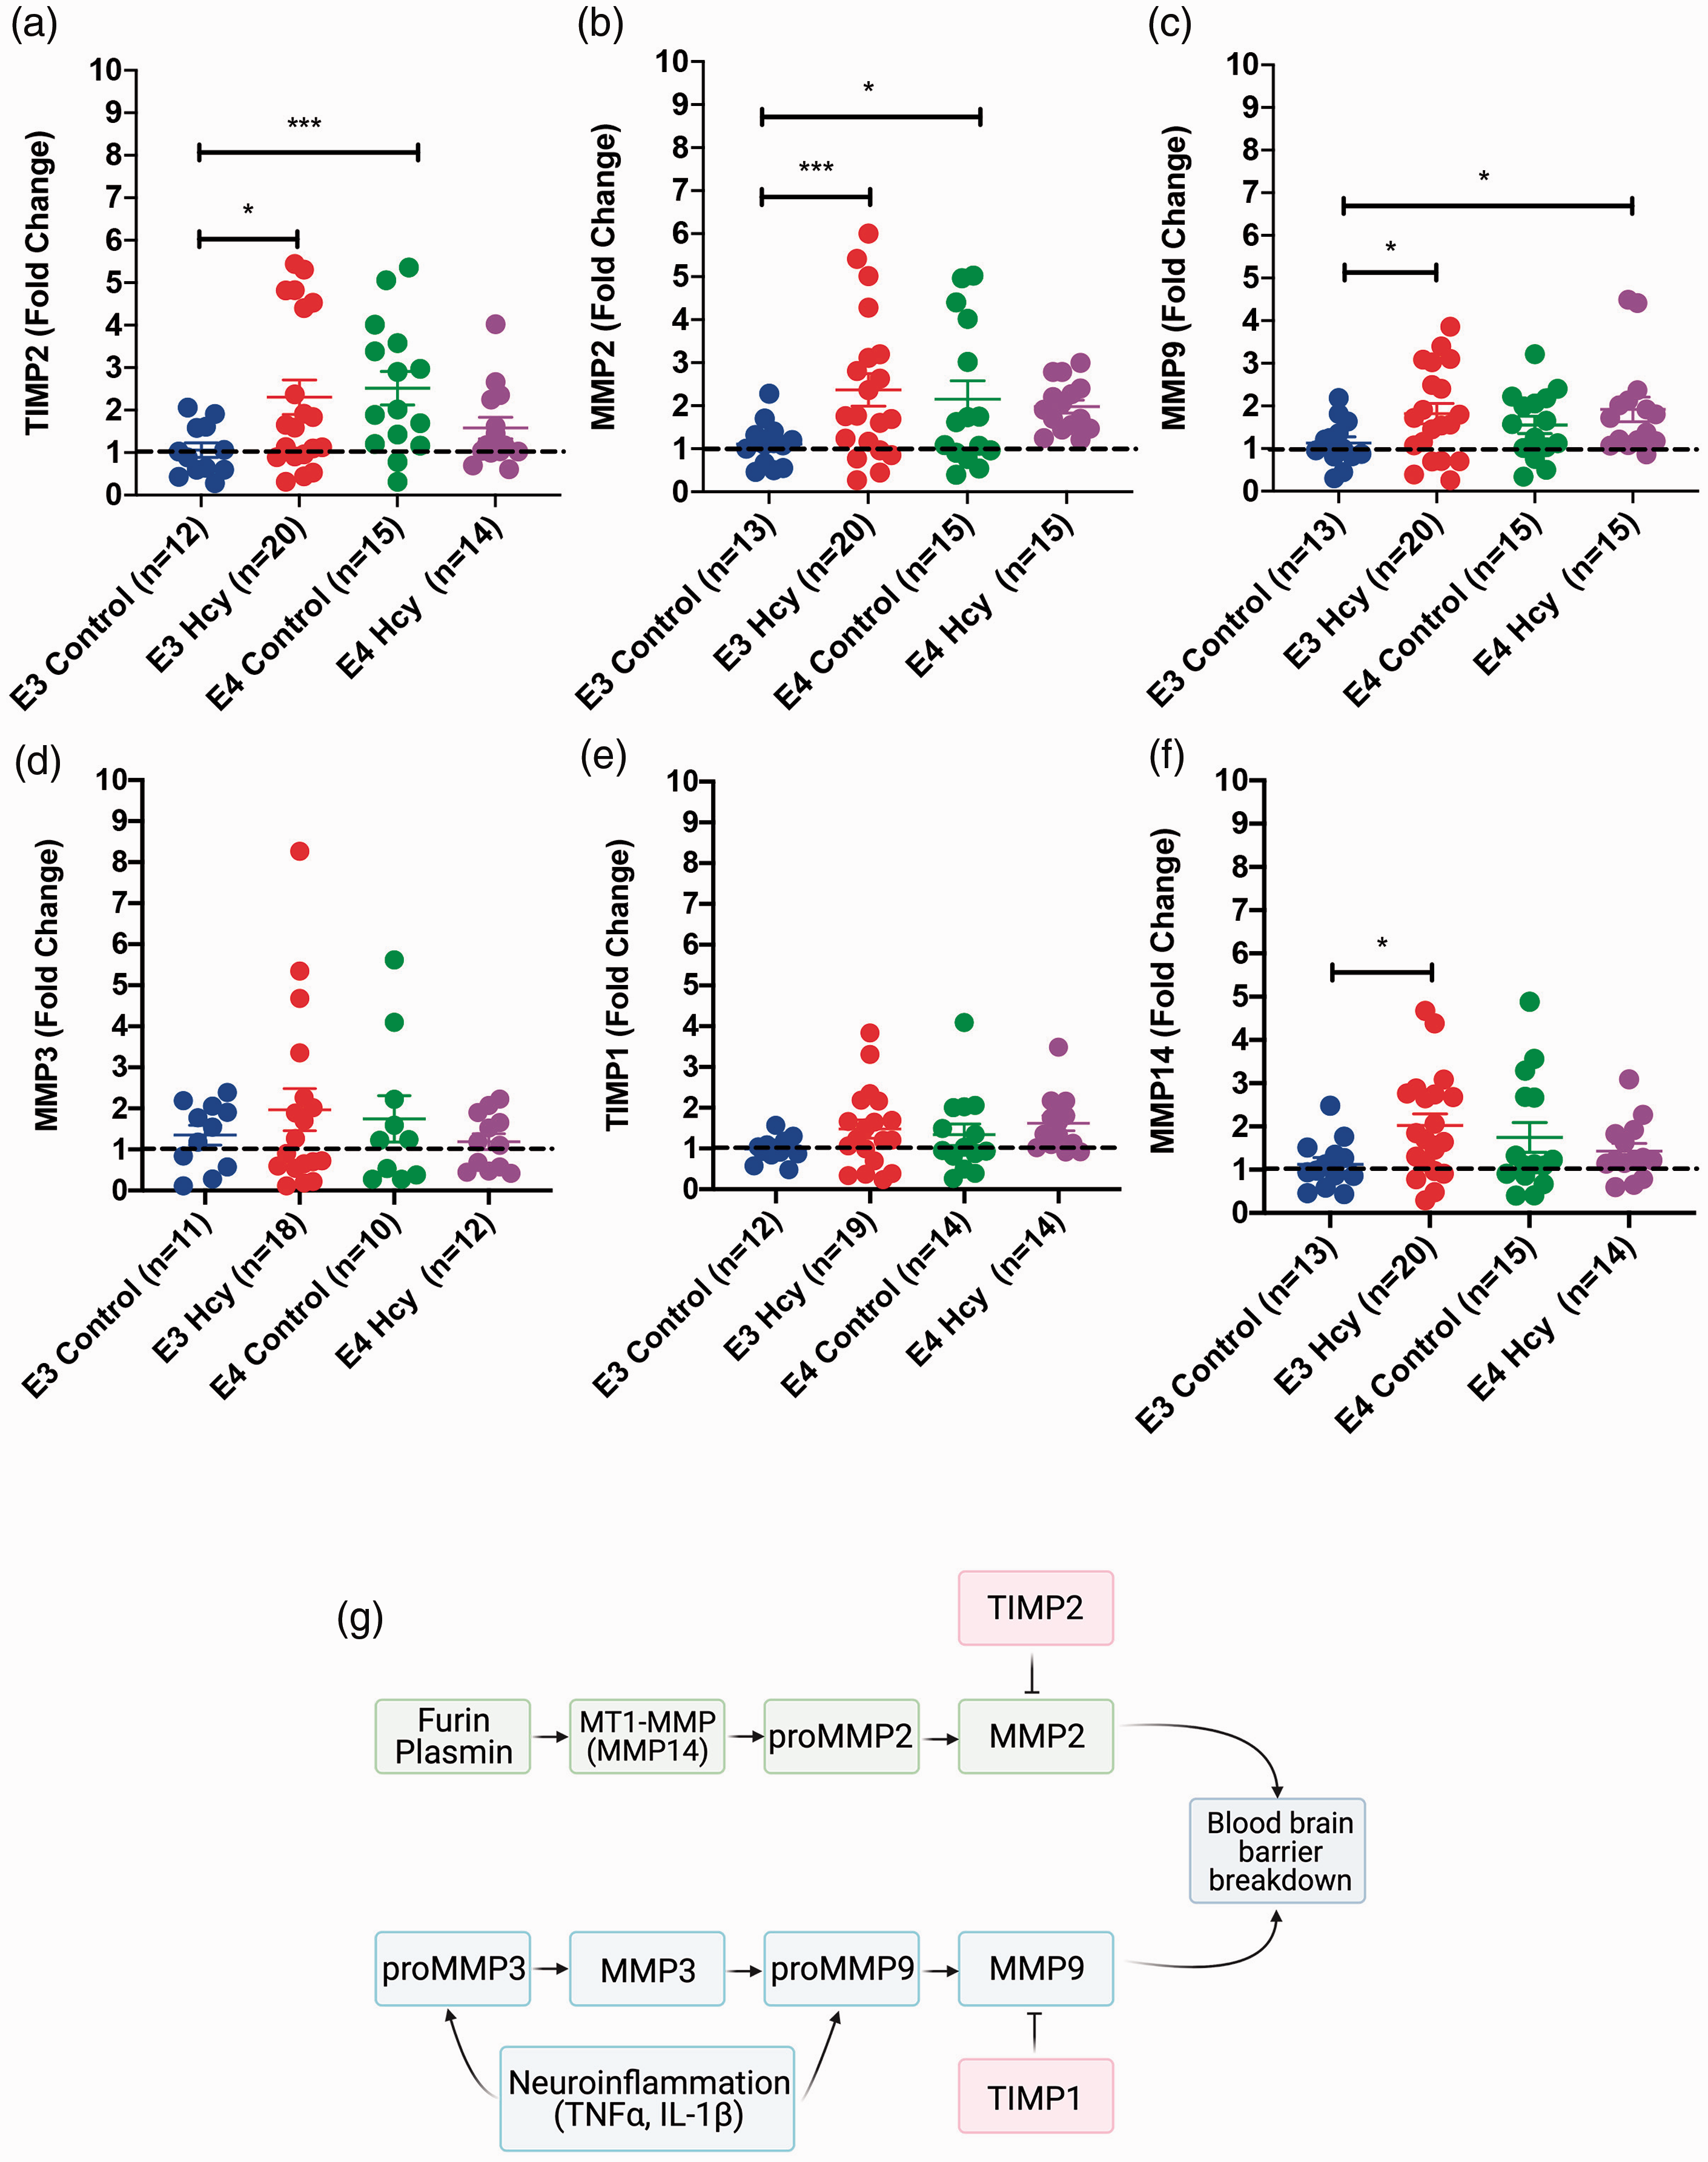
Expression of MMPs 2, 9, & 14 and TIMP2 is elevated in ApoE3/3 Homocysteine and ApoE4/4 Control mice. RT-qPCR results for each group independent of sex are shown for hippocampal expression of (a) TIMP2, (b) MMP2, (c) MMP9, (d) MMP3, (e) TIMP1, and (f) MMP14. Data are presented as the median fold change relative to the ApoE3 group and interquartile range, overlaid with individual data points. All comparisons by each-way Wilcoxon test. Comparisons denoted with *, **, and *** have p-values <0.05, 0.01, and 0.005, respectively. Dotted line denotes a fold change of 1. (g) Diagram showing relationships between MMPs and TIMPs, and connections to inflammation and blood brain barrier breakdowns.
Microglial activation in the hippocampus was elevated in ε3 HHcy mice compared to ε4
No significant differences were observed in terms of frontal cortical IBA-1 staining area (Figure 5(a)). No differences were observed in IBA-1 staining area in the hippocampus, suggesting there were not a significantly different number of microglia or issues related to proper microglial maturation (Figure 5(b)). The percentage of microglia activated, as determined by morphology, in the frontal cortex was significantly higher in ε3 HHcy over control counterparts (Figure 5(c)). A significant increase in microglial activation in the hippocampus was observed in ε3 HHcy relative to ε4 HHcy, suggesting the microglia of the ε4 mice were less responsive to the diet-induced inflammation (Figure 5(d)).
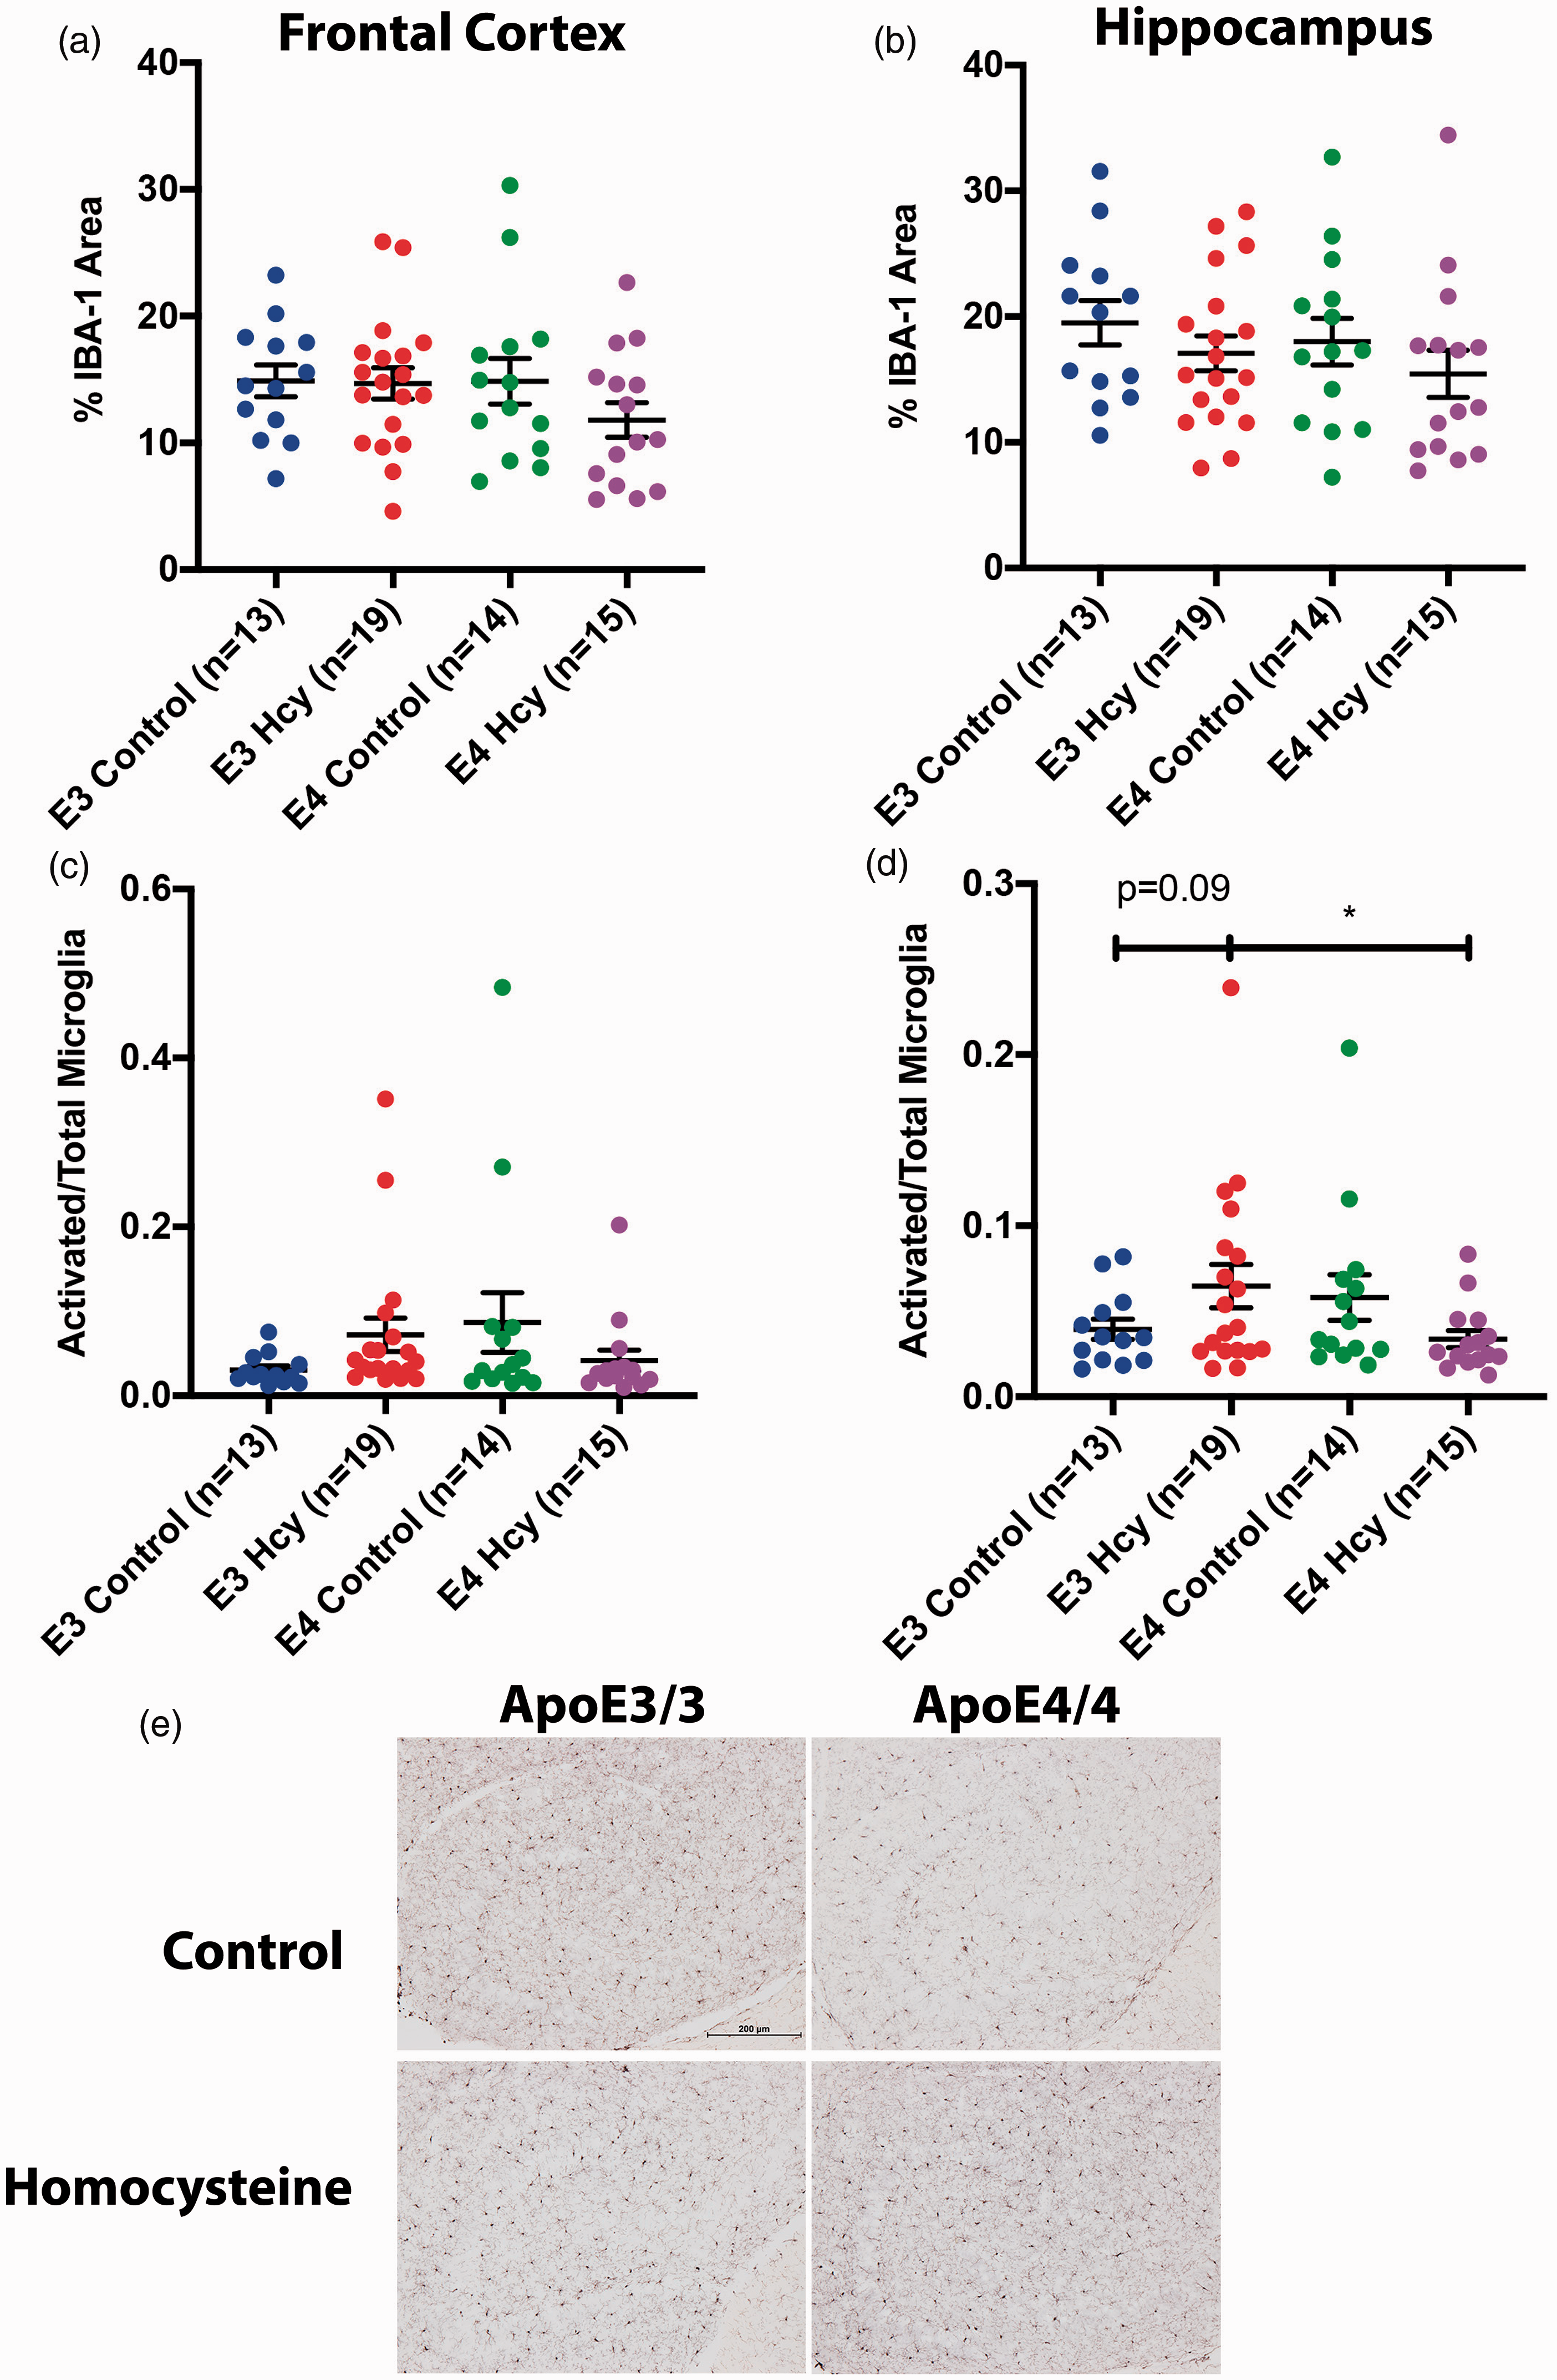
Microglia are more activated in ApoE3/3 homocysteine mice than ApoE4/4 homocysteine mice. Percentage of IBA-1 staining within the (a) frontal cortical and (b) hippocampal regions for each group independent of sex are shown. The ratio of activated microglia to total microglia for the (c) frontal cortical and (d) hippocampal regions for each group is shown as well. Most data are presented as the median and interquartile range, overlaid with individual data points, with all comparisons by each-way Wilcoxon test. IBA-1 Cortical % area data are presented as mean and standard deviation, with comparisons by each way T-test. Comparisons denoted with *, **, and *** have p-values <0.05, 0.01, and 0.005, respectively. (e) Representative IBA-1 staining in the hippocampus of respective animals. Images taken at 10x magnification.
Sex differences observed in terms of IBA-1 staining and microglial activation are summarized in Supplemental Figure 7.
GFAP expression in cortex higher in ε3 HHcy relative to ε3 controls
No group level differences in hippocampal GFAP area were observed (Figure 6(a)). We observed differences in the percentage GFAP staining area in the cortex in the ε3 HHcy mice relative to ε3 controls (Figure 6(b)). No differences were observed between the ε4 groups nor between any of the ε3 vs. ε4 comparisons. This was surprising to us given the low levels of expression we previously observed in the cortices using this diet.3,4,17 This data suggests astrogliosis in response to the diet only in the ε3 animals.
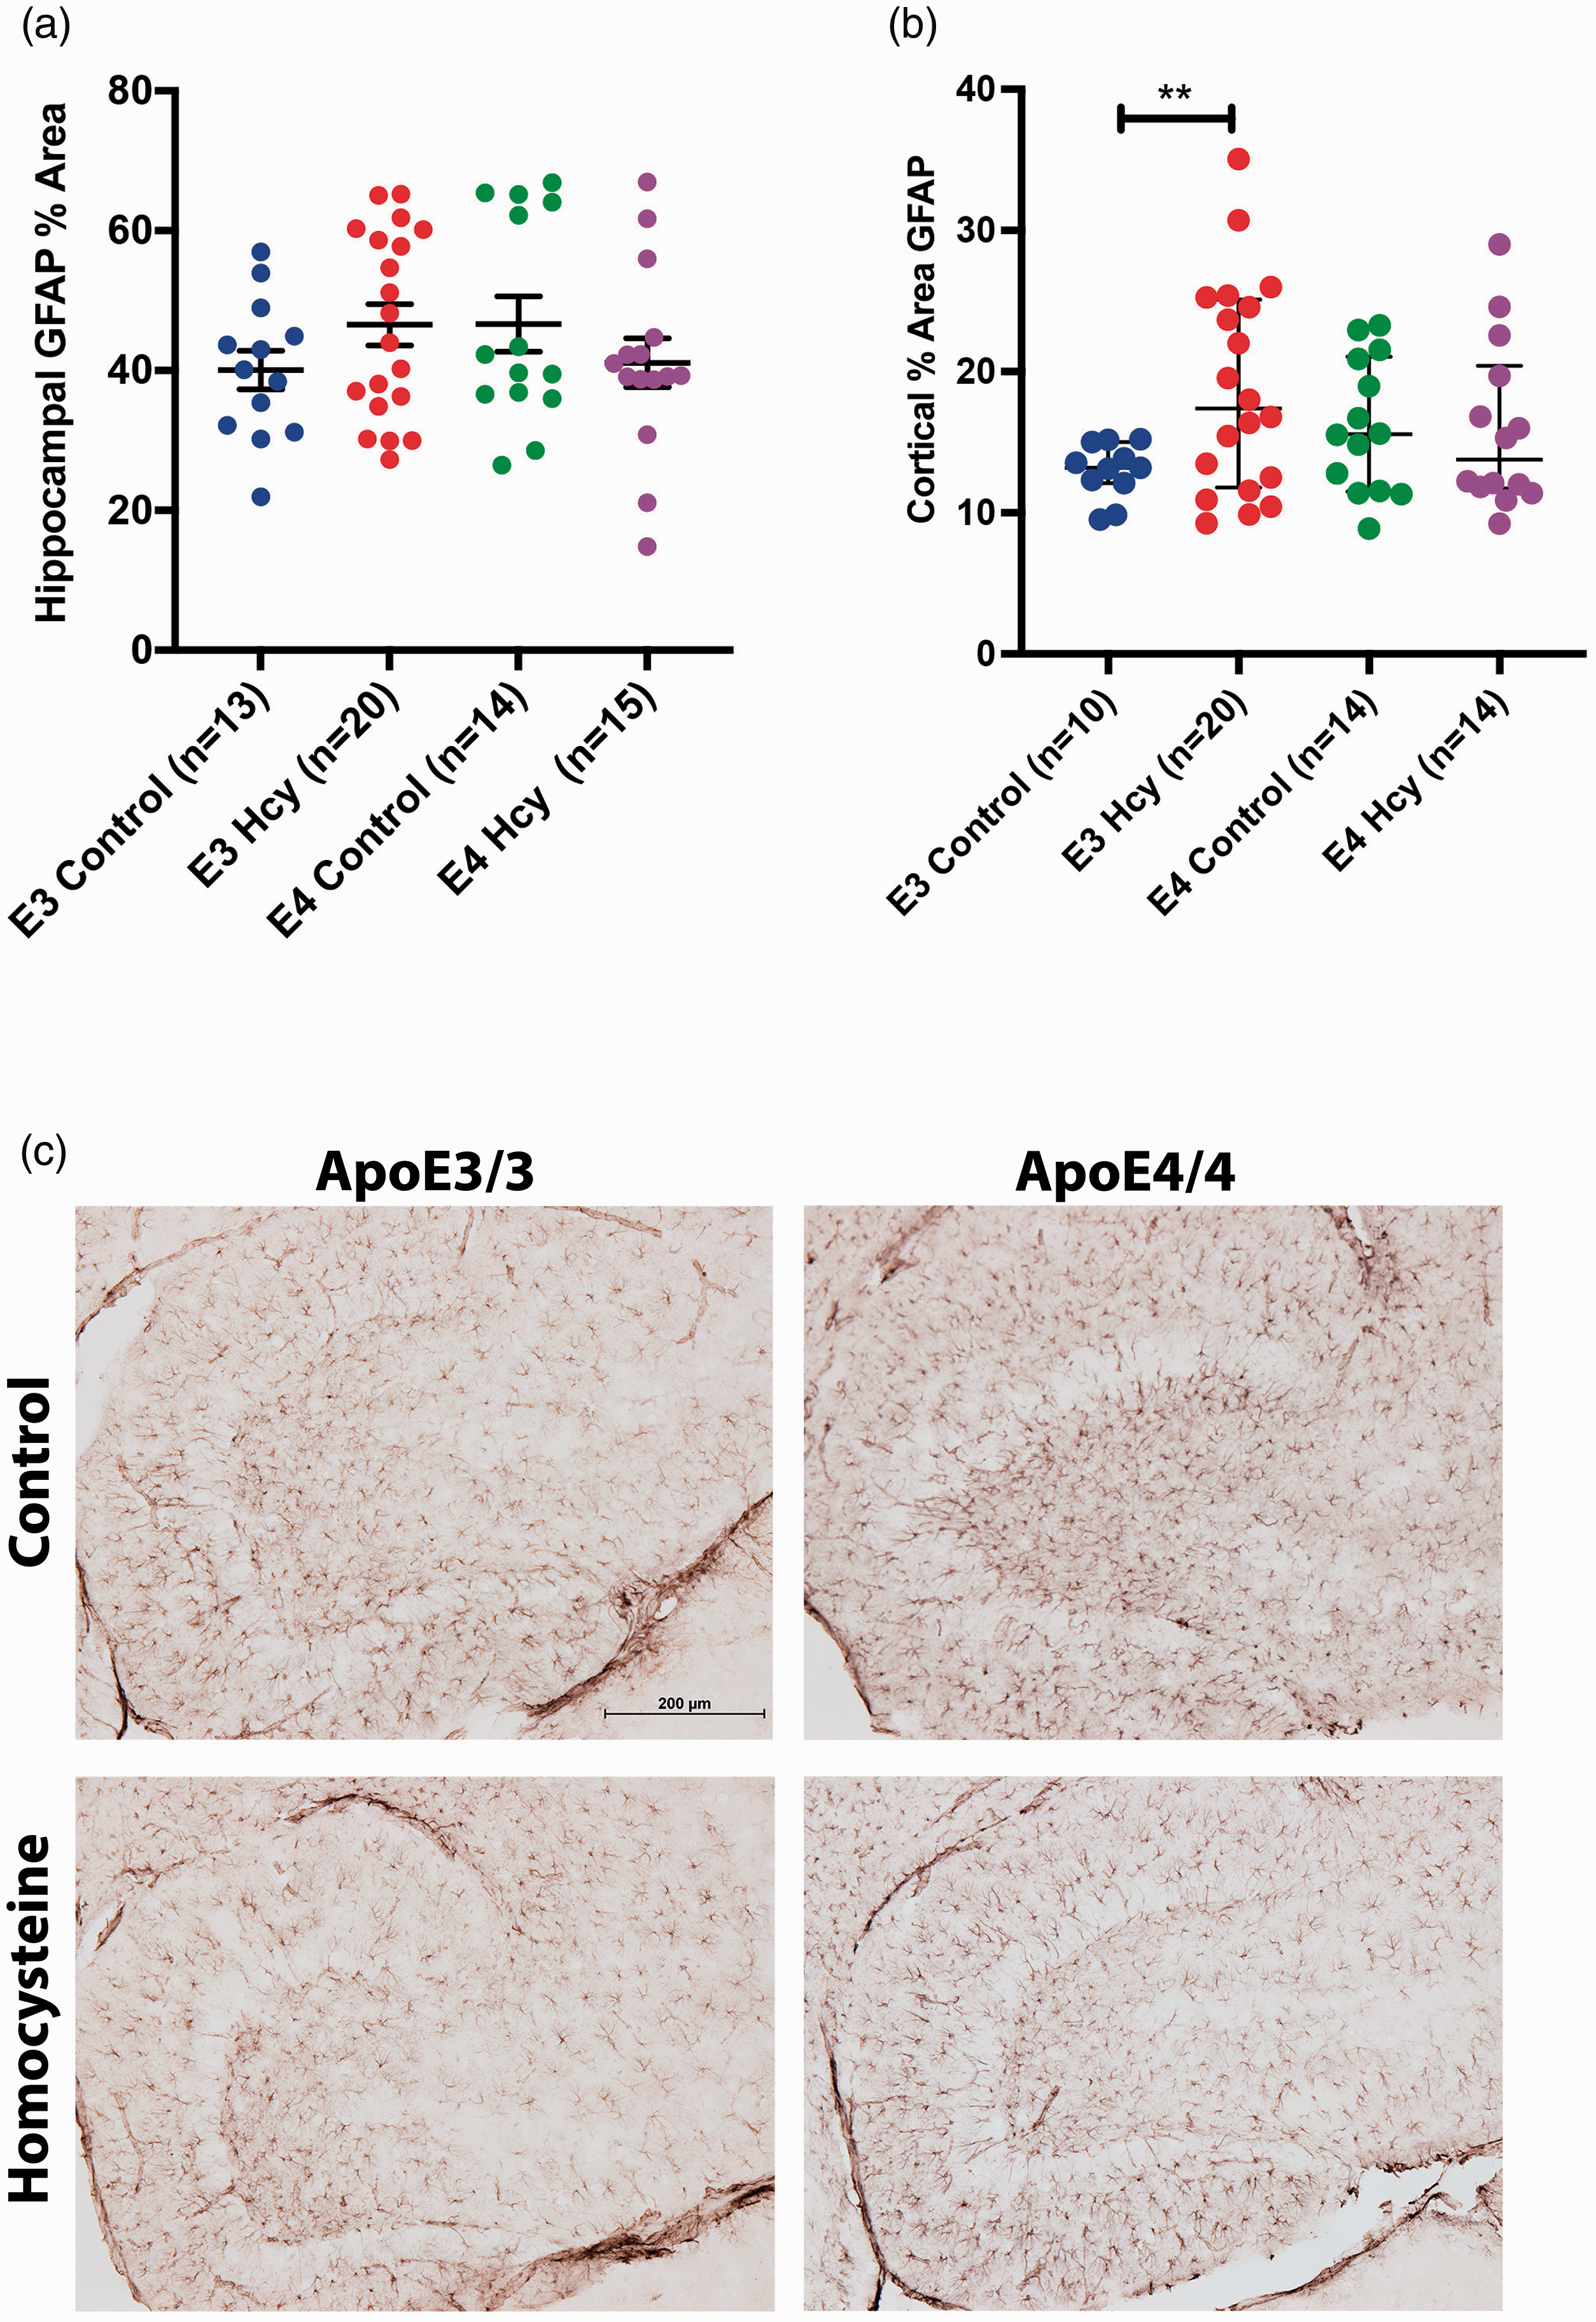
Cortical GFAP expression is elevated in ApoE3/3 Hcy mice. Percentage of GFAP staining within the (a) hippocampus and (b) cortex are shown. Data are presented as the median and interquartile range, overlaid with individual data points. All comparisons by each-way Wilcoxon test. Comparisons denoted with *, **, and *** have p-values <0.05, 0.01, and 0.005, respectively. (c) Representative GFAP staining in the hippocampus of respective animals at 10x magnification.
Serine protease inhibitor Serpina3n highly differentially regulated
Analysis of NanoString Panel results revealed a sparse number of family-wise significant differentially expressed genes after false discovery rate correction. All nominally significant genes (p-value< 0.05) are shown along with their respective effect sizes and q-values (Supplemental Table 3-6). The two genes with a q-value below a cut-off of 0.05 were Rps9 and Serpina3n, both of which were differentially expressed between ε3 Control and ε4 Control groups (Table 3). Rps9 encodes a ribosomal subunit protein. 28 Serpina3n encodes a serine protease inhibitor, also known as alpha 1-antichymotrypsin. 29 Previous literature has shown that Serpin family genes are elevated in ε4 homozygous mice. 30
Key control inflammatory gene expression differences observed in addition to strong sex differences
qPCR results showed CD86 elevation in E4 controls relative to E3 controls, suggesting a basal difference in inflammation (Figure 7(a)). IL1β expression was elevated in ε3 HHcy over control counterparts (Figure 7(b)). TNFα followed the same trend as CD86, with higher levels found in E4 controls over E3 controls (Figure 7(c)).
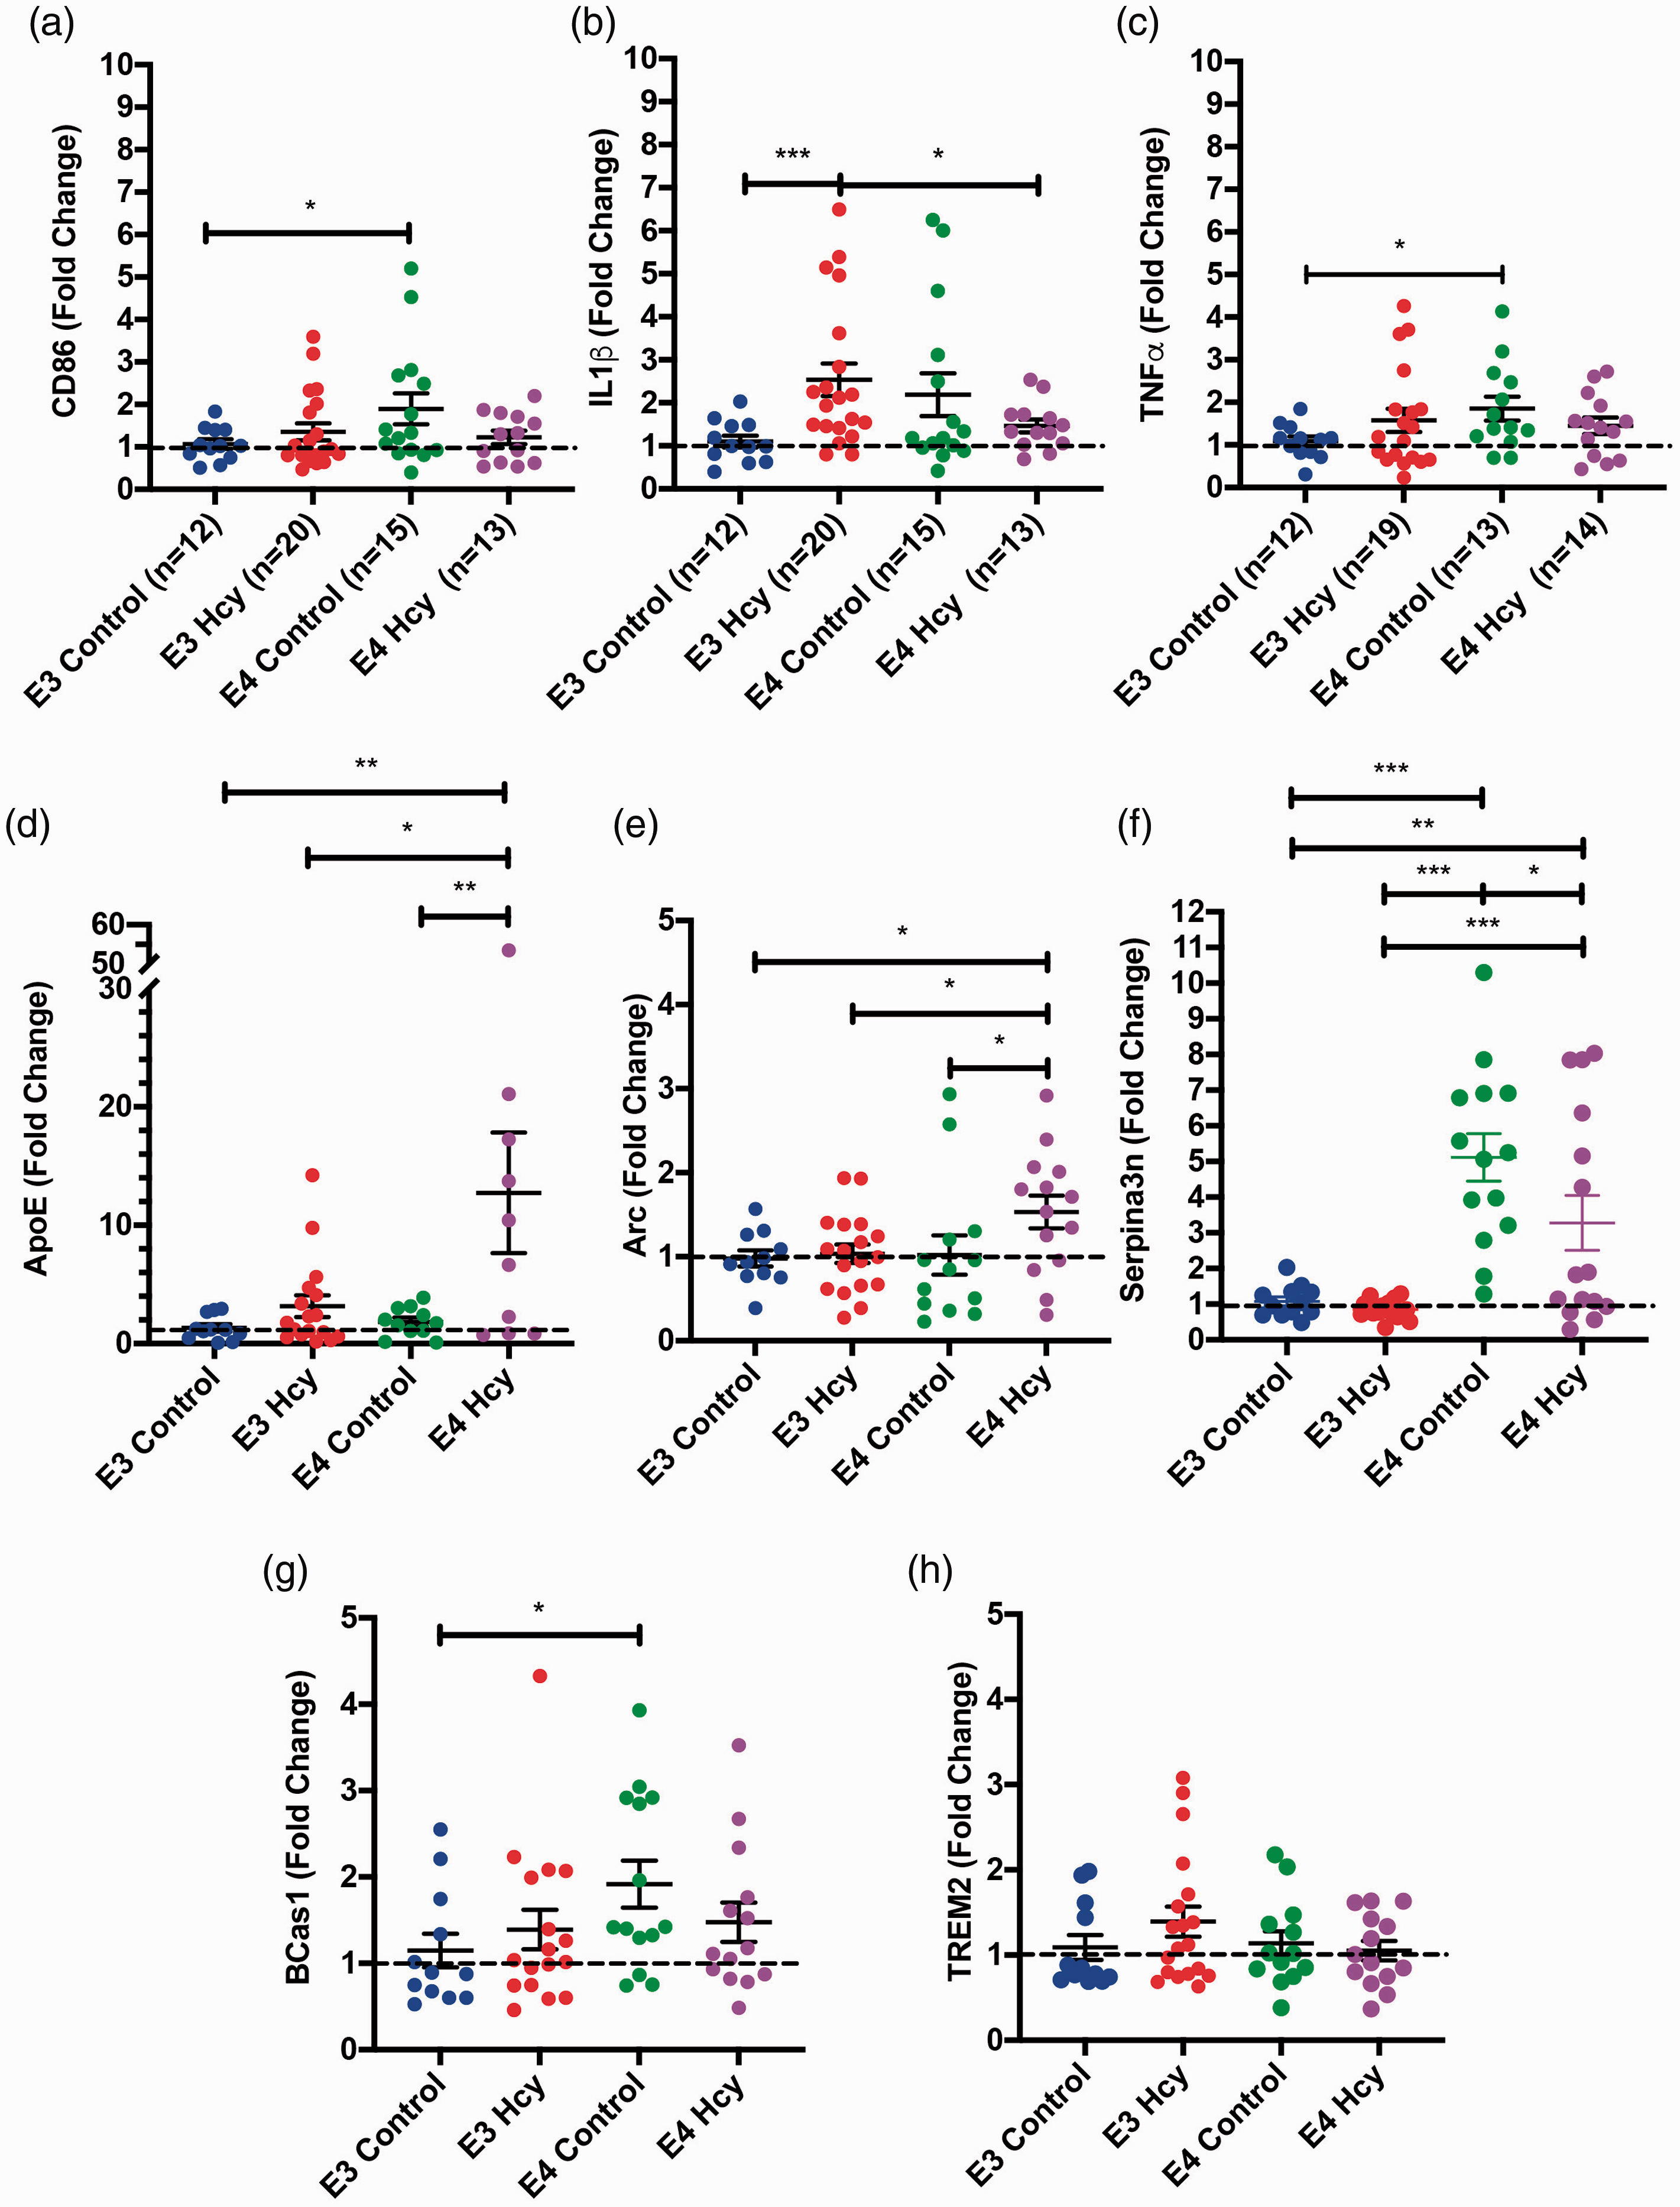
Inflammatory markers are elevated in ApoE3/3 homocysteine and ApoE4/4 control mice while Serpina3n is elevated in a genotype dependent manner. RT-qPCR results for each group independent of sex are shown for hippocampal expression of (a) CD86, (b) IL1β, (c) TNFα, (d) ApoE, (e) Arc, (f) Serpina3n, (g) Bcas1, and (h) TREM2. Data are presented as the median fold change relative to the ApoE3 group and interquartile range, overlaid with individual data points. All comparisons by each-way Wilcoxon test. Comparisons denoted with *, **, and *** have p-values <0.05, 0.01, and 0.005, respectively. Dotted line denotes a fold change of 1.
A number of additional genes were also measured via RT-qPCR, including APOE and TREM2, as well as a number of genes identified in the NanoString analyses. Hippocampal expression of ApoE was significantly higher in the E4 HHcy group compared to all other groups (Figure 7(d)). ARC hippocampal expression was elevated in the ε4 HHcy group over εall other groups as well (Figure 7(e)). SERPINA3N expression was elevated in a genotype dependent manner, with expression in the ε4 groups being significantly higher than ε3 groups, while the E4 controls had significantly higher levels than the E4 HHcy group (Figure 7(f)). BCas1, identified as potential target via NanoString, was significantly elevated in E4 control mice over E3 control mice (Figure 7(g)). No significant differences were observed in the expression of TREM2 (Figure 7(h)). No significant group level differences in expression of IL1RN (Supp. Fig. 8a), Tgfb1 (Supp. Fig. 8 b), NTHL1 (Supp. Fig 8c), FOS (Supp. Fig 8d), or Nthl1 (Supp. Fig. 8e) were detected. Sex differences amongst any of the observed genes are summarized in Supplemental Figure 9.
Discussion
In this study we observed a limitation in the induction of HHcy in the ε4 group. Accompanying this, we also observe less vascular pathology in the ε4 HHcy group. While it is possible that the downstream differences we observed can be explained by a difference in the severity of HHcy, we believe this is at most only partially true, as we observe a number of baseline differences between ε3 and ε4 controls that suggest underlying differences independent of HHcy severity. In particular, the elevation of select TIMPs and MMPs contradicts this idea, as the ε4 controls show comparable levels to ε3 HHcy groups, which would lead one to expect elevated levels of vascular pathology under HHcy conditions, as shown in previous studies.3,4,6 However, we observe the opposite, with the ε4 HHcy group having less pathology and lower levels of MMPs. In addition, we see elevated gliosis in response to HHcy in the ε3 mice, but not in the ε4 mice, continuing a trend of ε4 mice being unresponsive to the stimuli of HHcy. Further, we show that sex is a key variable in the effects of the HHcy diet. In almost every measure, we observe significant sex differences, commonly within the ε3 HHcy group.
It was our anticipation that ApoE ε4 mice would have an exacerbated response to the induction of HHcy, given the robust inflammatory response and cerebrovascular pathology we have previously observed in C57/BL6 mice.3,4,6 Instead, our data suggest that ApoE ε4 is associated with a limited microglial response. There were several unexpected findings when HHcy was induced in ApoE ε4 mice as compared to ApoE ε3 mice. Most notably, the ApoE ε4 mice did not show the same extent of elevated plasma tHcy levels in response to the diet, compared to ApoE ε3 mice or normal C57/BL6 mice.3,6 Also, there was limited cerebrovascular pathology in response to the diet. In contrast, ApoE ε3 mice responded to the HHcy condition in a manner comparable to our previous reported findings in C57/BL6 mice.3,4,6 Interestingly, in the control diet groups, ApoE ε4 controls showed significant differences compared to ε3 controls throughout the study. It has previously been observed that ε4 carriers are more prone to vascular dysfunction and pathology.11,31 In particular, breakdown of the blood brain barrier, increased permeability, and elevated levels of MMP9 have been identified in ApoE ε4 carriers. 11 This is supported by further findings associating cerebral microbleeds specifically with the presence of ApoE ε4. 31 As a result, these outcomes are not wholly unexpected, though we are unsure why the overall number of bleeds was not more significantly different. It is possible that ApoE ε4 Control mice had insufficient compensatory action against the microhemorrhages compared to ApoE ε3 mice. The basal levels of MMP2, TIMP2, and IL1β are all elevated, some significantly, in ε4 controls over ε3 controls, with MMP14 and MMP9 trending toward the same relationship. Coupled with the trends of both cortical and hippocampal microglial activation being elevated in ε4 controls over ε3 controls and enhanced cortical astrogliosis in ε3 HHcy over controls, this suggests a basal environment more prone to developing vascular pathology in ε4 mice.
This finding follows trend seen by Bell et al. (Nature, 2012) and Montagne et al. (Nature, 2020), which each observed ε4 genotype was sufficient to generate localized BBB breakdown as mediated by glial degeneration, specifically pericytes. While we did not examine pericytes here, our baseline differences in terms of inflammation and glial activation support the findings of a basal environment in ε4 carriers that is more prone to BBB breakdown. What is striking, however, is the almost complete reversal of this trend once HHcy is induced. All previous evidence would suggest an accumulation of inflammatory markers and vascular pathology via 1) the innate, observed ε4 differences and 2) the oxidative stress mediated effects of the HHcy diet. Instead, the ε4 mice appear resistant to HHcy induction and subsequent inflammation, by some measures performing more homeostatically under HHcy conditions than under control conditions. It is not clear why this is. ApoE’s many different functions mean it could be exerting influence at almost every different level of the proposed mechanism. From absorption/metabolism of the diet to the processing of different metabolites, to response to oxidative stress, to the neuroinflammation forming in response. Further investigation of what levels are most affected by the ε4 genotype is warranted, especially given efforts in the field to correct ε4 to ε3-like. If ε4 is providing some kind of beneficial effect, it will be important to account for when trying to correct to ε3.
Metabolic differences driven by ApoE isoforms are widespread and well documented.32,33 However, no work that we are aware of has probed the transulfuration pathway or 1-C metabolism related to homocysteine in the context of ApoE isoform differences; though some studies have looked at the incidence of ApoE ε4 and HHcy, with conflicting results.34,35 Ravaglia et al. showed human ε4 carriers had a lower association with elevated plasma tHcy and a higher level of C-reactive protein, a common marker of generalized inflammation used clinically. Nilsson et al. showed the opposite association, with ε4 being linked to higher levels of plasma tHcy, though their study was a smaller scale and had limitations in terms of age-matching of groups that may have biased the results. We show significant differences in a number of metabolites in the transsulfuration pathway, as well as methylation metabolites necessary for the conversion of Hcy back to methionine. Significant differences in plasma tHcy levels show that the diet was effective in inducing HHcy, yet ApoE ε4 mice accumulated less tHcy in the plasma than ε3 mice. Previous studies have shown that both Hcy and ApoE bind VLDL, 34 with ε4 binding most readily amongst the ApoE isoforms.36,37 These studies also showed ApoE genotype dependent changes in VLDL processing and clearance that may in turn alter tHcy levels in the blood. 34 It is possible that the VLDL binding and clearance differences account for the differences in tHcy accumulation, however we did not have sufficient samples to assess this. Betaine has been associated with improved resistance against development of HHcy, 38 due to its role in the conversion of Hcy back into methionine. It is significantly elevated in the ε4 HHcy mice over ε3 HHcy mice, suggesting this may be another potential mechanism by which tHcy accumulation was limited. It is also possible that the ε3 mice utilized more of the betaine in response to greater tHcy levels, leaving their levels lowered. However, the differences between the two genotype control groups suggests some innate difference in the available betaine levels.
Differences between plasma and midbrain tHcy metabolites were also interesting, as they showed a distinct difference in tHcy levels with no significant differences being observed in the tissue compared to plasma, which showed pronounced elevation in HHcy groups. The ratio of SAM to SAH is an indicator of methylation capacity as SAM is a global methyl donor, important in DNA, RNA, and histone methylation,39,40 and SAH is an inhibitor of SAM activity, meaning a lower ratio indicates lower methylation capacity or downregulation of methyltransferase activity. The ε3 HHcy group had a significantly lower SAM/SAH ratio than all other groups. This suggests that methylation may be impaired in the brain tissue of the ε3 HHcy mice compared to their ε4 counterparts.
The lack of B vitamins in the HHcy diet may have caused some changes in growth and metabolism, as shown in Dayal et al.. 41 However, our data clearly shows these changes did not occur the same way in the E3 and E4 groups. As we mentioned above, the age of the females has already been identified as an issue, but moving forward we will consider the development and growth of the mice in regards to the effect the HHcy diet may have on their continued growth.
We observed minor sex differences in terms of tissue metabolite levels, but more pronounced differences in the plasma levels of some metabolites. In addition to a relatively small sample size for the females of each group, it is important to note that previous studies utilizing the HHcy diet in our lab have shown more severe attrition in females than males, both in terms of mortality rate and severe weight loss, which in turn necessitates early euthanasia of the animal, a trend which did continue in this study. This attrition may be causing a survival bias within the data, with only the more resilient females actually making it to the end of the study. We are also cautious to not overstate the sex difference observations given our relatively low sample size. Future studies will be powered sufficiently to address sex differences.
Human studies of ApoE and vascular pathology have shown that ε4 individuals are more prone to developing vascular pathologies.10,11 However, our data shows that the ε3 HHcy mice had significantly more microhemorrhages in the cortex than ε4 HHcy mice. Coupled with our metabolite data, this seems to suggest that ε4 mice may have some level of protection from HHcy induced vascular pathology. While clinically relevant, HHcy is not the most prevalent etiology of VCID in humans, 42 and, thus, may not have been well represented in previous clinical studies of VCID with a variety of etiologies. Most human VCID and small vessel disease is driven by chronic hypertension, 43 rather than persistent oxidative stress, which is the mechanism by which our diet exerts pathology. Nonetheless, evidence of a protective role for ApoE4 against HHcy is potentially a clinically relevant finding for those who suffer from HHcy.
Prussian staining for hemosiderin, a sensitive histological measure of microhemorrhages, also showed a sharp sex difference in terms of microhemorrhages, with males having more cortical and hippocampal bleeds in most groups, though not significantly in all cases. In addition to the metabolic sex differences observed, which may have limited the extent of pathology, the female mice used for this study were young enough to still be estrogen cycling, which has been shown to provide protection from vascular pathology.44,45 This issue may account for differences observed in terms of sex compared to studies looking at vascular disease as well, such as Tai et al. (J Lip Res, 2017). It is important to note that the combination of amyloid pathology and our dietary model has been reported previously and showed synergistic effects in terms of inflammation, as well as a redistribution of amyloid from parenchymal plaques to cerebral amyloid angiopathies of the blood vessels. 23 Given the results observed here, it is unclear how a combination of all four factors (sex, amyloid, ApoE, and HHcy) would present pathologically. This is an area of further research.
We considered the possibility that observed decreases in microglial response in ε4 mice may have decreased in response to hemorrhagic events. This in turn may have led to limited formation of hemosiderin, a by-product of microglial processing of iron-complexes present in red blood cells that leak into the brain parenchyma in the event of a bleed. Since Prussian staining identifies hemosiderin deposits, and microglia or macrophages are required for the conversion of hemoglobin to hemosiderin, it is possible that the decreased microglial response in ε4’s may obfuscate our ability to identify bleeds using Prussian staining. To address this, albumin staining was performed to visualize vessels and identify areas of bleeding or leakage independent of hemosiderin deposition. Quantitative assessment was not possible due to inconsistent perfusion of some animals resulting in entire regions-worth of vessels stained with excessive albumin, hindering standardized quantification of staining. Qualitative assessment of albumin staining showed no significant discrepancies between areas of hemosiderin deposition and vessel leakage, however more quantitative assessment of vascular changes in animals is merited to ensure this is the case. Future studies may utilize a fibrinogen extravasation or a tetramethylindocarbocynaide perchlorate dye that interacts with endothelial cells and can be used to identify both leaks and angiogenic sprouts. 46 This approach focuses on the vessel walls rather than the lack/presence of albumin, which relies on consistent complete perfusion and also provides additional information about potential sites of angiogenesis. Our perfusions also limited us in terms of the amount of blood we were able to collect, limiting the number of targets we could analyze in the plasma of each animal. Modification of our collection techniques will be addressed moving forward when trying to assess multiple plasma targets.
One of the most robust differences observed in the NanoString panel was a serine protease inhibitor, SERPINA3N. Previous research has shown a role for SERPINA3N in neuroprotection,47,48 with polymorphisms being associated independently with Alzheimer’s disease, 49 Parkinson’s disease, 50 and progressive multiple sclerosis. 51 SERPINA3N encodes α1-antichymotrypsin (ACT), acutely inhibits chymotrypsin and cathepsin G, serving as a modulator of inflammation and complement activation. 52 Follow-up qPCR quantification of SERPINA3N levels in the hippocampus verified a genotype dependent upregulation of the gene in ε4 mice. This genotype dependence has been observed previously. 30 Previous research has also shown that this elevation is brain specific, with levels in the blood being decreased in ε4 s and levels in the liver being equivalent. 30 However, we also observed a reduction in expression in ε4 HHcy compared to ε4 controls. It is unclear how HHcy is decreasing SERPINA3N expression in ε4 mice, though it is consistent with the decreased inflammatory signaling observed throughout this study.
Our results suggest that APOE genotype may affect the vulnerability of an individual to developing hyperhomocysteinemia. This has been shown in a previous study with one showing decreased levels of HHcy in the APOE ε4 group. 34 ε4 mice seemed to accumulate lower levels of homocysteine in their plasma, though we did not track food consumption over the course of the study to ensure this was not merely the result of genotype dependent differences in food consumption. In addition, our results suggest a differential role for APOE ε3 and APOE ε4 in the development of vascular pathology in response to an oxidative stress such as that induced by HHcy. There is also a differential basal state of inflammation based on ApoE isoform, as demonstrated by our ε3 and ε4 control differences throughout. Further, sex differences within each genotype effect some forms of pathology and inflammation. Finally, while Serpina3n was expressed in a genotype dependent manner, the presence of HHcy led to a decrease in expression, suggesting a possible abrogation of its ability to modulate cathepsin G mediated inflammation. Coupled with the sex differences, this would suggest that treatment paradigms may need to be adjusted at the clinical level to account for ApoE genotype and sex differences. The muted response of homozygous ε4 mice in our study mirrors results also observed in preliminary human studies performed in our lab. Clinical attempts to manipulate neuroinflammatory responses as a therapeutic approach to neurodegenerative diseases will likely need to take these differences into account both in terms of treatment paradigms, but also when assessing results and efficacy of drugs.
Supplemental Material
sj-pdf-1-jcb-10.1177_0271678X211069006 - Supplemental material for Apolipoprotein E ε4/4 genotype limits response to dietary induction of hyperhomocysteinemia and resulting inflammatory signaling
Supplemental material, sj-pdf-1-jcb-10.1177_0271678X211069006 for Apolipoprotein E ε4/4 genotype limits response to dietary induction of hyperhomocysteinemia and resulting inflammatory signaling by Charles E Seaks, Erica M Weekman, Tiffany L Sudduth, Kevin Xie, Brandi Wasek, David W Fardo, Lance A Johnson, Teodoro Bottiglieri and Donna M Wilcock in Journal of Cerebral Blood Flow & Metabolism
Footnotes
Funding
The author(s) disclosed receipt of the following financial support for the research, authorship, and/or publication of this article: Funding for this study was provided by the National Institute of Neurological Disorders and Stroke [RO1 NS097722 (DMW), 5T32NS077889-09 (CES)], National Institute on Aging [RF1 AG057754 (DMW), R56 AG057191-02 (DWF & KX), R01 AG060056 (LAJ) & R01 AG062550(LAJ)], & National Institute of General Medical Sciences [5T32GM118292-02 (CES).
Acknowledgements
Figures 1(a) and ![]() were generated using Biorender. RNA measurements and NanoString kits were run by the University of Kentucky Genomics Core.
were generated using Biorender. RNA measurements and NanoString kits were run by the University of Kentucky Genomics Core.
Declaration of conflicting interests
The author(s) declared no potential conflicts of interest with respect to the research, authorship, and/or publication of this article.
Authors’ contributions
CES, LJ, & DMW developed the theoretical structure of the study. LJ bred and housed mice until diet administration. CES, EMW, & TLS administered diet, monitored animal health, performed dissections, and collected tissue. CES performed RNA extractions, RT-qPCR experiments, all staining protocols, and analysis for those experiments. TB & BW performed mass spectroscopy experiments. Analysis of NanoString data was performed by KX and DWF. CES drafted the manuscript and generated figures. All authors reviewed the manuscript prior to submission.
References
Supplementary Material
Please find the following supplemental material available below.
For Open Access articles published under a Creative Commons License, all supplemental material carries the same license as the article it is associated with.
For non-Open Access articles published, all supplemental material carries a non-exclusive license, and permission requests for re-use of supplemental material or any part of supplemental material shall be sent directly to the copyright owner as specified in the copyright notice associated with the article.